Article

The Evaluation of Single-Sensor Surface Soil Moisture Anomalies over the Mainland of the People’s Republic of China

1
School of Geography and Remote Sensing, Nanjing University of Information Science and Technology, Nanjing, Jiangsu 210044, China
2
Transmissivity B.V./VanderSat B.V., Space Technology Business Park, Huygenstraat 34, Noordwijk DK 2201, The Netherlands
3
ARC Centre of Excellence for Climate Systems Science & Climate Change Research Centre, University of New South Wales, Sydney 2052, Australia
*
Author to whom correspondence should be addressed.
Remote Sens. 2017, 9(2), 149; https://doi.org/10.3390/rs9020149
Submission received: 12 December 2016 / Revised: 31 January 2017 / Accepted: 9 February 2017 / Published: 13 February 2017

Abstract

:
In recent years, different space agencies have launched satellite missions that carry passive microwave instruments on-board that can measure surface soil moisture. Three currently operational missions are the Soil Moisture and Ocean Salinity (SMOS) mission developed by the European Space Agency (ESA), the Advanced Microwave Scanning Radiometer 2 (AMSR2) developed by the Japan Aerospace Exploration Agency (JAXA), and the Microwave Radiation Imager (MWRI) from China’s National Satellite Meteorological Centre (NSMC). In this study, the quality of surface soil moisture anomalies derived from these passive microwave instruments was sequentially assessed over the mainland of the People’s Republic of China. First, the impact of a recent update in the Land Parameter Retrieval Model (LPRM) was assessed for MWRI observations. Then, the soil moisture measurements retrieved from the X-band observations of MWRI were compared with those of AMSR2, followed by an internal comparison of the multiple frequencies of AMSR2. Finally, SMOS retrievals from two different algorithms were also included in the comparison. For each sequential step, processing and verification chains were specifically designed to isolate the impact of algorithm (version), observation frequency or instrument characteristics. Two verification techniques are used: the statistical Triple Collocation technique is used as the primary verification tool, while the precipitation-based Rvalue technique is used to confirm key results. Our results indicate a consistently better performance throughout the entire study area after the implementation of an update of the LPRM. We also find that passive microwave observations in the AMSR2 C-band frequency (6.9 GHz) have an advantage over the AMSR2 X-band frequency (10.7 GHz) over moderate to densely vegetated regions. This finding is in line with theoretical expectations as emitted soil radiation will become masked under a dense canopy with stricter thresholds for higher passive microwave frequencies. Both AMSR2 and MWRI make X-band observations; a direct comparison between them reveals a consistently higher quality obtained by AMSR2, specifically over semi-arid climate regimes. Unfortunately, Radio Frequency Interference hampers the usefulness of soil moisture products for the SMOS L-band mission, leading to a significantly reduced revisit time over the densely populated eastern part of the country. Nevertheless, our analysis demonstrates that soil moisture products from a number of multi-frequency microwave sensors are credible alternatives for this dedicated L-band mission over the mainland of the People’s Republic of China.

Graphical Abstract

1. Introduction

Surface soil moisture is an important variable in hydrological and climate systems as it controls the interaction between the land surface and atmosphere. Soil moisture impacts the partitioning of incoming energy over the land surface, dividing this energy into soil, sensible and latent heat fluxes. Remotely sensed surface soil moisture products have been available since the early 2000s (e.g., [1,2]) and were used in numerous applications such as global change monitoring [3], surface runoff predictions [4], improved vegetation predictions [5] and studying complex feedback mechanisms and land–atmosphere interactions (e.g., [6,7]). The important role of soil moisture was acknowledged by the Global Climate Observing System [8] in 2010, endorsing soil moisture as one of the 50 Essential Climate Variables (ECVs). In response to the need for a long-term remotely sensed soil moisture record, the European Space Agency (ESA) established the Climate Change Initiative (CCI) for soil moisture (www.esa-soilmoisture-cci.org), which has the goal of merging single-sensor soil moisture datasets into a consistent, multi-decadal soil moisture dataset (ECV-SM; [9]). Nowadays, this ECV-SM has found its way to more than 3000 users and has been readily adopted in a wide range of disciplines. The ECV-SM product is a record based on a component from both active and passive microwave sensors. In this study, our focus is solely on the passive microwave component to isolate and better understand the consequences of different retrieval algorithms and algorithm versions, as well as observation frequencies and instrument characteristics. Enhanced knowledge of such isolated impacts will provide feedback on the further integration of surface soil moisture retrievals from various passive microwave instruments into the existing ECV-SM framework.
Another soil moisture initiative by the ESA is the Soil Moisture Ocean Salinity (SMOS; [10]) mission, which was launched in 2009. SMOS observes the Earth’s surface in the L-band frequency (1.4 GHz), which is theoretically optimal for soil moisture detection, and has an overpass time at 6 am for the ascending orbit, which is the optimal moment in the diurnal cycle due to thermodynamic equilibrium. Higher-frequency bands (6.9 and 10.7 GHz, respectively C- and X-band) have been used in the past and can serve as an alternative source for surface soil moisture information [11]. A sensor that has been widely used for surface soil moisture retrievals from passive microwave observations is the Advanced Microwave Scanning Radiometer for Earth Observing System (AMSR-E; [12]). AMSR-E was mounted on the National Aeronautics Space Administration (NASA) Aqua satellite and continuously observed the Earth’s surface and atmosphere in a wide range of microwave frequencies for almost a decade (May 2002–October 2011). The Advanced Microwave Scanning Radiometer 2 (AMSR2) is the improved successor of AMSR-E and entered operational status in July 2012. Another alternative for soil moisture detection comes from a less known source, the Microwave Radiation Imager (MWRI) on-board the Chinese Fengyun-3B satellite [13,14]. China’s National Satellite Meteorological Centre (NSMC) leads an extensive, operational space program and has polar orbiting satellites in the so-called Fengyun series since 1988. The Fengyun-3B satellite is the second satellite in the third Fengyun series and carries a multi-frequency passive microwave radiometer on-board, the MWRI.
In the last decades, the rapid economic development and population growth in the People’s Republic of China has placed increasing pressure on the natural hydrological system as well as agricultural production. Timely observations of soil moisture are crucial in providing early warnings of drought and flood onset, and monitoring states of crops and pasture. A thorough understanding of the individual qualities of such datasets over the People’s Republic of China is crucial for effective use. Therefore, this study focuses on the comparison of soil moisture products from different passive microwave instruments over the entire mainland. These surface soil moisture products were evaluated over recent years (2012 until 2015) and include retrievals from the MWRI, AMSR2 and SMOS. Data processing and verification chains were specifically designed to isolate the impact of the different retrieval algorithms and their recent versions, observation frequencies and instrumental characteristics.
The paper is ordered as follows: Section 2 describes the main characteristics of the datasets (sensors and retrieval algorithms) followed by a description of the methodology through the proposed sequential evaluation and the verification techniques (Section 3). The results are presented in Section 4 and extensively discussed in Section 5. Finally, the conclusions and outlook for future research are presented (Section 6).

2. Materials and Methods

2.1. Passive Microwave Sensors

The main focus of this study is on soil moisture anomalies from three different passive microwave sensors, MWRI (Section 2.1.1), AMSR2 (Section 2.1.2) and SMOS (Section 2.1.3). The satellite and sensor characteristics relevant for surface soil moisture retrievals are discussed first, followed by a comprehensive overview presented in Table 1.

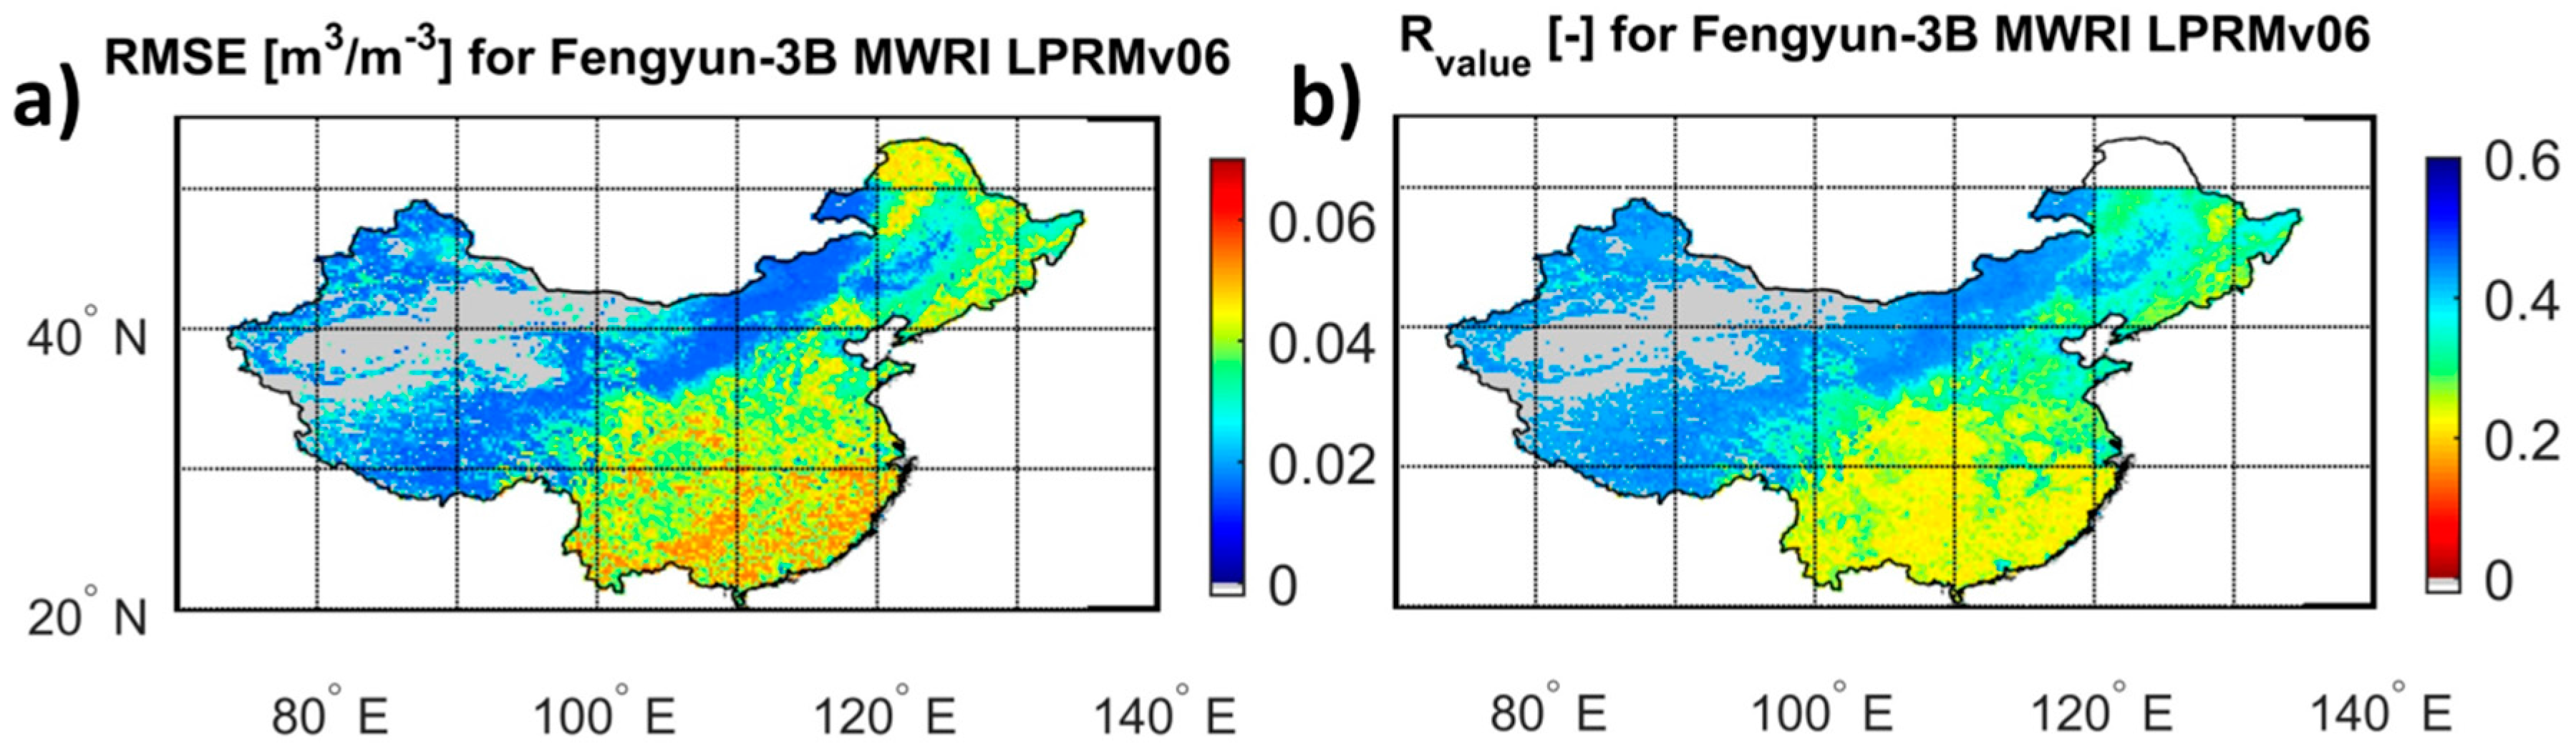
2.1.1. Fengyun-3B MWRI

The Chinese Fenyun-3B satellite was launched on 4 November 2010 and carries a passive microwave radiometer that observes the Earth’s surface in 10 microwave channels in both horizontal and vertical polarizations. The satellite reached its operational status in July 2011 and orbits at an altitude of 836 km. The radiometer makes observations in the frequency range between 10.7 and 89.0 GHz and scans with an incidence angle of 55.4° resulting in 1400 km wide swaths. As a result, a fixed point on the ground is observed roughly twice every three days, but the exact revisit times depend on the latitude. The local equatorial overpass time of the Fengyun-3B satellite is 01:30 am and 01:30 pm for the descending and ascending paths, respectively.
Of specific relevance for soil moisture retrievals and their associated quality indicators [15] is the lowest frequency of the MWRI, since lower-frequency microwave observations have a higher sensitivity to surface soil moisture [16]. For MWRI, this is the 10.7 GHz channel, which has a bandwidth of 0.18 GHz and a sensor accuracy of 0.5 degrees Kelvin. Finally, Radio Frequency Interference (RFI) is a known issue for all passive microwave observations (e.g., [17,18,19]), but the X-band frequency of MWRI remains relatively unaffected with the exception of The United Kingdom and Italy [19]. Finally, it should also be noted that the vertically polarized Ka-band channel (36.5 GHz) was used to retrieve land surface temperature [20] as an input for a selection of the soil moisture retrieval algorithm (Section 2.2).

2.1.2. GCOM-W AMSR2

AMSR2 is the successor of AMSR-E and these sensors share similarities in their frequency range from 6.9 to 89.0 GHz in both horizontal and vertical polarization. Since significant RFI issues in the 6.9 GHz channel were encountered over the United States, Middle East and Japan [17], a neighbouring frequency channel (7.3 GHz) was added to AMSR2 which successfully mitigates this issue [19]. Another similarity between these sensors, as well as with the MWRI on-board Fengyun-3B, is their local equatorial overpass time of 01:30 am and 01:30 pm, again for the descending and ascending paths, respectively. AMSR2 is mounted on-board the Global Change Observation Mission on Water (GCOM-W), which was developed by the Japan Aerospace Exploration Agency (JAXA) and reached its operational status in July 2012. As a result, AMSR2 was only considered from this date onwards. GCOM-W orbits at an altitude of 700 km and AMSR2 scans with an incidence angle of 55°, resulting in 1445 km wide swaths. In line with the MWRI, a fixed point on the ground is observed roughly twice every three days.
Again of relevance for soil moisture retrievals is the lowest frequency of AMSR2, the 6.9 GHz channel, which has a bandwidth of 0.35 GHz and a sensor accuracy of 0.3 degrees Kelvin. Additionally, the 10.7 GHz channel that AMSR2 shares with MWRI has only slightly different characteristics as the bandwidth for AMSR2 is 0.10 GHz with a sensor accuracy of 0.6 degrees Kelvin. Radio Frequency Interference (RFI) is also a known issue for AMSR2 [19] and the vertically polarized Ka-band channel (36.5 GHz) was again used to retrieve land surface temperature [20].

2.1.3. SMOS MIRAS

SMOS is the first satellite mission that makes global observations in the L-band frequency. These observations are made by the Microwave Imaging Radiometer using the Aperture Synthesis (MIRAS) instrument, which is a 2D interferometric radiometer. MIRAS observes the Earth’s surface at a single frequency but makes observations in a range of incidence angles (from 0° to 65°) that have an average spatial resolution of 43 km (depending on the incidence angle). Fengyun-3B and GCOM-W were not specifically designed for soil moisture purposes but SMOS is dedicated to this; therefore, SMOS makes observations at the optimal moment in a diurnal cycling (ascending orbit; 06:00 am). SMOS has a revisit time of roughly three days at the equator at 06:00 am and 06:00 pm, for the ascending and descending overpasses, respectively [10].
SMOS observations (1.4 GHz) are made with a bandwidth of 0.20 GHz, the sensor accuracy also depends on the incidence angle and ranges between 2 and 5 degrees Kelvin [21]. The SMOS satellite entered its operational status in July 2010; it orbits at an altitude of 760 km and the swath width is 1000 km wide. Additionally, an adverse issue for SMOS observations relates to RFI (e.g., [18]), which is likely further hampered by the synthetic design of the sensor that allows for spatial amplification of such artificial sources. In this study, a data flagging procedure was applied that removes SMOS brightness temperature observations with an RFI probability exceeding a threshold (0.20). This specific threshold is in line with guidance and standards for SMOS data as well as a recent study that focuses on surface soil moisture products from this satellite mission [22]. A comprehensive overview of all satellites and sensor characteristics relevant for this study, including the Advanced Scatterometer (ASCAT; see Section 2.3.1), is provided in Table 1.

2.2. Passive Microwave Retrieval Algorithms

Two different soil moisture retrieval algorithms for passive microwave observations are used in this study, the Land Parameter Retrieval Model (LPRM; Section 2.2.1) and the L-band Microwave Emission of the Biosphere Model (L-MEB; Section 2.2.2). Two different versions of the LPRM have been used, including the current algorithm that is used for the publicly available soil moisture dataset as well as the version that was recently updated through an improved parameterization and a vegetation correction [22,23].

2.2.1. The Land Parameter Retrieval Model

LPRM is one of the most widely used soil moisture retrieval algorithms. It has been continuously developed and is also extensively documented in the literature (e.g., [11,15,22,23,24,25,26,27]). LPRM soil moisture products also play a key role in the existing multi-decadal ECV-SM dataset (e.g., [9,28]) due to their applicability to a wide range of low microwave frequencies and the complementarity with soil moisture data from active microwave observations [29]. In this section, a brief overview of the LPRM is provided by presenting the key elements of the algorithm while referring to the existing literature for further details. This brief overview is followed by a more detailed description of recent algorithmic improvements [22].
The LPRM retrieves both vegetation optical depth and soil moisture from low frequency microwave observations and is based on the widely used radiative transfer equation [30]. Vegetation optical depth is derived through an analytical solution [24] and land surface temperature comes from an external, stand-alone algorithm based on observations of the vertically polarized Ka-band channel (36.5 GHz; [20]) in case this channel is available. The LPRM uses a forward modelling approach that runs over the widest possible soil moisture range, followed by an internal optimization procedure to minimize the difference between the simulated and observed brightness temperatures. The LPRM approach is unique for each location at each time step, and specifically aims to minimize the impact of ancillary datasets (e.g., [15,22]) to better facilitate its role in climate studies [31]. Various studies already detailed the LPRM model, to which readers are directed to for more information. In particular, Parinussa, et al. [26] provides a detailed overview of the version of the LPRM that is currently used for the publicly available soil moisture datasets and also their associated sub-modules. This version of the algorithm is from now on referred to as LPRMv05.
A recent study [22] further builds on this established approach by further improving the internal parameterization and a vegetation correction obtained through a primary run. The internal parameterization (single scattering albedo and roughness) was empirically tuned at the global scale to match the dynamics (i.e., the long-term mean and amplitude range) of soil moisture retrievals from SMOS [23]. While optimal results were found through a fixed value of the single scattering albedo (in both space and time), the roughness parameterization performed optimally when dependency on soil moisture was introduced. Additionally, in order to further correct for vegetation and roughness influences, the roughness parameterization was also updated with a vegetation correction. This vegetation correction is based on the vegetation optical depth from a primary run that further corrects roughness influences in a final run [22]. This updated version of the LPRM will be referred to from now on as LPRMv06. Van der Schalie et al. [22] demonstrated significant improvements in AMSR-E soil moisture from LPRMv06 against ground data compared to LPRMv05, which was confirmed through a large-scale precipitation based verification technique.

2.2.2. The L-Band Microwave Emission of the Biosphere

The standard approach to convert multi-angle SMOS brightness temperatures into surface soil moisture is through the L-MEB model [32]. L-MEB and LPRM share the same background through employing the radiative transfer equation [30] and they are also based on a forward modelling approach; however, there are also several key differences. L-MEB considers different parametrization schemes for different land cover types and vegetation optical depth is determined through a scaling parameter that depends on frequency, polarization, incidence angle and vegetation structure and is the so-called ‘b-parameter’ [33]. The variation of vegetation optical depth over the different incidence angles is further tuned through a number of parameters related to vegetation structure in L-MEB. For brightness temperatures in so-called mixed pixels, the internal pixel heterogeneity is considered and computed as the linear combination of the brightness temperatures of each land cover type. The atmospheric effects and contributions to the brightness temperatures are also considered. Finally, although the dedicated soil modelling modules of L-MEB and LPRM have many similarities and differences, they ultimately seek the same goal of solving the reflectivity of the soil and water mixture that can be integrated in the forward model. For more detailed information on the L-MEB model, readers are referred to [32], while key differences between L-MEB and the LPRM are further detailed in [23].

2.3. Additional Data Sources

2.3.1. MetOp-ASCAT and the Change Detection Algorithm

The primary validation tool used in this study is the Triple Collocation technique, which requires three soil moisture products with independent error structures. The conventional product combination to evaluate passive microwave surface soil moisture through this technique is using an additional active microwave source (Section 2.3.1) complemented with the top layer of a reanalysis model (Section 2.3.2). The ESA also developed MetOp, a series of polar orbiting meteorological satellites operated by the Exploitation of Meteorological Satellites (EUMETSAT). These satellites carry various different scientific instruments including ASCAT, a real aperture radar instrument that operates in the C-band frequency (5.3 GHz). ASCAT scans with three antennae on each site of the satellite, resulting in two swaths of 550 km each. As a result, each location is scanned from three different angles, which allows for the estimation of soil moisture conditions. In line with the passive microwave sensors, ASCAT also makes observations in both the horizontal and vertical polarizations. The MetOp satellites orbit at an altitude of 837 km and the local equatorial overpass time of MetOp is 09:30 am and 09:30 pm for the descending and ascending paths, respectively.
ASCAT soil moisture was determined through the change detection algorithm developed by the Technical University, Vienna, which converts the backscatter measurements in a time series format into relative soil moisture values. This product comes in a percentage of saturation of field capacity ranging between the wilting point and porosity and represents the top (0–2 cm) surface layer. ASCAT soil moisture data was projected on a global 0.25° grid and soil moisture data from the ascending and descending grids were combined [34]. More details on the change detection algorithm are provided by [1,35].

2.3.2. Re-Analysis Surface Soil Moisture from MERRA-2

The third surface soil moisture product required for the Triple Collocation technique is the Modern Era Retrospective-analysis for Research and Applications-2 (MERRA-2) product. MERRA-2 is an atmospheric reanalysis model that produces various water- and energy-related variables at multiple depths of both the saturated and unsaturated zone and was recently updated (from MERRA and MERRA-Land). Compared to its predecessors, MERRA-2 was further advanced through a data assimilation system that allows for the integration of hyperspectral and microwave observations and Ozone observations were also included from 2005 onwards. Finally, MERRA-2 is the only multi-decadal global reanalysis model that assimilates observations of aerosols and their complex interactions with related components in the climate system. In this study, surface soil moisture from the top surface layer (0–2 cm) of MERRA-2 was extracted. This product was, along with the ASCAT soil moisture dataset, used as a fixed input for the Triple Collocation technique. Finally, both these fixed inputs for the Triple Collocation (i.e., ASCAT and MERRA-2) have a unique spatial quality, for which we refer to Al-Yaari et al. [36]. This existing study provides a thorough quality analysis of such surface soil moisture products. While this is an important issue for the Triple Collocation technique, our analysis is based on (a) the conventional Triple Collocation approach with its corresponding prerequisites (see Section 3.1) and (b) key results were confirmed by the Rvalue verification technique that operates independent from the ASCAT and MERRA-2 surface soil moisture products.

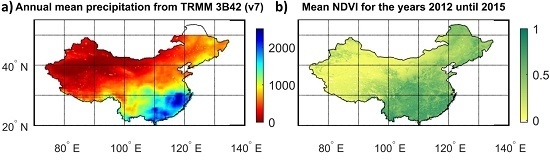
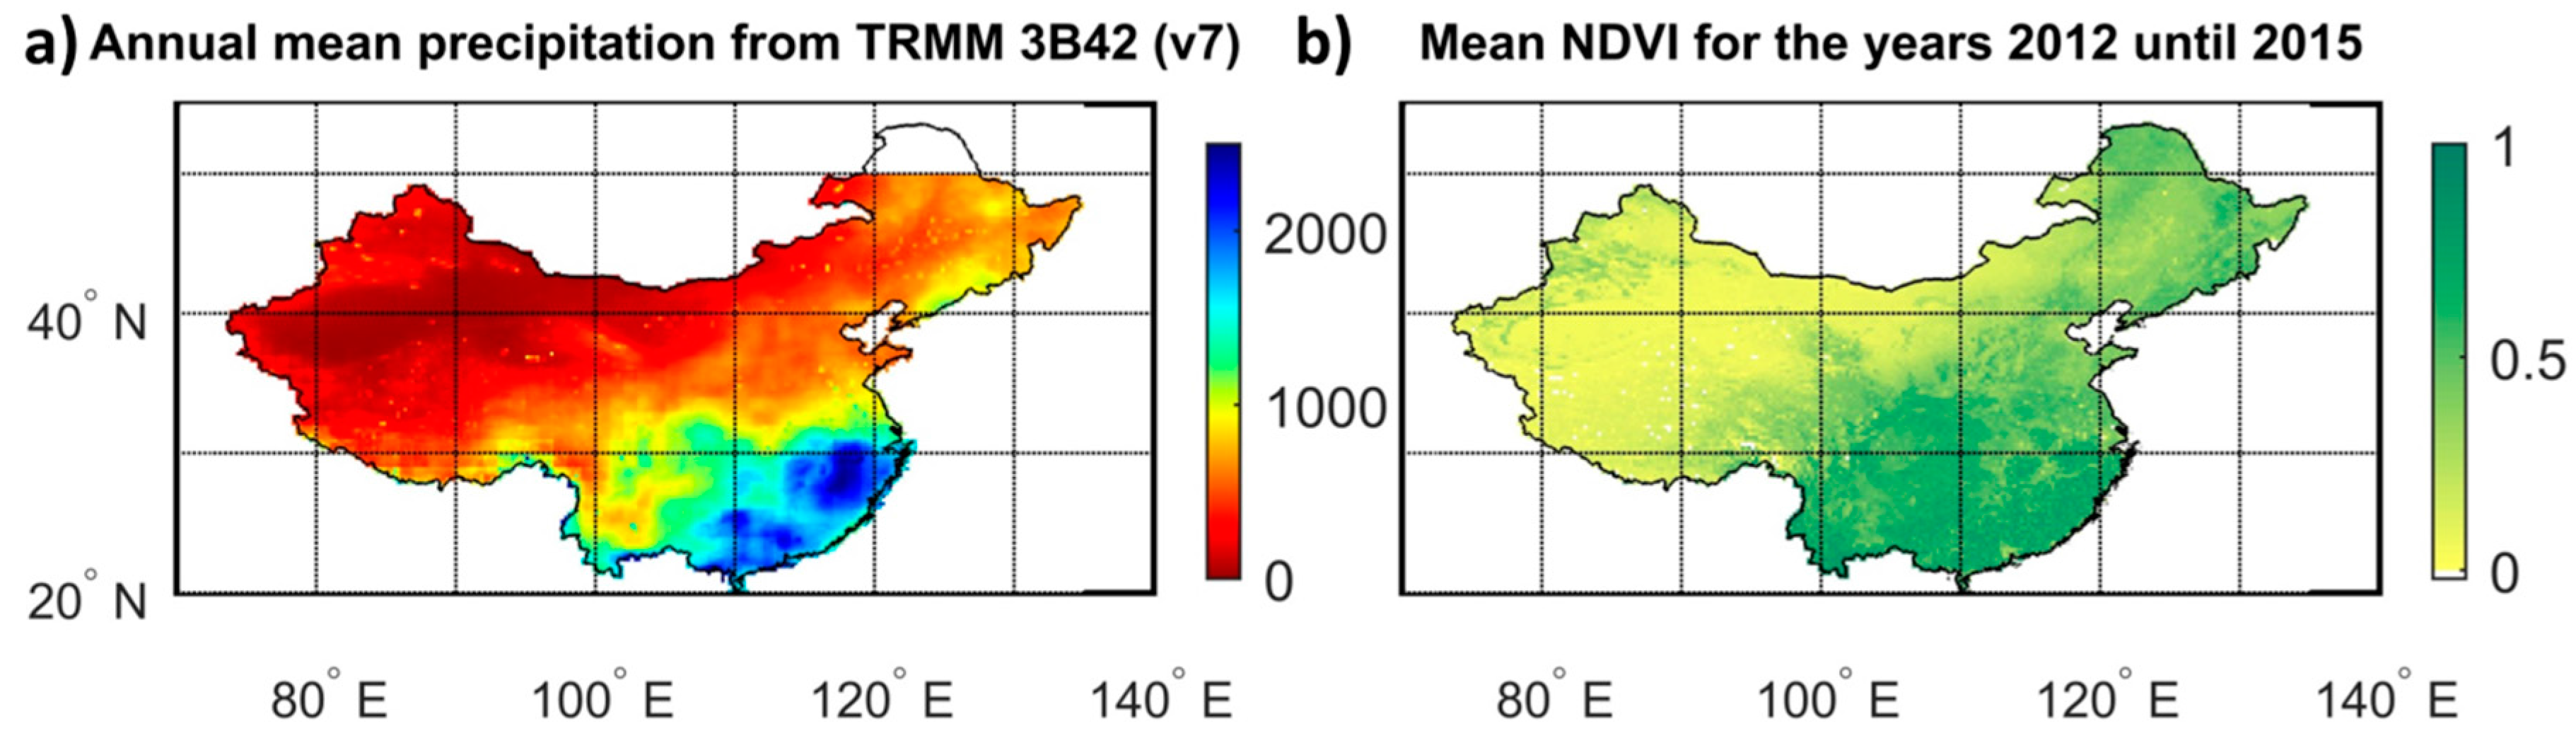
2.3.3. Precipitation

The secondary verification technique that was used in this study is the so-called Rvalue technique (e.g., [27,37,38]). This technique is based on the assimilation of remotely sensed soil moisture into a water balance model and requires precipitation as an input. Therefore, Tropical Rainfall Monitoring Mission (TRMM) 3B42 v.7 [39], which is based on measurements from the Visible and Infrared Scanner and Microwave Imager instruments, was used. These observations are used to adjust infrared observations from various geostationary satellite platforms into precipitation rates. Then, the adjusted merged Infrared products at a 0.25° spatial resolution at three hourly time-steps are aggregated into daily representations. The TRMM satellite used to orbit is in a constant plane relative to the sun, covering the latitudes between 50° North and 50° South. A consequence for our study area, the mainland of the People’s Republic of China, is that the northern tip of the county could not be considered in the Rvalue verification. Besides its use in the Rvalue verification, TRMM 3B42 (v.7) precipitation data was also used as supporting information to better understand our results, hence the annual mean precipitation over the study area was presented in Figure 1a.

2.3.4. Normalized Difference Vegetation Index

Finally, a commonly used vegetation index was used to further understand the quality of the remotely sensed anomalies spatially. The quality of remotely sensed soil moisture is known to decrease with an increase in overlying vegetation canopy (e.g., [15,27,34]). This limitation is well known for microwave based soil moisture and is caused by the attenuation of the soil (moisture) emission with increasing vegetation and the difficulties in correctly parameterizing for vegetation influences. In this study, Normalized Difference Vegetation Index (NDVI) obtained from the Moderate Resolution Imaging Spectrometer is used as an indicator of the vegetation density. NDVI is determined through visible and near-infrared observations and is linked to vegetation greenness. It should be noted that we explicitly use NDVI instead of microwave-based vegetation optical depth [24], which can serve the same purpose. The reason for using NDVI over microwave-based vegetation optical depth is its independency of the soil moisture retrievals, which are determined through the same passive microwave observations that have been used for soil moisture retrieval. NDVI data were used in a binning procedure in which verification results from the two techniques were binned over the NDVI range (0.10 < NDVI < 0.85). Monthly NDVI images were aggregated into a global 0.25° grid and used to further analyse the outputs of the large-scale verification techniques. Within this study, NDVI data were used to better understand and interpret the results, of which the mean NDVI over the study period was presented in Figure 1b.

2.4. Data Pre-Processing

Our analysis is based on soil moisture anomalies relative to their long-term climatology. This processing step is a relatively standard decomposition (e.g., [27,29,37,40]) in which the climatology on the particular day of interest was determined through a 31-day centred moving window and removed from the original data. The reason for this processing step is that the unique surface layer observed from space as well as the unique layer in applications that use these data both have unique climatology. In order to make optimal use of the independency that the remote sensing dataset has to offer, systematic differences have to be minimized, hence remotely sensed soil moisture anomalies are generally scaled into the model’s climatology.
Additionally, several studies (e.g., [25,34,38,41]) separately assessed the quality of remotely sensed soil moisture products for their satellite paths explicitly. Diurnal variations in several related variables, for example land surface temperature ([26,27,38]), can lead to a contrast in quality that depends on the local overpass time as well as the algorithm used to link brightness temperatures to soil moisture. In particular, [34] demonstrated this for passive microwave products from SMOS (L-MEB) and AMSR-E (LPRM), which are commonly based on the radiative transfer equation [30]. Even though progress towards consistency between satellite paths was recently demonstrated [27], this study only focuses on the descending path of MWRI and AMSR2 (both 01:30 am) and the ascending path of SMOS (06:00 am). These are theoretically preferred overpass times based on thermodynamic equilibrium, in which the temperature of the soil can be assumed equal to the temperature of the canopy, generally outperforming their daytime counterparts (01:30 pm for MWRI and AMSR2, and 06:00 pm for SMOS). All datasets used in this study have been identically processed; they were re-gridded on 0.25° regular grids from their native footprint size (see Table 1) through nearest neighbour re-sampling and all datasets were evaluated based on daily sampling intervals.

3. Methodology

The primary verification technique was used in this study is the Triple Collocation technique (Section 3.1), while the independent precipitation based Rvalue technique (Section 3.2) is used to confirm key results. While remotely sensed surface soil moisture products are traditionally compared against ground observations, we explicitly rely on these two independent and large-scale verification techniques. The primary reason for this choice is the aim to evaluate the different product combinations over the widest areal extent possible. This is in contrast with ground observations that are only available at specific monitoring sites. Besides this key advantage, ground observations generally represent a different vertical layer than remotely sensed products; ground observations over our study area are generally limited in their temporal availability and the considered spatial heterogeneity of surface soil moisture complicates a direct comparison. The entire evaluation follows a sequential structure that starts with product combination A, a direct comparison between the two versions of the LPRM as applied to MWRI observations in the X-band frequency. The processing and verification chains were identical, with the only modification being the parameterization and a vegetation correction (LPRMv06) over the standard approach (LPRMv05). The following step (product combination B) is to compare the MWRI-LPRMv06 soil moisture product against the same algorithm version but then applied to AMSR2 X-band observations. Again, identical processing- and verification chains were used, with the only difference being the transition from the MWRI X-band retrievals to the AMSR2 X-band retrievals. In the next product combination (C) AMSR2 retrievals from the X- and C-band frequencies were evaluated, which allows for isolating impacts of observation frequency. Again, the processing and verification chains were identical, with the only modification being the AMSR2 frequencies. When transitioning to the following product combination (D) that includes SMOS, it is not possible to isolate a single component as different radiometers (AMSR2 and SMOS) with different frequencies (C- and L-band) had to be considered. However, the impact of algorithmic differences was minimized by relying on the LPRMv06 retrieval algorithm. Finally, in the last step (product combination E) SMOS soil moisture products were compared as obtained by LPRMv06 and L-MEB. Table 2 presents a detailed overview of the sequential evaluation that was followed in this study, including the product combinations A–E. This sequential evaluation aims to understand the consequences of isolated differences between the products that have been used and were evaluated and processed through identical chains.

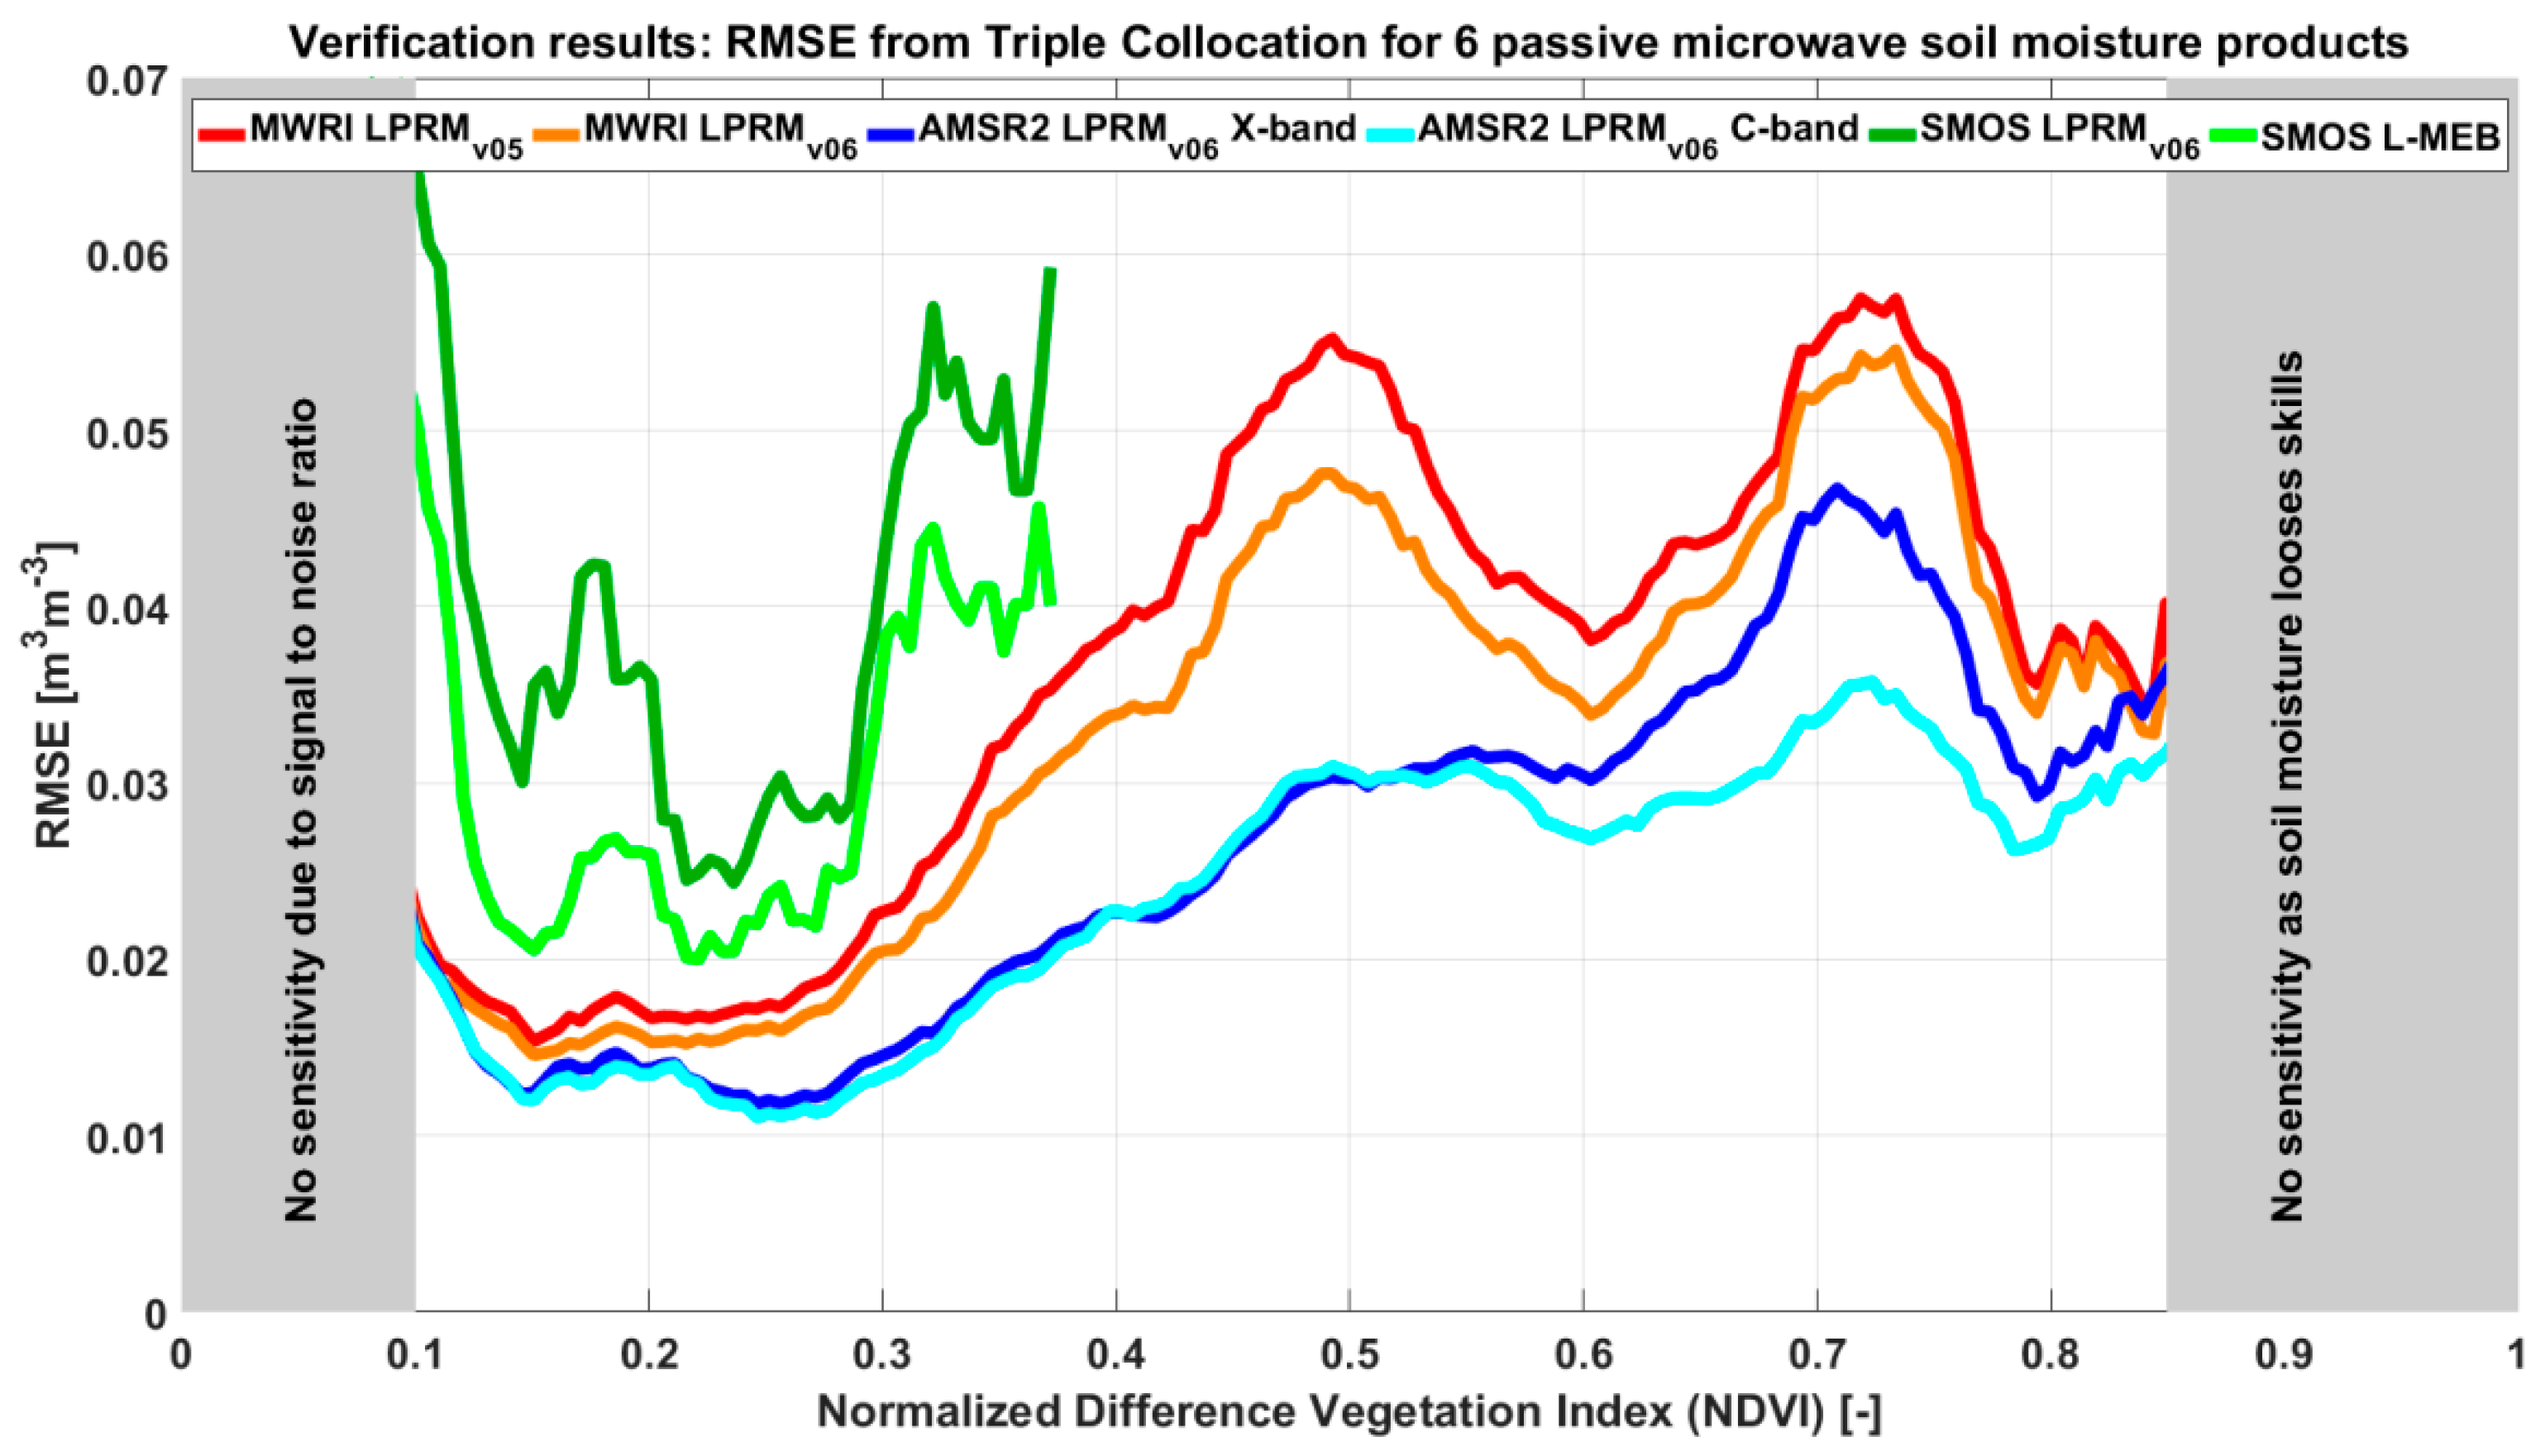
3.1. The Triple Collocation Technique

Triple Collocation is a statistical verification technique that has been extensively used for the validation of remotely sensed soil moisture anomalies (e.g., [27,29,34,38]). This technique estimates the root mean square error (RMSE) versus true conditions for three linearly related (soil moisture) datasets that have independent error structures. The conventional product combination in large-scale surface soil moisture evaluation studies is soil moisture from an active and passive microwave source, complemented by the top layer of a reanalysis model. Results from the Triple Collocation technique were validated against ground observations [42], while [29] demonstrated that RMSE estimates are only marginally influenced by the choice of the reanalysis model. This study follows the conventional Triple Collocation approach, which is extensively documented in the literature ([27,29,34,38]). Of specific relevance for the Triple Collocation analysis is the number of collocated samples being set to N > 100, which is a standard number that was adopted from Parinussa et al. [38].
This study sequentially examines the relative quality of the five soil moisture product combinations (A to E) in a common framework. Therefore, our input sources from ASCAT and MERRA-2 are fixed throughout, while passive microwave products were swapped and evaluated. Finally, since the true soil moisture conditions are unknown, ASCAT soil moisture was arbitrarily chosen as a reference product but this will not affect subsequent conclusions regarding the relative performance of all passive microwave products and the product combinations. Triple Collocation produces an error metrics, hence higher numbers indicate lower quality; this is in contrast with Rvalue, which is a performance metrics. Figure 2a presents a Triple Collocation example as applied to MWRI observations from the Fengyun-3B satellite using the LPRMv06 algorithm.

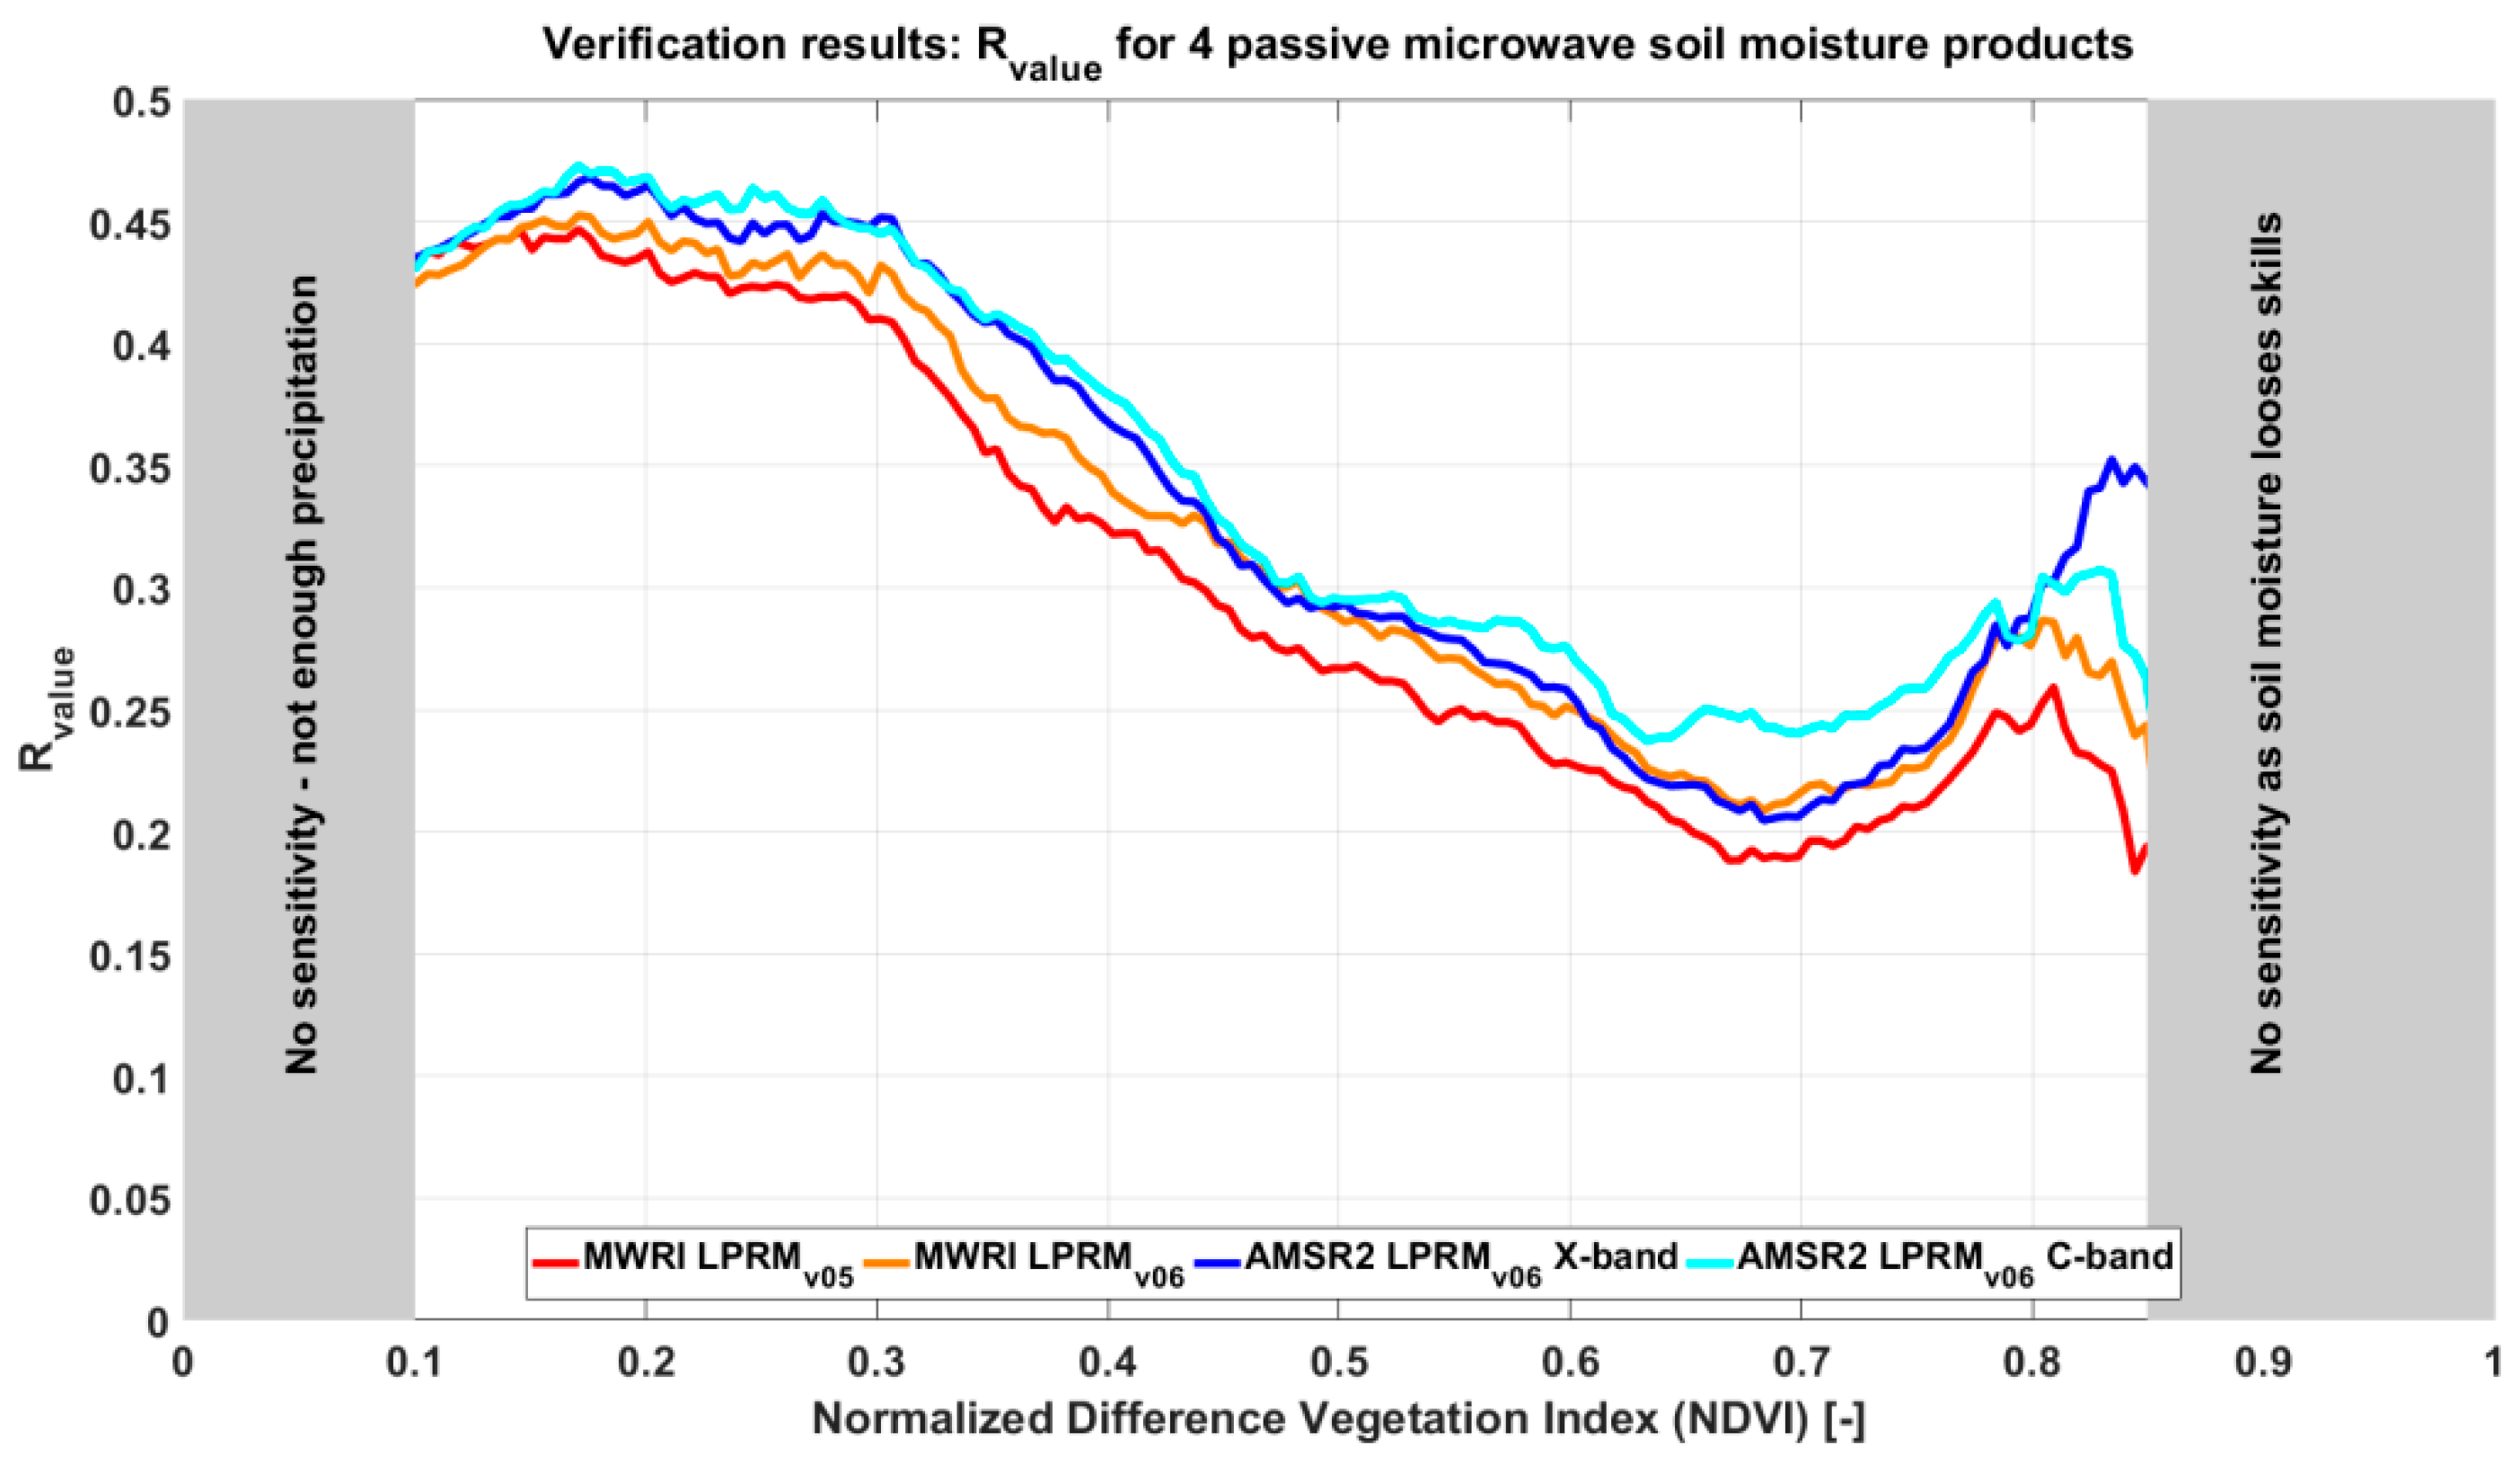
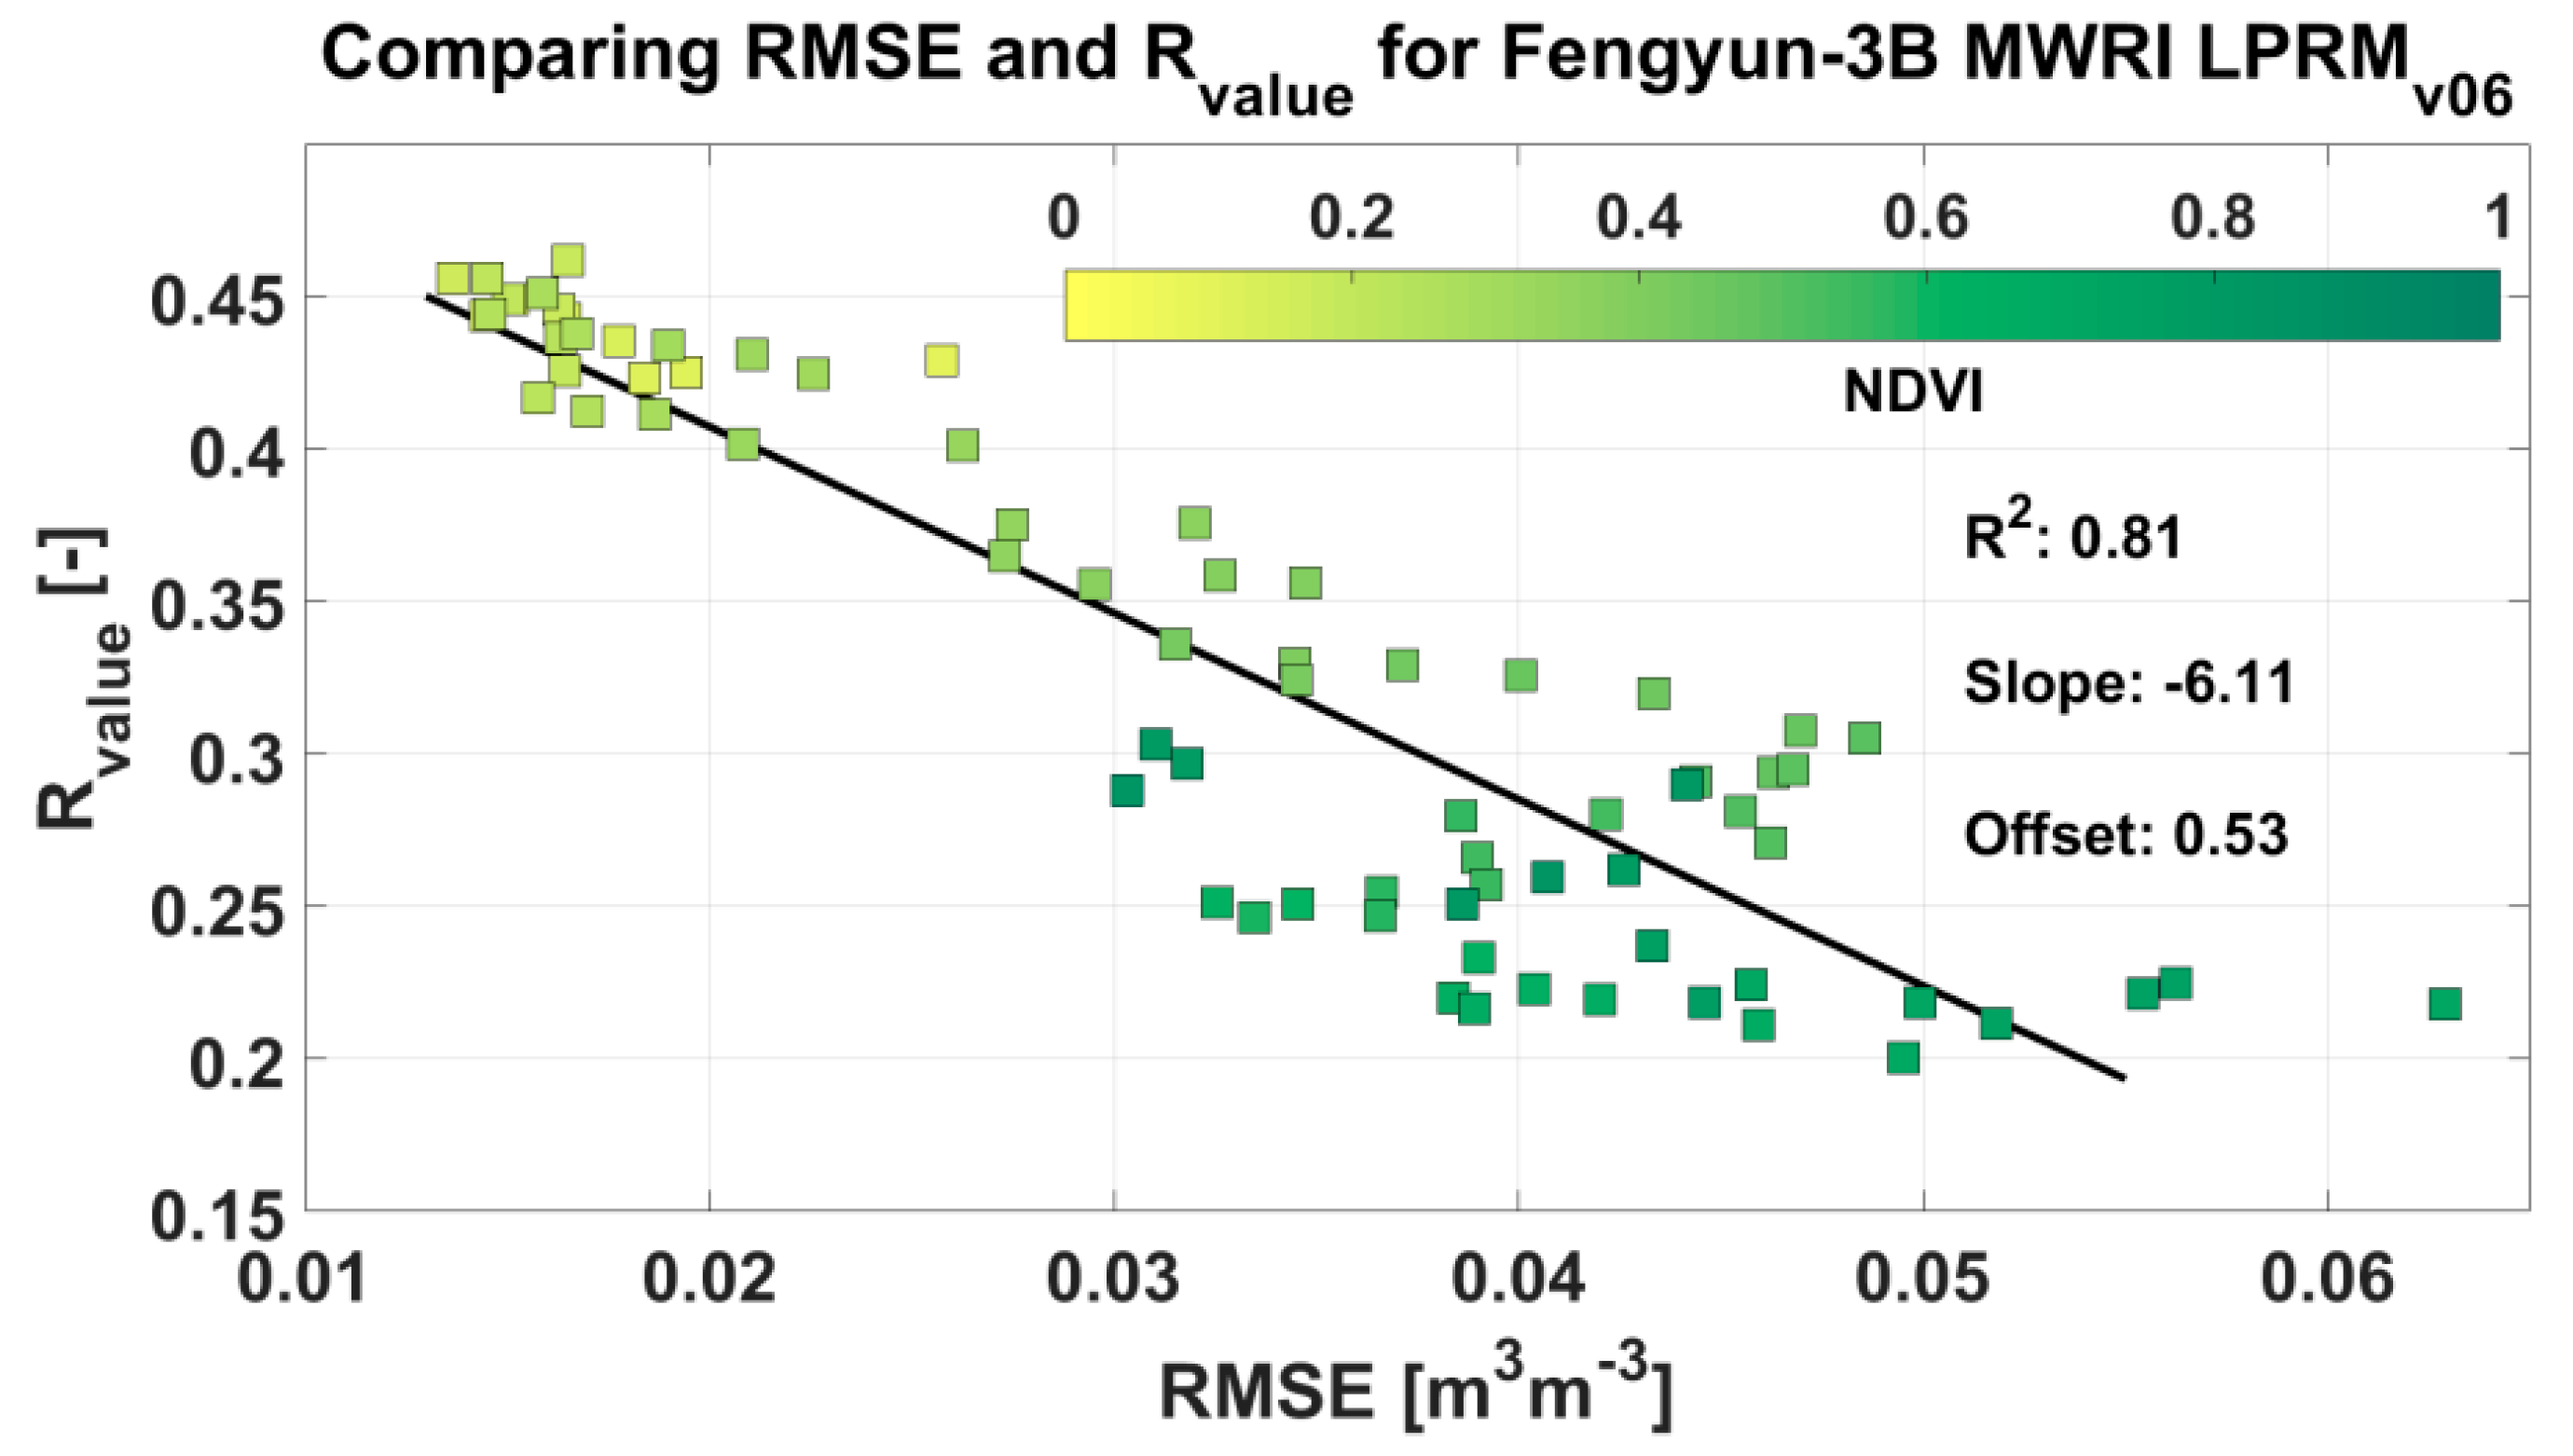
3.2. The Rvalue Technique
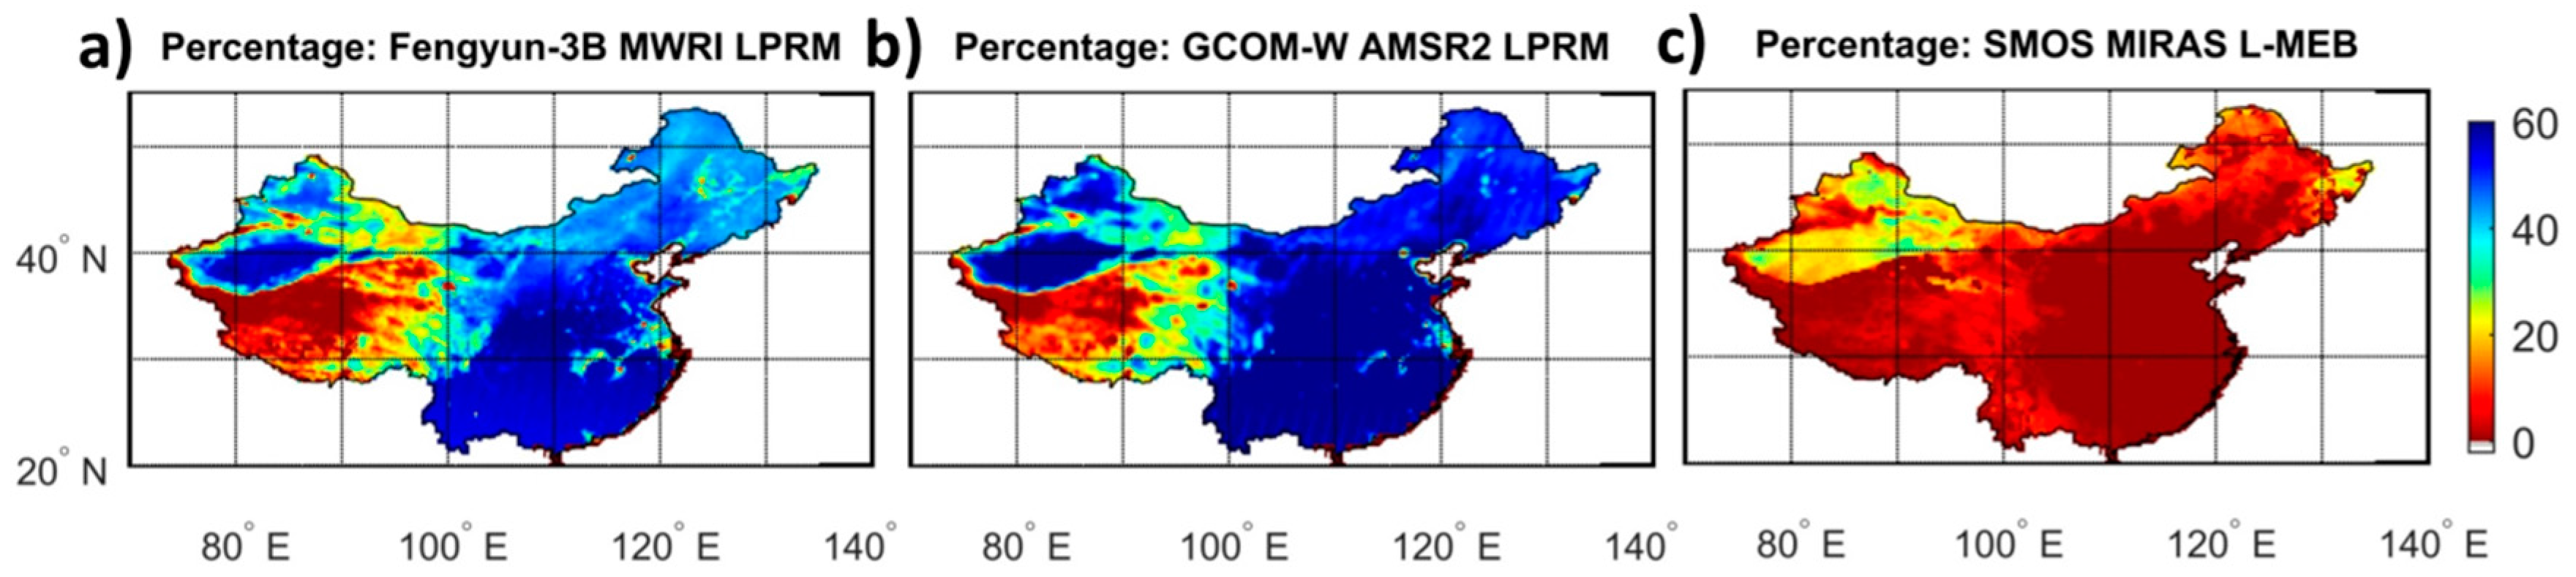
The baseline of the Rvalue technique was presented by Crow and Zhan [43] and uses the connection between precipitation and the subsequent changes in soil moisture. Crow et al. [37] adapted the approach to run on anomalies and validated Rvalue as a robust representation of (anomaly) correlation-based skill in satellite soil moisture retrieval. Rvalue relies on contrasts in the quality of rainfall products to evaluate the degree to which analysis increments (derived via the sequential assimilation of soil moisture into a simple water balance model) accurately compensate for known rainfall errors. In this study, the approach presented by [27] and [44] was followed, which artificially deteriorates the gauge-corrected TRMM 3B42 precipitation product to generate these rainfall errors. There are known limitations ([22,27,38]) with Rvalue verification over extremely arid climates that have to do with the requirement of a sufficient number of precipitation events that cannot be met under such conditions. These regions were masked in our analysis and are indicated by “Not enough precipitation”. In line with this limitation is a known limitation of remotely sensed algorithms under very dense vegetation canopies, which was indicated in the figures by “Soil moisture loses skills”. In this study, Rvalue has been used as a secondary verification tool to confirm the initial findings. For more detailed information on this technique, readers are directed to [27,37,38]. Rvalue is a performance metrics, hence higher numbers indicate better quality, again in contrast with an error metrics. An example of Rvalue verification for the MWRI-LPRMv06 soil moisture product is presented in Figure 2b.

4. Results

In this section, results from the Triple Collocation for our five product combinations (A to E) are first presented (Figure 3), followed by the results from the Rvalue analysis (Figure 4). Then, a final exercise to determine the agreement between these independent verification techniques is also presented (Figure 5). It should be emphasized that Figure 3 is a central source of information throughout this entire section. This central role can be explained by the significantly large data analysis over the entire People’s Republic of China that was summarized for all evaluated product combinations and presented in Figure 3. RMSE from the six passive microwave soil moisture products were binned and presented. Results for these specific product combinations (A to E) are extensively discussed in Section 5, while the explicit product combinations (A to E) discussed later have been highlighted here. Additionally, a brief note on the modifications from the Triple Collocation analysis (Figure 3) to the Rvalue analysis (Figure 4) is also provided.
In the first product comparison (A; Table 2), the Triple Collocation results from the algorithm update were compared: the baseline algorithm ( LPRMv05) was compared against the updated algorithm ( LPRMv06). In the next product comparison (B; Table 2), the Triple Collocation results from the MWRI-LPRMv06 () were compared against AMSR2-LPRMv06 (). Then, the focus shifts to the different frequencies observed by AMSR2 (C; Table 2), where the entire processing and verification chains were identical, with the only modification being the selection of the C- () and X-band () frequencies. For product combination D, the results from AMSR2 C-band () and SMOS () retrieved through LPRMv06 were compared. This product combination is the only combination that cannot isolate a single characteristic within the processing chain as we have to consider the frequency difference between AMSR2 (C-band) and SMOS (L-band) but the two sensors on-board the satellites also have different characteristics. Finally, in product combination E, SMOS L-MEB () was compared against SMOS LPRMv06 (). As previously noted, Rvalue is a performance metric, while Triple Collocation produces an error metric, meaning that these metrics are reversed (i.e. higher RMSE indicates lower quality while higher Rvalue indicates better quality). Since the SMOS soil moisture products fail to meet Triple Collocation sample size requirements (see Section 5), these products were not taken into further consideration. Figure 4 presents the results obtained through the Rvalue verification with an approach completely aligned to Figure 3, with removing the SMOS products as the only modification. Likewise, Figure 4 also has a central role that again can be explained by the significantly large data analysis over the entire study area that had to be summarized.
Figure 5 presents a final exercise to further confirm the mutual agreement of these verification techniques. This figure presents a direct comparison of both verification techniques for the soil moisture anomalies from Fengyun-3B MWRI, which reveals a very high coefficient of determination (R2: 0.81). Colours relate to the corresponding NDVI value, over which both metrics were binned. This mutual agreement, together with the many similarities obtained by Figure 3 (Triple Collocation) and Figure 4 (Rvalue), further demonstrates their reliability.

5. Discussion

For product comparison A (MWRI-LPRMv05 versus MWRI-LPRMv06 ), the results for the LPRM retrieval algorithm update were compared. The overall patterns that these two products show over the increasing NDVI range (from left to right) correspond well. The Triple Collocation results (Figure 3) demonstrate consistently lower RMSE values for LPRMv06 () compared to LPRMv05 (), while the Rvalue results (Figure 4) consistently demonstrate higher Rvalue results for LPRMv06 () compared to LPRMv05 () over the entire NDVI range. Hence, both these metrics clearly demonstrate a superior performance of LPRMv06 and lend further support to the improved LPRM approach presented by van der Schalie et al. [22]. Additionally, the generally decreasing quality of the LPRM soil moisture products with increasing NDVI values (from left to right) seamlessly aligns with a number of existing studies (e.g., [41]). These studies found a high performance of LPRMv05 over arid climate regions through a comparison against in situ observations, which was later confirmed through several alternative verification techniques such as Triple Collocation (e.g., [29]). The marginal room for improvement of LPRMv05 over these arid regions was further demonstrated by Parinussa et al. [15,38], which is in contrast with the significant room for improvement over more densely vegetated areas, as presented in these studies. Again, similar findings were recently confirmed in a study using soil moisture retrievals based on AMSR-E observations ([22]). As the relative improvements vary over the entire NDVI range, these improvements determined by the Triple Collocation technique were spatially expressed over our study area. Figure 6 presents these spatial patterns, which demonstrate that improvements are most profound in densely populated eastern part of the People’s Republic of China, with RMSE reductions of around 15%, while the RMSE over arid climate regimes towards the western part of the country is only marginally reduced.
In the next step (product comparison B), the Triple Collocation results from the MWRI-LPRMv06 () were compared against AMSR2-LPRMv06 (). For NDVI values at the lower end of the vegetation range (NDVI < 0.45), results obtained by both techniques are clear and consistent with each other. Within this NDVI range, the Triple Collocation technique indicates consistently lower RMSE for AMSR2-LPRMv06 compared to MWRI-LPRMv06. This result is confirmed by the higher numbers obtained through the Rvalue technique within this lower end of the vegetation range. The only diverging result between the two verification techniques found in this study was demonstrated for the comparison when NDVI values exceed 0.45. While Triple Collocation consistently demonstrates better performance for AMSR2-LPRMv06 (), the Rvalue indicates a relatively similar performance between AMSR2-LPRMv06 () and MWRI-LPRMv06 () above this threshold. While the exact reason for this discrepancy remains unknown, several reasons might have an impact. The generally better performance of AMSR2-LPRMv06 () against MWRI-LPRMv06 () is an interesting finding and somewhat unexpected when satellite and sensor characteristics are taken into consideration, as frequency, bandwidth and sensor accuracy are relatively similar. Nonetheless, several other factors can play a role as the LPRMv06 algorithm update [22] was solely developed for AMSR-E observations, which better match AMSR2 than MWRI characteristics. Even though these different sensor characteristics are only slightly different, they can potentially penalize MWRI when directly compared to AMSR2. Besides this single discrepancy, further agreement between the remaining findings is striking.
Then, the focus shifts to the C- () and X-band () frequencies observed by the AMSR2 sensor and converted to surface soil moisture through the LPRMv06 algorithm (product comparison C). In line with previous results of the LPRM retrieval algorithm update (product comparison A), results are again very clear. According to both verification techniques, the soil moisture products from the C- () and () X-band frequencies perform equally well until NDVI values of approximately 0.55. In more densely vegetated regions, in which NDVI exceeds this threshold, the results obtained by both verification techniques demonstrate a contrasting performance of these two frequency bands. While the RMSE obtained through the C-band frequency () remains relatively stable (with some fluctuations) at higher NDVI values, the RMSE values for the X-band frequency () steadily rise and depart from their C-band () equivalent. The mutual agreement between the RMSE and the Rvalue has a striking correspondence with a similar NDVI threshold (NDVI > 0.55), at which C-band () departures from X-band () result. This is a finding that perfectly aligns with theoretical expectations and adds credibility to the retrieval algorithm and both verification techniques.
For product combination D, the results from AMSR2-LPRMv06 C-band () and SMOS-LPRMv06 () were compared. An obvious finding is that RMSE values for SMOS-LPRMv06 are significantly and consistently higher than AMSR2-LPRMv06. Also, SMOS retrievals are not available over the entire NDVI range considered in the evaluation. The absence of evaluation results for SMOS is related to RFI issues [18], therefore it limits further analysis over the mainland of the People’s Republic of China. The standard data flagging procedure that was applied removes too many SMOS data points, such that the Triple Collocation sample size requirements (e.g., [29,38,45]) could not be met. In order to get a better hold on such coverage issues, Figure 7 presents the percentage of days that each of the microwave sensors can be converted to surface soil moisture over the entire analysis period. MWRI (a) and AMSR2 (b) show overall high numbers on the order of 50%, with the exception of the Tibetan plateau, which is at very high elevations and regularly experiences frost at night. In contrast, SMOS (c) is virtually absent over the entire country, with the exception of the far west of the country and a small patch in the northeastern part of the country.
Finally, even though care should be taken with product combination E, SMOS L-MEB consistently performs better than SMOS LPRMv06. It should be noted that these results are not in line with findings from earlier studies ([22,23]), which demonstrated similar performance for these two SMOS products.

6. Conclusions

This study sequentially evaluates a number of surface soil moisture products observed by three different passive microwave sensors with unique characteristics. Different retrieval algorithms, observations frequencies and radiometer characteristics were taken into consideration and the analysis relies on the independent Triple Collocation and Rvalue techniques. Key results were almost consistently confirmed throughout, and the vast majority of the findings are supported by theory; this adds significant credibility to the retrieval algorithms and both verification techniques. Our results indicate that SMOS is significantly affected by RFI over our study area and therefore generally not appropriate to use as sample size requirements could not be met. SMOS revisit times are significantly reduced through the application of the standard RFI filters over the western part of the People’s Republic of China and are virtually absent over the densely populated eastern part of the country. Our results furthermore indicate that the AMSR2 soil moisture retrievals (for both observation frequencies) consistently perform better than the SMOS soil moisture retrievals (for LPRMv06 and L-MEB) over our study area. Furthermore, the transition from LRPMv05 to LPRMv06 demonstrates consistent improvements over our study area, with improved skills in the order of 5%–10% on average. Our analysis also indicates a generally better performance of AMSR2-LPRMv06 against MWRI-LPRMv06, specifically when the Triple Collocation technique is considered. Then, soil moisture anomalies from the C- and X-band of the AMSR2 sensor were also compared and confirm our theoretical expectations in relation to vegetation density. Specifically, the reduced errors in the AMSR2-LPRMv06 C-band product compared to its X-band equivalent for NDVI values above 0.55 support the retrieval algorithm and both verification techniques. Finally, SMOS results should be interpreted with care due to RFI issues and it was demonstrated that soil moisture retrieval from the MWRI and AMSR2 sensors is a credible alternatives over the mainland of the People’s Republic of China. Future studies will aim to further evaluate these products over areas not impacted by RFI. That would further advance the ranking of these passive microwave products against each other. The daytime soil moisture products can also be included in future studies, as well as soil moisture from the recent and dedicated Soil Moisture Active and Passive mission once this data record is sufficiently long.

Acknowledgments

This work has been undertaken as part of an internal program at the Nanjing University of Information Science and Technology and is supported by projects of the National Natural Science Foundation of China (Grant Nos. 41561124014, 41375099 and 91337108). This study was also partially funded by the European Space Agency Climate Change Initiative for Soil Moisture (Contract 4000104814/11/I-NB). We are furthermore grateful to all contributors to the datasets used here and particularly thank teams from the NSMC, ESA, JAXA, NASA and the TU Vienna for making their datasets available.

Author Contributions

Robert M. Parinussa initiated the study and did the analysis under the supervision of Guojie Wang. Yi Y. Liu and Robin van der Schalie provided a number of datasets and regular feedback on the analysis throughout this study, while Daniel F.T. Hagan and Fenfang Lin provided the required logistics towards the experimental design. All authors contributed to the editing of the manuscript and to the discussion and interpretation of the results.

Conflicts of Interest

The authors declare no conflict of interest.

Abbreviations

SMOSSoil Moisture and Ocean Salinity
ESAEuropean Space Agency
AMSR2Advanced Microwave Scanning Radiometer
JAXAJapan Aerospace Exploration Agency
MWRIMicrowave Radiation Imager
NSMCNational Satellite Meteorological Centre
LPRMLand Parameter Retrieval Model
ECVEssential Climate Variable
AMSR-EAdvanced Microwave Scanning Radiometer for Earth Observing System
NASANational Aeronautics Space Administration
RFIRadio Frequency Interference
GCOM-WGlobal Change Observation Mission on Water
MIRASMicrowave Imaging Radiometer using Aperture Synthesis
ASCATAdvanced Scatterometer
L-MEBL-band Microwave Emission of the Biosphere
EUMETSATEuropean Organization for the Exploitation of Meteorological Satellites
MERRAModern Era Retrospective-analysis for Research and Applications
TRMMTropical Rainfall Monitoring Mission
NDVINormalized Vegetation Difference Index
RMSERoot Mean Square Error

References

  1. Wagner, W.; Lemoine, G.; Rott, H. A method for estimating soil moisture from ERS scatterometer and soil data. Remote Sens. Environ. 1999, 70, 191–207. [Google Scholar] [CrossRef]
  2. Njoku, E.; Jackson, T.; Lakshmi, V.; Chan, T.; Nghiem, S. Soil moisture retrieval from AMSR-E. IEEE Trans. Geosci. Remote Sens. 2003, 41, 215–229. [Google Scholar] [CrossRef]
  3. Miralles, D.G.; Van Den Berg, M.J.; Gash, J.H.; Parinussa, R.M.; De Jeu, R.A.; Beck, H.E.; Holmes, T.R.; Jiménez, C.; Verhoest, N.E.; Dorigo, W.A.; et al. El Niño-La Niña cycle and recent trends in continental evaporation. Nat. Clim. Chang. 2014, 4, 122–126. [Google Scholar] [CrossRef]
  4. Wanders, N.; Karssenberg, D.; de Roo, A.; de Jong, S.; Bierkens, M. The suitability of remotely sensed soil moisture for improving operational flood forecasting. Hydrol. Earth Syst. Sci. 2014, 18, 2343–2357. [Google Scholar] [CrossRef]
  5. Bolten, J.; Crow, W. Improved prediction of quasi global vegetation conditions using remotely sensed surface soil moisture. Geophys. Res. Lett. 2012, 39, L19406. [Google Scholar] [CrossRef]
  6. Taylor, C.; de Jeu, R.; Guichard, F.; Harris, P.; Dorigo, W. Afternoon rain more likely over drier soils. Nature 2012, 489, 423–426. [Google Scholar] [CrossRef] [PubMed] [Green Version]
  7. Guillod, B.; Orlowsky, B.; Miralles, D.; Teuling, A.; Seneviratne, S. Reconciling spatial and temporal soil moisture effects on afternoon rainfall. Nat. Commun. 2015. [Google Scholar] [CrossRef] [PubMed] [Green Version]
  8. Global Climate Observing System. Implementation Plan for the Global Observing System for Climate in Support of the UNFCCC; Global Climate Observing System: Geneva, Switzerland, 2010. [Google Scholar]
  9. Dorigo, W.; Wagner, W.; Albergel, C.; Albrecht, F.; Balsamo, G.; Brocca, L.; Chung, D.; Ertl, M.; Forkel, M.; Gruber, A.; et al. ESA CCI soil moisture for improved Earth system understanding: State-of-the art and future directions. Remote Sens. Environ. 2017. in review. [Google Scholar]
  10. Kerr, Y.; Waldteufel, P.; Wigneron, J.-P.; Delwart, S.; Cabot, F.; Boutin, J.; Escorihuela, M.; Font, J.; Reul, N.; Gruhier, C.; et al. The SMOS mission: New tool for monitoring key elements of the global water cycle. Proc. IEEE 2010, 98, 666–687. [Google Scholar] [CrossRef] [Green Version]
  11. Owe, M.; de Jeu, R.; Holmes, T. Multisensor historical climatology of satellite-derived global land surface moisture. J. Geophys. Res. 2008, 113, 1–17. [Google Scholar] [CrossRef]
  12. Mladenova, I.; Jackson, T.; Njoku, E.; Bindlish, R.; Chan, S.; Cosh, M.; Holmes, T.; de Jeu, R.; Jones, L.; Kimball, J. Remote monitoring of soil moisture using passive microwave-based techniques—Theoretical basis and overview of selected algorithms for AMSR-E. Remote Sens. Environ. 2014, 144, 197–213. [Google Scholar] [CrossRef]
  13. Zhang, P.; Yang, J.; Dong, C.; Lu, N.; Yang, Z.; Shi, J. General introduction on payloads, ground segment and data application of Fengyun 3A. Front. Earth Sci. 2009, 3, 367–373. [Google Scholar] [CrossRef]
  14. Parinussa, R.; Wang, G.; Holmes, T.; Liu, Y.; Dolman, A.; de Jeu, R.; Jiang, T.; Zhang, P.; Shi, J. Global surface soil moisture from the microwave radiation imager onboard the Fengyun-3B satellite. Int. J. Remote Sens. 2014, 35, 7007–7029. [Google Scholar] [CrossRef]
  15. Parinussa, R.; Meesters, A.; Liu, Y.; Dorigo, W.; Wagner, W.; de Jeu, R. Error estimates for near-real-time satellite soil moisture as derived from the Land Parameter Retrieval Model. IEEE Geosci. Remote Sens. Lett. 2011, 8, 779–783. [Google Scholar] [CrossRef]
  16. Schmugge, T. Remote sensing of soil moisture: Recent advances. IEEE Trans. Geosci. Remote Sens. 1983, 21, 336–344. [Google Scholar] [CrossRef]
  17. Li, L.; Njoku, E.; Im, E.; Chang, P.; St. German, K. A preliminary survey of radio-frequency interference over the U.S. in Aqua AMSR-E data. IEEE Trans. Geosci. Remote Sens. 2004, 42, 380–390. [Google Scholar] [CrossRef]
  18. Oliva, R.; Daganzo, E.; Kerr, Y.; Mecklenburg, S.; Nieto, S.; Richaume, P.; Gruhier, C. SMOS radio frequency interference scenario: Status and actions taken to improve the RFI environment in the 1400–1427-MHz passive band. IEEE Trans. Geosci. Remote Sens. 2012, 50, 1427–1439. [Google Scholar] [CrossRef] [Green Version]
  19. De Nijs, A.; Parinussa, R.; de Jeu, R.; Schellekens, J.; Holmes, T. A methodology to determine radio frequency interference in AMSR2 observations. IEEE Trans. Geosci. Remote Sens. 2015, 53, 5148–5159. [Google Scholar] [CrossRef]
  20. Holmes, T.; de Jeu, R.; Owe, M.; Dolman, A. Land surface temperature from KA band (37 GHz) passive microwave observations. J. Geophys. Res. 2009, 114, 1–15. [Google Scholar] [CrossRef]
  21. Corbella, I.; Torres, F.; Duffo, N.; Gonzalez-Gambau, V.; Pablos, M.; Martin-Neira, M. MIRAS Calibration and performance: results from the SMOS in-orbit commissioning phase. IEEE Trans. Geosci. Remote Sens. 2011, 49, 3147–3155. [Google Scholar] [CrossRef]
  22. Van der Schalie, R.; de Jeu, R.; Kerr, Y.; Wigneron, J.-P.; Rodriguez Fernandez, N.; Al-Yaari, A.; Parinussa, R.; Mecklenburg, S.; Drusch, M. Towards the merging of radiative transfer based soil moisture data from SMOS and AMSR-E. Remote Sens. Environ. 2017, 189, 180–193. [Google Scholar] [CrossRef]
  23. Van der Schalie, R.; Kerr, Y.; Wigneron, J.-P.; Rodriguez-Fernandez, N.; Al-Yaari, A.; de Jeu, R. Global SMOS soil moisture retrievals from the land parameter retrieval model. Int. J. Appl. Earth Obs. Geoinf. 2016, 45, 125–134. [Google Scholar] [CrossRef]
  24. Meesters, A.; de Jeu, R.; Owe, M. Analytical derivation of the vegetation optical depth from the microwave polarization difference index. IEEE Geosci. Remote Sens. Lett. 2005, 2, 121–123. [Google Scholar] [CrossRef]
  25. De Jeu, R.; Wagner, W.; Holmes, T.; Dolman, A.; van de Giesen, N.; Friesen, J. Global soil moisture patterns observed by space borne microwave radiometers and scatterometers. Surv. Geophys. 2008, 29, 399–420. [Google Scholar] [CrossRef] [Green Version]
  26. Parinussa, R.; Holmes, T.; de Jeu, R. Soil moisture retrievals from the WindSat spaceborne polarimetric microwave radiometer. IEEE Trans. Geosci. Remote Sens. 2012, 50, 2683–2694. [Google Scholar] [CrossRef]
  27. Parinussa, R.; de Jeu, R.; van der Schalie, R.; Crow, W.; Lei, F.; Holmes, T. A quasi-global approach to improve satellite surface soil moisture anomalies through the land surface temperature input. Climate 2016. [Google Scholar] [CrossRef]
  28. Liu, Y.; Parinussa, R.; Dorigo, W.; de Jeu, R.; Wagner, W.; van Dijk, A.; McCabe, M.; Evans, J. Developing an improved soil moisture dataset by blending passive and active microwave satellite-based retrievals. Hydrol. Earth Syst. Sci. 2011, 15, 426–436. [Google Scholar] [CrossRef] [Green Version]
  29. Dorigo, W.; Scipal, K.; Parinussa, R.; Liu, Y.; Wagner, W.; de Jeu, R.; Naeimi, V. Error characterization of global active and passive microwave soil moisture datasets. Hydrol. Earth Syst. Sci. 2010, 14, 2605–2616. [Google Scholar] [CrossRef] [Green Version]
  30. Mo, T.; Choudhury, B.; Schmugge, T.; Wang, J.; Jackson, T. A model for microwave emission from vegetation-covered fields. J. Geophys. Res. 1982, 87, 11229–11237. [Google Scholar] [CrossRef]
  31. Löw, A.; Stacke, T.; Dorigo, W.; de Jeu, R.; Hagemann, S. Potential and limitations of multidecadal satellite soil moisture observations for selected climate model evaluation studies. Hydrol. Earth Syst. Sci. 2013, 17, 3523–3542. [Google Scholar] [CrossRef]
  32. Wigneron, J.-P.; Kerr, Y.; Waldteufel, P.; Saleh, K.; Escorihuela, M.; Richaume, P.; Ferrazzoli, P.; De Rosnay, P.; Gurney, R.; Calvet, J.C. L-band Microwave Emission of the Biosphere (L-MEB) model: Description and calibration against experimental datasets over crop fields. Remote Sens. Environ. 2007, 107, 639–655. [Google Scholar] [CrossRef]
  33. Van de Griend, A.; Wigneron, J.P. On the measurement of microwave vegetation properties: Some guidelines for a protocol. IEEE Trans. Geosci. Remote Sens. 2004, 42, 2277–2289. [Google Scholar] [CrossRef]
  34. Lei, F.; Crow, W.; Shen, H.; Parinussa, R.; Holmes, T. The impact of local acquisition time on the accuracy of microwave surface soil moisture retrievals over the Contiguous United States. Remote Sens. 2015, 7, 13448–13465. [Google Scholar] [CrossRef]
  35. Naeimi, V.; Scipal, K.; Bartalis, Z.; Hasenauer, S.; Wagner, W. An improved soil moisture retrieval algorithm for ERS and METOP scatterometer observations. IEEE Trans. Geosci. Remote Sens. 2009, 47, 1999–2013. [Google Scholar] [CrossRef]
  36. Al-Yaai, A.; Wigneron, J.-P.; Ducharme, A.; Kerr, Y.H.; Wagner, W.; de Lannoy, G.; Reichle, R.; Al Bitar, A.; Dorigo, W.; Richaume, P.; Mialon, A. Global-scale comparison of passive (SMOS) and active (ASCAT) satellite based microwave soil moisture retrievals with soil moisture simulations (MERRA-Land). Remote Sens. Environ. 2014, 152, 614–626. [Google Scholar] [CrossRef] [Green Version]
  37. Crow, W.; Miralles, D.; Cosh, M. A quasi-global evaluation system for satellite based surface soil moisture retrievals. IEEE Trans. Geosci. Remote Sens. 2010, 48, 2516–2527. [Google Scholar] [CrossRef]
  38. Parinussa, R.; Holmes, T.; Yilmaz, T.; Crow, W. The impact of land surface temperature on soil moisture anomaly detection from passive microwave observations. Hydrol. Earth Syst. Sci. 2011, 15, 3135–3151. [Google Scholar] [CrossRef]
  39. Huffman, G.; Adler, R.; Bolvin, D.; Gu, G.; Nelkin, E.; Bowman, K.; Hong, Y.; Stocker, E.; Wolff, D. The TRMM Multisatellite Precipitation Analysis (TMPA): Quasi-global, multiyear, combined-sensor precipitation estimates at fine scales. J. Hydrometeorol. 2007, 8, 38–55. [Google Scholar] [CrossRef]
  40. Reichle, R.; Koster, R. Bias reduction in short records of satellite soil moisture. Geophys. Res. Lett. 2004. [Google Scholar] [CrossRef]
  41. Brocca, L.; Hasenauer, S.; Lacava, T.; Melone, F.; Moramarco, T.; Wagner, W.; Dorigo, W.; Matgen, P.; Martinez-Fernandez, J.; Llorens, P. Soil moisture estimation through ASCAT and AMSR-E sensors: An intercomparison and validation study across Europe. Remote Sens. Environ. 2011, 155, 3390–3408. [Google Scholar] [CrossRef]
  42. Miralles, D.; Crow, W.; Cosh, M. Estimating spatial sampling errors in coarse-scale soil moisture estimates derived from point-scale observations. J. Hydrometeorol. 2010, 11, 1423–1429. [Google Scholar] [CrossRef]
  43. Crow, W.; Zhan, X. Continental-scale evaluation of remotely sensed soil moisture products. IEEE Geosci. Remote Sens. Lett. 2007, 4, 451–455. [Google Scholar] [CrossRef]
  44. Crow, W.; Wagner, W.; Naeimi, V. The impact of radar incidence angle on soil moisture retrieval skill. IEEE Geosci. Remote Sens. Lett. 2010, 7, 501–505. [Google Scholar] [CrossRef]
  45. Zwieback, S.; Dorigo, W.; Wagner, W. Estimation of the temporal autocorrelation structure by the collocation technique with emphasis on soil moisture studies. Hydrol. Sci. J. 2013, 58, 1729–1747. [Google Scholar] [CrossRef]
Figure 1. Additional datasets used in this study that were provided as supporting information for interpretation purposes include (a) the annual mean TRMM 3B42 (v.7) precipitation product (mm); and (b) NDVI data [-] over the mainland of the People’s Republic of China.
Remotesensing 09 00149 g001
Figure 2. Examples of the verification techniques that were used in this study: the RMSE from the Triple Collocation (a), an error metric; and the precipitation-based Rvalue (b), a performance metric. TRMM precipitation only covers until 50° North (see Section 2.3.3), hence the northeastern part of the country could not be evaluated through the Rvalue.
Remotesensing 09 00149 g002
Figure 3. Results from the Triple Collocation that play a central role in this section. Results were further analysed and several influencing factors such as retrieval algorithms, observation frequencies and radiometer characteristics were isolated.
Remotesensing 09 00149 g003
Figure 4. Results from the Rvalue technique for the soil moisture anomalies detected by the MWRI and AMSR2 radiometers in an attempt to confirm findings from the Triple Collocation.
Remotesensing 09 00149 g004
Figure 5. A direct comparison of the Triple Collocation and Rvalue techniques for the soil moisture anomalies from MWRI-LPRMv06. Colours correspond to NDVI values, which demonstrate a reduced performance by both metrics under increasing vegetation density.
Remotesensing 09 00149 g005
Figure 6. Spatial patterns representing the RMSE reduction over the study area after the LPRM algorithm update (LPRMv06) compared to the baseline (LPRMv05) for Fengyun-3B MWRI.
Remotesensing 09 00149 g006
Figure 7. The percentage of days in which microwave sensors can be converted to surface soil moisture over the entire analysis period (2012–2015) for the three passive microwave sensors considered in this study: MWRI (a), AMSR2 (b) and SMOS (c).
Remotesensing 09 00149 g007
Table 1. A comprehensive overview of satellite- and sensor characteristics relevant for this study. Columns 2 to 4 present the characteristics of the passive microwave sensors, whereas the 5th column presents those of the active microwave sensor.
CharacteristicsFengyun-3B MWRIGCOM-W AMSR2SMOS MIRASMetOp ASCAT
Low frequency10.65 GHz6.9 & 10.65 GHz1.4 GHz5.3 GHz
Bandwidth0.18 GHz0.35 & 0.10 GHz0.20 GHzN/A
Sensor accuracy0.5 K0.3 K & 0.6 K2–5 K0.50 dB
PolarizationH and V all frequenciesH and V all frequenciesH and V all incidence anglesH and V all frequencies
Incidence angle(s)55.4°55°Multiple25°–65°
Sample size footprint51 km × 85 km35 km × 62 km24 km × 42 km23–350 km25 km × 50 km
Altitude836 km700 km760 km837 km
Swath width1400 km1445 km1000 km2 x 550 km
Orbit typePolarPolarPolarPolar
Ascending orbit01:30 pm01:30 pm06:00 am09.30 pm
Descending orbit01:30 am01:30 am06:00 pm09.30 am
Data period usedJanuary 2012 to December 2015July 2012 to December 2015January 2012 to December 2015January 2012 to December 2015
Table 2. This table provides an overview of all surface soil moisture products that were evaluated, including the sequential steps from product combinations A–E following a number of isolated focus points that include algorithms, satellite platform and observation frequencies.
Product CombinationNumberSatellite SensorPath Overpass TimeAlgorithm VersionFrequencyExplicit Focus of Comparison
1Fengyun-3B MWRIDescending 01:30 amLPRMv05X-band 10.7 GHz
ALPRM algorithm version comparison
2Fengyun-3B MWRIDescending 01:30 amLPRMv06X-band 10.7 GHz
BPassive microwave radiometer comparison
3GCOM-W AMSR2Descending 01:30 amLPRMv06X-band 10.7 GHz
CPassive microwave frequency comparison
4GCOM-W AMSR2Descending 01:30 amLPRMv06C-band 6.9 GHz
DPassive microwave radiometer & frequency comparison
5SMOS MIRASAscending 06:00 amLPRMv06L-band 1.4 GHz
ESMOS algorithm comparison
6SMOS MIRASAscending 06:00 amL-MEBL-band 1.4 GHz

