
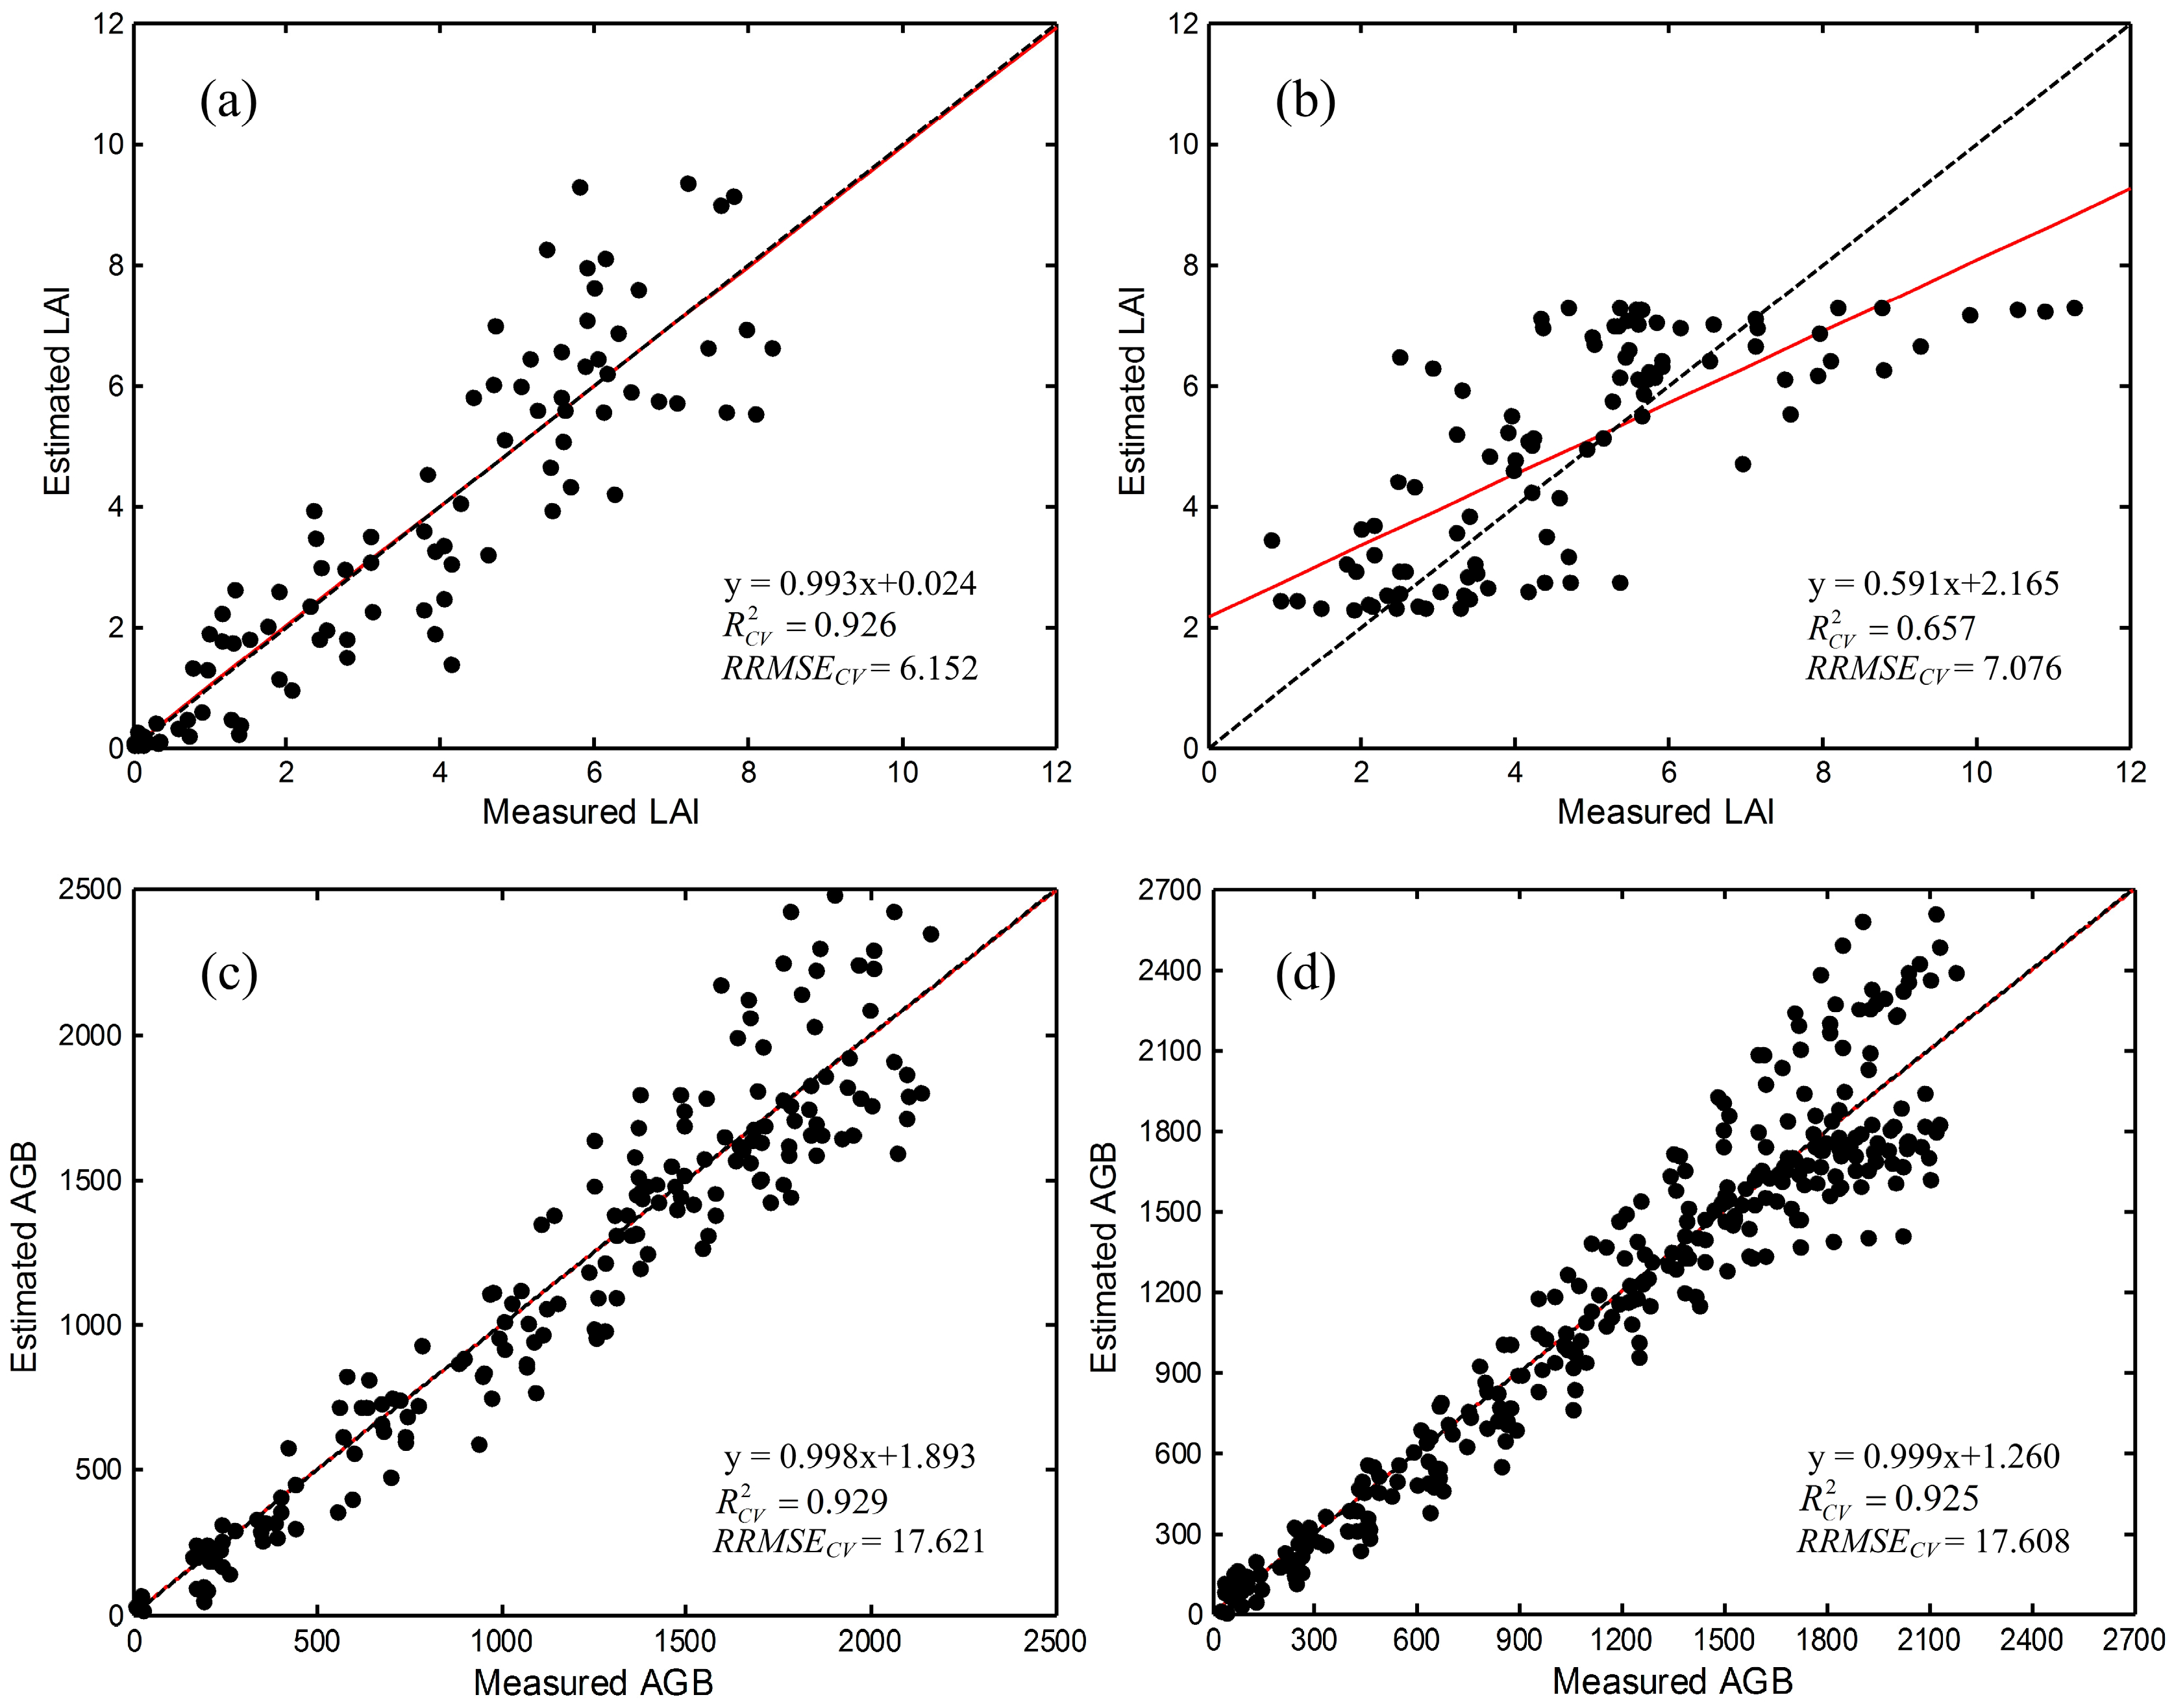
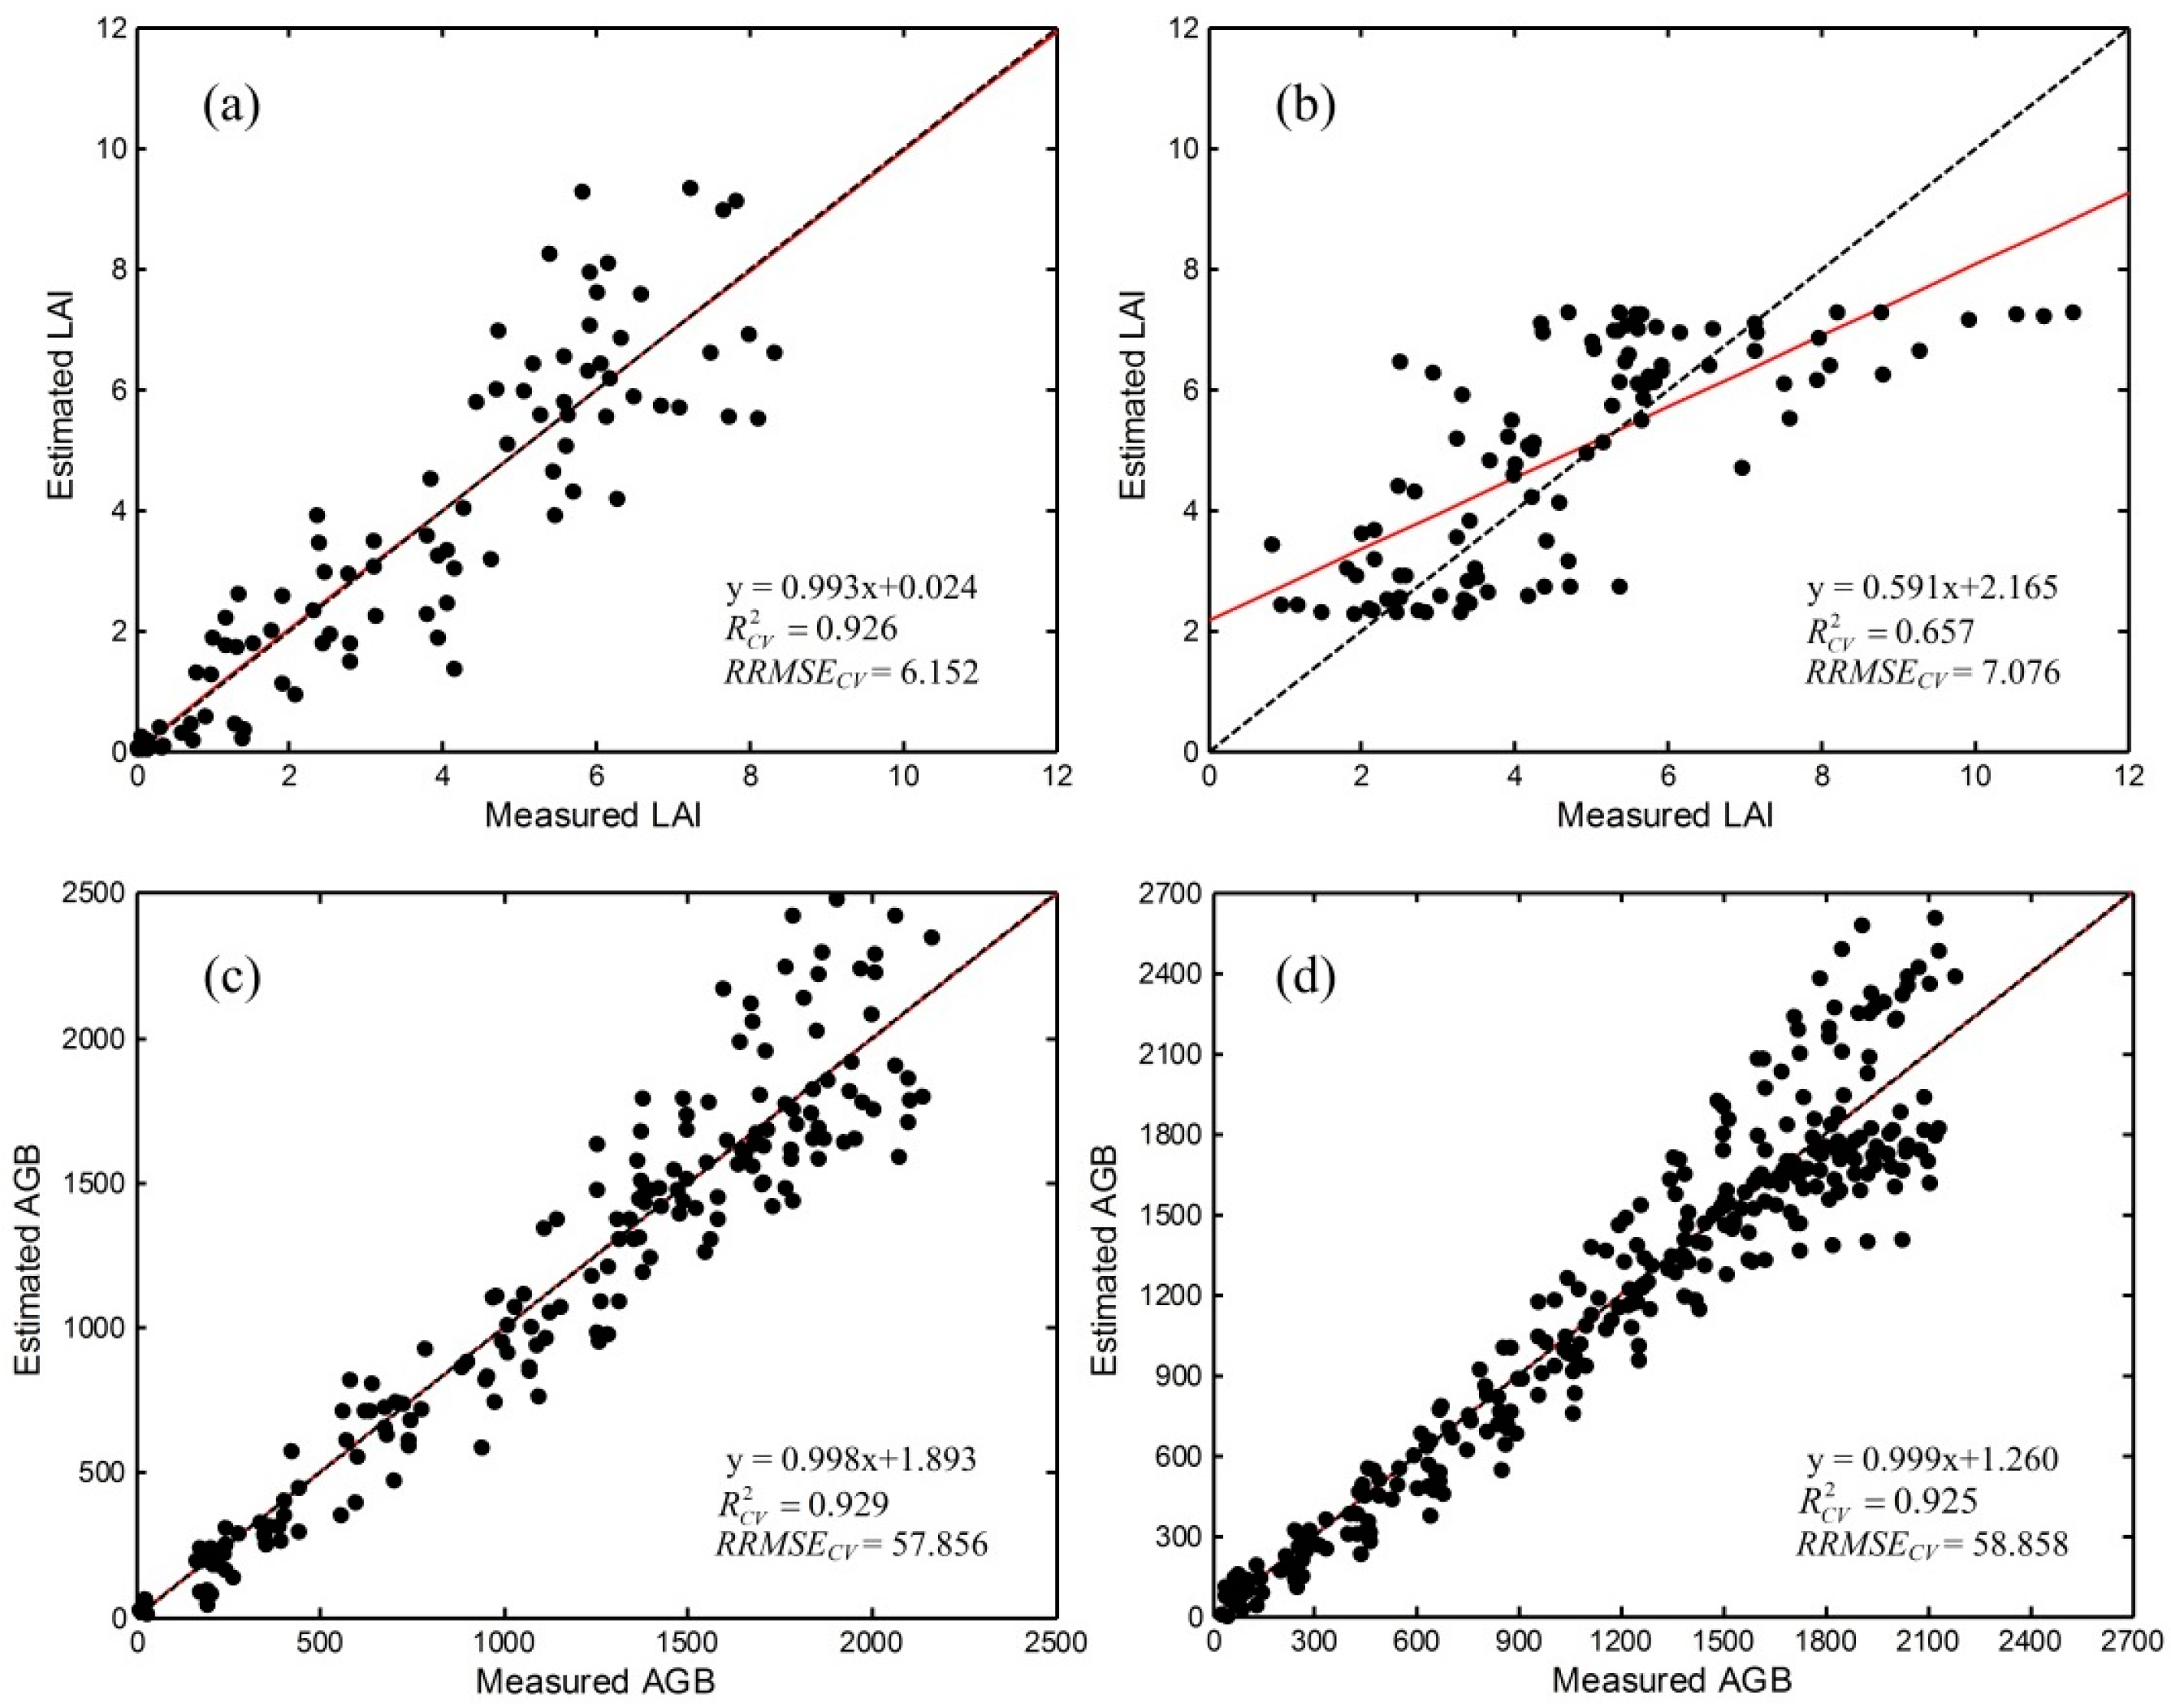
Correction: Wang, J., et al. Dynamic Mapping of Rice Growth Parameters Using HJ-1 CCD Time Series Data. Remote Sens. 2016, 8, 931


| Growth Stages | LAI | AGB | ||||||
|---|---|---|---|---|---|---|---|---|
| VI | Model | RRMSECV | VI | Model | RRMSECV | |||
| All stages | EVI2 | E | 0.358 | 10.210 | cu EVI2 | Q | 0.923 | 59.912 |
| B | 0.362 | 10.193 | B | 0.918 | 60.586 | |||
| S | 0.444 | 9.968 | S | 0.921 | 107.08 | |||
| NDVI | E | 0.275 | 10.798 | cu NDVI | Q | 0.929 | 57.856 | |
| B | 0.334 | 10.460 | B | 0.922 | 58.984 | |||
| S | 0.467 | 10.185 | S | 0.927 | 105.371 | |||
| Before heading | EVI2 | E | 0.831 | 6.074 | cu EVI2 | Q | 0.909 | 54.037 |
| B | 0.926 | 6.152 | B | 0.901 | 57.484 | |||
| S | 0.900 | 6.776 | S | 0.884 | 96.317 | |||
| NDVI | P | 0.644 | 8.960 | cu NDVI | Q | 0.922 | 50.150 | |
| B | 0.615 | 9.023 | B | 0.902 | 53.759 | |||
| S | 0.629 | 10.363 | S | 0.920 | 86.899 | |||
| After heading | EVI2 | E | 0.421 | 8.036 | cu EVI2 | Q | 0.481 | 61.331 |
| B | 0.474 | 8.019 | B | 0.474 | 65.122 | |||
| S | 0.416 | 8.205 | S | 0.571 | 60.499 | |||
| NDVI | E | 0.496 | 7.607 | cu NDVI | Q | 0.516 | 59.562 | |
| B | 0.610 | 8.630 | B | 0.426 | 53.759 | |||
| S | 0.657 | 7.076 | S | 0.573 | 59.378 | |||
| Growth Stages | LAI | AGB | ||||||
|---|---|---|---|---|---|---|---|---|
| VI | Model | RRMSECV | VI | Model | RRMSECV | |||
| All stages | EVI2 | E | 0.358 | 10.210 | cu EVI2 | Q | 0.923 | 18.247 |
| B | 0.362 | 10.193 | B | 0.918 | 18.452 | |||
| S | 0.444 | 9.968 | S | 0.921 | 32.613 | |||
| NDVI | E | 0.275 | 10.798 | cu NDVI | Q | 0.929 | 17.621 | |
| B | 0.334 | 10.460 | B | 0.922 | 17.964 | |||
| S | 0.467 | 10.185 | S | 0.927 | 32.092 | |||
| Before heading | EVI2 | E | 0.831 | 6.074 | cu EVI2 | Q | 0.909 | 25.317 |
| B | 0.926 | 6.152 | B | 0.901 | 26.932 | |||
| S | 0.900 | 6.776 | S | 0.884 | 45.126 | |||
| NDVI | P | 0.644 | 8.960 | cu NDVI | Q | 0.922 | 23.496 | |
| B | 0.615 | 9.023 | B | 0.902 | 25.187 | |||
| S | 0.629 | 10.363 | S | 0.920 | 40.714 | |||
| After heading | EVI2 | E | 0.421 | 8.036 | cu EVI2 | Q | 0.481 | 15.067 |
| B | 0.474 | 8.019 | B | 0.474 | 15.998 | |||
| S | 0.416 | 8.205 | S | 0.571 | 14.862 | |||
| NDVI | E | 0.496 | 7.607 | cu NDVI | Q | 0.516 | 14.632 | |
| B | 0.610 | 8.630 | B | 0.426 | 13.207 | |||
| S | 0.657 | 7.076 | S | 0.573 | 14.587 | |||

Reference
- Wang, J.; Huang, J.F.; Gao, P.; Wei, C.W.; Mansaray, L.R. Dynamic Mapping of Rice Growth Parameters Using HJ-1 CCD Time Series Data. Remote Sens. 2016, 8, 931. [Google Scholar] [CrossRef]
© 2017 by the authors. Licensee MDPI, Basel, Switzerland. This article is an open access article distributed under the terms and conditions of the Creative Commons Attribution (CC BY) license ( http://creativecommons.org/licenses/by/4.0/).
Share and Cite
Wang, J.; Huang, J.; Gao, P.; Wei, C.; Mansaray, L.R. Correction: Wang, J., et al. Dynamic Mapping of Rice Growth Parameters Using HJ-1 CCD Time Series Data. Remote Sens. 2016, 8, 931. Remote Sens. 2017, 9, 94. https://doi.org/10.3390/rs9020094
Wang J, Huang J, Gao P, Wei C, Mansaray LR. Correction: Wang, J., et al. Dynamic Mapping of Rice Growth Parameters Using HJ-1 CCD Time Series Data. Remote Sens. 2016, 8, 931. Remote Sensing. 2017; 9(2):94. https://doi.org/10.3390/rs9020094
Chicago/Turabian StyleWang, Jing, Jingfeng Huang, Ping Gao, Chuanwen Wei, and Lamin R. Mansaray. 2017. "Correction: Wang, J., et al. Dynamic Mapping of Rice Growth Parameters Using HJ-1 CCD Time Series Data. Remote Sens. 2016, 8, 931" Remote Sensing 9, no. 2: 94. https://doi.org/10.3390/rs9020094