
Radiometric Cross-Calibration of GF-4 in Multispectral Bands


1
State Key Laboratory of Remote Sensing Science, Institute of Remote Sensing and Digital Earth, Chinese Academy of Sciences, Beijing 100101, China
2
College of Resources and Environment, University of Chinese Academy of Sciences, Beijing 100049, China
*
Authors to whom correspondence should be addressed.
Remote Sens. 2017, 9(3), 232; https://doi.org/10.3390/rs9030232
Submission received: 22 January 2017
/
Accepted: 1 March 2017
/
Published: 3 March 2017
Abstract
:The GaoFen-4 (GF-4), launched at the end of December 2015, is China’s first high-resolution geostationary optical satellite. A panchromatic and multispectral sensor (PMS) is onboard the GF-4 satellite. Unfortunately, the GF-4 has no onboard calibration assembly, so on-orbit radiometric calibration is required. Like the charge-coupled device (CCD) onboard HuanJing-1 (HJ) or the wide field of view sensor (WFV) onboard GaoFen-1 (GF-1), GF-4 also has a wide field of view, which provides challenges for cross-calibration with narrow field of view sensors, like the Landsat series. A new technique has been developed and used to calibrate HJ-1/CCD and GF-1/WFV, which is verified viable. The technique has three key steps: (1) calculate the surface using the bi-directional reflectance distribution function (BRDF) characterization of a site, taking advantage of its uniform surface material and natural topographic variation using Landsat Enhanced Thematic Mapper Plus (ETM+)/Operational Land Imager (OLI) imagery and digital elevation model (DEM) products; (2) calculate the radiance at the top-of-the atmosphere (TOA) with the simulated surface reflectance using the atmosphere radiant transfer model; and (3) fit the calibration coefficients with the TOA radiance and corresponding Digital Number (DN) values of the image. This study attempts to demonstrate the technique is also feasible to calibrate GF-4 multispectral bands. After fitting the calibration coefficients using the technique, extensive validation is conducted by cross-validation using the image pairs of GF-4/PMS and Landsat-8/OLI with similar transit times and close view zenith. The validation result indicates a higher accuracy and frequency than that given by the China Centre for Resources Satellite Data and Application (CRESDA) using vicarious calibration. The study shows that the new technique is also quite feasible for GF-4 multispectral bands as a routine long-term procedure.
1. Introduction
Since the first Chinese land observation satellite, the China Brazil Earth Resource Satellite (CBERS-01), launched in 1999, signifying an unprecedented milestone in Chinese satellite remote sensing history, several series of Chinese land observation satellites have been developed, like HuanJing (HJ), ZiYuan (ZY), ShiJian (SJ), and GaoFen (GF). The GF-1 satellite was successfully launched on 27 April 2013 by the China Centre for Resources Satellite Data and Application (CRESDA). As the first satellite promoted by the high-definition Earth observation system (HDEOS) by the Chinese government, GF-1 initiates a new era for high-resolution land observation data applications. After that, GF-2, GF-3, and GF-4 have been successfully launched into space. Another three or four satellites in HDEOS are expected to be launched in the next ten years in succession [1]. Launched on 31 December 2015, GF-4 is China’s first civilian high-resolution geostationary optical satellite. GF-4 has the highest spatial resolution of all of the Chinese geostationary orbit satellites, and no similar satellite is available in the world.
GF-4 runs in geostationary orbit of 36,000 km and a stationary position of 105.6°, and is configured with a visible and near infrared (NIR) camera and an intermediate infrared camera, with the all-weather monitoring ability of visible and infrared bands. The spatial resolution of the visible and NIR camera is 50 m and spatial resolution of the intermediate infrared camera is 400 m, which realizes the combination of high temporal resolution and high spatial resolution. The GF-4 has similar channels to the HJ-1 and GF-1 in multispectral bands (GF-4 multispectral bands in this paper are written as GF-4/PMS, and the HJ-1 and GF-1 multispectral bands are abbreviated as Hj-1/CCD and GF-1/WFV, respectively, hereafter). The primary characteristics of GF-1, HJ-1, and GF-4 in multispectral bands are listed in Table 1.
GF-4 will provide fast, reliable, and stable optical remote sensing data for various applications, such as disaster reduction, forestry, earthquakes, and meteorology, which will add a new technical method for disaster risk forecasting, forest fire monitoring, seismic tectonic information extraction, and weather monitoring. GF-4 also has a great potential and broad application space in environmental protection, marine observation, agriculture, water conservancy, and other industries and regional applications. However, as we all know, like HJ-1 and GF-1, GF-4 lacks onboard calibration capabilities, which limits the applications of the satellite. In order to better use GF-4 satellite data quantitatively, alternative calibration methods need to be developed.
Zhong et al. developed a new cross-calibration technique in 2014 for moderate-to high-spatial-resolution data with large-angle observation and validated the approach by applying it to cross-calibration of HJ-1/CCD [2]. In this method, the Landsat Enhanced Thematic Mapper (TM) plus (ETM+) and Advanced Spaceborne Thermal Emission and Reflection Radiometer global digital elevation model (ASTER GDEM) product are used to develop a model of a desert site’s bi-directional reflectance distribution function (BRDF). With the retrieved BRDF, the surface reflectance under the HJ-1/CCD’s solar illumination and view geometries of the calibration site are simulated. Then the top-of-atmosphere (TOA) can be calculated using the atmospheric radiative transferring model. The method has performed very well for different HJ-1/CCD sensors in consecutive years and satisfies the requirement of 5% error from ground measurements for radiometric calibration procedures. In 2015, Yang et al. updated the method and cross-calibrated the GF-1/WFV [3]. This improvement is mainly reflected in two aspects: (1) the Operational Land Imager (OLI) onboard Landsat-8 (Landsat-8/OLI) with the same radiometric resolution as GF-1/WFV is used to replace the Landsat TM/ETM+; and (2) the DEM extracted by the three-line camera sensor (TLC) onboard ZiYuan 3 (called ZY-3 DEM, hereafter) with higher horizontal resolution is used instead of the ASTER GDEM. The BRDF characterization retrieved by the updated method has high accuracy (difference errors of surface reflectance between simulations using the BRDF characterization and actual values is less than 5%) and more detail for the higher spatial radiometric resolution of DEM products and higher radiometric resolution than the OLI. The updated method was validated using the synchronized OLI images in the Dunhuang test site, and the result showed a high accuracy and less error (almost less than 5%) with that calculated with the given calibration coefficients by CRESDA (and could even reach 30%).
GF-4/PMS has a wide field of view, like HJ-1/CCD and GF-1/WFV, which provides challenges for cross-calibration using the Landsat series with narrow field. This study attempts to demonstrate that the new cross-calibration method is also feasible for GF-4/PMS. The cross-calibration of GF-4/PMS is conducted using the above technique based on the Landsat-8/OLI imagery and DEM extracted by the ZY-3/TLC. Then the fitted calibration coefficients are cross-validated using the image pairs of GF-4/PMS and Landsat-8/OLI with similar transit times and close view zenith.
2. Materials and Methods
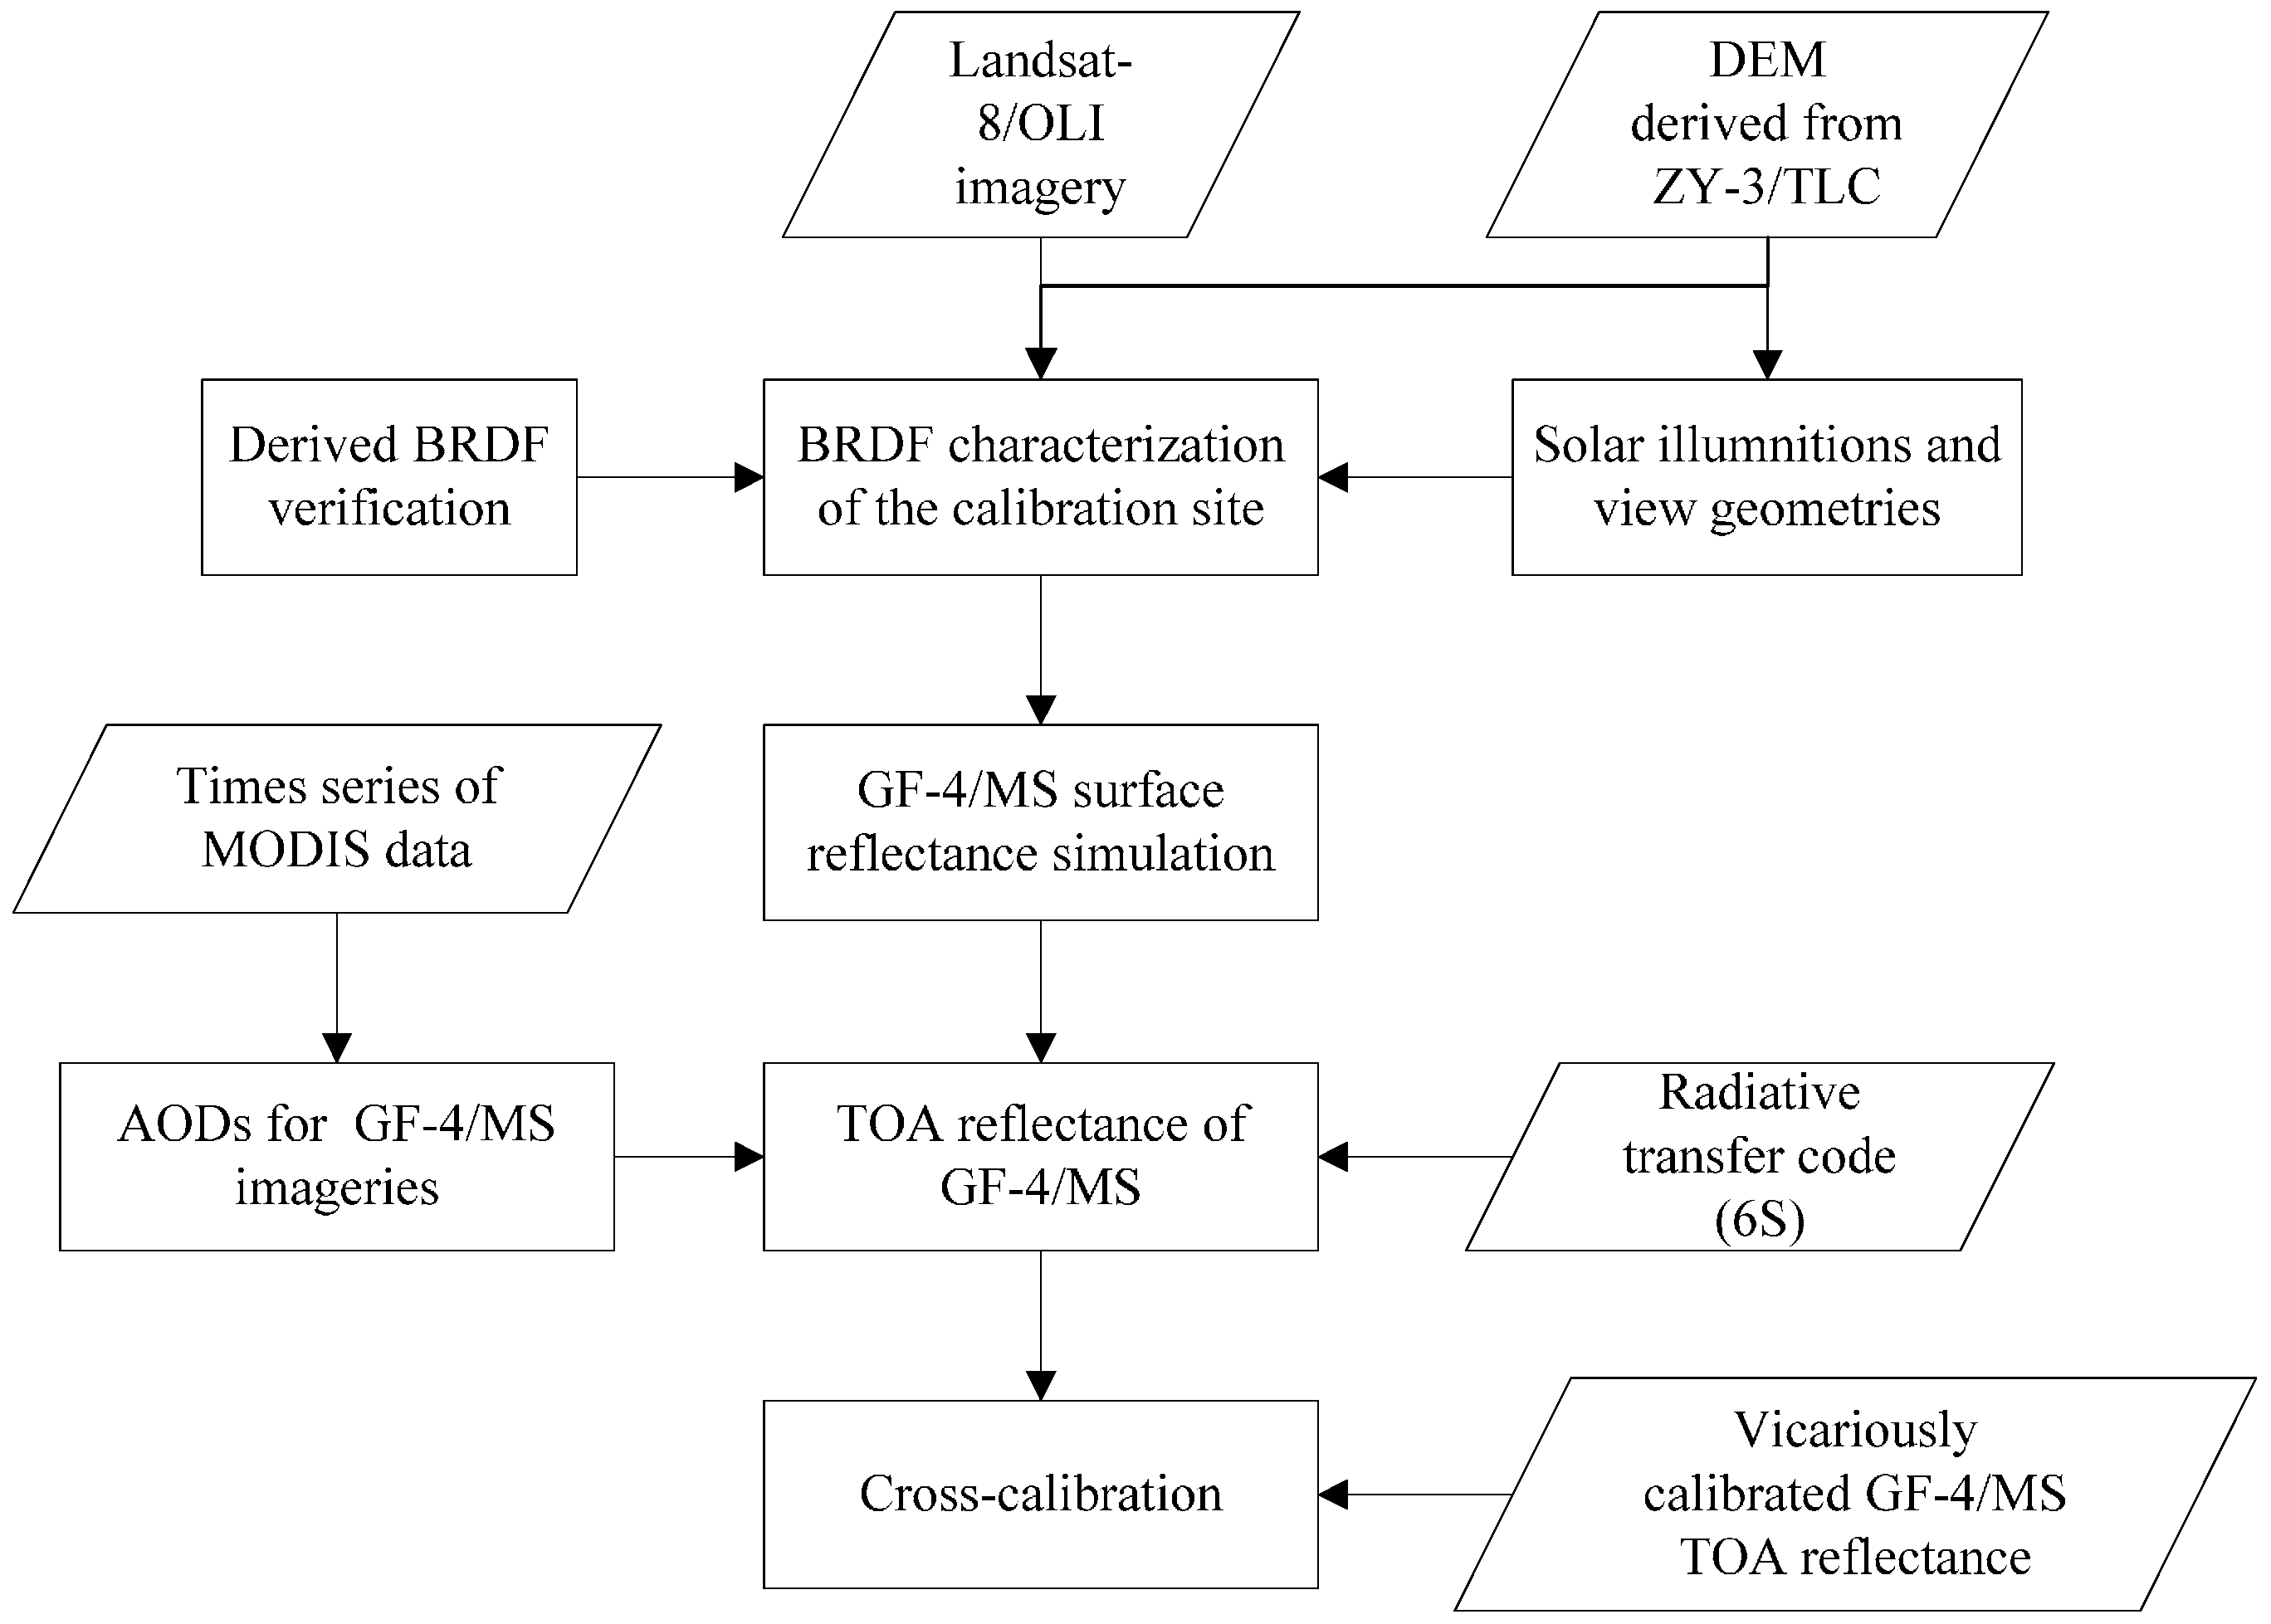
In this paper, a cross-sensor calibration technique for moderate- to high-spatial-resolution data with large-angle observation is used. The well-calibrated nadir view of Landsat-8/OLI data and the DEM product derived from ZY-3/TLC are firstly used together to fit the BRDF characterization of the calibration site. The retrieved BRDF is then used to simulate the surface reflectance under GF-4/PMS’s solar illumination and view geometries. Thirdly, the TOA reflectance of PMS is calculated using the simulated surface reflectance and Aerosol Optical Depths (AODs) retrieved by times series of MODIS data. Finally, the cross-calibration of GF-4/PMS is performed. The procedure is illustrated in Figure 1 and the major steps are discussed below in detail.
2.1. Test Site
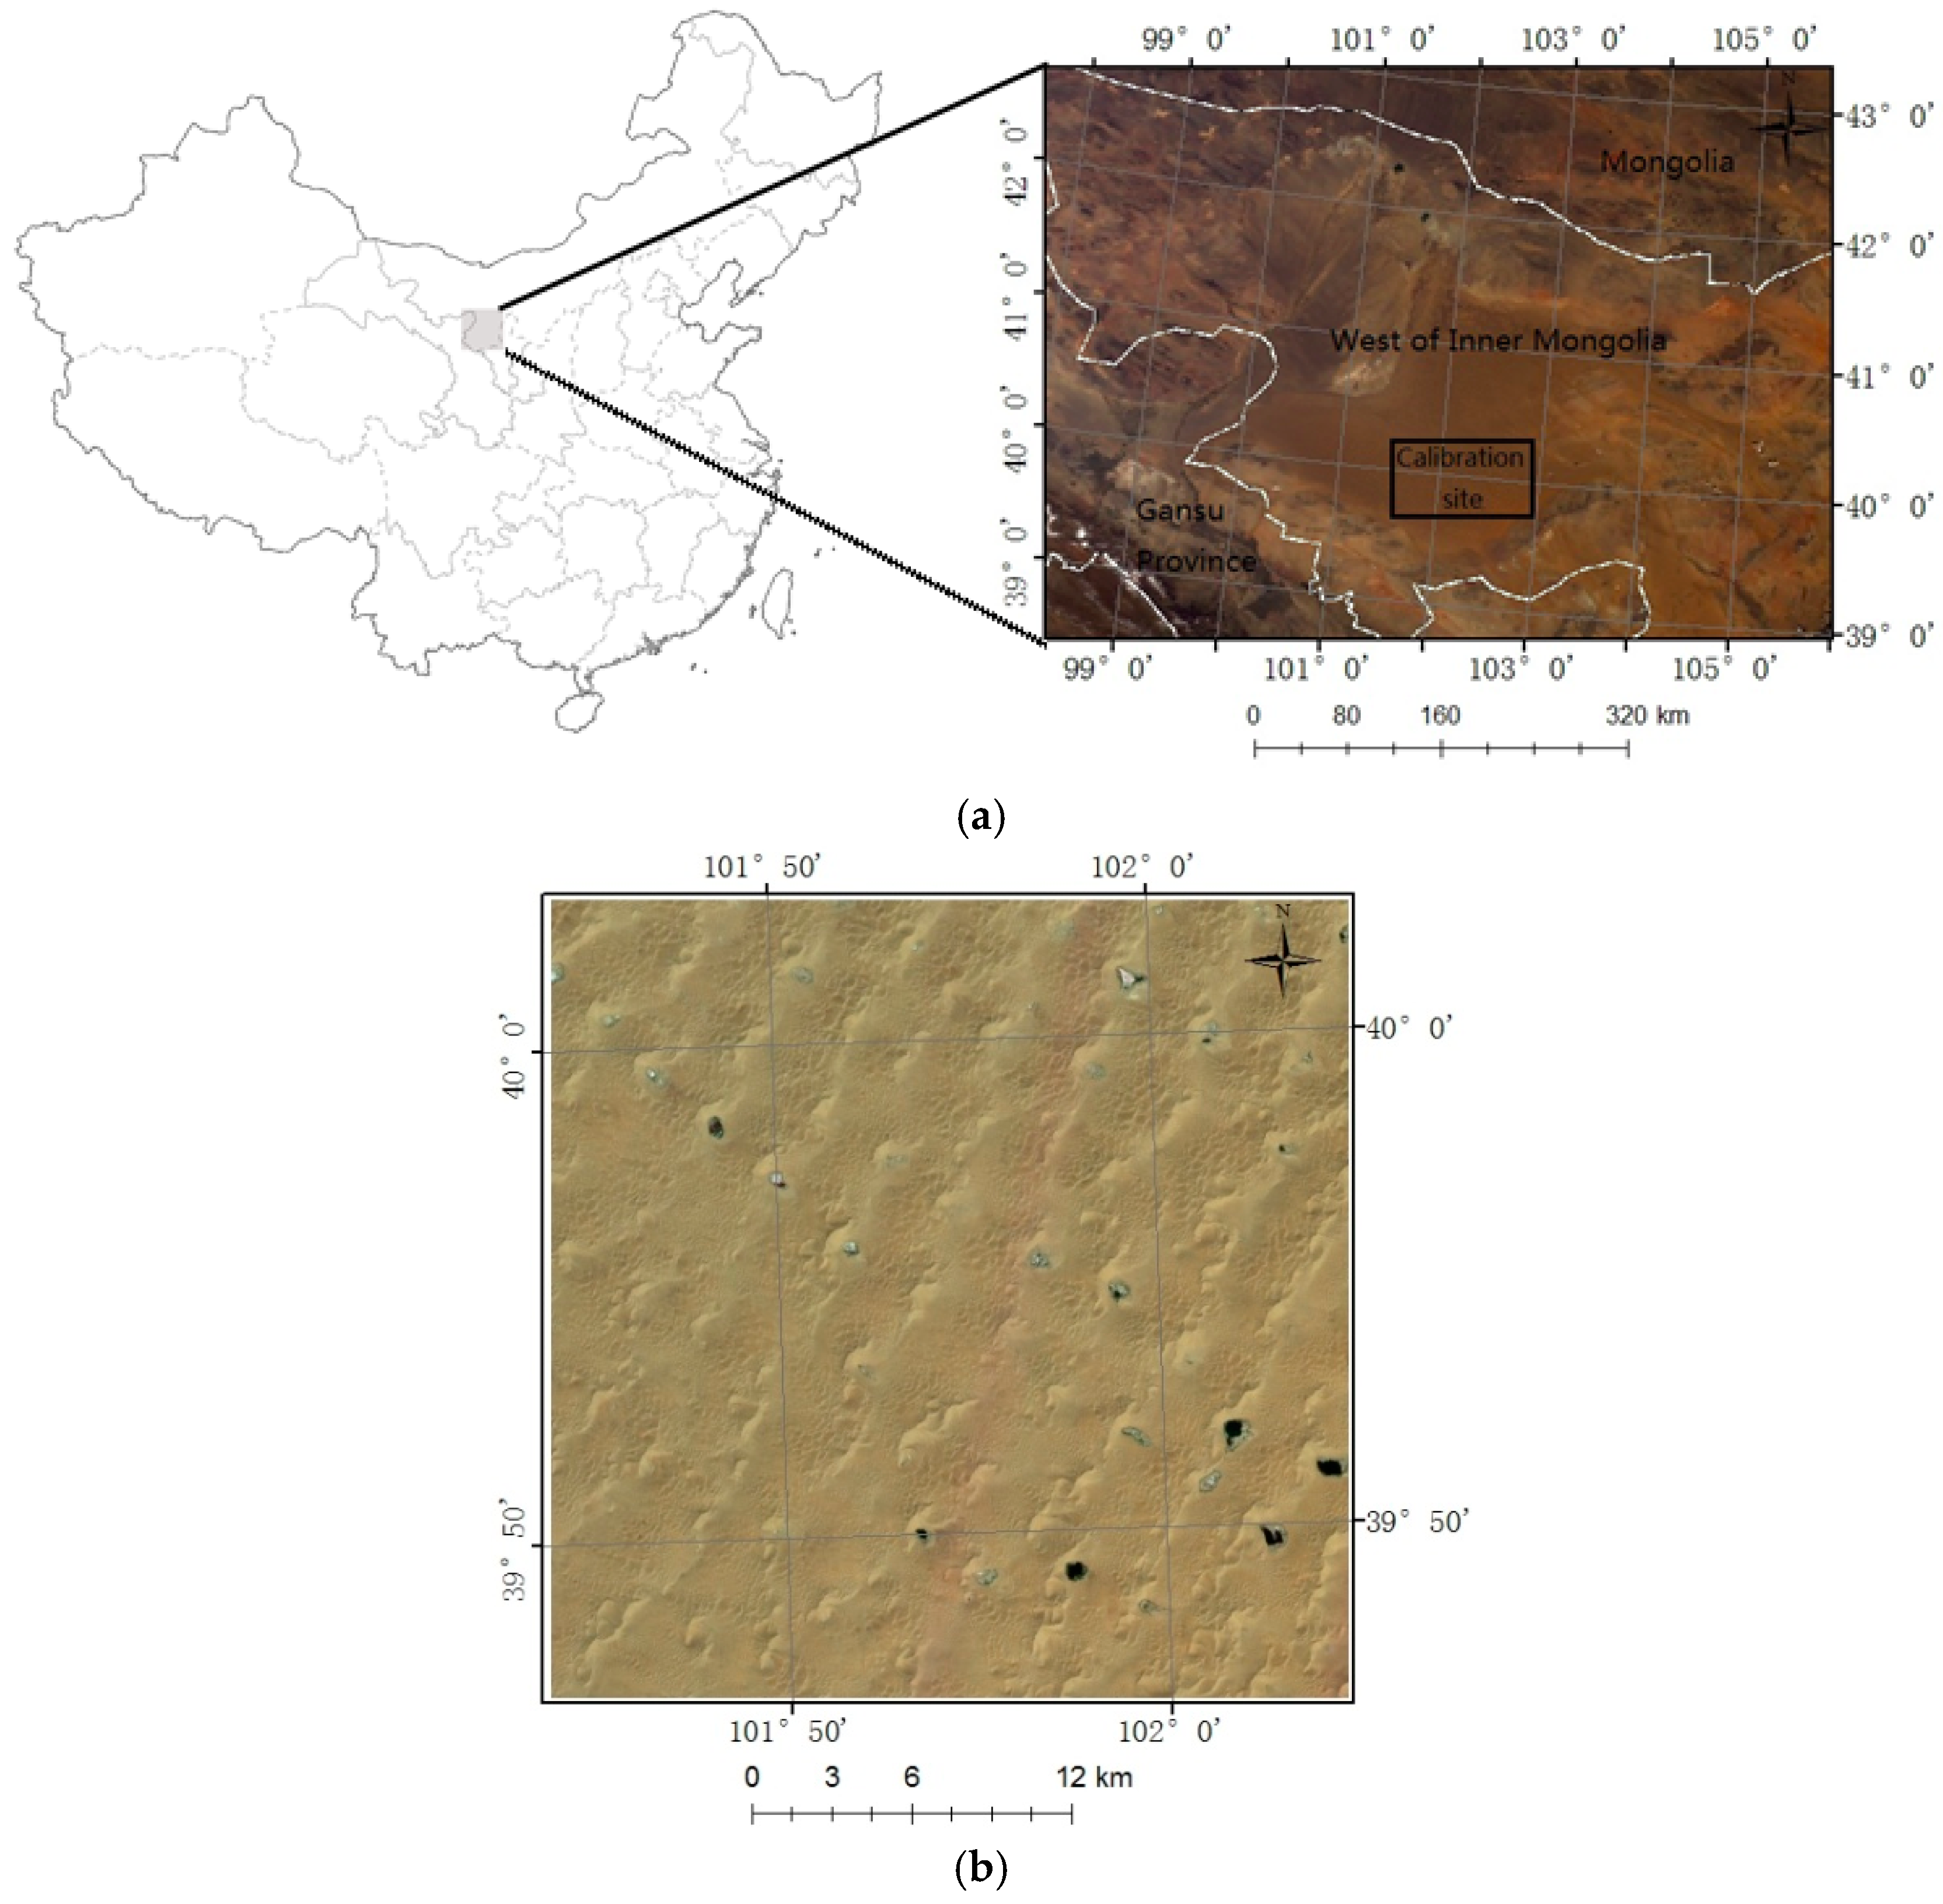
In the approach developed by Zhong [2] and Yang [3], a calibration site of about 30 × 30 km in the Badain Jaran Desert is chosen, located in Central Inner Mongolia of Northern China (Figure 2). The selection items are from the following consideration: First, the area is temporally, spatially, and radiationally stable in brightness, spatial homogeneity, altimetry, and bidirectional effects, seasonal variation, and long-term stability; Second, a large number of clean lakes are located in the calibration site, which can be used to determine the aerosol optical depth (AOD) accurately as dark objects (DO) with the DO method [4]. Third, sand is the main surface material in this area and the topography is hilly, which offers a wide range of slopes and aspects to retrieve the BRDF. In this paper, the above-mentioned calibration site is still selected and the corresponding Landsat-8/OLI, ZY-3/TLC, and GF-4/PMS data covering this site are collected.
2.2. Data
Landsat-8 was launched to continue the Landsat mission of monitoring Earth systems and capturing changes at relatively high spatial resolution as one of the sensors of the Landsat Data Continuity Mission (LDCM) [5]. In addition to fulfilling Landsat’s goal in data continuity, Landsat-8 also offers some significant improvements in both data quality and spectral coverage [6,7,8,9]. Landsat-8 has an Operational Land Imager (OLI) and a Thermal Infrared Sensor (TIRS) onboard. The Landsat-8/OLI is designed by Ball Aerospace and Technology Corporation (BATC) and it includes nine bands covering the visible, near-infrared, and short-wave infrared portions of the spectrum [10].
The Landsat-8/OLI has exceptional radiometric stability. The calibration accuracy and continuity of the Landsat-8/OLI are performed through pre-launch, on-board, and vicarious calibration techniques [11,12]. Prior to launch, radiance calibration is primarily used in an integration sphere, with the assistance of noise characterization, linearity, stray light, bright target recovery, and ghosting [13,14]. The OLI includes an on-board radiometric calibration system to monitor changes in performance throughout the mission time, and techniques such as lunar views and side slither manoeuvers are also used to monitor the calibration system of the OLI [12]. During the commissioning phase, Landsat-8 was temporarily placed in an intermediary orbit, where it drifted relative to Landsat-7. This provided nearly simultaneous imaging for approximately three days, making data comparisons and cross-calibration possible [15]. Furthermore, the early ground-based vicarious radiometric calibration of Landsat-8/OLI is performed, and the results show that the comparison between the TOA spectral radiance obtained by the OLI and the ground-based measurements show exceptional agreement (bands 1–6 < 1%, band 7 < 5%) [15]. Czapla-Myers et al. [16] used the reflectance-based approach and the radiometric calibration test site to examine the stability of the Landsat-8/OLI instrument, and the results show the TOA spectral radiance calculated by the two methods agree with the ground-based measurements (5% uncertainty for the reflectance-based approach, and 3%–4% uncertainty for the radiometric calibration test site method). In addition, practical and repeatable comparative analyses of the Landsat-7/ETM+ and the Landsat-8/OLI were conducted by Peng et al. [17] from spectral bands and vegetation indices, and the results showed that the two sensors had high similarity (the R2 was greater than 0.96) though subtle differences existed. Therefore, the ETM+ and OLI imagery can be used as complementary data. The radiometric stability of the Landsat-8/OLI makes it a good reference sensor for cross-calibrating GF-4/PMS.
The ZY-3 satellite is the first Chinese civilian high-resolution stereo-mapping satellite. It is equipped with a three-line array panchromatic camera (TLC) and one multispectral scanner [18,19,20]. The TLC camera has three scanners, including one nadir-viewing panchromatic scanner with a 2.1 m resolution, one forward-viewing panchromatic scanner with a 3.6 m resolution, and one backward viewing panchromatic scanner with a 3.6 m resolution. The spectral ranges of the forward, backward, and nadir scanners are all 500–800 nm, covering the visible and near-infrared portions of the spectrum. The swath width of the forward and backward images is approximately 52 km, and that of the nadir image is approximately 51 km. The revisit period of each independent scanner on-board ZY-3 is approximately 3–5 days. The primary characteristics of ZY-3 are listed in Table 2. The applications of ZY-3’s data are primarily cartography, DEM modelling, and resource investigation [17,21,22].
In this paper, we use the DEM extraction function model providing by the Environment for Visualizing Images (ENVI) software to extract the DEM data. The slope and aspect are also calculated from the ZY-3 DEM using the function model.
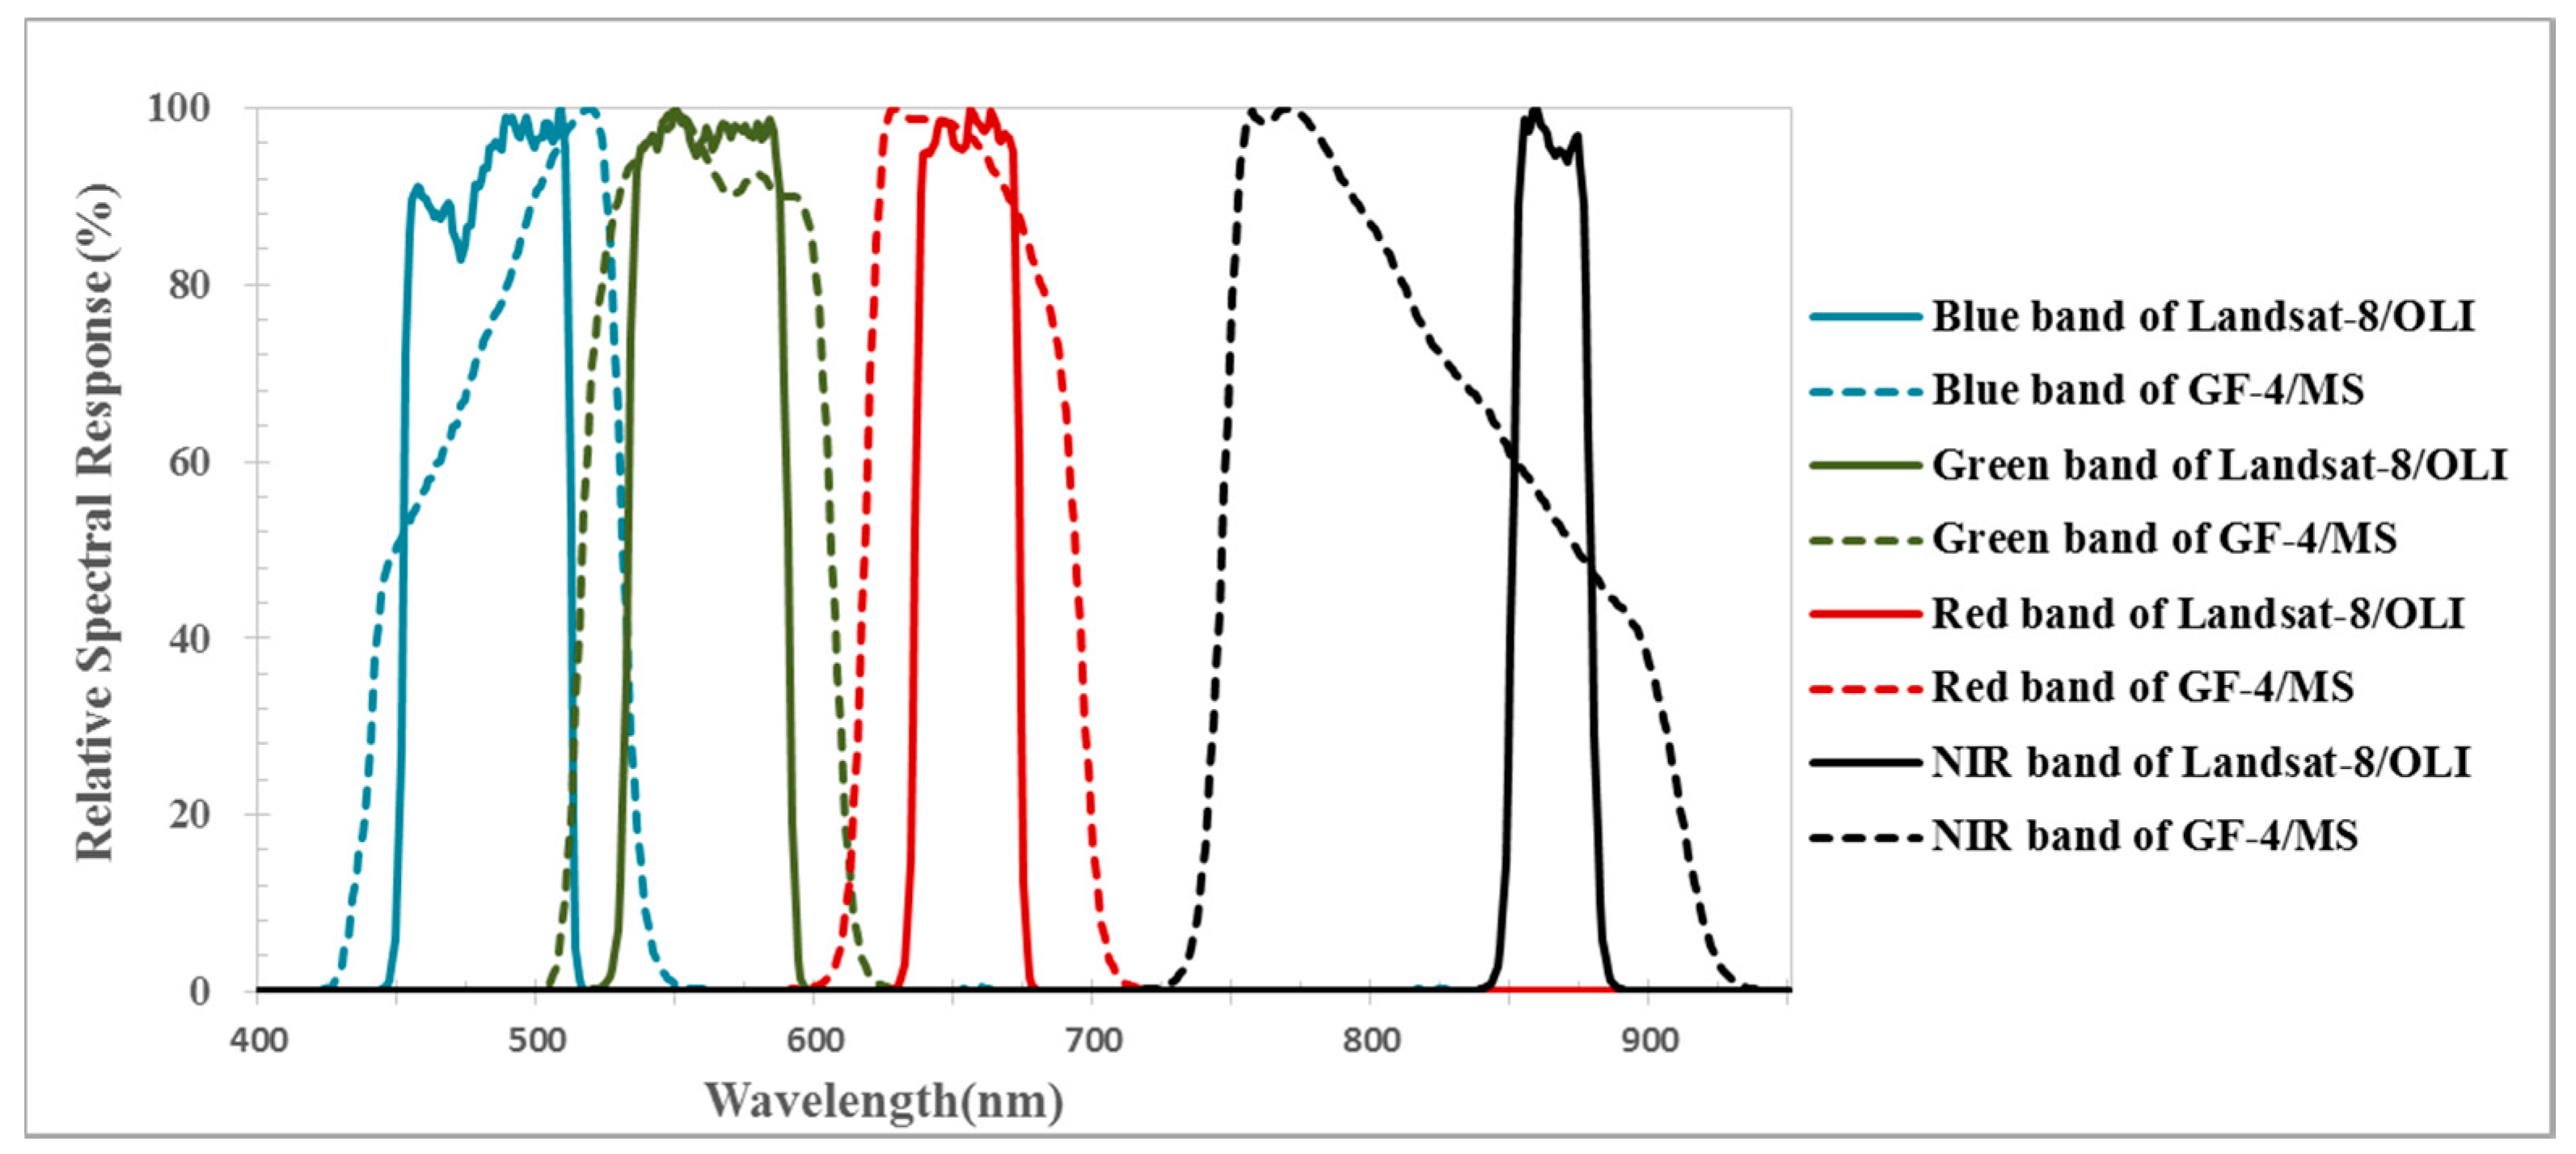
2.3. Spectra Matching
Before performing the cross-calibration of the GF-4/PMS, we first estimate the spectral properties. The spectral response function (SPF) of the GF-4/PMS and the Landsat-8/OLI are plotted in Figure 3. To derive the GF-4/PMS reflectance of the calibration site, the spectral discrepancy is taken into account and the spectral matching factor is used. Given the ground-measured spectrum of the site, and the SPFs of both the GF-4/PMS and Landsat-8/OLI, the spectral matching factor can be calculated by the Equation (1) [2,3,23]:
where and are the relative spectral response functions for the GF-4/PMS and Landsat-8/OLI, respectively. is the spectral range of the PMS; is the spectral range of the OLI. The ground-measured spectrum of the calibration site we used in this paper comes from the measurement in Badain Jaran desert in 2012. We calculate the spectral matching factor between the GF-4/PMS and OLI, respectively, and show them in Table 3.
3.2. Radiometric Capability of GF-4/PMS
In order to have overall knowledge of the radiometric capability of the GF-4/PMS, long time series clear images (without cloud and haze contamination) are selected. The TOA reflectance of GF-4/PMS in multispectral bands can be calculated using Equation (2):
where is the TOA reflectance; is the TOA radiance; is the distance between the Sun and the Earth; is the solar elevation; and is the solar irradiance at the top of atmosphere and published by CRESDA through its website [24], listed in Table 4. The unit for is .
can be calculated using Equation (3) for laboratory calibration, and Equation (4) for vicarious calibration:
where is the digital reading from the GF-4/PMS image, and are the coefficients from the laboratory calibration (listed in Table 5), and is the coefficient come from vicarious calibration (listed in Table 6). , , and gain are relevant to the integration time and published by CRESDA through its website separately [24]. The unit for is .
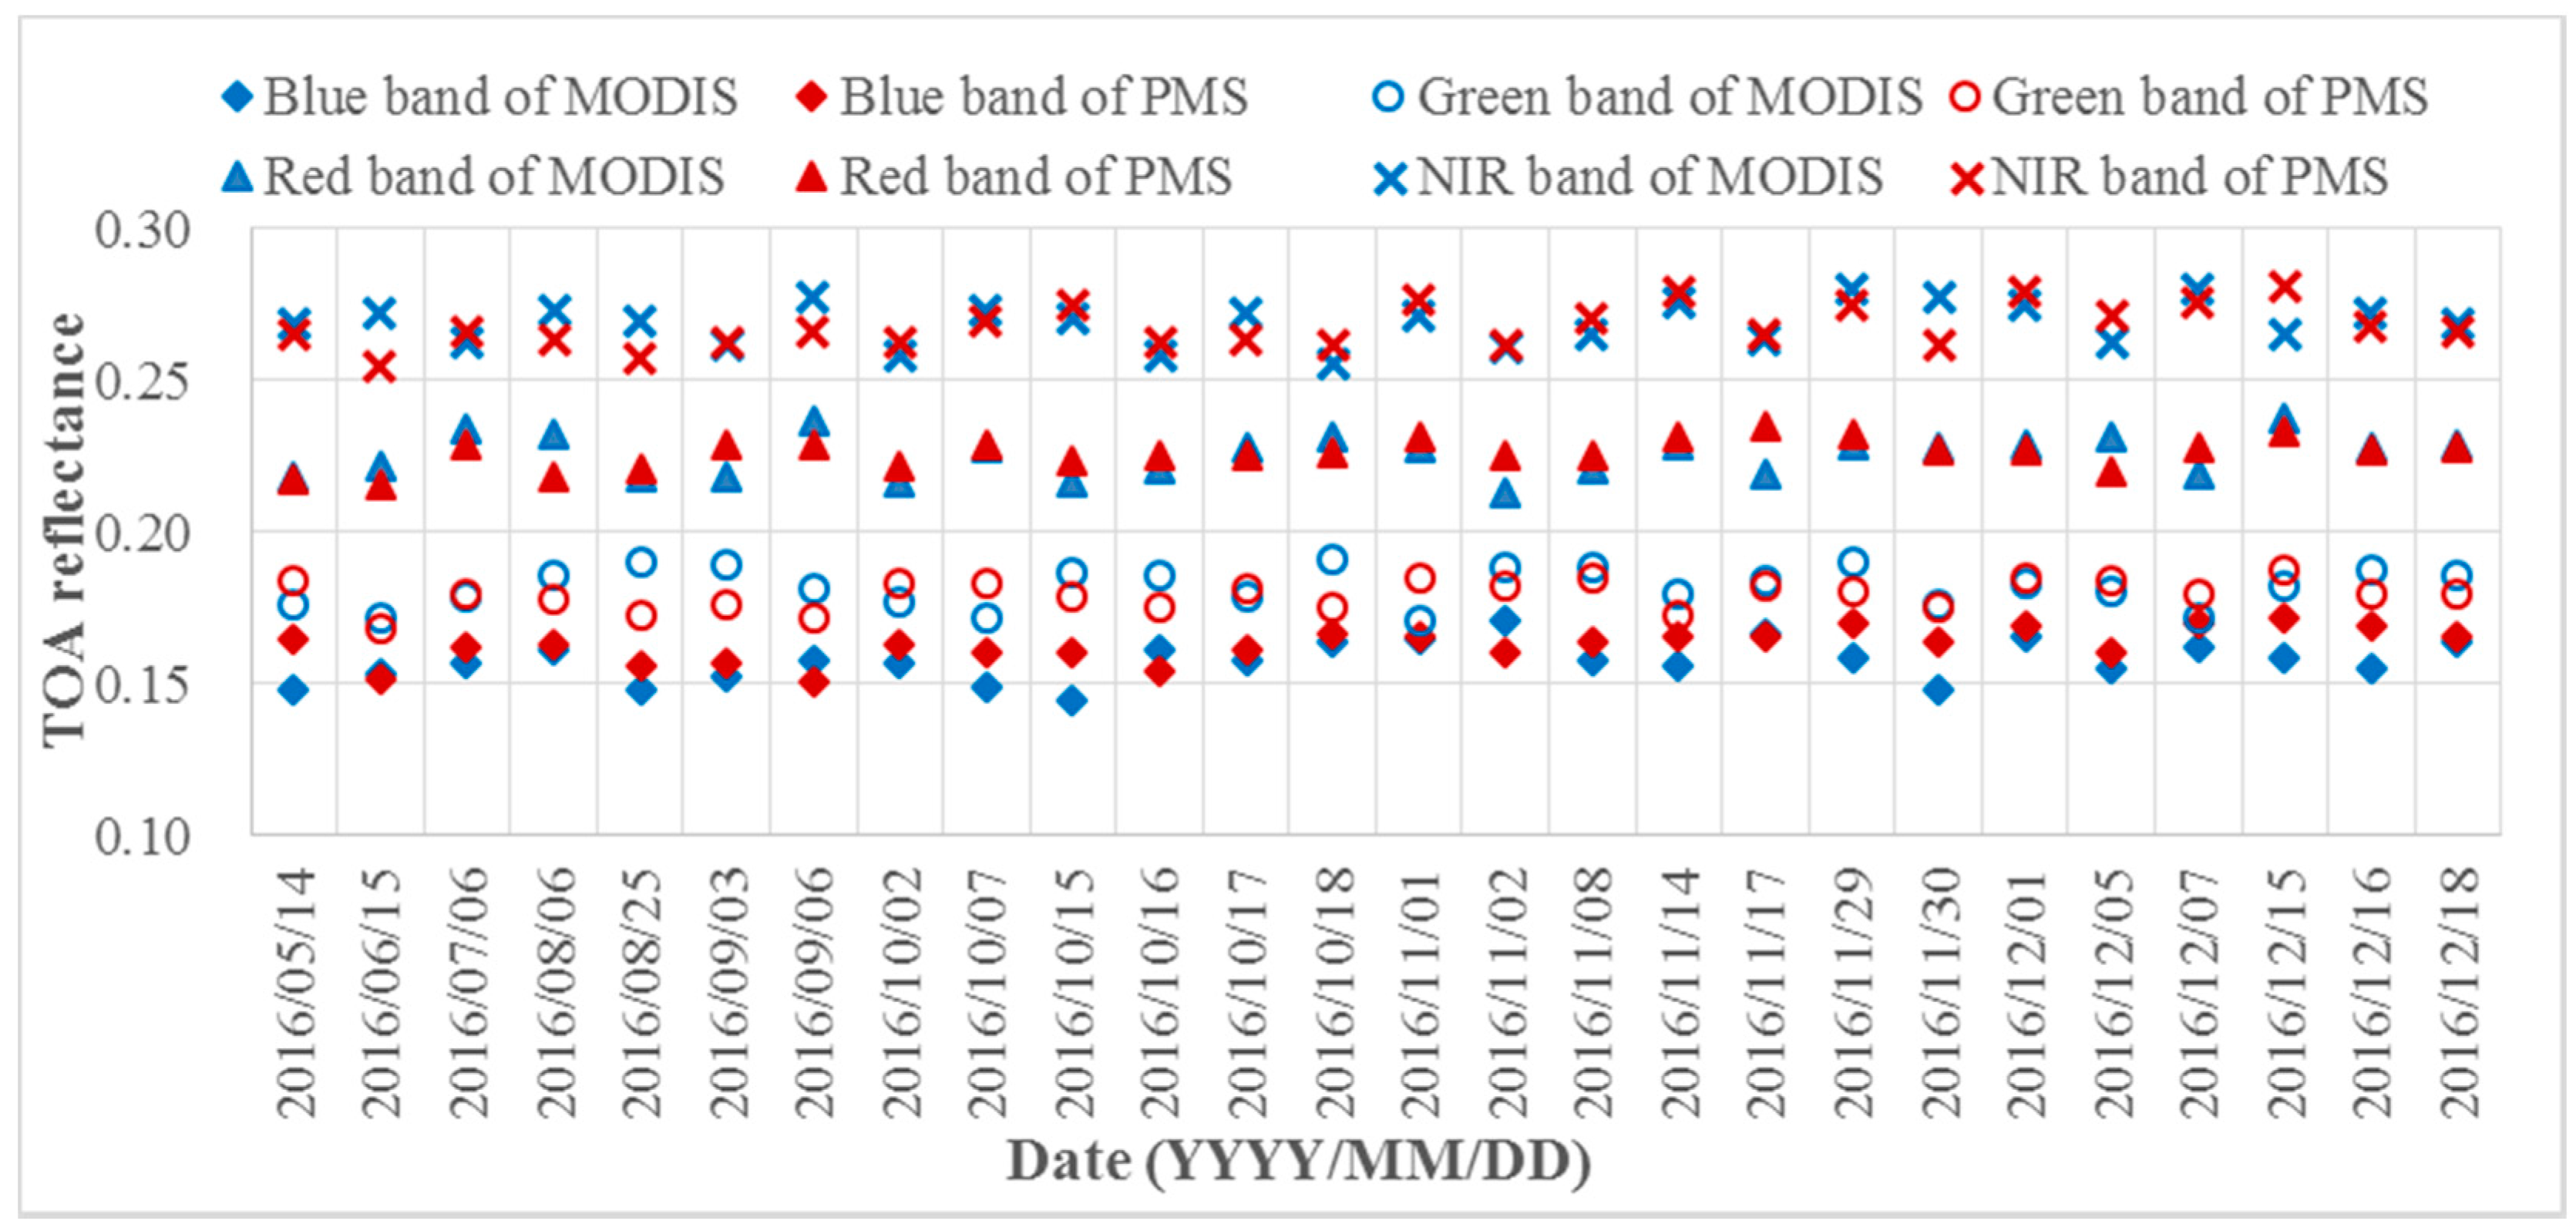
In order to evaluate the radiometric capability of the GF-4/PMS, we use data from MODIS as a reference to check the variations of GF-4/PMS data. MODIS is a state-of-art instrument with very high radiometric capacity and it has very high temporal frequency, so we compare the TOA reflectance of the GF-4/PMS data with MODIS level 1b data (500 m resolution) including MOD02 (Level-1B Calibrated Geolocation Dataset) and MOD03 (Geolocation Dataset). In order to make them comparable we define several criteria: (1) they have very close passing time, which removes the influence of atmosphere condition changes; (2) they have very close view zenith (difference within 10°), which removes of bidirectional effect; (3) they lack cloud contamination; and (4) the GF-4/PMS is resampled to 500 m. Before the evaluation, the spectral matching factors in four bands between MODIS and PMS are calculated using Equation (1). The MODIS instrument has a state-of-the-art onboard calibration system with an absolute accuracy better than 2% [26]. We plot out the scatterplot of the TOA reflectance of the image pairs in Figure 4. Compared with MODIS, the radiometry of the GF-4/PMS after both laboratory calibration and vicarious calibration are varied. The long-term tendency of MODIS’ TOA reflectance remains consistent and the slope values are very close to 0, which indicates a very small variation trend. Furthermore, the standard deviations of MODIS’ TOA reflectance are within 0.02. However, the maximum difference of TOA reflectance between MODIS and the GF-4/PMS calculated using laboratory calibration coefficients can be as high as 92.39% for the blue band, 37.12% for the green band, 20.76% for the red band, and 23.20% for the NIR band, while the maximum difference of TOA reflectance between MODIS and the GF-4/PMS calculated using vicarious calibration coefficients is 52.61% for the blue band, 35.11% for the green band, 17.75% for the red band, and 18.15% for the NIR band. The TOA reflectance of the PMS after vicarious calibration are slightly better than that after laboratory calibration, which means the radiometric capability has been changed due to the environmental factors of space and instrument aging since the GF-4/PMS launched. Although the calibration site is very stable with time, the long-term tendency of the TOA reflectance of these GF-4/PMS images are not stable, as gradual calibration drifts are observed. By comparison with MODIS, the PMS after vicarious calibration still has a worse radiometric capability, both in stability and accuracy.
Sensors’ radiometric capability can be expected to change during launch and on-orbit operations because of the varying space environment and instrument aging [27]. In order to correct the changes, regular and reliable onboard absolute calibration are required to assure a sensor’s radiometric capability with good accuracy and stability. For those satellite sensors with spaceborne calibration systems, like Moderate Resolution Imaging Spectroradiometer (MODIS), the spectral response shifts and bandwidth changes on-orbit can be tracked by the onboard calibrator. For some satellites’ sensors without onboard calibration calibrators, such as AVHRR, they use vicarious calibration techniques once a month to provide full aperture calibrations with relatively high accuracy as an independent evaluation of the sensor performance [28].
However, most of Chinese remote sensing satellite sensors lack onboard calibrators, like the GF-4/PMS, and radiometric calibration has been updated only once a year based on a vicarious calibration procedure. The radiometric capability of these sensors cannot be monitored in real-time and the degradation cannot be corrected in a timely manner, which has great influence on the application of the data. A highly frequent procedure for calibration could be a solution for the instability. Thus, the cross-calibration of the GF-4/PMS is necessary.
2.5. Cross-Calibration of the GF-4/PMS
To obtain accurate BRDF characterizations of the calibration site, the surface reflectance needs to be retrieved first. The steps of the BRDF characterization fitting including the following [2,3]:
- (1)
- Collect clean OLI images covered the calibration desert site;
- (2)
- Retrieve the AOD at 550 nm using the DO method. There are many clear lakes located in the calibration site, which can be seen as the dark objects. First, calculate the radiance of these selected images, and record the radiance on the clear lakes area in the blue band since the reflectance in clean water bodies is low (about 5%) and the radiance can be seen as atmospheric path radiation;
- (3)
- Build the 6S model. Firstly, a set of parameters are set up as input, including the atmospheric model, serosol model, geometrical condition (including solar zenith, solar azimuth, view zenith, and view azimuth), wavelength, surface reflectance, and a set of AODs. In these parameters, only AOD can be changed, and every input AOD corresponds to a TOA radiance as the output. Consequently, the relationship between AOD and TOA radiance can be set up. Therefore, the AODs for all of the selected images can be retrieved. The atmospheric effect can be corrected with the retrieved AODs for these selected images since the site is hardly influenced by human activities. Finally, the surface reflectance of these selected images is calculated; and
- (4)
- Establish a 4-D lookup table (LUT) as the BRDF characterization with the solar zenith angle of slope, view zenith angle of slope, and the relative azimuth angle of slope as inputs, and the surface reflectance as the output. Given any combination of solar zenith angle, view zenith angle, and relative azimuth angle input for the LUT, the output is a unique interpolated surface reflectance. Notably, the calculated slope and aspect are in a local coordinate system, while the solar illuminations and view geometries are in the global coordinate system, so coordinates in the global coordinate system need to be converted to those in the local coordinate system.
Since the calibration site is not only homogeneous, but also covers an area of only 30 km × 30 km, the AOD variation can be assumed to be negligible. An updated AOD retrieval algorithm by Zhong and Liang [29] is based the previous algorithm by Liand and Zhong [30] using MODIS imagery. Detection the ‘clearest’ observation during a multi-temporal window for each pixel is the central idea of the algorithm. The algorithm mainly contains the following steps: (1) prepare MODIS multi-temporal images and complete the data preprocessing; (2) determine AOD for the ‘clearest’ day by the DO method mentioned above using the OLI imagery; (3) sort the long time series images of MODIS by visual interpretation and select the ‘clearest’ observation during the temporal window and detect the ‘clearest’ pixel; (4) retrieve the surface reflectance of the ‘clearest’ pixels using the 6S model; (5) fit the site’s BRDF using the Staylor-Suttles BRDF model [31]; (6) retrieve the surface reflectance of all pixels containing the ‘hazy’ pixels using the Staylor-Suttles BRDF model; and (7) retrieve the AOD using the MODTRAN radiant transfer code [32]. With the above procedures, we can retrieve the AOD of any MODIS image. Since the calibration is stable, given any GF-4/PMS image, its AOD can be calculated by the corresponding MODIS image with the same transit date with the GF-4/PMS image, although the two images may have a short difference of transit time.
In this paper, 16 GF-4/PMS images are selected. The acquisition times, sun angles, and the retrieved AODs of these images are listed in Table 7.
With the derived surface reflectance and the AOD retrieved by MODIS imagery, the TOA radiance of GF-4/PMS is calculated using the 6S model. An example of the simulated TOA radiance and its corresponding GF-4/PMS image on 15 June 2016 in blue and green bands are shown in Figure 5. The mean TOA radiance and DN for every GF-4/PMS image are listed in Table 8.
3. Results
The calibration coefficients for the GF-4/PMS can be calculated using Equation (1). The gains can be directly used for the radiometric calibration of the GF-4/PMS without considering the integration time. The calibration coefficients retrieved in this paper are shown in Table 9.
The calibration coefficients fixed in this paper are slightly different with that published by CRESDA, so further verification is needed. We know that the Working Group on Calibration and Validation of the Committee on Earth Observation Satellites always take ground measurements of land surface spectra and atmospheric parameters at the Dunhuang test site, which could be used to verify our result as actual data. Unfortunately, we have lack enough synchronized ground measurement data, so we select the OLI imagery covering the Dunhuang test site as the reference data for cross-validation. Using the GF-4/PMS synchronized data, the procedure is carried out by the following steps:
- (1)
- Choose image pairs of the GF-4/PMS and OLI with similar transit times at the Dunhuang test site; the information of these chosen image pairs are listed in Table 10.
- (2)
- Calculate the TOA reflectance of these GF-4/PMS images using the site calibration coefficients published by CRESDA and fixed in this paper, separately. The TOA reflectance of the GF-4/PMS can be calculated using Equations (2) and (3).
- (3)
- Calculate the TOA reflectance of these OLI images using its given calibration coefficients published in the header files. The radiance of Landsat-8/OLI image can be calculated using Equation (5):where is the TOA reflectance; is the band-specific multiplicative rescaling factor from the metadata (REFLECTANCE_MULT_BAND_X, where X is the band number); is the band-specific additive rescaling factor from the metadata (REFLECTANCE _ADD_BAND_X, where X is the band number); and is the quantized and calibrated standard product pixel values (DN); and is the solar elevation.ρλ = (Mρ·Qcal + Aρ)/sin(θSE)
- (4)
- Compare the three sets of TOA reflectance. The comparison results are listed in Table 11.
Compared to the TOA reflectance from synchronized OLI images, almost all of the errors of the TOA reflectance calculated with the calibration coefficients in this paper are less than 5%, more than half of those are less than 3%, and only a few of those are over 5% and less than 7%, which are much less than that calculated with the given calibration coefficients by CRESDA, whose error could reach as high as 40%. Consequently, the calibration coefficients retrieved in this paper have much higher accuracy and the cross-calibration method performs excellently for the GF-4/PMS.
In order to observe the improvement before and after the cross-calibration of the GF-4/PMS, we compared the TOA reflectance between the PMS after cross-calibration and MODIS images, and the results are shown in Figure 6. The maximum difference of TOA reflectance between MODIS and GF-4/PMS is 11.09% for the blue band, 9.33% for the green band, 7.34% for the red band and 6.61% for the NIR band. From the comparison, the tendency of the TOA reflectance of PMS has been more stable, and the TOA reflectance values are closer with MODIS. All of the above proved that the radiometric capability of the GF-4/PMS has been improved by cross-calibration.
4. Discussion
Compared with the given calibration coefficients provided once a year, the updated cross-calibration method can provide as many calibration coefficients as possible only if there is GF-4/PMS imagery at the Badain Jaran Desert calibration site without cloud contamination. The cross-calibration method can be made a routine procedure for cross-calibrating GF-4/PMS.
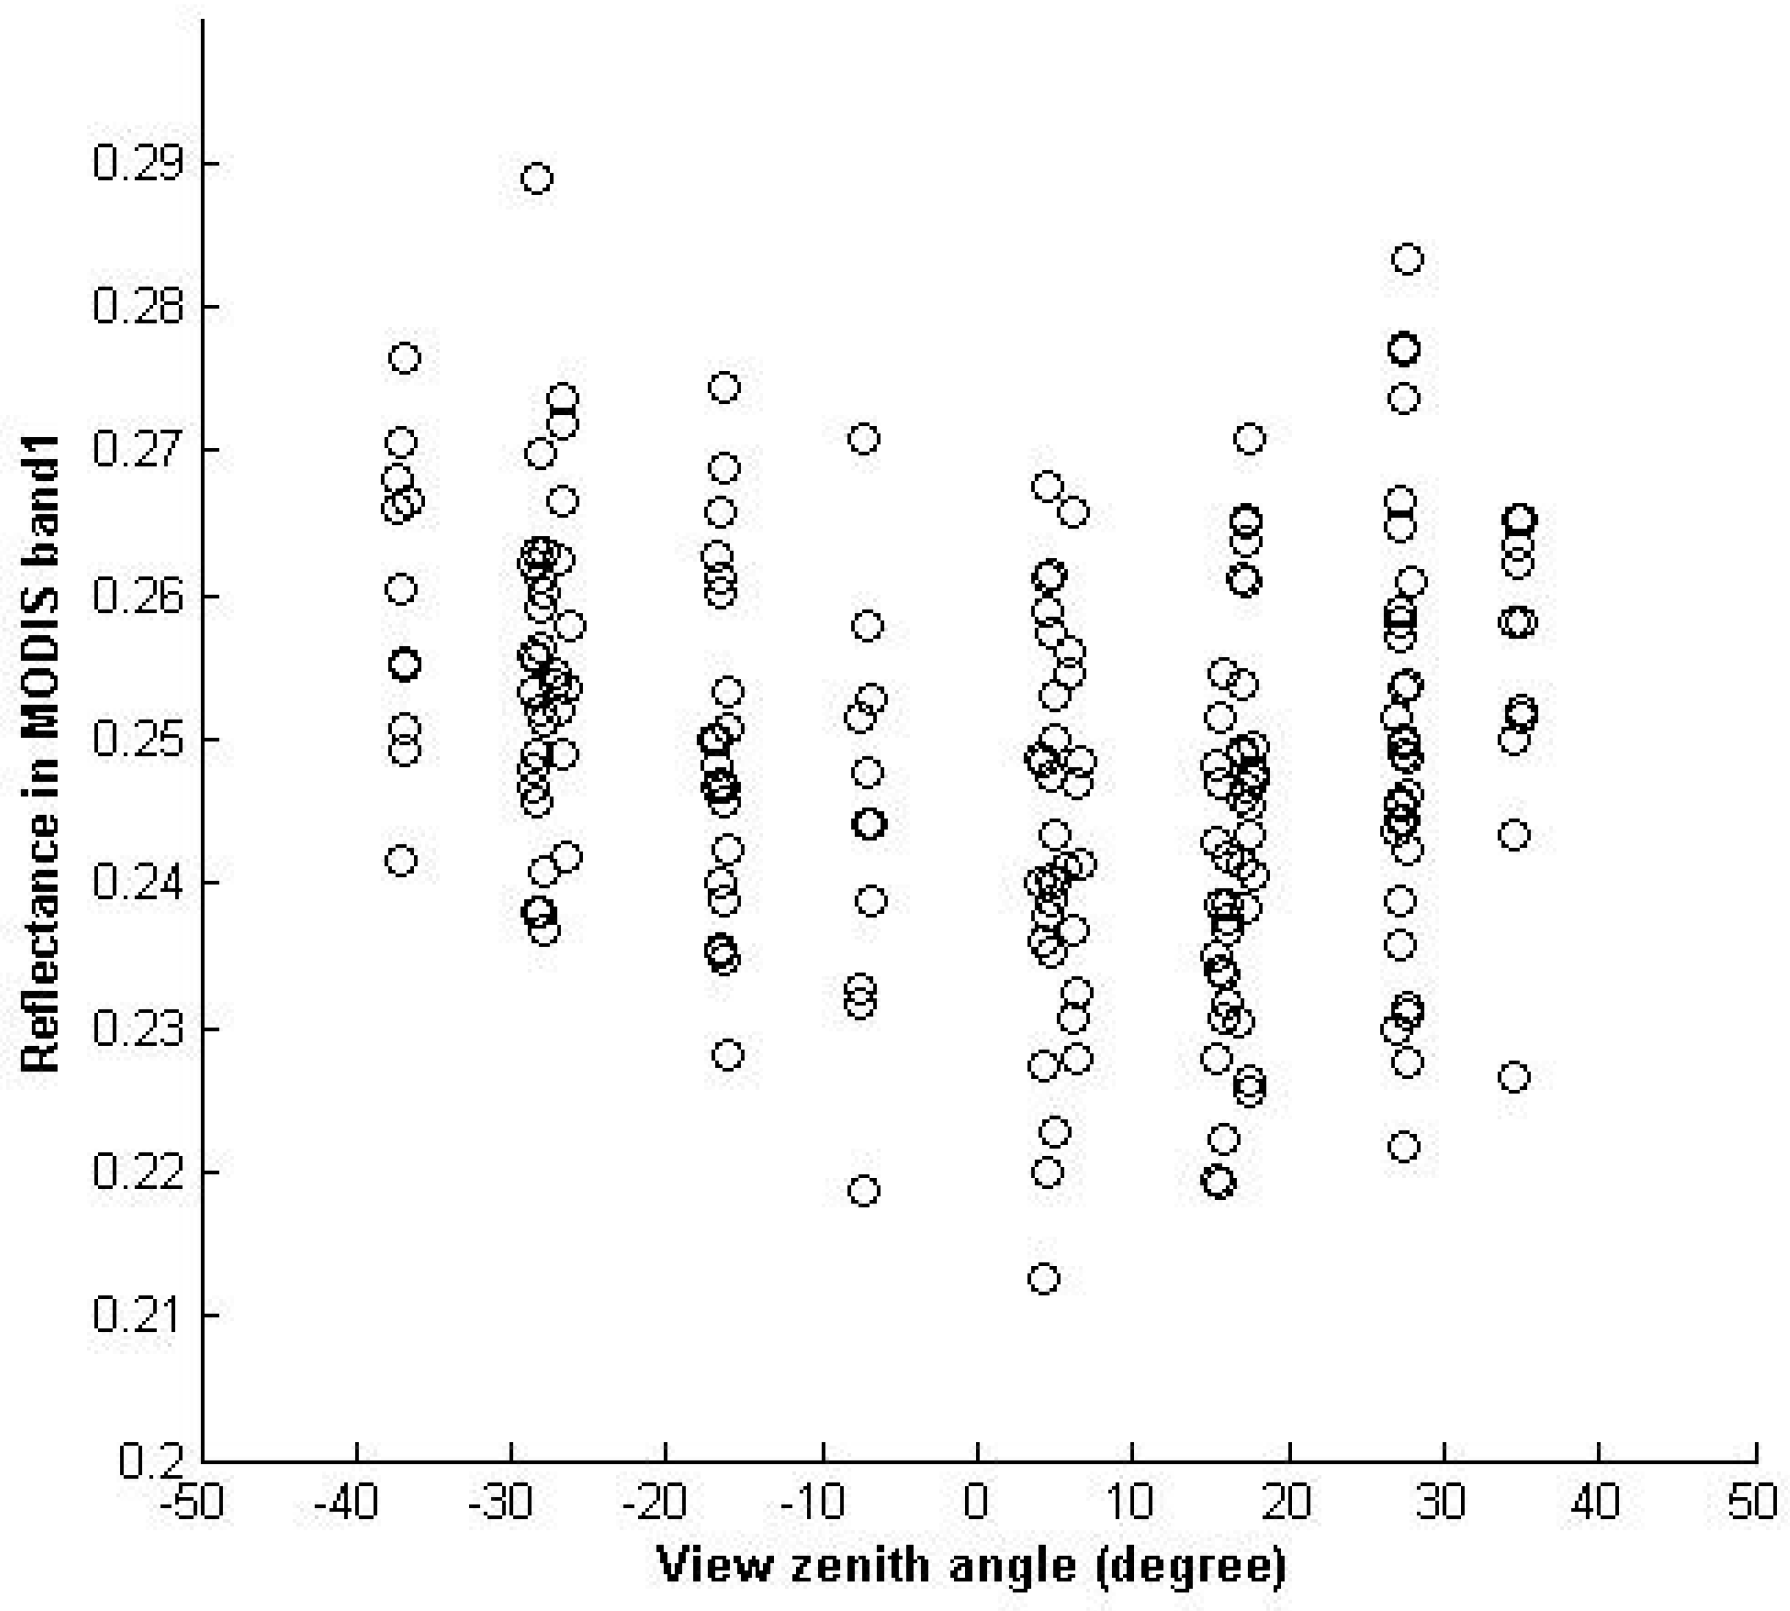
In fact, the difference of the view zenith angle between OLI and PMS will impact the cross-validation result. Figure 7 gives an example of the angle effect of the red band of Terra/MODIS. The reflectance varies with relative azimuth and solar zenith angle for each bin of view zenith angle, which shows systematic variation that is due to directional effects. The directional effect is about 15%. Furthermore, from Table 11, it can be found that the blue band of PMS has a higher error than other three bands. This is mainly due to the blue band having the shortest wavelength and most likely to be affected by atmospheric conditions of the four bands.
5. Conclusions
In this paper, a cross-calibration method has been used to cross-calibrate GF-4/PMS. The method is proposed by Zhong et al. [2] and used for the cross-calibration of HJ-1/CCD over a desert site using Landsat ETM+ imagery and the ASTER GDEM product. After that, Yang et al. [3] updated the method and used it to cross-calibrate the GF-1/WFV using Landsat OLI imagery and the ZY-3/TLC DEM product. The GF-4/PMS has a wide field of view, like HJ-1/CCD and GF-1/WFV, so the cross-calibration method of HJ-1/CCD and GF-4/WFV over a desert site using Landsat ETM+/OLI imagery and DEM products can be referenced for GF-4/PMS. The cross-calibration method has three key steps: BRDF fitting, TOA reflectance calculating, and cross-calibration coefficient fitting. In order to validate the accuracy of the method to GF-4/PMS, image pairs of GF-4/PMS and Landsat-8/OLI with similar transit time and close view zenith are used.
Compared to the TOA reflectance from synchronized OLI images, almost all of the errors of the TOA reflectance calculated with the calibration coefficients in this paper are less than 5%, more than half of those are less than 3%, and only a few of those are over 5% and less than 7%, which are much less than that calculated with the given calibration coefficients by CRESDA, whose error could even reach 40%. Furthermore, the two sets of TOA reflectance of PMS images before and after cross-calibration are compared with that of MODIS images, separately. The result shows that the tendency of the TOA reflectance after cross-calibration of PMS has been more stable than before. Additionally, the TOA reflectance values after cross-calibration are closer with MODIS than before. The comparison result proves that the radiometric capability of GF-4/PMS has been improved by cross-calibration. The validation result indicates the coefficients calculated using the cross-calibration method have higher accuracy and frequency than that given by CRESDA using vicarious calibration. The study shows that the new technique is also quite feasible for GF-4 multispectral bands as a routine long-term procedure.
Only GF-4/PMS data in 2016 has been used for cross-calibration up to now, and insufficient synchronized ground measurements have been carried out, which limit further detailed verification of the updated method, as well as the attenuation in performance of GF-4/PMS since its launch.
Acknowledgments
This work was supported in part by the GF4 Project under Grant 30-Y20A02-9003-15/16 and the National High Technology Research and Development Program of China under Grant 2013AA12A301 and 2012AA12A304.
Author Contributions
Aixia Yang was responsible for the data analysis and writing the manuscript. Bo Zhong contributed to the main research ideas, data collection and manuscript organization. Shanlong Wu collected the field data and preprocessed the remote sensing data, and Qinhuo Liu helped design the research. All of the authors thoroughly reviewed and edited this paper.
Conflicts of Interest
The authors declare no conflict of interest.
References
- Xu, W.; Gong, J.; Wang, M. Development, application, and prospects for Chinese land observation satellites. Geo-Spat. Inf. Sci. 2014, 17, 102–109. [Google Scholar] [CrossRef]
- Zhong, B.; Zhang, Y.; Du, T.; Yang, A.; Lv, W.; Liu, Q. Cross-calibration of HJ-1/CCD over a desert site using Landsat ETM+ imagery and ASTER GDEM product. IEEE Trans. Geosci. Remote Sens. 2014, 52, 7247–7263. [Google Scholar] [CrossRef]
- Yang, A.; Zhong, B.; Lv, W.; Lv, W.; Wu, S.; Liu, Q. Cross-calibration of GF-1/WFV over a desert site using Landsat-8/OLI imagery and ZY-3/TLC data. Remote Sens. 2015, 7, 10763–10787. [Google Scholar] [CrossRef]
- Kaufman, Y.J.; Sendra, C. Algorithm for automatic atmospheric corrections to visible and near-IR satellite imagery. Int. J. Remote Sens. 1988, 9, 1357–1381. [Google Scholar] [CrossRef]
- United States Geological Survey (USGS). LDCM CAL/VAL Algorithm Description Document. Available online: http://landsat.usgs.gov/documents/LDCM_CVT_ADD.pdf (accessed on 17 June 2015).
- Pahlevan, N.; Lee, Z.; Wei, J.; Schaaf, C.B.; Schott, J.R.; Berk, A. On-orbit radiometric characterization of OLI (Landsat-8) for applications in aquatic remote sensing. Remote Sens. Environ. 2014, 154, 272–284. [Google Scholar] [CrossRef]
- Knight, E.J.; Kvaran, G. Landsat-8 operational land imager design, characterization and performance. Remote Sens. 2014, 6, 10286–10305. [Google Scholar] [CrossRef]
- Landsat 8 (L8) Data Users Handbook. Available online: http://landsat.usgs.gov/documents/Landsat8DataUsersHandbook.pdf (accessed on 17 June 2015).
- Shi, Z.; Wen, X.; Ma, W.; Zhang, L.; Wang, J.; Zhou, Y. Quantitative and statistics analysis of lineament from Landsat-8 OLI imagery. In Proceedings of the 2015 International Industrial Informatics and Computer Engineering Conference, Xi’an, Shaanxi, China, 10–11 January 2015.
- Markham, B.; Knight, E.J.; Canova, B.; Donley, E.; Kvaran, G.; Lee, K.; Irons, J.R. The Landsat data continuity mission operational land imager (OLI) sensor. In Proceedings of the IEEE International Geoscience and Remote Sensing Symposium, Munich, Germany, 22–27 July 2012; pp. 6995–6998.
- Roy, D.P.; Wulder, M.A.; Loveland, T.R.; Woodcock, C.E.; Allen, R.G.; Anderson, M.C.; Zhu, Z. Landsat-8: Science and product vision for terrestrial global change research. Remote Sens. Environ. 2014, 145, 154–172. [Google Scholar] [CrossRef]
- Markham, B.; Storey, J.; Morfitt, R. Landsat-8 sensor characterization and calibration. Remote Sens. 2015, 7, 2279–2282. [Google Scholar] [CrossRef]
- Markham, B.L.; Dabney, P.W.; Murphy-Morris, J.E.; Pedelty, J.; Knight, E.J.; Kvaran, G.; Barsi, J. The Landsat data continuity mission operational land imager (OLI) radiometric calibration. In Proceedings of the IEEE International Geoscience and Remote Sensing Symposium, Honolulu, HI, USA, 25–30 July 2010.
- Markham, B.L.; Storey, J.C.; Irons, J.R. Landsat data continuity mission, now Landsat-8: Six months on-orbit. Proc. SPIE 2013. [Google Scholar] [CrossRef]
- Czapla-Myers, J.S.; Anderson, N.J.; Biggar, S.F. Early ground-based vicarious calibration results for Landsat 8 OLI. Proc. SPIE 2013. [Google Scholar] [CrossRef]
- Czapla-Myers, J.; Anderson, N.; Thome, K.; Biggar, S. The absolute radiometric calibration of the Landsat 8 Operational Land Imager using the reflectance-based approach and the Radiometric Calibration Test Site (RadCaTS). Proc. SPIE 2014. [Google Scholar] [CrossRef]
- Peng, L.; Luguang, J.; Zhiming, F. Cross-comparison of vegetation indices derived from Landsat-7 enhanced thematic mapper plus (ETM+) and Landsat-8 operational land imager (OLI) sensors. Remote Sens. 2013, 6, 310–329. [Google Scholar]
- Tang, X.; Zhang, G.; Zhu, X.; Pan, H.; Jiang, Y.; Zhou, P.; Wang, X. Triple linear-array image geometry model of ZiYuan-3 surveying satellite and its validation. Int. J. Image Data Fusion 2013, 4, 33–51. [Google Scholar] [CrossRef]
- Jiang, Y.; Zhang, G.; Tang, X.; Zhu, X.; Qin, Q.; Li, D.; Fu, X. High accuracy geometric calibration of ZY-3 three-line image. Acta Geod. Cartogr. Sin. 2013, 42, 523–529. [Google Scholar]
- Huang, X.; Wen, D.; Xie, J.; Zhang, L. Quality assessment of panchromatic and multispectral image fusion for the ZY-3 satellite: From an information extraction perspective. IEEE Geosci. Remote Sens. Lett. 2014, 11, 753–757. [Google Scholar] [CrossRef]
- Zhang, Y.; Zheng, M.; Xiong, J.; Lu, Y.; Xiong, X. On-orbit geometric calibration of ZY-3 three-line array imagery with multistrip data sets. IEEE Trans. Geosci. Remote Sens. 2014, 52, 224–234. [Google Scholar] [CrossRef]
- Tong, X.; Li, L.; Liu, S.; Xu, Y.; Ye, Z.; Jin, Y.; Xie, H. Detection and estimation of ZY-3 three-line array image distortions caused by attitude oscillation. ISPRS J. Photogramm. Remote Sens. 2015, 101, 291–309. [Google Scholar] [CrossRef]
- Huang, H.; Zhong, B.; Liu, Q.; Sun, L. Retrieving BRDF of desert using time series of MODIS imagery. In Proceedings of the IEEE International Geoscience and Remote Sensing Symposium, Vancouver, BC, Canada, 24–29 July 2011; pp. 4273–4276.
- China Centre for Resources Satellite Data and Application (CRESDA). Downloads. Available online: http://www.cresda.com/CN/Downloads/ (accessed on 29 July 2016).
- NASA Landsat Science. Spectral Response of the Operational Land Imager In-Band, Band-Average Relative Spectral Response. Available online: https://landsat.gsfc.nasa.gov/ (accessed on 1 March 2016).
- Guenther, B.; Xiong, X.; Salomonson, V.V.; Barnes, W.L.; Young, J. On-orbit performance of the Earth Observing System Moderate Resolution Imaging Spectroradiometer; first year of data. Remote Sens. Environ. 2002, 83, 16–30. [Google Scholar] [CrossRef]
- Chen, G.W.; Chen, Z.C.; Ma, L.; Zhang, H. Monitoring and assessment on radiometric stability of HJ-1A CCD using MODIS data. In Proceedings of the Eighth International Symposium on Multispectral Image Processing and Pattern Recognition, Wuhan, China, 26–27 October 2013; pp. 89211I–89211I-8.
- Nagaraja Rao, C.R.; Chen, J. Inter-satellite calibration linkages for the visible and near-infared channels of the Advanced Very High Resolution Radiometer on the NOAA-7,-9, and -11 spacecraft. Int. J. Remote Sens. 1995, 16, 1931–1942. [Google Scholar] [CrossRef]
- Zhong, B.; Liang, S.; Holben, B. Validating a new algorithm for estimating aerosol optical depths over land from MODIS imagery. Int. J. Remote Sens. 2007, 28, 4207–4214. [Google Scholar] [CrossRef]
- Liang, S.; Zhong, B.; Fang, H. Improved estimation of aerosol optical depth from MODIS imagery over land surfaces. Remote Sens. Environ. 2006, 104, 416–425. [Google Scholar] [CrossRef]
- Staylor, W.F.; Suttles, J.T. Reflection and emission models for deserts derived from Nimbus-7 ERB scanner measurements. J. Clim. Appl. Meteorol. 1986, 25, 196–202. [Google Scholar] [CrossRef]
- Berk, A.; Bernstein, L.S.; Robertson, D.C. Modtran: A Moderate Resolution Model for LOWTRAN; Spectral Sciences Inc.: Burlington, MA, USA, 1987. [Google Scholar]
Figure 1.
Illustration of the procedure of the new cross-calibration approach (parallelogram is the input and rectangle is the process).
Figure 1.
Illustration of the procedure of the new cross-calibration approach (parallelogram is the input and rectangle is the process).

Figure 2.
Location and close view of the calibration site: (a) is the location of the calibration site and a true color composite from Moderate Resolution Imaging Spectroradiometer (MODIS) imagery and (b) is the close view of the site from a true color composite of Landsat Enhanced Thematic Mapper Plus (ETM+) imagery.

Figure 3.
Difference curve in SPF for different spectral band of PMS and Operational Land Imager (OLI) (the SPF of PMS is published by CRESDA through its website [24]; and the SPF of OLI is published by NASA through its website [25]).

Figure 4.
Comparison of the top-of-the atmosphere (TOA) reflectance between GF-4/PMS and Terra/MODIS. (a) Laboratory calibration. (b) Vicarious calibration.
Figure 4.
Comparison of the top-of-the atmosphere (TOA) reflectance between GF-4/PMS and Terra/MODIS. (a) Laboratory calibration. (b) Vicarious calibration.
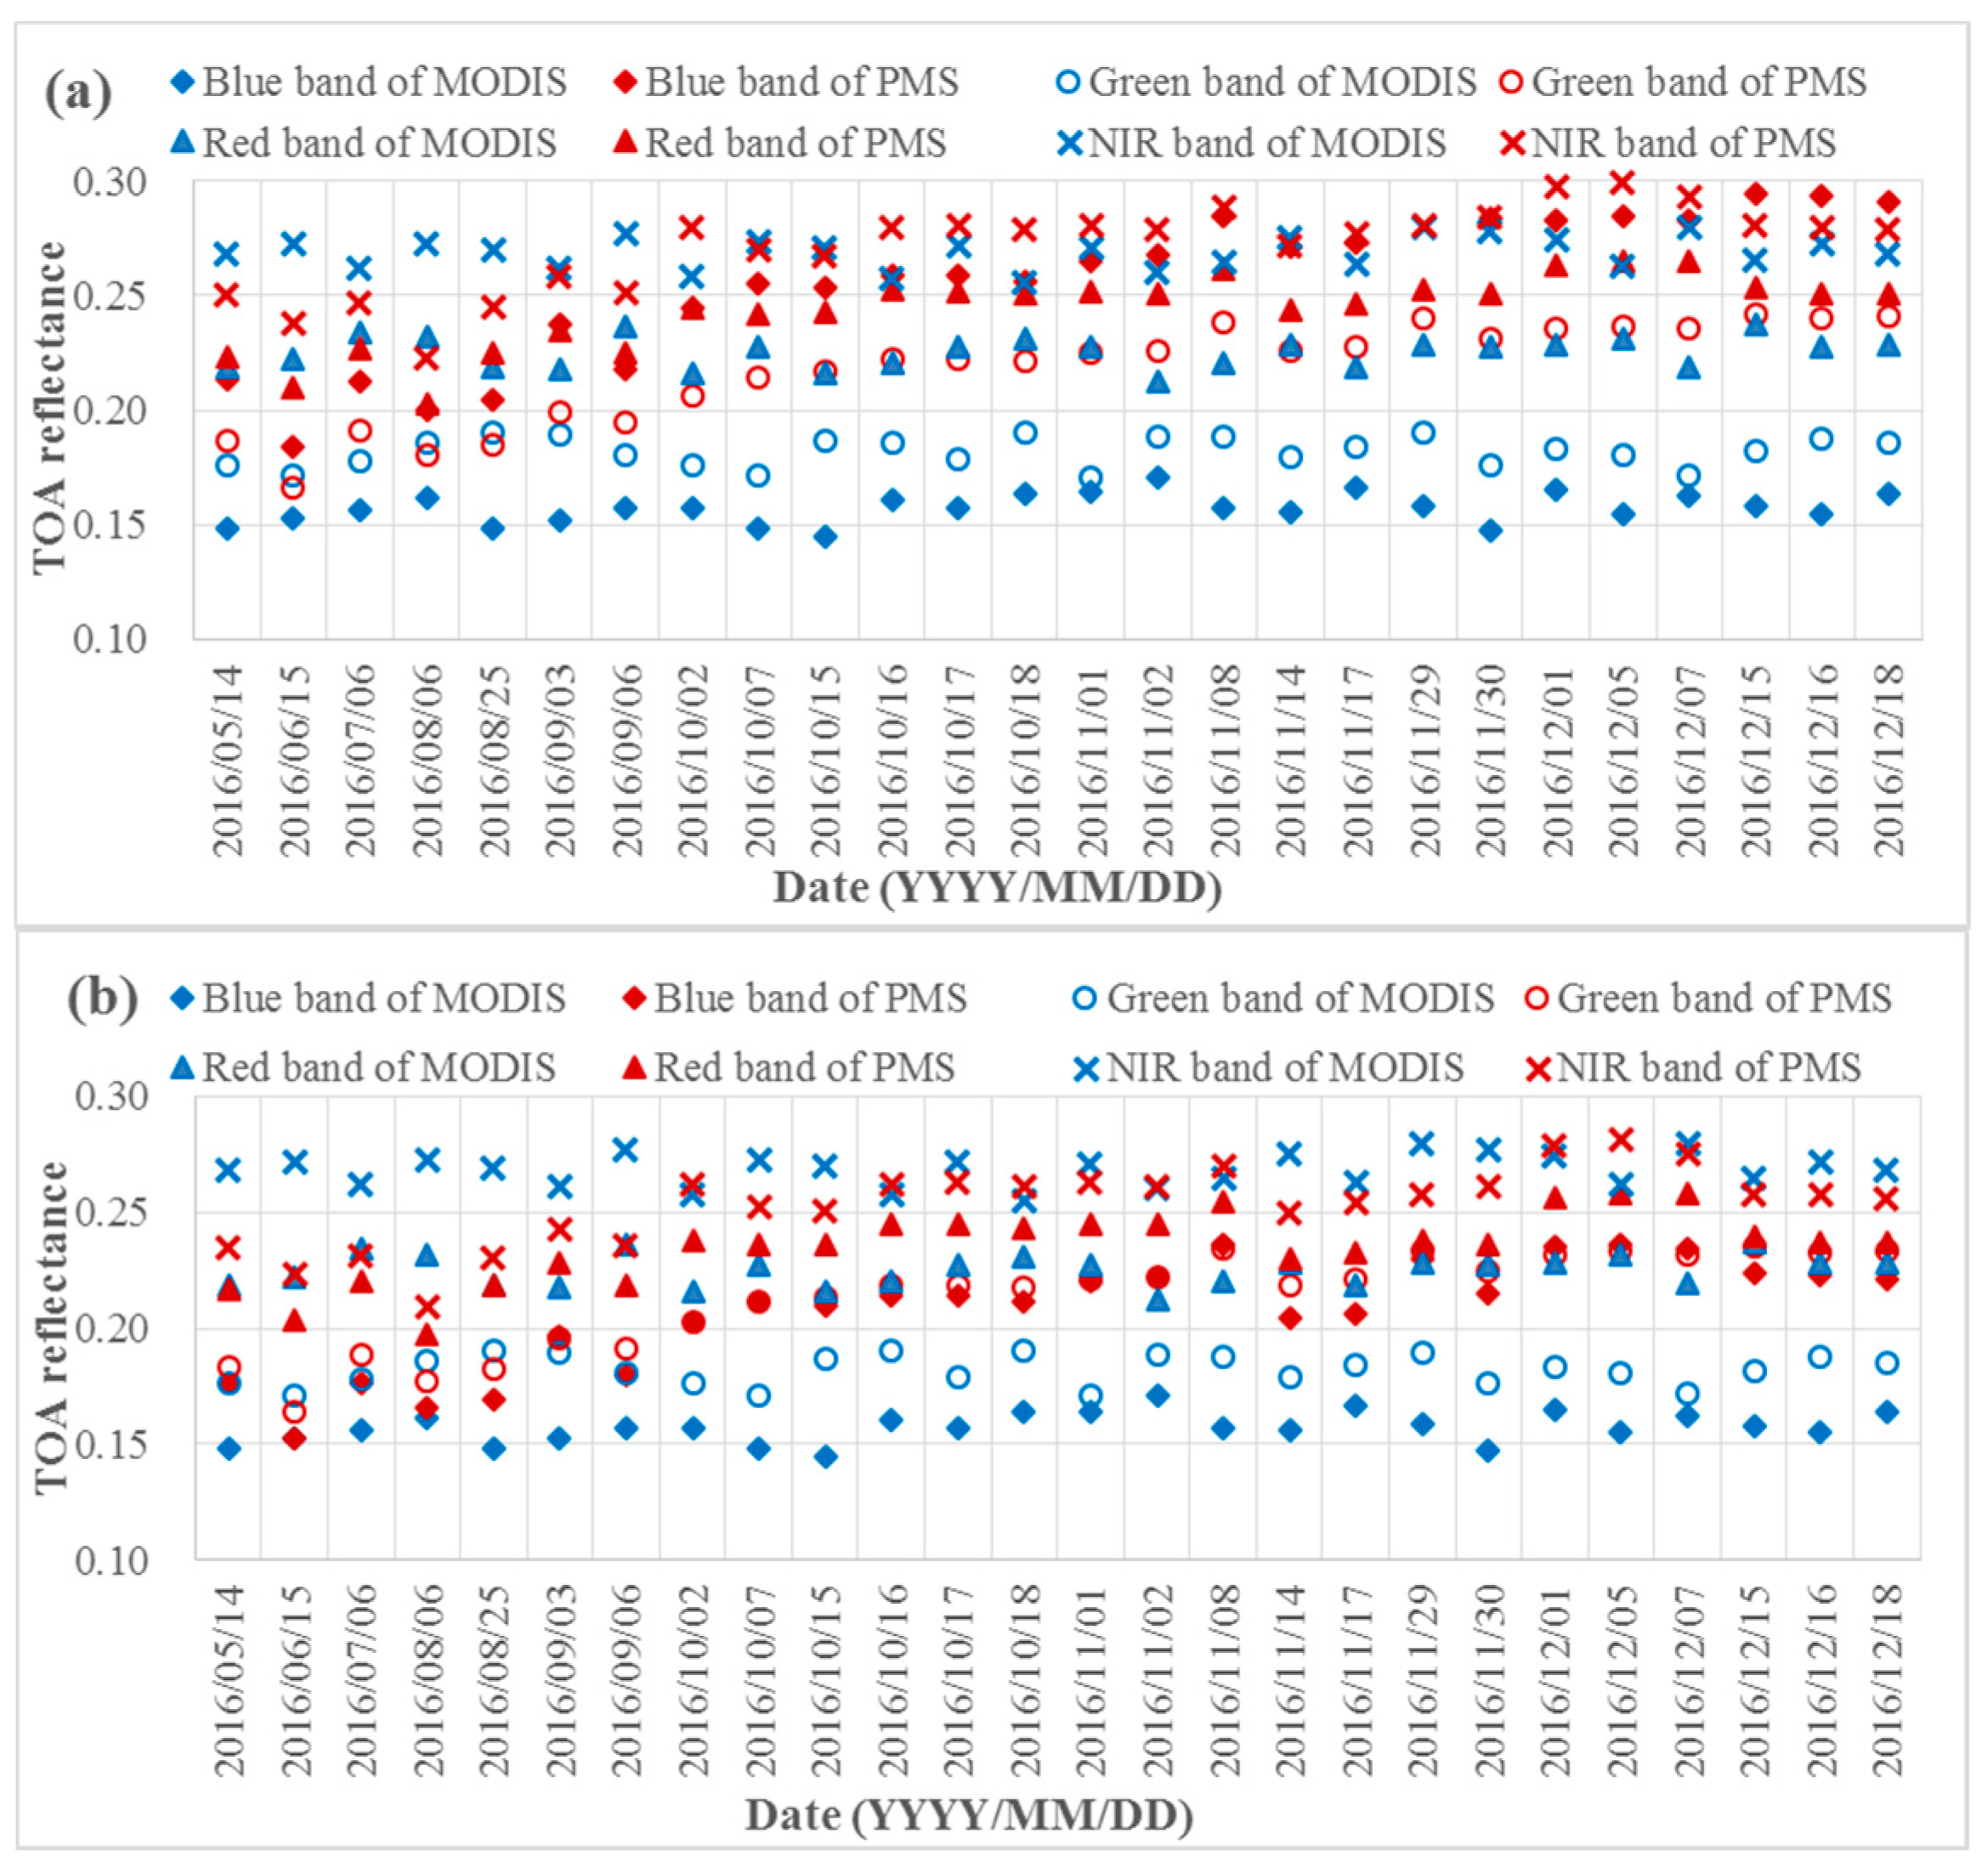
Figure 5.
Example of the simulated TOA radiance and its corresponding Digital Number (DN) of GF-4/PMS image on 15 June 2016 in blue and green bands.
Figure 5.
Example of the simulated TOA radiance and its corresponding Digital Number (DN) of GF-4/PMS image on 15 June 2016 in blue and green bands.
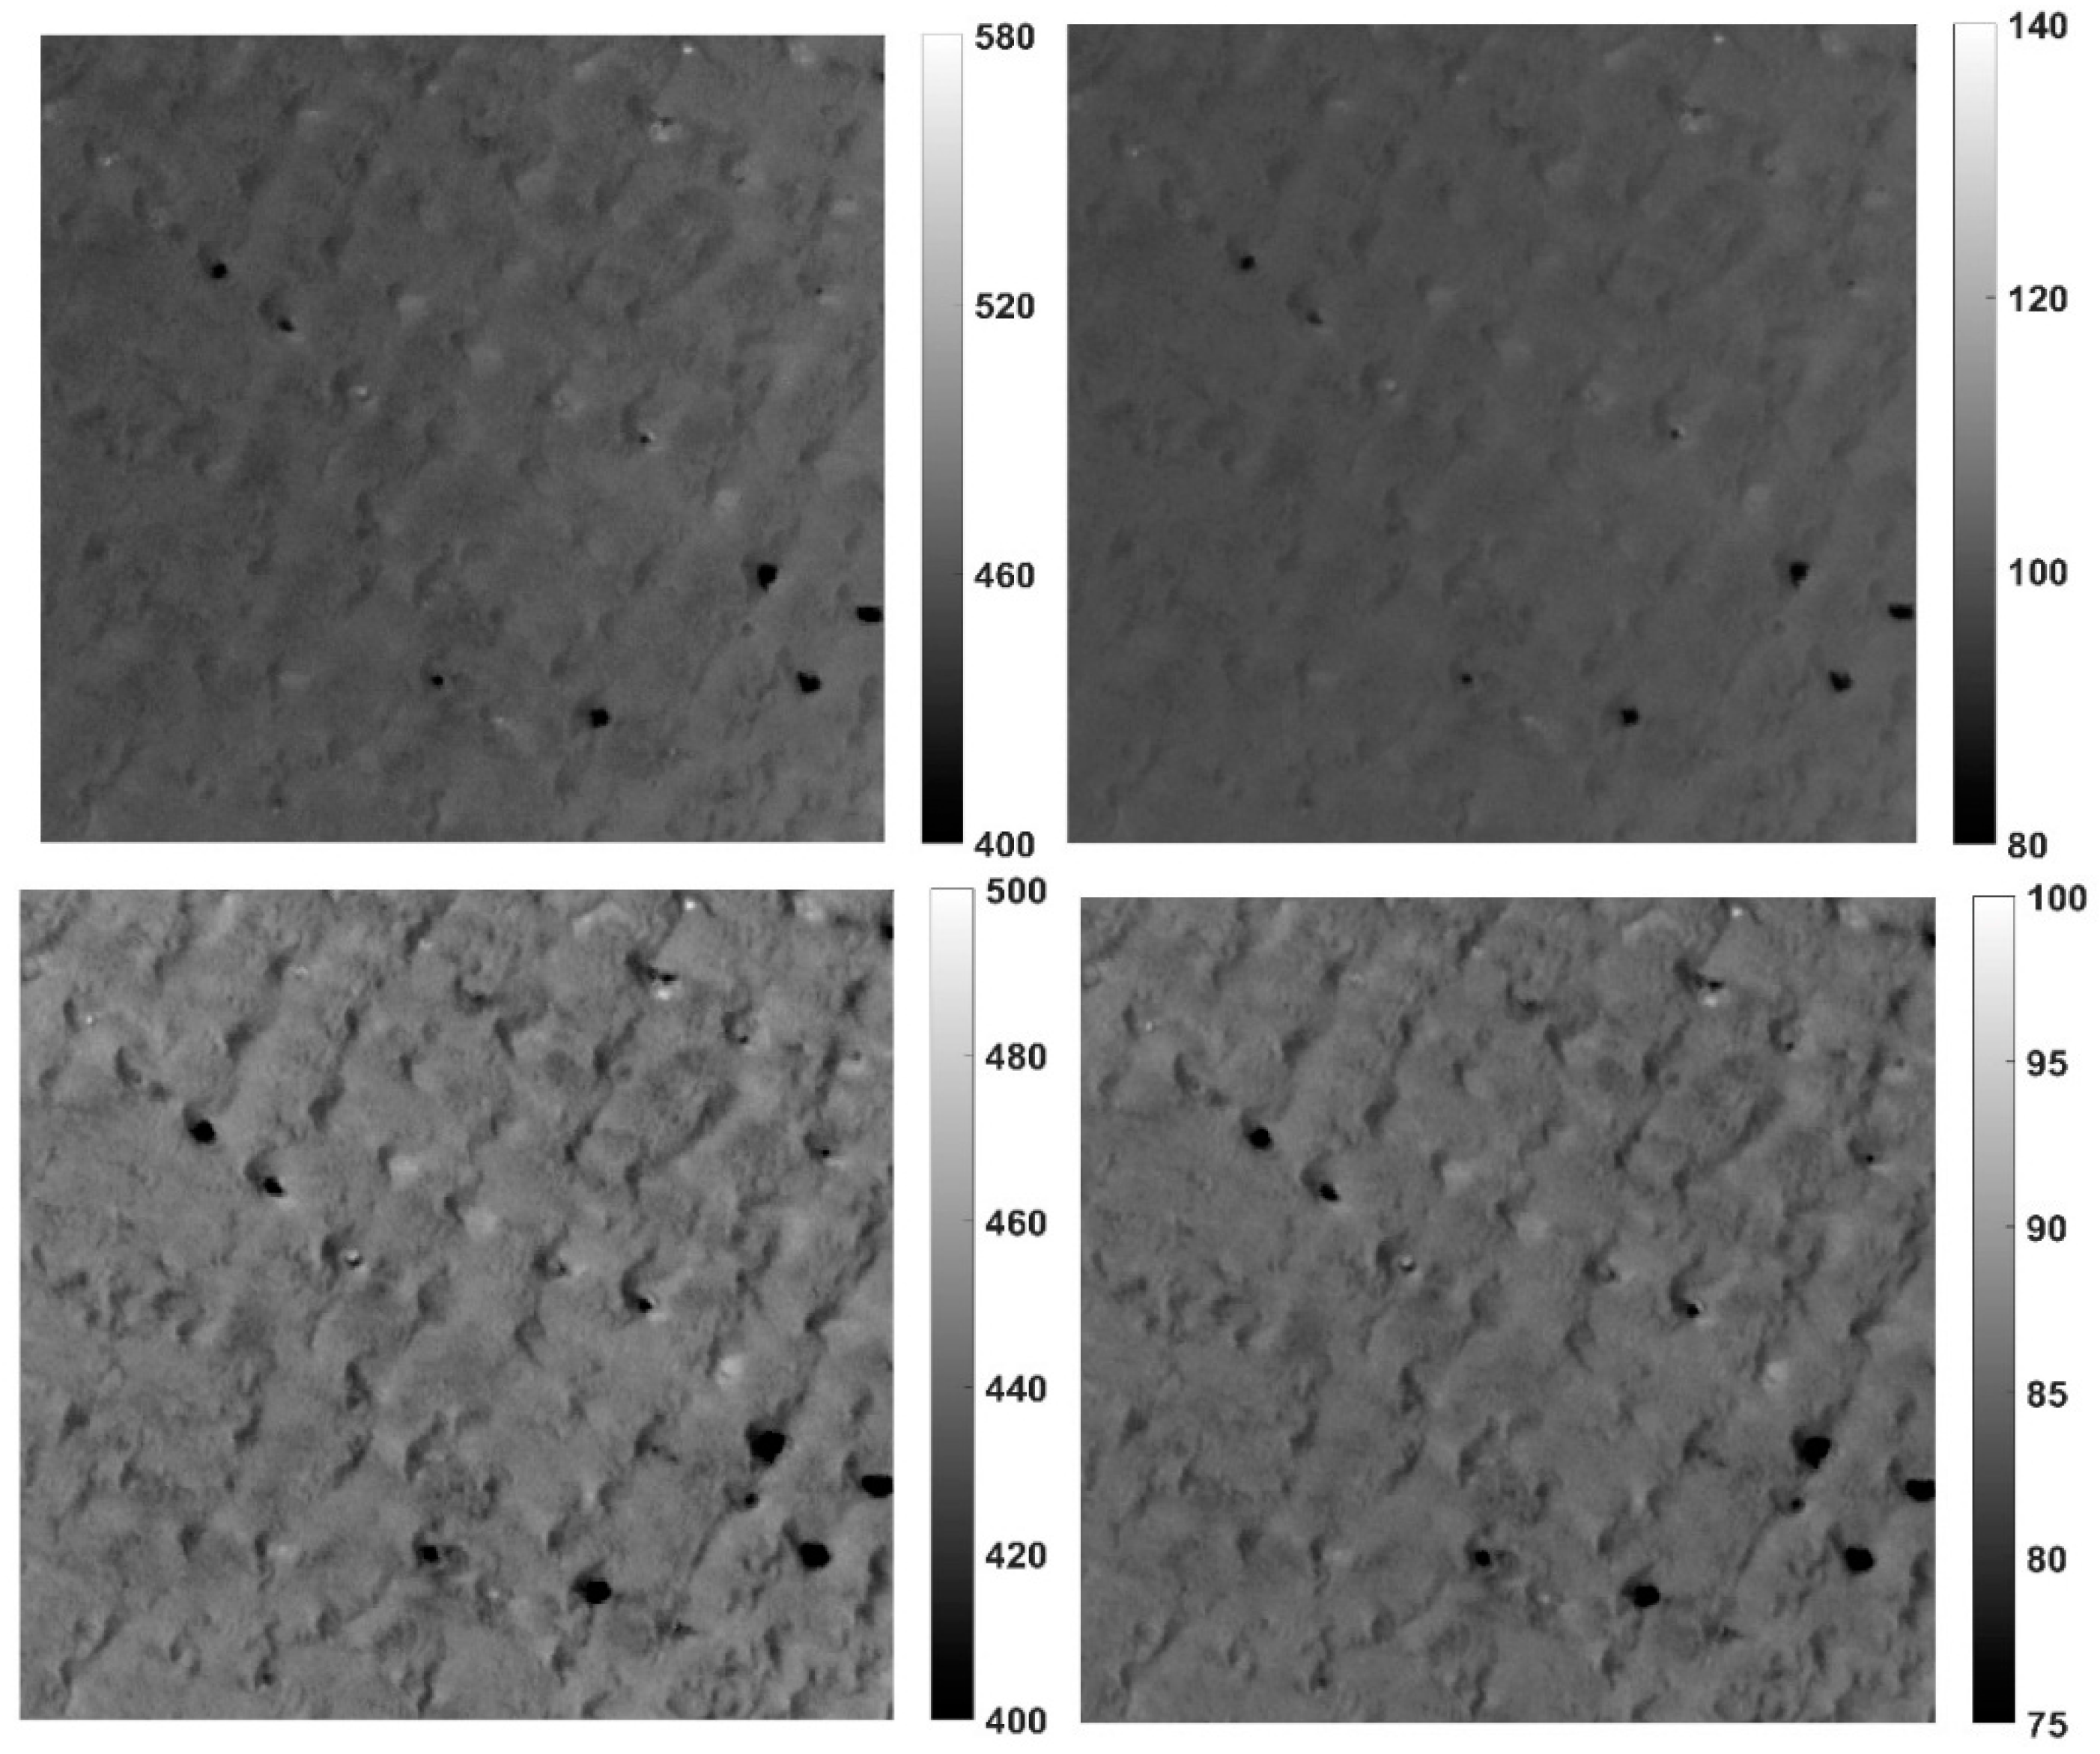
Figure 6.
Comparison of the TOA reflectance between GF-4/PMS after cross-calibration and Terra/MODIS.
Figure 6.
Comparison of the TOA reflectance between GF-4/PMS after cross-calibration and Terra/MODIS.

Figure 7.
The calibration site’s directional characterization of the red band of Terra/MODIS. The reflectance varies with relative azimuth and solar zenith angles for each bin of the view zenith angle, which shows systematic variation, which is due to directional effects. The directional effect is about 15%.


Table 1.
Primary characteristics of GaoFen-4 (GF-4)/panchromatic and multispectral sensor (PMS), GF-1/wide field of view sensor (WFV), and HuanJing-1 (HJ-1)/charge-coupled device (CCD) in multispectral bands.
| Sensor | GF-4/PMS | GF-1/WFV | HJ-1/CCD | |
|---|---|---|---|---|
| Spectral Settings (nm) | Blue | 450–520 | 450–520 | 430–520 |
| Green | 520–600 | 520–590 | 520–600 | |
| Red | 630–690 | 630–690 | 630–690 | |
| Near infrared | 760–900 | 770–890 | 700–900 | |
| Spatial Resolution (m) | 50 | 16 | 30 | |
| Swath Width (km) | 400 | 800 (four cameras combined) | 360 (one camera); ~700 (one satellite A/B) | |
| Revisit Period | 20 s | 4 days | 96 h for one satellite; 48 h for two satellites together | |
| Sensor | Band | Spectral Range (nm) | Spatial Resolution (m) | Swath Width (km) | Revisit Period (days) |
|---|---|---|---|---|---|
| Forward scanner | - | 500–800 | 3.6 | 52 | 3–5 |
| Backward scanner | - | 500–800 | 3.6 | 52 | 3–5 |
| Nadir scanner | - | 500–800 | 2.1 | 51 | 3–5 |
| Multispectral scanner | Blue | 450–520 | 5.8 | 51 | 3–5 |
| Green | 520–590 | ||||
| Red | 630–690 | ||||
| NIR | 770–890 |
| Band | Blue | Green | Red | NIR |
|---|---|---|---|---|
| Spectral matching factor (a) | 1.0653 | 0.9978 | 0.9971 | 0.9987 |
| Band | Blue | Green | Red | NIR |
|---|---|---|---|---|
| 1907.88 | 1815.42 | 1580.18 | 1098.79 |
| Band | Integration Time (ms) | a | b | Band | Integration Time (ms) | a | b |
|---|---|---|---|---|---|---|---|
| Blue | 6 | 0.952 | 12.207 | Red | 6 | 1.094 | 26.387 |
| 16 | 2.517 | 5.973 | 16 | 3.360 | 8.057 | ||
| 20 | 2.90 | 11.4 | 20 | 4.261 | 4.207 | ||
| 30 | 4.598 | 4.140 | 30 | 6.375 | 3.605 | ||
| 40 | 5.792 | 17.133 | 40 | 8.538 | 1.679 | ||
| Green | 4 | 0.796 | 30.579 | NIR | 4 | 0.865 | 34.500 |
| 12 | 3.080 | 6.735 | 16 | 4.443 | 11.355 | ||
| 16 | 4.128 | 4.705 | 20 | 5.657 | 7.257 | ||
| 20 | 5.223 | 1.439 | 30 | 8.681 | 0.331 | ||
| 30 | 7.921 | 0.256 | 40 | 11.579 | −1.004 |
| Band | Integration Time (ms) | Gain | Band | Integration Time (ms) | Gain |
|---|---|---|---|---|---|
| Blue | 6 | 0.9400 | Red | 6 | 0.7847 |
| 16 | 0.3484 | 16 | 0.3095 | ||
| 20 | 0.3263 | 20 | 0.2806 | ||
| 30 | 0.1784 | 30 | 0.1515 | ||
| 40 | 0.1252 | 40 | 0.1102 | ||
| Green | 4 | 0.9885 | NIR | 4 | 0.5641 |
| 12 | 0.3448 | 16 | 0.2257 | ||
| 16 | 0.2472 | 20 | 0.1997 | ||
| 20 | 0.1878 | 30 | 0.1080 | ||
| 30 | 0.1226 | 40 | 0.0796 |
Table 7.
Acquisition times, angles’ information, and retrieved Aerosol Optical Depths (AODs) of the selected GF-4/PMS images.
| Acquisition Date | GMT time (H:MM) | Sun Azimuth (°) | Sun Elevation (°) | View Azimuth (°) | View Elevation (°) | Retrieved AOD at 550 nm |
|---|---|---|---|---|---|---|
| 14 May 2016 | 12:16 | 145.498 | 65.198 | 171.441 | 43.486 | 0.126 |
| 15 June 2016 | 14:09 | 222.159 | 65.673 | 171.607 | 45.833 | 0.247 |
| 6 July 2016 | 10:33 | 99.919 | 50.545 | 170.673 | 45.999 | 0.280 |
| 25 August 2016 | 12:00 | 140.538 | 57.354 | 170.826 | 45.861 | 0.108 |
| 3 September 2016 | 09:38 | 108.880 | 31.242 | 171.570 | 43.196 | 0.069 |
| 6 December 2016 | 11:30 | 138.490 | 48.743 | 172.684 | 43.014 | 0.221 |
| 7 October 2016 | 10:16 | 129.921 | 30.151 | 172.859 | 43.032 | 0.138 |
| 15 October 2016 | 11:06 | 144.690 | 34.193 | 172.712 | 43.030 | 0.157 |
| 18 October 2016 | 12:00 | 160.822 | 37.991 | 172.705 | 43.129 | 0.211 |
| 1 November 2016 | 11:00 | 146.705 | 28.514 | 172.605 | 43.114 | 0.086 |
| 14 November 2016 | 11:00 | 148.374 | 25.100 | 172.753 | 43.225 | 0.110 |
| 29 November 2016 | 11:00 | 148.855 | 21.743 | 172.514 | 43.023 | 0.060 |
| 1 December 2016 | 11:44 | 159.194 | 25.032 | 172.497 | 43.025 | 0.057 |
| 7 December 2016 | 12:05 | 164.057 | 25.370 | 172.497 | 43.026 | 0.222 |
| 15 December 2016 | 11:00 | 148.113 | 19.440 | 172.535 | 43.027 | 0.056 |
| Date | Blue Band | Green Band | Red Band | NIR Band | ||||
|---|---|---|---|---|---|---|---|---|
| DN | TOA * | DN | TOA | DN | TOA | DN | TOA | |
| 14 May 2016 | 286.37 | 53.09 | 338.09 | 68.40 | 426.49 | 73.40 | 309.02 | 41.47 |
| 15 June 2016 | 276.98 | 49.00 | 328.47 | 63.26 | 418.38 | 67.15 | 306.75 | 37.76 |
| 6 July 2016 | 416.55 | 68.44 | 513.40 | 92.05 | 662.84 | 104.13 | 476.86 | 59.18 |
| 25 August 2016 | 438.81 | 67.27 | 548.11 | 97.34 | 714.68 | 109.42 | 498.47 | 60.12 |
| 3 September 2016 | 340.21 | 49.13 | 307.04 | 54.19 | 385.62 | 57.92 | 402.02 | 47.80 |
| 6 December 2016 | 449.47 | 62.48 | 435.50 | 74.38 | 537.84 | 79.98 | 567.85 | 66.21 |
| 7 October 2016 | 361.10 | 48.64 | 327.02 | 53.27 | 394.28 | 57.92 | 414.58 | 47.72 |
| 15 October 2016 | 401.31 | 54.54 | 371.91 | 58.46 | 444.47 | 66.49 | 460.30 | 54.45 |
| 18 October 2016 | 443.61 | 59.53 | 415.61 | 64.96 | 503.47 | 73.36 | 529.37 | 60.56 |
| 1 November 2016 | 359.26 | 48.29 | 328.73 | 51.41 | 394.13 | 56.24 | 412.55 | 46.82 |
| 14 November 2016 | 425.52 | 43.02 | 445.94 | 42.99 | 455.37 | 50.41 | 476.83 | 42.34 |
| 29 November 2016 | 422.08 | 39.34 | 417.71 | 39.60 | 414.09 | 44.39 | 433.48 | 36.72 |
| 1 December 2016 | 345.86 | 32.68 | 310.34 | 29.48 | 372.16 | 40.01 | 395.02 | 33.73 |
| 7 December 2016 | 350.05 | 33.74 | 314.41 | 30.72 | 376.90 | 40.18 | 392.90 | 33.91 |
| 15 December 2016 | 369.99 | 35.48 | 379.98 | 37.16 | 376.08 | 40.35 | 391.18 | 33.88 |
* The unit for TOA radiance is .
| Date | Blue Band | Green Band | Red Band | NIR Band |
|---|---|---|---|---|
| 14 May 2016 | 0.1854 | 0.2023 | 0.1721 | 0.1342 |
| 15 June 2016 | 0.1769 | 0.1926 | 0.1605 | 0.1231 |
| 6 July 2016 | 0.1643 | 0.1793 | 0.1571 | 0.1241 |
| 25 August 2016 | 0.1533 | 0.1776 | 0.1531 | 0.1206 |
| 3 September 2016 | 0.1444 | 0.1765 | 0.1502 | 0.1189 |
| 6 December 2016 | 0.1390 | 0.1708 | 0.1487 | 0.1166 |
| 7 October 2016 | 0.1347 | 0.1629 | 0.1469 | 0.1151 |
| 15 October 2016 | 0.1359 | 0.1572 | 0.1496 | 0.1183 |
| 18 October 2016 | 0.1342 | 0.1563 | 0.1457 | 0.1144 |
| 1 November 2016 | 0.1344 | 0.1564 | 0.1427 | 0.1135 |
| 14 November 2016 | 0.1011 | 0.0964 | 0.1107 | 0.0888 |
| 29 November 2016 | 0.0932 | 0.0948 | 0.1072 | 0.0847 |
| 1 December 2016 | 0.0945 | 0.0950 | 0.1075 | 0.0854 |
| 7 December 2016 | 0.0964 | 0.0977 | 0.1066 | 0.0863 |
| 15 December 2016 | 0.0959 | 0.0978 | 0.1073 | 0.0866 |
| Acquiring Date of GF-4/PMS | Acquiring Date of OLI (Day Month Year) | Solar Zenith of GF-4/PMS (°) | Solar Zenith of OLI (°) | View Zenith of GF-4/PMS (°) | View Zenith of OLI (°) | Relative Azimuth of GF-4/PMS (°) | Relative Azimuth of OLI (°) |
|---|---|---|---|---|---|---|---|
| 15 June 2016 | 11 June 2016 | 24.3270 | 24.0301 | 44.1670 | 0.0000 | 50.5520 | 129.8012 |
| 6 July 2016 | 6 July 2016 | 39.4550 | 25.1137 | 44.0010 | 0.0000 | 70.7540 | 128.4181 |
| 25 August 2016 | 30 August 2016 | 32.6460 | 36.1487 | 44.1390 | 0.0000 | 30.2880 | 145.0563 |
| 7 October 2016 | 10 October 2016 | 59.8490 | 49.5287 | 46.9680 | 0.0000 | 42.9380 | 158.1424 |
| 15 October 2016 | 17 October 2016 | 55.8070 | 51.9167 | 46.9700 | 0.0000 | 28.0220 | 159.5839 |
| 1 November 2016 | 2 November 2016 | 61.4860 | 57.0972 | 46.8860 | 0.0000 | 25.9000 | 161.8259 |
| 14 November 2016 | 11 November 2016 | 64.9000 | 59.7016 | 46.7750 | 0.0000 | 24.3790 | 162.4547 |
| 29 November 2016 | 27 November 2016 | 68.2570 | 63.4680 | 46.9770 | 0.0000 | 23.6590 | 162.5250 |
| 15 December 2016 | 13 December 2016 | 70.5600 | 65.7732 | 46.9730 | 0.0000 | 24.4220 | 161.4440 |
| Date | Band | DN | GCC * | CCC # | TOA Reflectance by GCC | TOA Reflectance by CCC | TOA Reflectance of OLI | Error by GCC (%) | Error by CCC (%) |
|---|---|---|---|---|---|---|---|---|---|
| 15 June 2016 | Blue | 457.78 | 0.1784 | 0.1769 | 0.1523 | 0.1511 | 0.1435 | 6.19 | 5.32 |
| Green | 444.97 | 0.1878 | 0.1926 | 0.1638 | 0.1680 | 0.1720 | 4.74 | 2.31 | |
| Red | 596.59 | 0.1515 | 0.1605 | 0.2036 | 0.2157 | 0.2261 | 9.98 | 4.62 | |
| NIR | 637.73 | 0.1080 | 0.1231 | 0.2231 | 0.2543 | 0.2722 | 18.04 | 6.57 | |
| 6 July 2016 | Blue | 448.12 | 0.1784 | 0.1643 | 0.1762 | 0.1623 | 0.1555 | 13.31 | 4.36 |
| Green | 432.92 | 0.1878 | 0.1793 | 0.1883 | 0.1798 | 0.1794 | 5.00 | 0.24 | |
| Red | 546.95 | 0.1515 | 0.1571 | 0.2205 | 0.2287 | 0.2274 | 3.01 | 0.58 | |
| NIR | 560.83 | 0.1080 | 0.1241 | 0.2318 | 0.2663 | 0.2713 | 14.56 | 1.85 | |
| 25 August 2016 | Blue | 476.03 | 0.1784 | 0.1533 | 0.1693 | 0.1455 | 0.1390 | 21.80 | 4.67 |
| Green | 462.99 | 0.1878 | 0.1776 | 0.1822 | 0.1723 | 0.1670 | 9.10 | 3.19 | |
| Red | 599.32 | 0.1515 | 0.1531 | 0.2186 | 0.2209 | 0.2187 | 0.05 | 1.02 | |
| NIR | 615.65 | 0.1080 | 0.1206 | 0.2302 | 0.2571 | 0.2621 | 12.17 | 1.90 | |
| 7 October 2016 | Blue | 364.10 | 0.1784 | 0.1347 | 0.2120 | 0.1601 | 0.1516 | 39.85 | 5.60 |
| Green | 327.78 | 0.1878 | 0.1629 | 0.2112 | 0.1832 | 0.1749 | 20.74 | 4.75 | |
| Red | 395.09 | 0.1515 | 0.1469 | 0.2359 | 0.2287 | 0.2251 | 4.78 | 1.59 | |
| NIR | 413.07 | 0.1080 | 0.1151 | 0.2528 | 0.2695 | 0.2683 | 5.78 | 0.43 | |
| 15 October 2016 | Blue | 405.28 | 0.1784 | 0.1359 | 0.2100 | 0.1599 | 0.1650 | 27.28 | 3.07 |
| Green | 372.86 | 0.1878 | 0.1572 | 0.2137 | 0.1789 | 0.1867 | 14.45 | 4.19 | |
| Red | 445.03 | 0.1515 | 0.1496 | 0.2364 | 0.2334 | 0.2368 | 0.17 | 1.43 | |
| NIR | 459.94 | 0.1080 | 0.1183 | 0.2505 | 0.2744 | 0.2803 | 10.65 | 2.11 | |
| 1 November 2016 | Blue | 362.22 | 0.1784 | 0.1344 | 0.2201 | 0.1658 | 0.1549 | 42.06 | 7.03 |
| Green | 329.32 | 0.1878 | 0.1564 | 0.2213 | 0.1843 | 0.1766 | 25.36 | 4.38 | |
| Red | 394.01 | 0.1515 | 0.1427 | 0.2454 | 0.2311 | 0.2272 | 8.03 | 1.72 | |
| NIR | 412.03 | 0.1080 | 0.1135 | 0.2631 | 0.2765 | 0.2716 | 3.12 | 1.81 | |
| 14 November 2016 | Blue | 429.32 | 0.1252 | 0.1011 | 0.2046 | 0.1653 | 0.1575 | 29.95 | 4.98 |
| Green | 446.63 | 0.1226 | 0.0964 | 0.2191 | 0.1722 | 0.1778 | 23.20 | 3.16 | |
| Red | 454.82 | 0.1102 | 0.1107 | 0.2304 | 0.2315 | 0.2281 | 1.00 | 1.50 | |
| NIR | 474.92 | 0.0796 | 0.0888 | 0.2499 | 0.2789 | 0.2719 | 8.08 | 2.59 | |
| 29 November 2016 | Blue | 426.01 | 0.1252 | 0.0932 | 0.2302 | 0.1714 | 0.1624 | 41.76 | 5.53 |
| Green | 419.61 | 0.1226 | 0.0948 | 0.2334 | 0.1805 | 0.1780 | 31.11 | 1.40 | |
| Red | 414.93 | 0.1102 | 0.1072 | 0.2383 | 0.2319 | 0.2281 | 4.49 | 1.67 | |
| NIR | 432.66 | 0.0796 | 0.0847 | 0.2581 | 0.2746 | 0.2730 | 5.43 | 0.60 | |
| 15 December 2016 | Blue | 373.18 | 0.1252 | 0.0959 | 0.2237 | 0.1714 | 0.1670 | 33.97 | 2.64 |
| Green | 381.03 | 0.1226 | 0.0978 | 0.2351 | 0.1875 | 0.1810 | 29.87 | 3.59 | |
| Red | 376.04 | 0.1102 | 0.1073 | 0.2396 | 0.2333 | 0.2289 | 4.67 | 1.93 | |
| NIR | 389.99 | 0.0796 | 0.0866 | 0.2581 | 0.2807 | 0.2727 | 5.37 | 2.92 |
* GCC is the abbreviation of given calibration coefficients; # CCC is the abbreviation of cross-calibration coefficients.
© 2017 by the authors. Licensee MDPI, Basel, Switzerland. This article is an open access article distributed under the terms and conditions of the Creative Commons Attribution (CC BY) license ( http://creativecommons.org/licenses/by/4.0/).
Share and Cite
MDPI and ACS Style
Yang, A.; Zhong, B.; Wu, S.; Liu, Q. Radiometric Cross-Calibration of GF-4 in Multispectral Bands. Remote Sens. 2017, 9, 232. https://doi.org/10.3390/rs9030232
AMA Style
Yang A, Zhong B, Wu S, Liu Q. Radiometric Cross-Calibration of GF-4 in Multispectral Bands. Remote Sensing. 2017; 9(3):232. https://doi.org/10.3390/rs9030232
Chicago/Turabian StyleYang, Aixia, Bo Zhong, Shanlong Wu, and Qinhuo Liu. 2017. "Radiometric Cross-Calibration of GF-4 in Multispectral Bands" Remote Sensing 9, no. 3: 232. https://doi.org/10.3390/rs9030232
Note that from the first issue of 2016, this journal uses article numbers instead of page numbers. See further details here.