Article

Optimized Sample Selection in SVM Classification by Combining with DMSP-OLS, Landsat NDVI and GlobeLand30 Products for Extracting Urban Built-Up Areas

1
College of Surveying and Geo-Informatics, Tongji University, Shanghai 200092, China
2
Institute of Cartography and Geographic Information System, Chinese Academy of Surveying and Mapping, Beijing 100830, China
*
Authors to whom correspondence should be addressed.
Remote Sens. 2017, 9(3), 236; https://doi.org/10.3390/rs9030236
Submission received: 18 December 2016 / Revised: 8 February 2017 / Accepted: 1 March 2017 / Published: 4 March 2017
(This article belongs to the Special Issue Validation on Global Land Cover Datasets)

Abstract

:
The accuracy of training samples used for data classification methods, such as support vector machines (SVMs), has had a considerable positive impact on the results of urban area extractions. To improve the accuracy of urban built-up area extractions, this paper presents a sample-optimized approach for classifying urban area data using a combination of the Defense Meteorological Satellite Program-Operational Linescan System (DMSP-OLS) for nighttime light data, Landsat images, and GlobeLand30, which is a 30-m global land cover data product. The proposed approach consists of three main components: (1) initial sample generation and data classification into built-up and non-urban built-up areas based on the maximum and minimum intervals of digital numbers from the DMSP-OLS data, respectively; (2) refined sample selection and optimization by the probability threshold of each pixel based on vegetation-cover, using the Landsat-derived normalized differential vegetation index (NDVI) and artificial surfaces extracted from the GlobeLand30 product as the constraints; (3) iterative classification and urban built-up area data extraction using the relationship between these three aspects of data collection together with the training sets. Experiments were conducted for several cities in western China using this proposed approach for the extraction of built-up areas, which were classified using urban construction statistical yearbooks and Landsat images and were compared with data obtained from traditional data collection methods, such as the threshold dichotomy method and the improved neighborhood focal statistics method. An analysis of the empirical results indicated that (1) the sample training process was improved using the proposed method, and the overall accuracy (OA) increased from 89% to 96% for both the optimized and non-optimized sample selection; (2) the proposed method had a relative error of less than 10%, as calculated by an accuracy assessment; (3) the overall and individual class accuracy were higher for artificial surfaces in GlobeLand30; and (4) the average OA obviously improved and the Kappa coefficient in the case of Chengdu increased from 0.54 to 0.80. Therefore, the experimental results demonstrated that our proposed approach is a reliable solution for extracting urban built-up areas with a high degree of accuracy.

1. Introduction

In China, the rapid development of the social economy and changes in the industrial structure have accelerated urbanization. A key characteristic of urbanization is the constant expansion of urban areas into farm land and forested areas. The loss of agricultural lands threatens and damages the ecological environment and directly affects the livability of cities and the sustainability of economic development. Therefore, methods of extracting and evaluating urban spatial information in China are extremely important.
The Defense Meteorological Satellite Program-Operational Linescan System (DMSP-OLS) nighttime light data are a valuable resource for regional and global urban mapping, as well as for the study of human activities [1,2,3]. On nights without cloud cover, nighttime light sensors can effectively detect city lights, even low-intensity lights within small-scale residential areas or in cars, and then quickly extract the city information. Not only do DMSP-OLS data have a small storage capacity, but also a long time series compared with traditional remote sensing images that can provide a wide range of urban land use information, thus playing a significant role in the extraction of urban areas and the analysis of dynamic changes of urban spatial patterns [4,5,6,7]. A number of methods have been developed to map urban areas using DMSP-OLS data, and these approaches can generally be divided into two categories: supervised classification and un-supervised classification. Experiential threshold, mutation detection, and comparison methods based on high-resolution data have considerably improved the acquisition of urban spatial information and are representative of the un-supervised classification of the nighttime light remote sensing field [8,9,10,11,12], whereas the support vector machine (SVM) method uses sample selection and nighttime light image classification to acquire urban information, and is representative of a commonly employed supervised classification method [13,14,15]. Cao et al. [16] proposed an SVM-based region-growing algorithm using DMSP-OLS and SPOT normalized differential vegetation index (NDVI) data to extract the urban extent of 25 Chinese cities with different levels of economic development, including Beijing, Shanghai, Hangzhou, Zhengzhou, and Lanzhou [16]. This algorithm uses several simple criteria to build initial training sets of urban and non-urban pixels. In particular, the growth of seed pixels (a window with 3 × 3 pixels), which is involved in the iterative classification procedure, is capable of running continuous training for the SVM classifier with the aim of semi-automatically extracting the urban extent. Pandey et al. used a second-order polynomial regression equation to intercalibrate DMSP-OLS data as a necessary experimental preparation and then employed the same algorithm as Cao et al. to extract urban areas in India [17]. Yang et al. presented a stratified SVM-based method to map urban land in China, which addressed the problem of extracting urban land over a large area with obvious regional variations [18]. However, the above unsupervised classification methods present a number of limitations in the process of sample threshold selection, such as excessive subjective interventions (according to statistical data, accumulated experience, and visual observation-derived assumptions), data sources for selection that present a lack of diversity and inherent defects, and a low degree of overall automation. All of these limitations have led to a reduction in the credibility of extraction results based on these methods. Although other methods have attempted to fully exploit the features of nightlight, the detailed classification of SVM classifiers, and present classification results that are more accurate than those obtained by unsupervised methods that rely on thresholds, areas with blooming vegetation and abundant vegetation (and water pixels) are not totally removed from urban pixels because of the improper selection of samples and human intervention in the classification processes. Thus, further improvements are required to ensure the accuracy of SVM classifications.
Optical remote sensing data with high resolution, such as data extracted from remote sensing image indices and other high-quality land cover data products, are the major datasets used for urban information extraction [19,20,21,22,23,24,25,26,27,28,29,30,31,32,33,34], and such data are far superior to those of DMSP-OLS in terms of image resolution. However, most of these data products have limited temporal coverage and present limited usefulness for a dynamic analysis at large scales. For example, although the class accuracy of each land-cover classification of GlobeLand30 data is generally at a high level [35], this product is still limited by time constraints (i.e., it only contains two terms of data with benchmark years of 2000 and 2010); thus, it cannot meet the practical requirements for monitoring urban spatial change within a long-term time series. More importantly, problems related to the same objects using different spectra and different objects using similar spectra remain unresolved, which increases the difficulty of distinguishing between urban and bare lands simply based on the spectral information obtained from several bands of surface reflectance data. Furthermore, exploring regional or global areas is labor intensive and time consuming because of the massive data volumes involved [36]. Thus, to precisely and reliably extract urban areas, DMSP-OLS data are used as the main data source of the data integration, and spectral information from the surface reflectance data is only used as an auxiliary source.
To address the problems associated with current extraction methods and to improve the credibility and effectiveness of classification results, we proposed a sample-optimized approach that utilizes SVM classification to semi-automatically extract urban built-up areas using an integration of multi-source data. The proposed approach consists of three main steps: (1) Initial sample generation and classification based on the maximum and minimum intervals of the digital numbers from the DMSP-OLS data and the initial training of samples into two-classes of urban built up and non-urban built up areas, which were selected and entered into the first SVM classification; (2) Refined sample selection and optimization using a probability threshold for determining pixels that contain vegetation cover, which uses the Landsat-derived normalized differential vegetation index (NDVI) as a constraint, and artificial surfaces, which uses the GlobeLand30 product as a constraint. The relationships among the three data sources as well as with the training sets were established to optimize the process of SVM classification; (3) An iterative classification and data extraction process for urban built-up areas was developed based on trials evaluating the relationship between the results obtained here and previous results using corresponding refined samples, and the iterative optimization process was terminated when the values reached a certain threshold, which generated the final urban built-up extraction results. All the ideas of our proposed approach are novel in the nighttime light data application field, which differs from other SVM-based extraction methods combined with DMSP-OLS data. To validate the flexibility and robustness of the proposed method, a case study was conducted for several typical regions in western China in 2010. The aim of this study is not to provide an approach for using Landsat or other types of global land-cover datasets alone or to apply classification methods based on the data sources above; rather, the goal is to improve the accuracy of generating training samples for information extraction with a high degree of automation, rationality, and credibility.
The remainder of this paper is organized as follows. Section 2 describes the study area and data sources; Section 3 introduces the proposed method; Section 4 provides the experimental and analytical results; and Section 5 presents the conclusions.

2. Study Areas and Materials

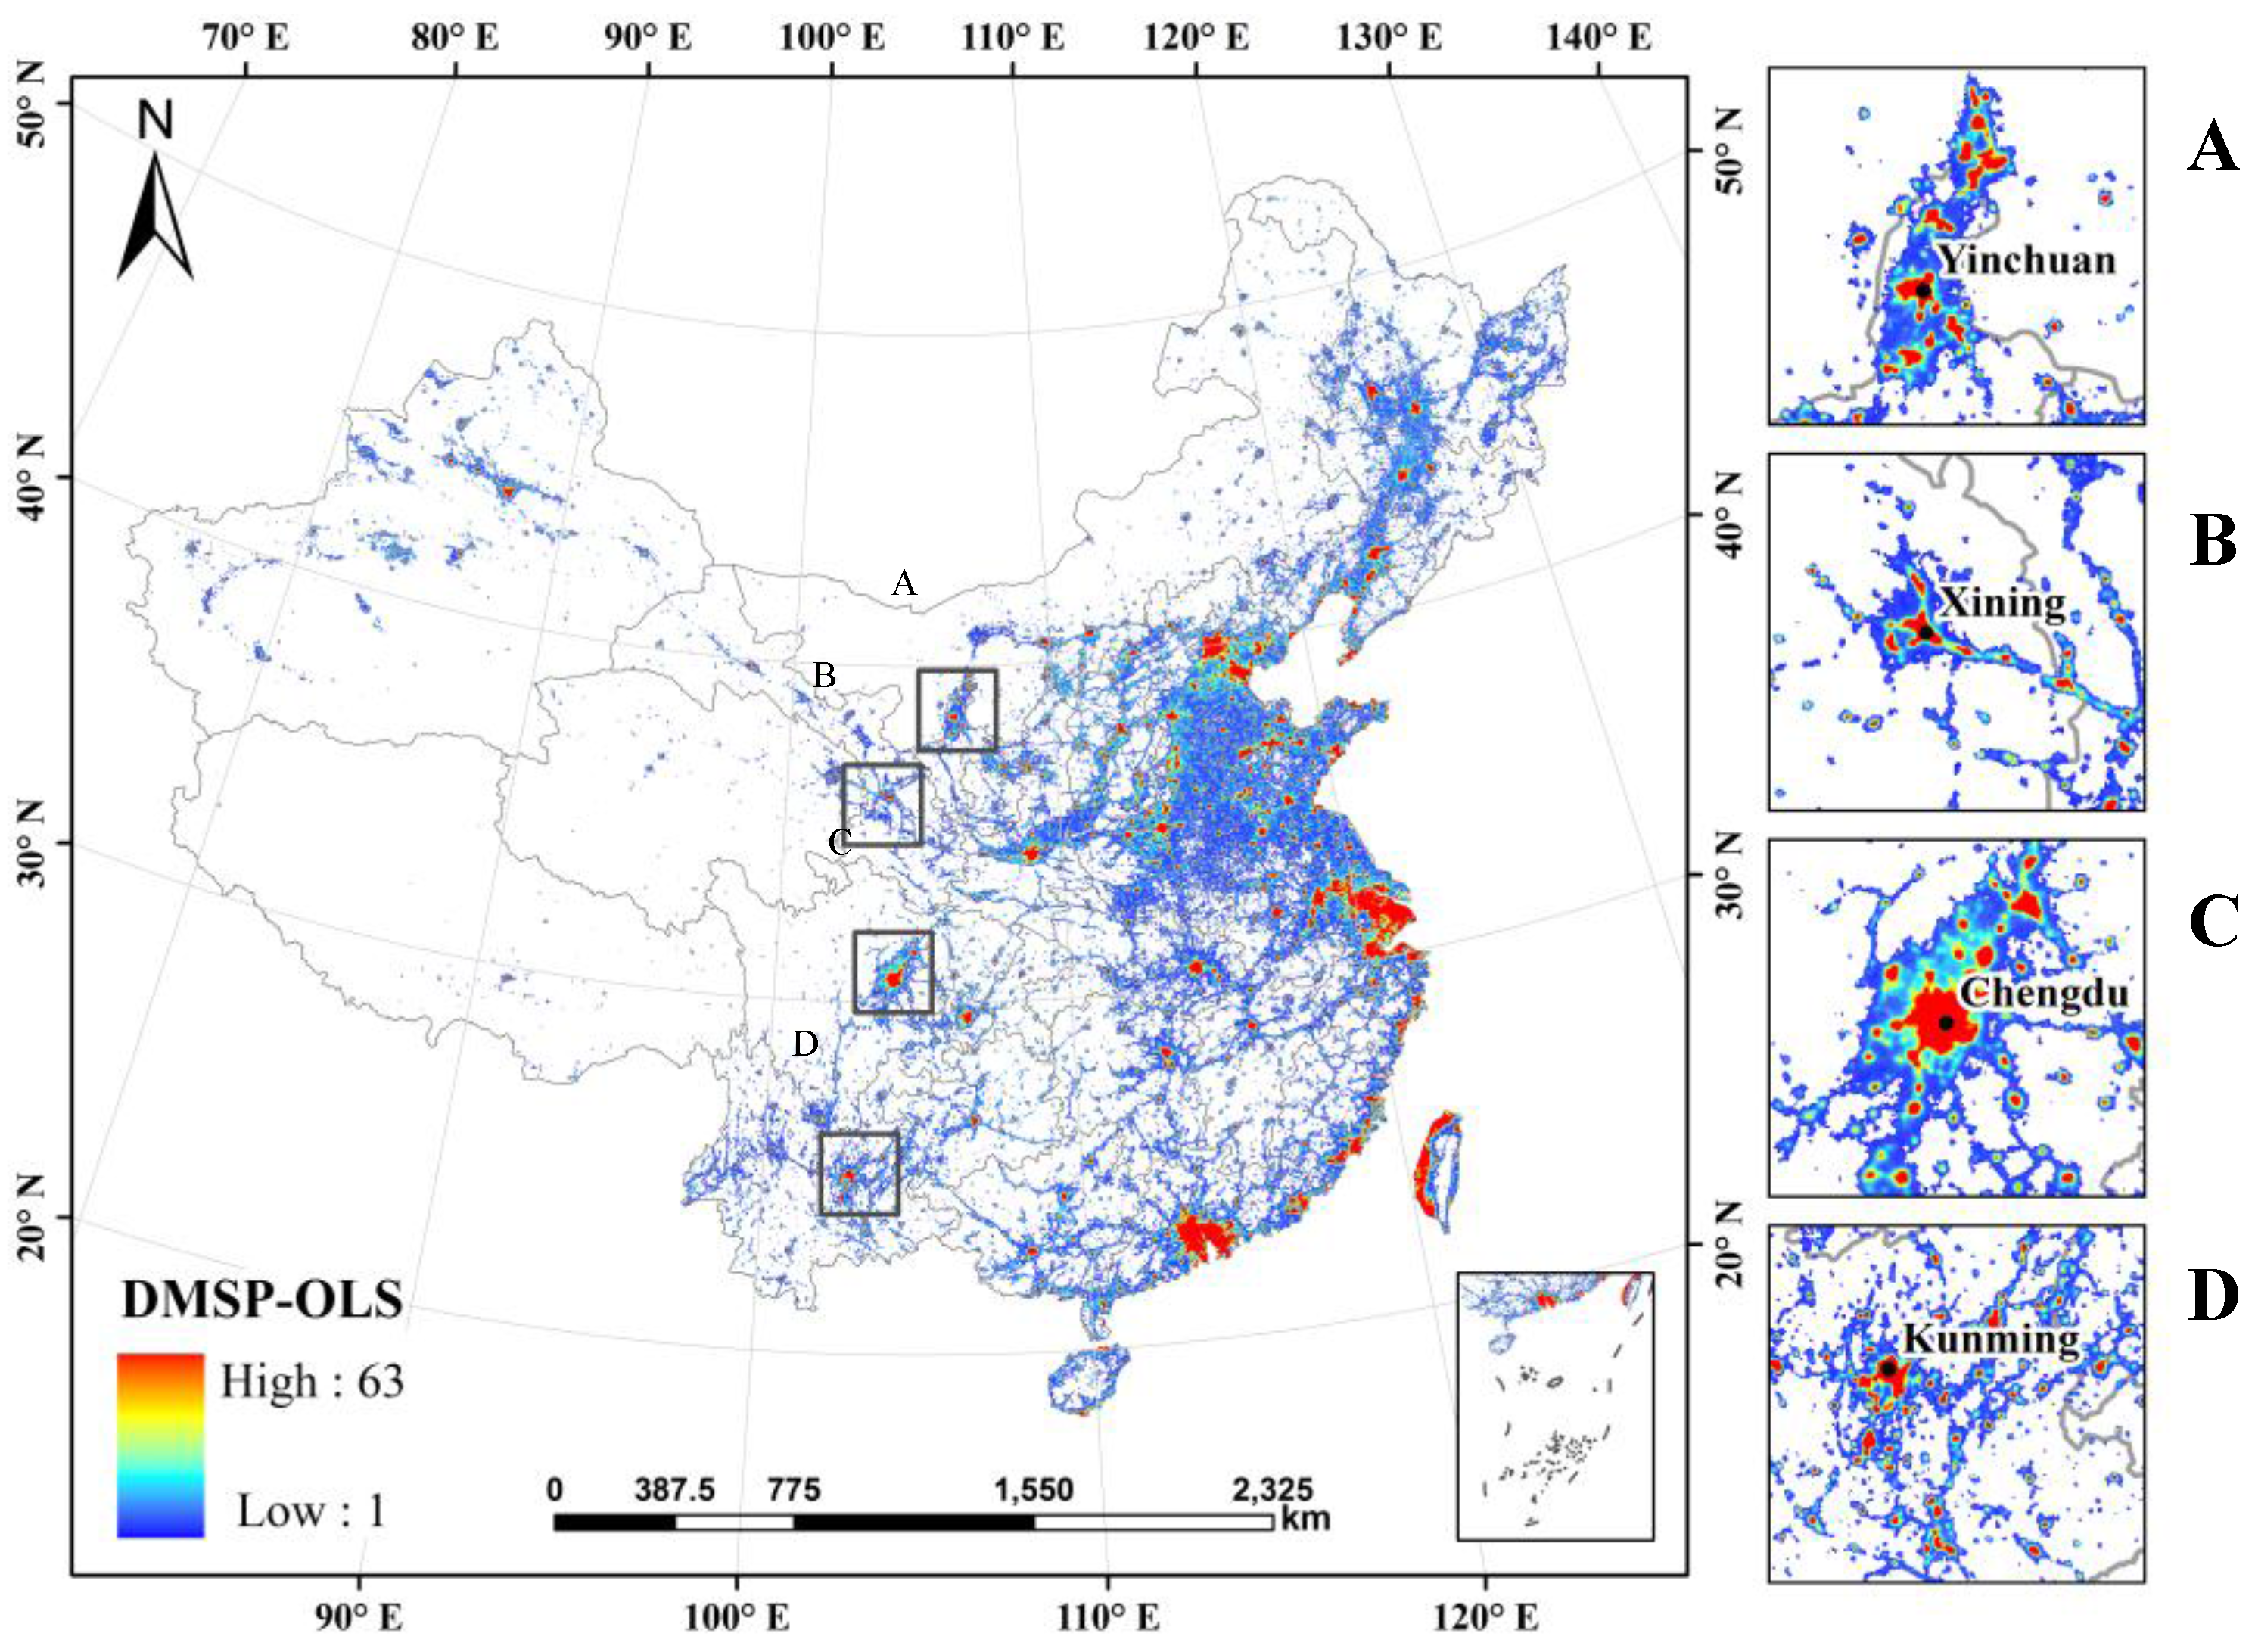
Although China has been experiencing rapid urbanization since the 1980s, large discrepancies remain in the economic development of different regions, especially in western China. With the deepening implementation of the “China Western Development” strategy, which is a Chinese national strategy for economic development and diplomatic efforts, the regional cooperation and coordinated development of cities located in western China are getting increasingly closer. In this study, four provincial capital cities, including Yinchuan, Xining, Chengdu, and Kunming, were selected as typical representative cities of western China, which are regularly among the first echelon of social economic development in Western China. These cities push forward the strategy steadily and achieve significant outcomes in many fields. Particularly in 2010, the population of these cities varied from less than 1.5 million (Yinchuan) to over 11 million (Chengdu), and the per capita gross domestic product (GDP) ranged from less than 40,000 RMB (or 6100 USD) for Xining to over 70,000 RMB (or 10,000 USD) for Chengdu [37].
DMSP-OLS data, GlobeLand30 product data, and Landsat image data were used in this research, and the major characteristics of each data source are summarized in Table 1. All the selected datasets were acquired in 2010.
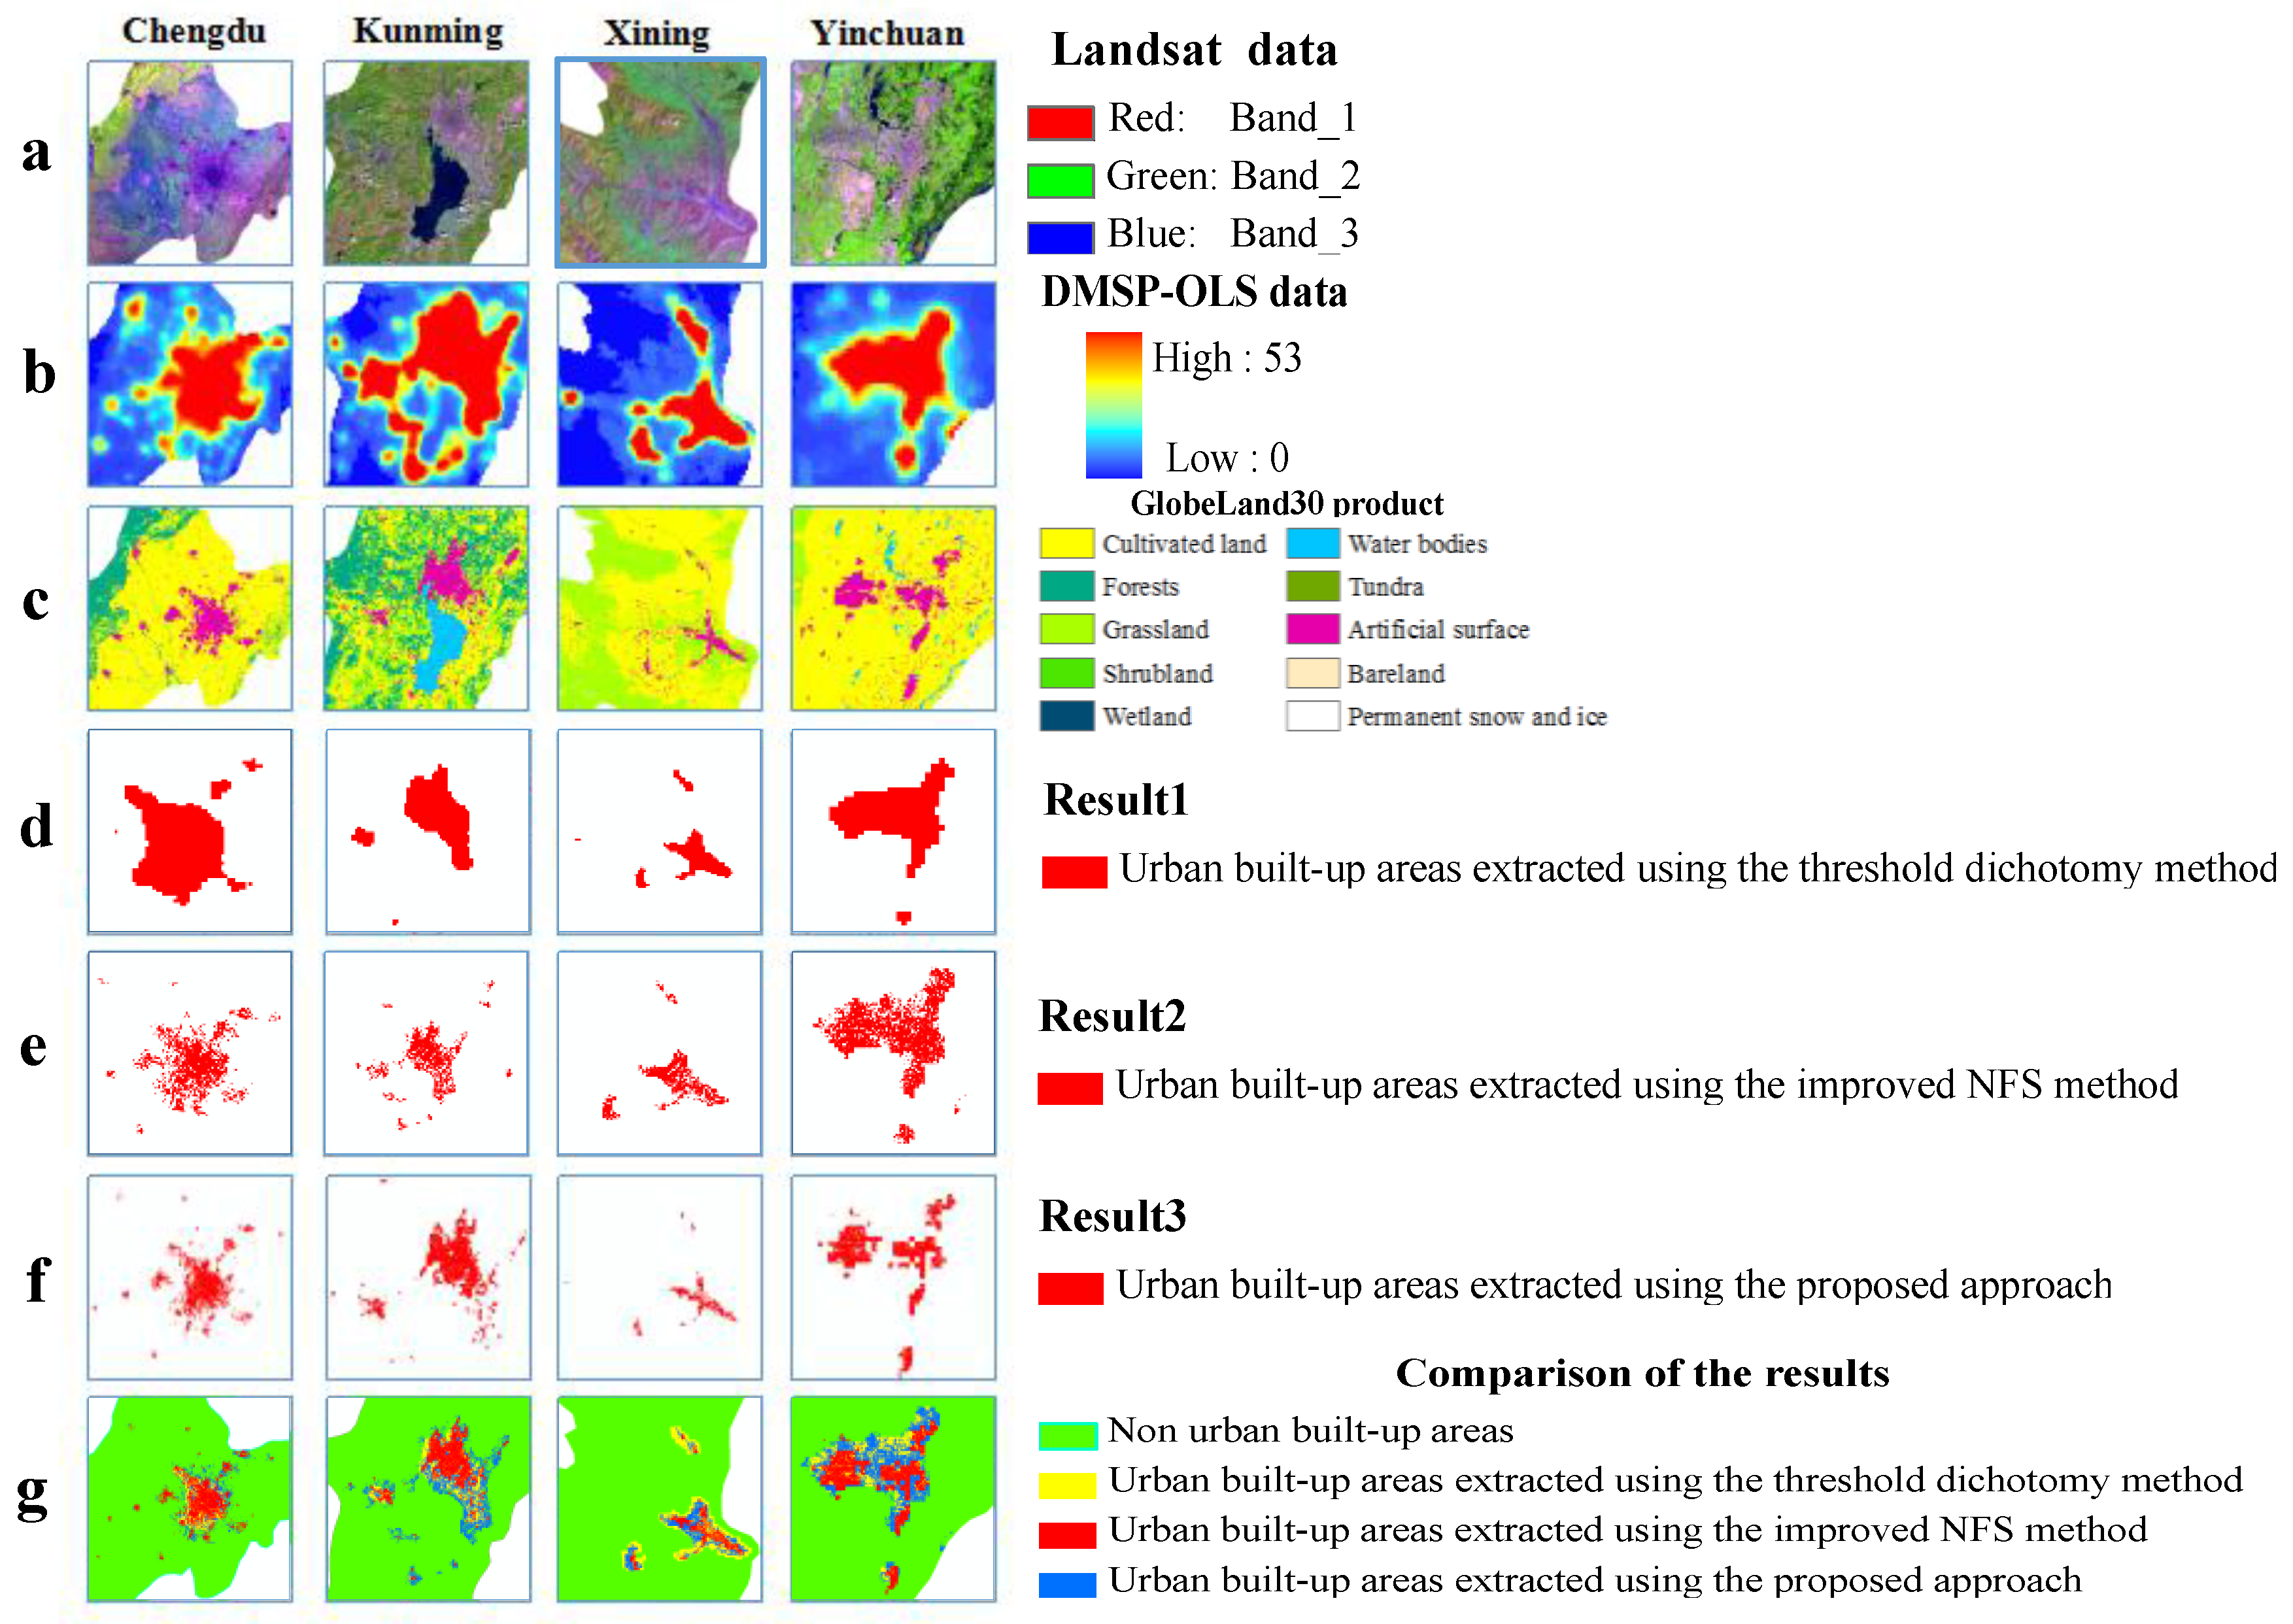
The DMSP-OLS nighttime light data with a 1-km spatial resolution were provided by the National Geophysical Data Center. Stable nighttime light images (Figure 1), which represent a nighttime light data product, are annual raster graphic images that show the average nighttime light intensity, which includes lights in urban and rural areas and permanent lights in other places, but excludes noise, such as moonlit clouds or fires [38]. The digital number (DN) values of these images represent the average light intensity, which ranges from 0 to 63. A value of 0 indicates a completely dark area, which is not the focus of this study, whereas a higher DN value represents greater light intensity in a particular area. The geographic coordinate projection of the data is the World Geodetic System 1984 (or WGS-84), which is transformed into the Asia Lambert conformal conic projection to more accurately calculate the scope of the urban built-up areas in the next stages.
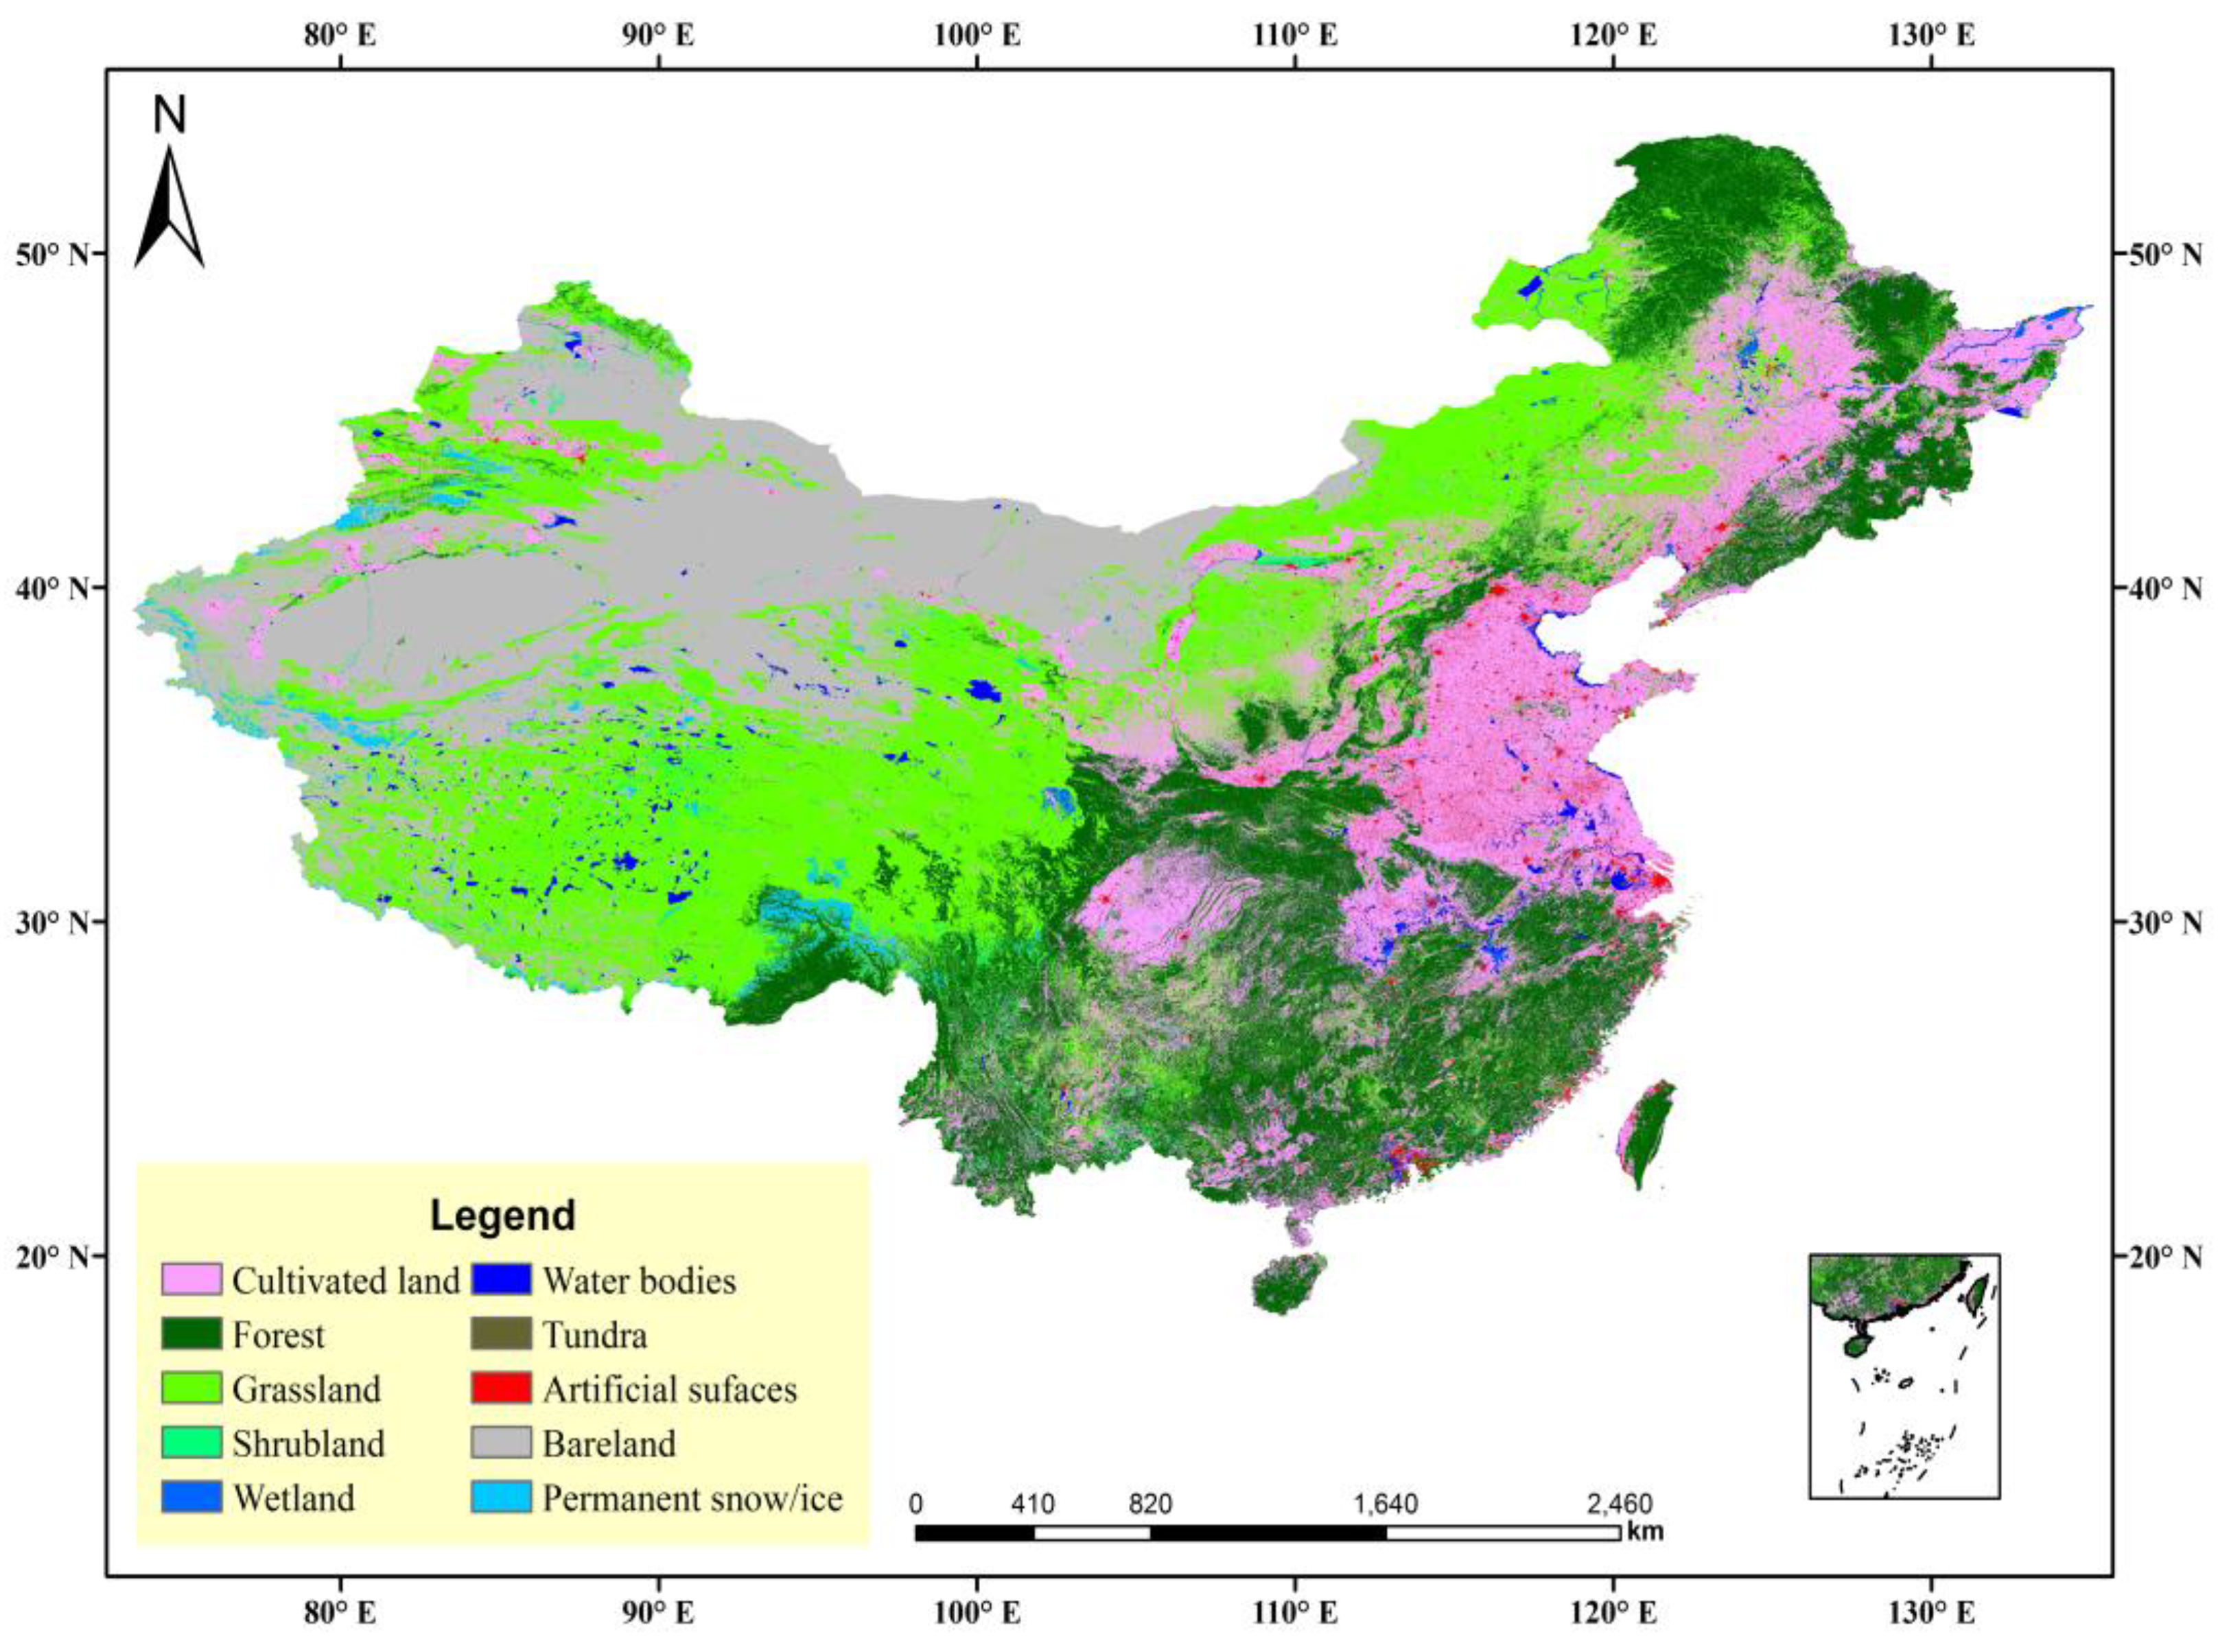
The primary data source was Landsat data from the benchmark years of 2000 and 2010, and the supplemental data included China’s Environmental Disaster Mitigation satellite images and Beijing-1 data in partial areas. Compared with DMSP-OLS data with 1000 m resolution, GlobeLand30 was the latest product with 30 m resolution at a much higher level, which developed based on a pixel classification-object abstraction-knowledge check (POK) method [39]. Ten types of land cover were included: forests, grassland, shrub land, wetlands, bare land, tundra, cultivated land, water bodies, permanent snow/ice, and artificial surfaces (Figure 2). The data were divided by the attribute values of these land cover types to extract artificial surfaces as an independent layer. Artificial surfaces were represented by land cover types covered with asphalt, concrete, gravel, bricks, tiles, and other building materials resulting from human activity, and they included residential areas, transportation, telecommunication, industry, and mining infrastructure. The product information officially verified by GlobeLand30 was reported in the top international scientific journal “Nature” in Volume 514 in 2014. More authoritative information can also be found on the official website of GlobeLand30 [40], which officially reports that the overall accuracy (OA) of an average GlobeLand30 classification is approximately 80.33% globally, the Kappa indicator of the classification is 0.75, and the user accuracy of the artificial surface class for the GlobeLand30 product is approximately 86.70% [39].
In addition, reference data for urban built-up areas are mainly sourced from the China Urban Construction Statistical Yearbook of 2011 [41]. Information on boundaries of urban administrative divisions and urban spatial structures is gathered from the 1:4 million scale vector datasets in the National Fundamental Geographic Information System.
Finally, Landsat product images were acquired to obtain data on the vegetated areas extracted according to the NDVI process. Using Landsat 5, Landsat 7, and Landsat 8 satellite data collected since the 1980s, the Center for Earth Observation and Digital Earth of the Chinese Academy of Sciences (CEODE) selected images with fine quality and produced several different series of advanced remote-sensing data products subjected to atmospheric correction, ortho-rectification, projection transformation, masking, clipping, and other types of processing. According to the study areas, we used four images from this product (2010) with a spatial resolution of 30 m, which were acquired directly from the Product Data Service Plan at the CEODE [42].

3. Methods

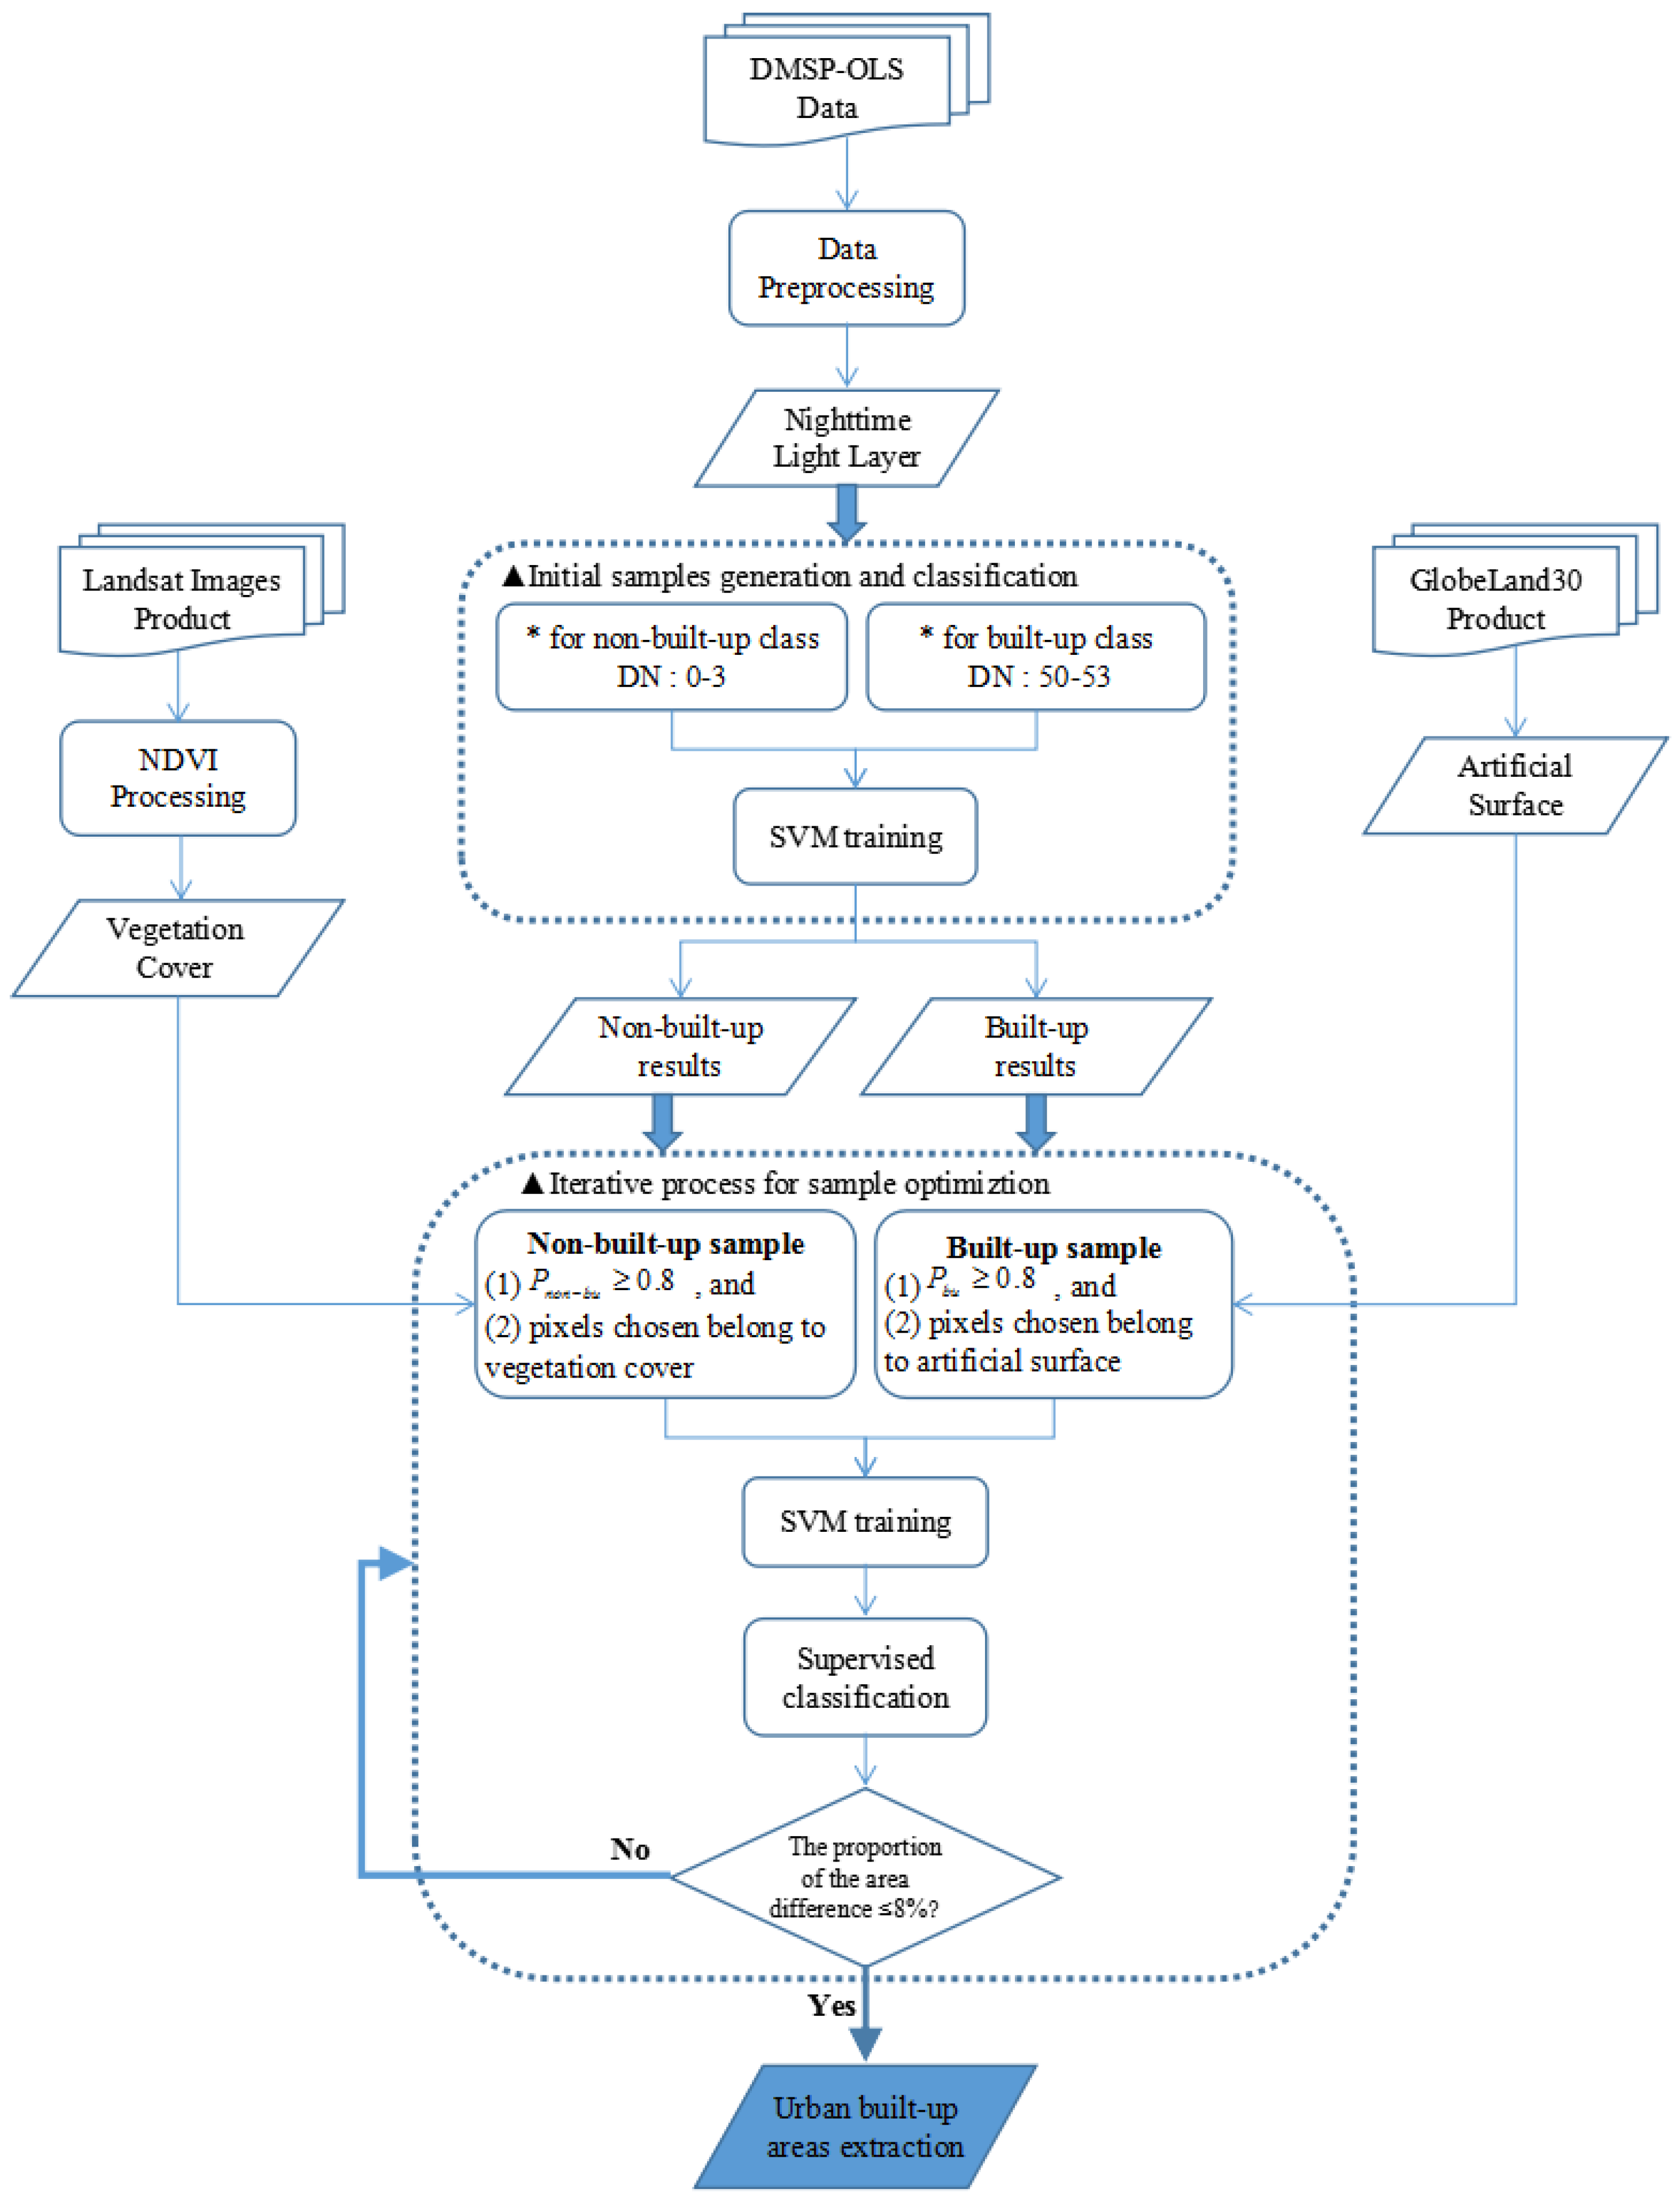
A sample-optimized approach for SVM classification was proposed to extract urban built-up areas with a high degree of credibility. The flowchart of the proposed approach is shown in Figure 3, and it consists of several steps: (1) preprocessing of the DMSP-OLS and Landsat data; (2) initial sample generation and classification; (3) iterative sample optimization process; and (4) SVM classification for urban built-up area data extraction. As the core of this approach, steps 2–4 are introduced in a single section.

3.1. Data Pre-Processing

DMSP-OLS datasets currently include images covering the 22 years from 1992 to 2013. Because satellites are subject to rapid upgrades, the data from different types of satellites present varying quality and light saturation phenomena [43,44]. Therefore, this article used the calibration method for long time series DMSP-OLS nighttime light image datasets, proposed by Cao et al. in 2009, to preprocess the remote sensing data for nighttime lights in 2010 [45]. The major steps are the mutual calibration of the raw data images and the calibration between each image series (fusion for data in the same year and calibration for data in different years). A mutual calibration is adopted for long time series datasets using the regression model presented in Formula (1) after the re-sampling and re-projection processes:
DNcal = a × DNb
In Formula (1), the DN represents the pixel value of the images ready to be calibrated; DNcal represents the pixel value of the calibrated images, and a and b are two parameters obtained after the power regression. The parameter values for the power regression of the calibrated images and reference images in the test as well as estimates of other relevant coefficients, such as R2, from 2006 to 2012, are listed in Table 2. The corresponding power equation was used to perform a mutual calibration of the images for each period in China (including the data from 2010). This saturation correction processing of the DMSP-OLS data generated DN values for the DMSP-OLS data in the range of (0, 63) to (0, 53). A masking process was then performed for the images resulting from the aforementioned steps, and were then used against the administrative backdrop of Chengdu, Kunming, Xining, and Yinchuan.
In addition, vegetation-cover data were extracted using the NDVI from Landsat images, and this information was combined into the sample optimization process in the subsequent steps. The NDVI is a superior vegetation indicator and can effectively reflect the growth, coverage, and dynamic seasonal changes in vegetation [46,47,48]. For remote sensing images, the NDVI in Formula (2) is calculated as follows:
NDVI = NIR R NIR + R
Vegetation has strong reflectivity in the near-infrared (NIR) band and weak reflectivity in the red (R) band, which are represented by band 4 and band 3 in the Landsat images, respectively. After the normalized ratio calculation, the brightness of the vegetation in the images could be enhanced to the fullest and other ground objects could be restrained. The NDVI ranges between −1 and 1. Because of the differences among the distribution of vegetation cover in different regions, the optimal threshold between vegetated and non-vegetated cover was defined based on a histogram distribution of the NDVI values after an extensive statistical analysis of the entire number of pixels from the corresponding regions. Pixels with NDVI values that exceeded this threshold were considered vegetation cover; this is a required step for the experiment.

3.2. Sample Optimization in SVM Classification

Because greater DN values for lights indicate a greater possibility of a point belonging to an urban area, researchers have successively combined the SVM classification with nightlight time data [49,50] and have adjusted and set an “optimal threshold” according to certain features, such as areas or shapes that cannot be universally applied to cities at different scales, geographical locations, and different development stages. Accordingly, Cao et al. [16] attempted to utilize the region-growing concept in SVM sample training, in which the input urban pixels that meet the baseline criteria for a definitive selection were assigned as seeds. Then, all pixels that utilized a window of 3 × 3 pixels for each seed were classified simultaneously by the SVM-based classifier in the iterative procedure.
Although the above sample selection approach based on neighboring seeds achieved good results in the accuracy assessments and avoided the tedious trial-and-error procedure, it could not guarantee the accuracy of the training samples in the SVM classification. In addition, the reliability of the classification results required further improvement. Therefore, a sample-optimized approach was proposed that combines the SVM classification, a post-probability threshold, and multi-source data integration. There are three steps within the proposed sample-optimized procedure: generation and classification of initial samples, selection and optimization of refined samples, and iterative classification and urban built-up area extraction.

3.2.1. Initial Samples Generation and Classification

Because built-up urban areas are illuminated artificially at night, their corresponding pixels in nighttime light images have larger DN values than the surrounding dark rural areas [51,52]. Based on previous results, the DN value range (50, 53) was selected as the maximum interval of the built-up class, and the DN value range (0, 3) was selected as the minimum interval of the non-built-up class. Patches with DN values in these ranges served as the initial training sets and were input into the SVM classifier using a radial basis function kernel. Although patches with DN values within the range (3, 50) must be further identified, the initial classification results roughly segmented the images into urban built-up areas and non-built-up urban areas.

3.2.2. Refined Samples Selection and Optimization

The SVM method is capable of identifying the class label and generating the post-probability of each class, which represents one of the most important indices in SVM classification. Previous studies have converted the outputs of the SVM into pairwise coupling post-probabilities, and various types of post-probabilities have been generated from such pairwise coupling post-probabilities. In this paper, for two categories of land-cover features, the posterior probability of SVM can be obtained by pairwise coupling according to its predicted output values. Such pixel-specific post-probability can be used as land cover composition information, which means that every pixel has a different attribute probability for each surface feature class, and the pixel is assigned to the class with the highest probability as its class information [53]. Therefore, we defined a post-probability value P to set the likelihood for each pixel and determined the “true” probability of a pixel belonging to a specific classification category. Pixels with all rule probabilities less than P are unclassified. In addition, a critical threshold value T defined as 0.8 represented a highly credible threshold value probability outputted after SVM classification for both built-up and non-built-up classes (i.e., P b u T and P n o n b u T ), to select samples with higher credibility from the results of previous classifications. The threshold value T (i.e., T = 0.8) indicates a high credibility level based on the class probabilities of SVM classification. It is important to note that the value of T is defined after many trials. Although it may be somewhat subjective, it is indeed a basic input guarantee for our sample optimization process in the next step, so as to extract reliable and sufficient results.
For the selection of refined samples, the probability threshold T was defined with two constraints, i.e., the vegetation cover and artificial surface classifications obtained in the data preprocessing stage, and then the relationships among the three data sources as well as with the SVM training sets were established.
As shown in Table 3, the training sets of the urban built-up class were selected as the pixels that belonged to artificial surfaces, and they also met P b u T . Training sets of the non-urban built-up class included the vegetation-covered pixels based on NDVI processing, and they also met P n o n b u T . In each iteration, the value T was used as a condition that constrains the posterior probability value P. It also constrains the selection of the training sample together with vegetation elements and artificial surface elements. After the refined selection process for both classes was completed, these training samples can be involved in the process of SVM classification. Misclassification alarms and false alarms will be greatly reduced according to the designed progressive iterative optimization process for SVM classification.

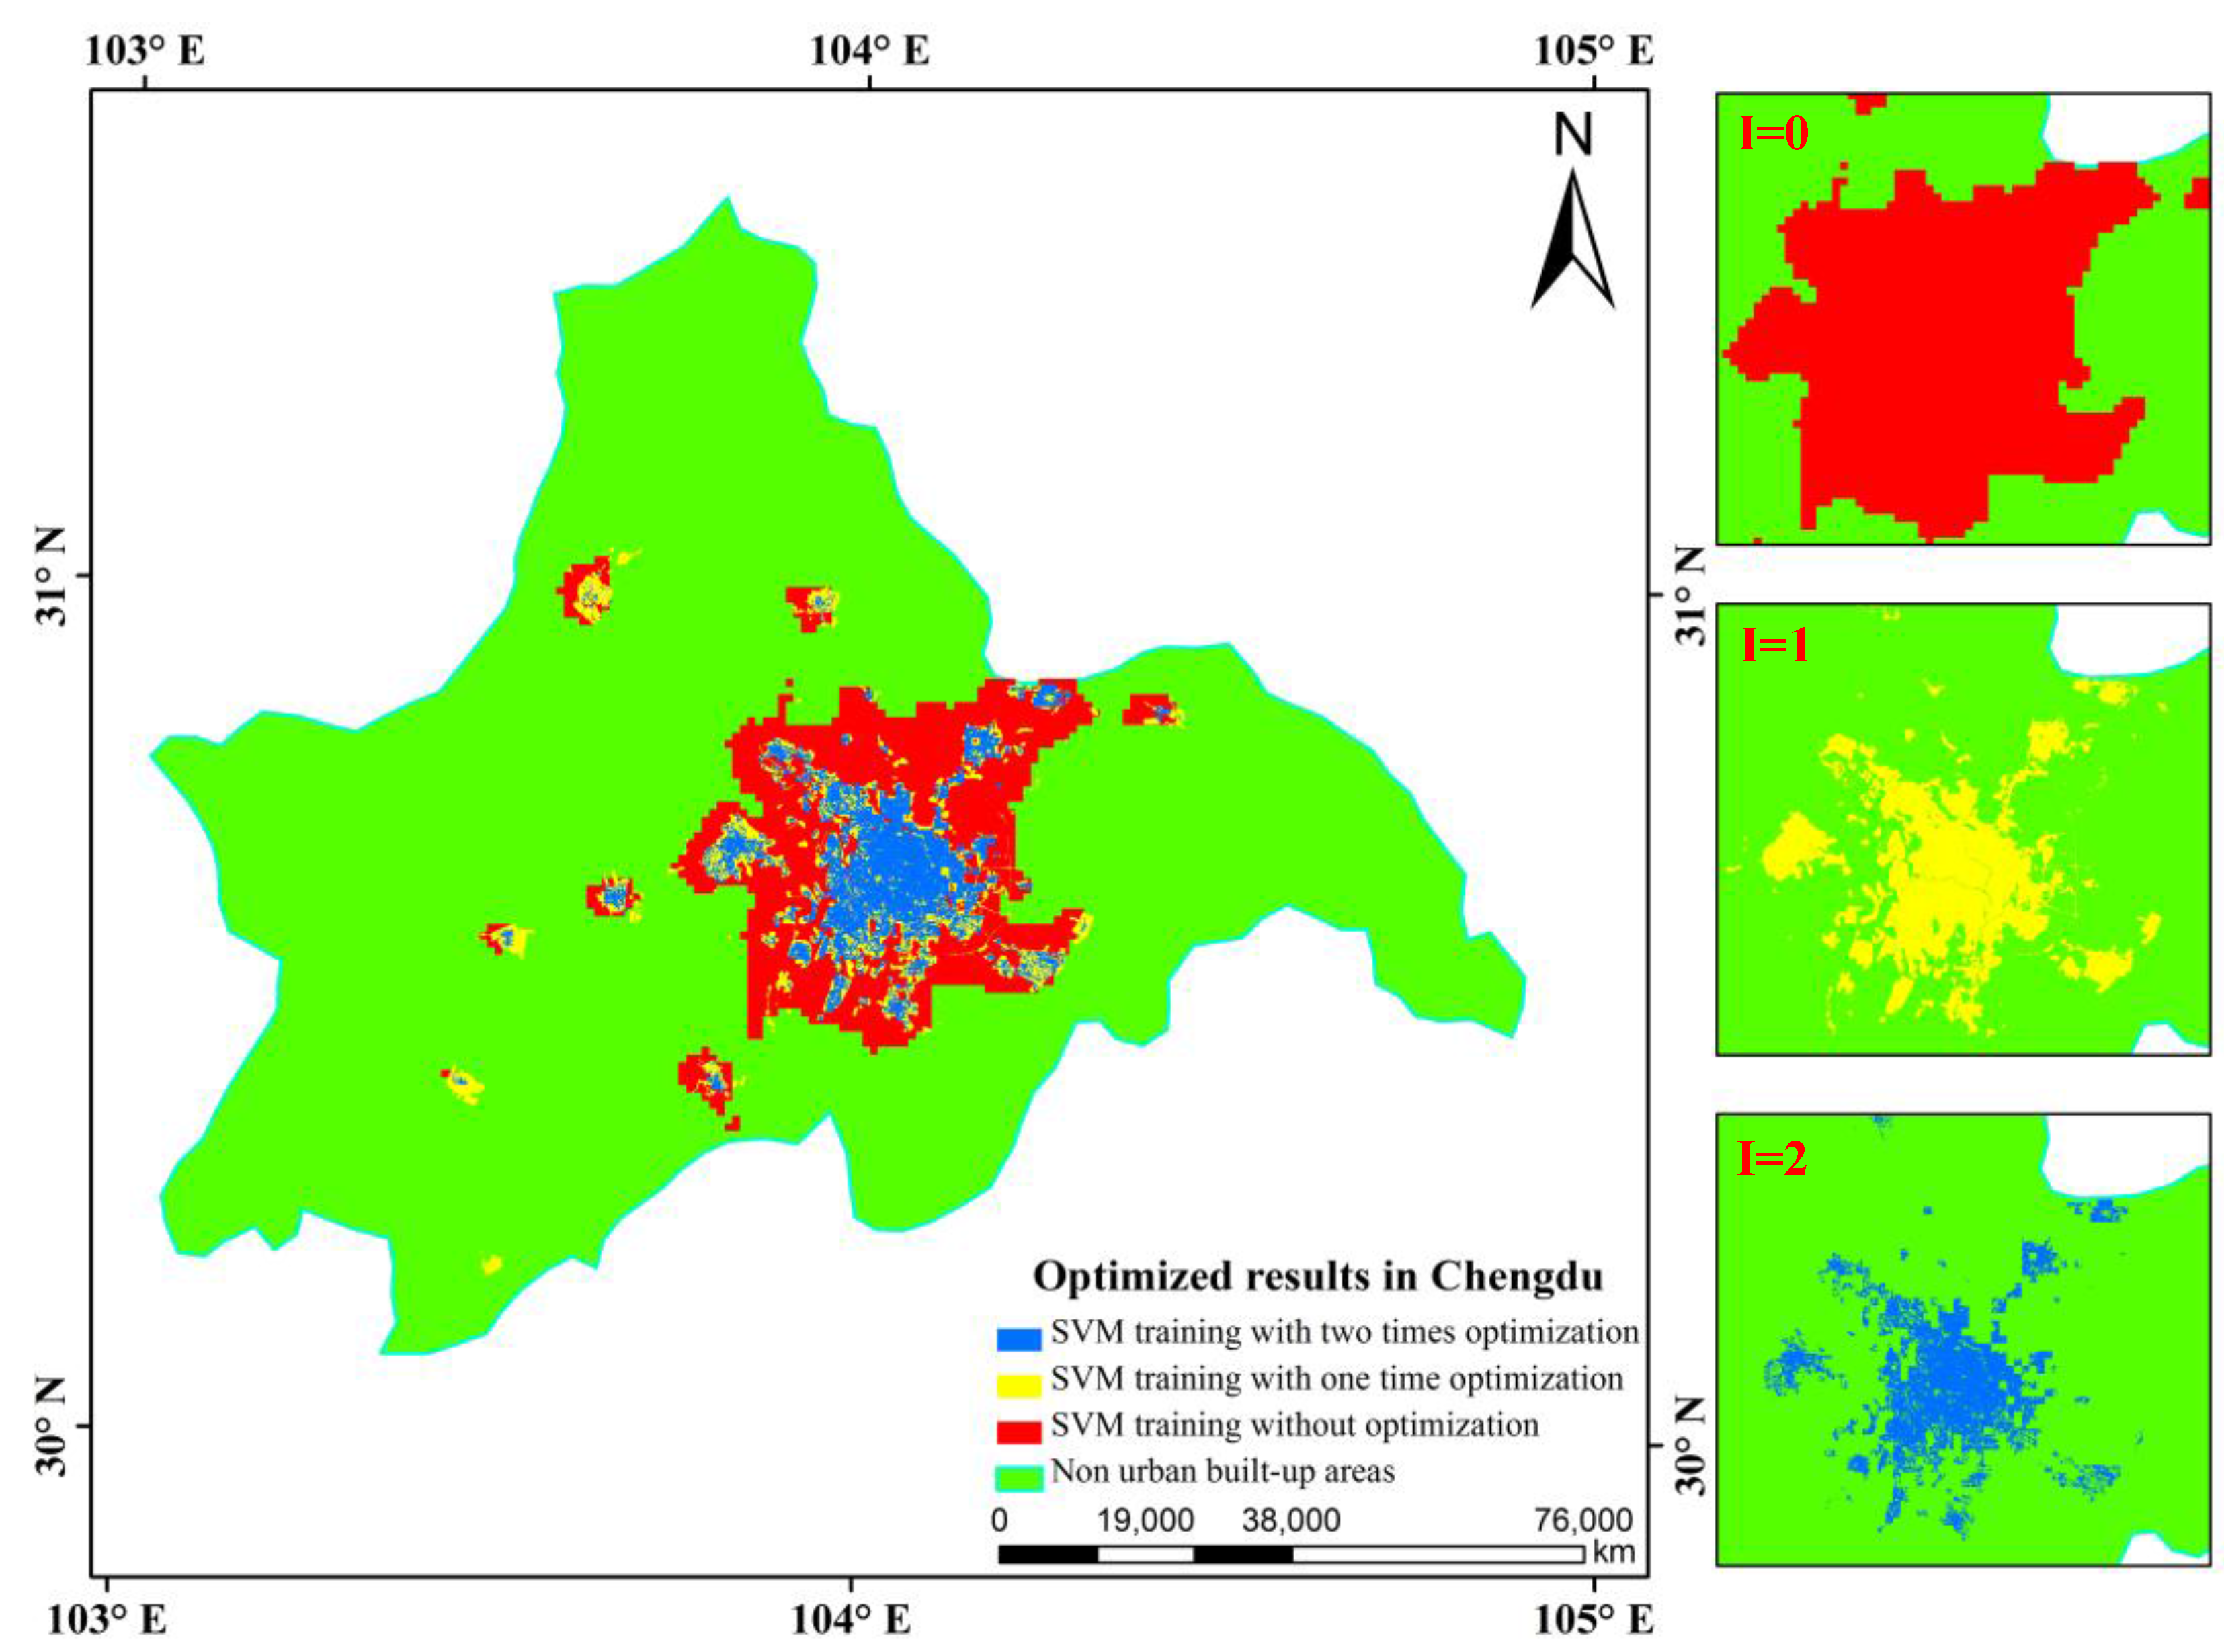
3.2.3. Iterative Classification and Urban Built-Up Area Extraction

When each SVM classification was finished, the total areas of built-up patches were easily calculated from the present and the previous results via the corresponding selected samples, which are denoted as Areapresent and Areaprevious, respectively. θ is defined as the proportion of the area difference between Areapresent and Areaprevious to the total area of pattern spots (Areatotal) in Formula (3):
θ = A r e a p r e s e n t A r e a p r e v i o u s A r e a t o t a l
Based on many trials evaluating the relationship among Areapresent, Areaprevious, and θ, the iterative optimization process was conducted until θ finally reached full convergence, such as θ ≤ 0.08, which can guarantee the high accuracy requirement for the actual sample iteration and optimization and allow the continuous sample-optimized classification method to extract the optimal built-up results. This iterative updating procedure increases the rationality and objectivity of classifications and avoids possible problems caused by verbose and repeated processes. Thus, the credibility and ability to automate the classification results are both greatly enhanced.

3.3. Two Methods for Experimental Comparison

In our experiments, two data extraction methods were used to compare the performance of the proposed method. The first method was the threshold dichotomy method [54,55], which primarily performs continuous circular comparisons between urban land patterns in a spot area and statistical data from the varied nightlight DN values until the urban land pattern spot area is extracted by the specific threshold value that best approximates the statistical data, and this area is where the urban land is ultimately classified. The second method was the improved neighborhood focal statistic (NFS) method [56], which primarily identifies central and marginal urban areas using maximum and minimum NFS calculations of DMSP-OLS data while eliminating vegetated features and water bodies using multi-source geographic data integration to extract the optimal urban areas. Studies have indicated that both methods are useful for extracting urban built-up area data.

4. Experimental Results and Analysis

This study focused on four cities with relatively low levels of urban development in western China: Chengdu, Kunming, Xining, and Yinchuan. Because the spatial resolution of Landsat images is much finer than that of the nighttime stable light data, evaluating the results using Landsat data is a feasible and acceptable approach [57,58]. To quantify the performance of the threshold dichotomy method, the improved NFS method, and our proposed method, we performed accuracy assessments using Landsat images as the reference data and considered these methods as different schemes of urban area data extraction. The respective results should be compared with those extracted from Landsat images according to visual and quantitative comparisons of pattern spots.

4.1. Results of Sample Optimization

By using the sample results for the iterative updating process for Chengdu shown in Table 4, the quantity of selected samples at different stages could be obtained and the corresponding accuracy assessment for their training results could be performed. Table 4 shows the iteration time (defined as I), the number of selected samples of built-up areas, two classes of non-built-up areas, and accuracy evaluation indexes for the corresponding training results (i.e., producer accuracy, user accuracy, and OA). For the initialization (i.e., I = 0), the aforementioned samples were manually selected using the DN values of the DMSP data; thus, these samples had not been subject to iterative procedures, which means the training process did not contain any auxiliary data, features, or index factors. As I increased, the samples in the built-up areas and non-built-up areas were continually selected and refined according to the iterative updating process, and the accuracy indexes largely increase, especially the value of OA, which increased from 0.89 to 0.96. Moreover, the producer accuracy changed in an opposite manner to that of the other accuracy indexes shown in Table 4 because the selection mechanism of the original samples (when I = 0) was completely different from the mechanisms (when I ≥ 1) involved in the iterative updating procedure.
The results based on SVM training with two optimizations (when I = 2) were much finer than the results that only included SVM training without sample optimization or auxiliary data (when I = 0) for certain characteristics, such as the shape and size of the pattern spots (Figure 4). Although high similarity was maintained with the results obtained by SVM training with one optimization (when I = 1) and two optimizations (when I = 2), certain nuances that indicated vegetated pixels could be easily distinguished from urban pixels, and further optimization of the training samples was sufficient to guarantee an extraction of urban built-up results with a high degree of credibility.

4.2. Results of Urban Built-Up Areas

Figure 5a–c shows the entire study area based on Landsat images, DMSP-OLS data, and the GlobeLand30 product. The threshold dichotomy method (Figure 5d) tended to identify continuous urban built-up extents because of the blooming effect observed using the DMSP-OLS data, whereas the improved NFS method (Figure 5e) extracted urban built-up areas with the maximum/minimum NFS calculations and removed natural features (vegetated and water) based on the NDVI criteria and water body data integration. Figure 5f shows the urban built-up results extracted by our proposed approach. A visual comparison of the extraction results obtained with the different methods shows that Chengdu, Kunming, Xining, and Yinchuan were extracted well by any one of the three methods mentioned above (Figure 5g). However, for the size, shape, and distribution of the urban built-up patches, the results extracted with the proposed method presented finer details than those with the improved NFS method and far exceeded the patches produced by the threshold dichotomy method. Furthermore, the results of the proposed method were generally consistent with the statistical data of the urban built-up areas in the accuracy assessment, and a low relative error of less than 10% was observed (Table 5).
Although the four experimental cities are all of a prefecture-level scale, their urban distribution and characteristics, as well as their levels of development and change, all differ. In addition, deviations are observed between the surface features derived from remote sensing images at different scales and the actual features, and these deviations are even more obvious for remote sensing images with low or moderate resolution. The DMSP-OLS data adopted in this paper have relatively low resolution, and such an imbalance could not be completely avoided, despite adding the constraint of auxiliary data, which included the GlobeLand30 product with a 30-m resolution. Overall, these uncertainties might lead to overestimation or underestimation in the extraction results.

4.3. Assessment of Accuracy for Urban Built-up Areas

For the sake of brevity, the derived urban built-up results of Chengdu and Kunming were selected for the detailed quantitative analysis of the pattern spots. With respect to the form of the pattern spots, Figure 6 shows that the results obtained for both Chengdu and Kunming by the three methods were generally similar and comparable in detail to those obtained using Landsat images. Although the overall trend of the pattern spots obtained by the threshold dichotomy method demonstrated a planar tiling distribution and was roughly consistent with the results of the Landsat images, the classification did not return results for several areas because of light segmentation or differences between multi-sensor data. Therefore, the precision was not sufficient for conducting further research on urban built-up areas. The results extracted with the improved NFS method far exceeded those using the threshold dichotomy method with respect to the overall morphological distribution or data extraction accuracy; however, the results were significantly different from the Landsat image results and included various degrees of misclassified pattern spots in several regions. Compared with the two methods above, the results obtained using our proposed approach were more consistent than those obtained using the Landsat data. Despite the misclassification or classification omissions of certain pattern spots in scattered regions, the results showed better performance than that of the other two methods both in precision and visual effect.
Although the proposed approach is superior to the other two methods, visual and quantitative comparisons of the pattern spots indicated that commission errors (CEs) and omission errors (OEs) were not avoided because of the influence of light saturation and problems associated with the use of sensors of various quality. However, the results still showed that the proposed method produced less CEs on average than the threshold dichotomy method and demonstrated an approximately 30% improvement in OEs compared with the other two methods. Although high Kappa and OA values were obtained with the improved NFS method and the proposed method, the improved NFS method did not implement correction processing specific to the light saturation phenomenon or data differences among the various sensors; thus, relatively significant deviations were observed among the tests. Consequently, significant differences were observed in the CEs and OEs, as shown in Table 6. These results indicate that the proposed approach reduced the defects of various data sources and guaranteed the extraction accuracy and authenticity of the urban built-up pattern spots.

5. Conclusions

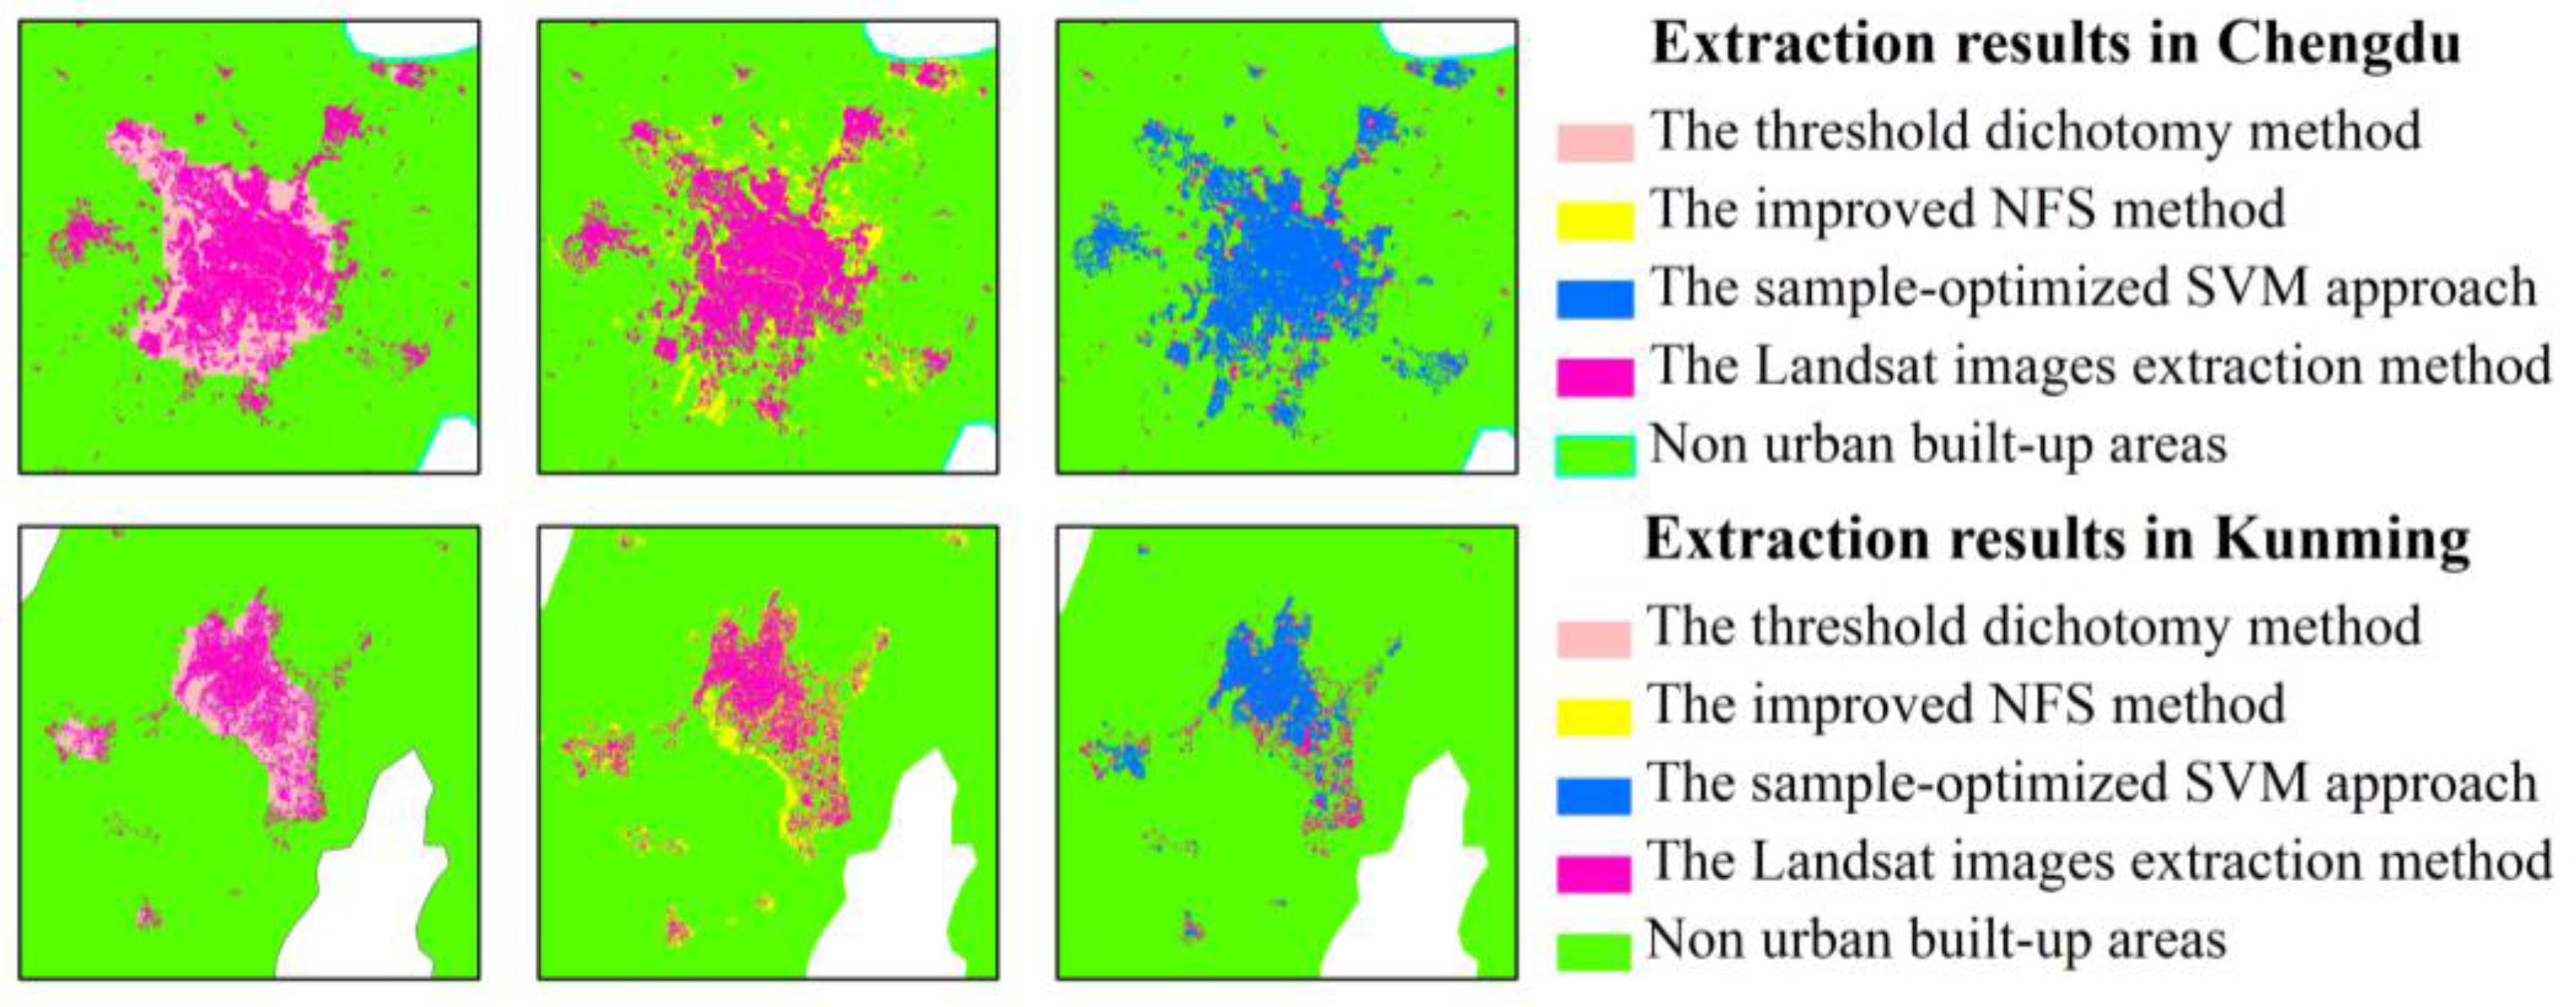
This paper presented a sample-optimized approach for SVM classification based on a combination of DMSP-OLS nighttime light layer data, artificial surface data from the GlobeLand30 product, and vegetated regions from Landsat images, which were used as criteria for the selection of training samples to identify optimized samples that represent built-up areas and non-built-up areas according to an iterative updating procedure. This method can successfully remove the above land-cover categories such as vegetation and bare land from the built-up areas, and obtain the areas which have been developed and constructed with basic municipal utilities and public facilities in the urban administration region. Our proposed approach is novel in the nighttime light data application field and different from other SVM-based extraction methods using DMSP-OLS data in the cited literature. In terms of the overall distribution of extracted built-up urban patches, the samples identified by the proposed method were finer than those of the threshold dichotomy method and the improved NFS method.
An empirical experiment and a detailed accuracy assessment indicated the following: (1) the results extracted using the proposed approach were accurate for pattern spots of urban built-up areas and highly consistent with those extracted using Landsat images in 2010; (2) the results of the experimental comparison with the two other methods confirmed the effectiveness of the proposed approach because it generated improved CE and OE ratios and higher OA and Kappa coefficients; (3) the proposed approach integrates various factor features into the steps of the SVM sample configuration, which is superior to a simple overlay analysis of all the feature layers, and the combination of factor features with the classification probability threshold optimized samples to satisfy the condition requirements for an iterative updating process that can reduce false and misclassification errors; (4) by exploiting the classification accuracy of the GlobeLand30 product, the proposed approach merges the advantages of multi-source remote sensing in representing urban information to obtain highly accurate final urban extraction results. This paper mainly focused on the relationship between DMSP-OLS nighttime light data and the SVM classification; thus, our work is highly specific and unique from an application perspective.
Limitations included the insufficient temporal types in the GlobeLand30 product and the coarse resolution and blooming effect of the DMSP-OLS data; thus, the accuracy of the urban spatial information extracted using the proposed approach requires further investigation. However, this approach optimizes the sample selection process without relying on statistical data and improves the efficiency and precision of SVM classifications. In addition, the proposed method largely avoids the drawbacks associated with using a single data source. The proposed approach is a timely and cost-effective method of monitoring the spatial patterns and temporal dynamics of urban areas as well as geographic conditions on a national scale. In future works, we will devote additional efforts towards improving the proposed approach by investigating spatio-temporal variations in some typical regions, such as ghost towns, as well as regional dynamic monitoring based on updates to the GlobeLand30 products and the availability of additional long time series data.

Acknowledgments

This work was partly supported by the Natural Science Foundation of China (Project Nos. 41631178, 41325005 and 41601354), the GIS-based Urban Spatio-Temporal Data Mining Project (Project No. 7771526), the Technology Integration and Demonstration for Planning and Design of Smart Town Based on Geographic Information (Project No. 2015BAJ06B01), the Geo-coding and geographical location-based model/the key techniques in visualization (Project No. 201512020) conducted by the Chinese Academy of Surveying & Mapping, and the Fundamental Research Funds for the Central Universities, and we would like to thank the National Geomatics Center of China (NGCC), National Geophysical Data Center (NGDC), and Center for Earth Observation and Digital Earth (CEODE) in the Chinese Academy of Sciences for supporting the used data in this study.

Author Contributions

Xiaohua Tong conceived and designed the study. Xiaolong Ma contributed to the conception of the study, performed the data analysis, and wrote the paper. Sicong Liu gave some suggestions on the method and experiments. Xin Luo and Huan Xie gave some suggestions on the study. Chengming Li supported and supervised the research. Both Xiaohua Tong and Sicong Liu have reviewed and edited the manuscript.

Conflicts of Interest

The authors declare no conflict of interest.

References

  1. Zhou, Y.; Smith, S.J.; Elvidge, C.D.; Zhao, K.; Thomson, A.; Imhoff, M. A cluster-based method to map urban area from DMSP/OLS nightlights. Remote Sens. Environ. 2014, 147, 173–185. [Google Scholar] [CrossRef]
  2. Small, C.; Elvidge, C.D. Mapping decadal change in anthropogenic night light. Procedia Environ. Sci. 2011, 7, 353–358. [Google Scholar] [CrossRef]
  3. Huang, X.; Schneider, A.; Friedl, M.A. Mapping sub-pixel urban expansion in China using MODIS and DMSP/OLS nighttime lights. Remote Sens. Environ. 2016, 175, 92–108. [Google Scholar] [CrossRef]
  4. Zhang, Q.; He, C.; Liu, Z. Studying Urban Development and Change in the Contiguous United States Using Two Scaled Measures Derived from Nighttime Lights Data and Population Census. GISci. Remote Sens. 2014, 51, 63–82. [Google Scholar] [CrossRef]
  5. Yu, B.; Shu, S.; Liu, H.; Song, W.; Wu, J.; Wang, L.; Chen, Z. Object-Based Spatial Cluster Analysis of Urban Landscape Pattern Using Nighttime Light Satellite Images: A Case Study of China. Int. J. Geogr. Inf. Sci. 2014, 28, 2328–2355. [Google Scholar] [CrossRef]
  6. Bagan, H.; Yamagata, Y. Analysis of Urban Growth and Estimating Population Density Using Satellite Images of Nighttime Lights and Land-Use and Population Data. GISci. Remote Sens. 2015, 52, 765–780. [Google Scholar] [CrossRef]
  7. Shao, Z.; Liu, C. The Integrated Use of DMSP-OLS Nighttime Light and MODIS Data for Monitoring Large-Scale Impervious Surface Dynamics: A Case Study in the Yangtze River Delta. Remote Sens. 2014, 6, 9359–9378. [Google Scholar] [CrossRef]
  8. Imhoff, M.L.; Lawrence, W.T.; Elvidge, C.D.; Paul, T.; Levine, E.; Privalsky, M.V.; Brown, V. Using nighttime DMSP/OLS images of city lights to estimate the impact of urban land use on soil resources in the U.S. Remote Sens. Environ. 1997, 59, 105–117. [Google Scholar] [CrossRef]
  9. Henderson, M.; Yeh, E.T.; Gong, P.; Baugh, K. Validation of Urban boundaries derived from global night-time satellite imagery. Int. J. Remote Sens. 2003, 24, 595–605. [Google Scholar] [CrossRef]
  10. He, C.; Shi, P.; Li, J.; Chen, J.; Pan, Y.Z.; Li, J.; Zhuo, L. Study on the reconstruction of China’s urbanization process in 1990s based on DMSP/OLS night light data and statistical data. Chin. Sci. Bull. 2006, 51, 856–861. [Google Scholar] [CrossRef]
  11. Gibson, J.; Gibson, G.B.; Stichbury, G. Urban land expansion in India 1992–2012. Food Policy. 2015, 56, 100–113. [Google Scholar] [CrossRef]
  12. Wei, Y.; Liu, H.; Song, W.; Yu, B.; Xiu, C. Normalization of time series DMSP-OLS nighttime light images for urban growth analysis with Pseudo Invariant Features. Landsc. Urban Plan. 2014, 128, 1–13. [Google Scholar] [CrossRef]
  13. Foody, G.M.; Mathur, A.; Sanchez-Hernandez, C.; Boyd, D.S. Training Set Size Requirements for the Classification of a Specific Class. Remote Sens. Environ. 2006, 104, 1–14. [Google Scholar] [CrossRef]
  14. Munoz-Mari, J.; Bruzzone, L.; Camps-Valls, G. A Support Vector domain description approach to supervised classification of remote sensing images. IEEE Trans. Geosci. Remote Sens. 2007, 45, 2683–2692. [Google Scholar] [CrossRef]
  15. Sanchez-Hernandez, C.; Boyd, D.S.; Foody, G.M. One-class classification for mapping a specific land-cover class: SVDD classification of fenland. IEEE Trans. Geosci. Remote Sens. 2007, 45, 1061–1073. [Google Scholar] [CrossRef]
  16. Cao, X.; Chen, J.; Imura, H.; Higashi, O. A SVM-based method to extract urban areas from DMSP-OLS and SPOT VGT data. Remote Sens. Environ. 2009, 113, 2205–2209. [Google Scholar] [CrossRef]
  17. Pandey, B.; Joshi, P.; Seto, K.C. Monitoring urbanization dynamics in India using DMSP/OLS night time lights and SPOT-VGT data. Int. J. Appl. Earth Obs. Geoinf. 2013, 23, 49–61. [Google Scholar] [CrossRef]
  18. Yang, Y.; He, C.; Du, S. Improving the support vector machine-based method to map urban land of China using DMSP/OLS and SPOT VGT data. IEEE Int. Geosci. Remote Sens. Symp. 2011. [Google Scholar] [CrossRef]
  19. Polydoros, A.; Cartalis, C. Use of earth observation based indices for the monitoring of built-up area features and dynamics in support of urban energy studies. Energy Build. 2015, 98, 92–99. [Google Scholar] [CrossRef]
  20. Larrañaga, A.; Álvarez-Mozos, J. On the added value of Quad-Pol Data in a multi-temporal crop classification framework based on RADARSAT-2 imagery. Remote Sens. 2016, 8, 335. [Google Scholar] [CrossRef]
  21. Shiraishi, T.; Motohka, T.; Thapa, R.B.; Watanabe, M.; Shimada, M. Comparative assessment of supervised classifiers for land use–land cover classification in a tropical region using time-series PALSAR Mosaic data. IEEE J. Sel. Top. Appl. Earth Obs. Remote Sens. 2014, 7, 1186–1199. [Google Scholar] [CrossRef]
  22. Jensen, J.R.; Fang, Q.; Patterson, K. A neural network image interpretation system to extract rural and urban land use and land cover information from remote sensor data. Geocarto Int. 2001, 16, 21–30. [Google Scholar] [CrossRef]
  23. Jung, J.; Pasolli, E.; Prasad, S.; Tilton, J.C.; Crawford, M.M. A Framework for land cover classification using discrete return LiDAR Data: Adopting pseudo-waveform and hierarchical segmentation. IEEE J. Sel. Top. Appl. Earth Obs. Remote Sens. 2014, 7, 491–502. [Google Scholar] [CrossRef]
  24. Du, P.; Liu, S.; Gamba, P.; Tan, K.; Xia, J. Fusion of Difference images for change detection over urban areas. IEEE J. Sel. Top. Appl. Earth Obs. Remote Sens. 2012, 5, 1076–1086. [Google Scholar] [CrossRef]
  25. Jiao, L. Urban land density function: A new method to characterize urban expansion. Landsc. Urban Plan. 2015, 139, 26–39. [Google Scholar] [CrossRef]
  26. Jat, M.K.; Garg, P.K.; Kharea, D. Monitoring and modeling of urban sprawl using remote sensing and GIS techniques. Int. J. Appl. Earth Obs. Geoinf. 2008, 10, 26–43. [Google Scholar] [CrossRef]
  27. Estoque, R.C.; Murayama, Y. Classification and change detection of built-up lands from Landsat-7 ETM+ and Landsat-8 OLI/TIRS imagery: A comparative assessment of various spectral indices. Ecol. Indic. 2015, 56, 205–217. [Google Scholar] [CrossRef]
  28. Hadeel, A.; Jabbar, M.; Chen, X. Application of remote sensing and GIS to the study of land use/cover change and urbanization expansion in Basrah province, southern Iraq. Geo-Spat. Inf. Sci. 2009, 12, 135–141. [Google Scholar] [CrossRef]
  29. Gamba, P.; Aldrighi, M.; Stasolla, M. Robust extraction of urban area extents in HR and VHR SAR images. IEEE J. Sel. Top. Appl. Earth Obs. Remote Sens. 2011, 4, 27–34. [Google Scholar] [CrossRef]
  30. Bedawi, S.M.; Kamel, M.S. Multiple classifier system for urban area’s extraction from high resolution remote sensing imagery. In Proceedings of the ICIAR’11 Proceedings of the 8th International Conference on Image Analysis and Recognition, Burnaby, BC, Canada, 22–24 June 2011.
  31. Qin, R. A Mean Shift vector-based shape feature for classification of high spatial resolution remotely sensed imagery. IEEE J. Sel. Top. Appl. Earth Obs. Remote Sens. 2015, 8, 1974–1985. [Google Scholar] [CrossRef]
  32. Xie, H.; Tong, X. A Probability-based improved binary encoding algorithm for classification of hyperspectral images. IEEE J. Sel. Top. Appl. Earth Obs. Remote Sens. 2014, 7, 2108–2118. [Google Scholar] [CrossRef]
  33. Tong, X.; Xie, H.; Weng, Q. Urban Land cover classification with airborne hyperspectral data: What features to use? IEEE J. Sel. Top. Appl. Earth Obs. Remote Sens. 2014, 7, 3998–4009. [Google Scholar] [CrossRef]
  34. Liao, W.; Mura, M.D.; Chanussot, J.; Pižurica, A. Fusion of Spectral and Spatial Information for Classification of Hyper-spectral Remote-Sensed Imagery by Local Graph. IEEE J. Sel. Top. Appl. Earth Obs. Remote Sens. 2016, 9, 583–594. [Google Scholar] [CrossRef]
  35. Arsanjani, J.J.; See, L.; Tayyebi, A. Assessing the suitability of GlobeLand30 for mapping land cover in Germany. Int. J. Digit. Earth 2016, 9, 873–891. [Google Scholar] [CrossRef] [Green Version]
  36. Lin, J.; Liu, X.; Li, K.; Li, X. A maximum entropy method to extract urban land by combining MODIS reflectance, MODIS NDVI, and DMSP-OLS data. Int. J. Remote Sens. 2014, 35, 6708–6727. [Google Scholar] [CrossRef]
  37. State Statistics Bureau. China City Statistical Yearbook, 2011st ed.; China Statistics Press: Beijing, China, 2011. [Google Scholar]
  38. Zhou, N.; Hubacek, K.; Roberts, M. Analysis of spatial patterns of urban growth across South Asia using DMSP-OLS nighttime lights data. Appl. Geogr. 2015, 63, 292–303. [Google Scholar] [CrossRef]
  39. Jun, C.; Jin, C.; Liao, A.; Cao, X.; Chen, J.; Chen, X.; He, C.; Han, G.; Peng, S.; Lu, M.; et al. Global land cover mapping at 30 m resolution: A POK-based operational approach. ISPRS J. Photogramm. Remote Sens. 2015, 103, 7–27. [Google Scholar]
  40. GLC30 Information Service. Available online: http://www.globallandcover.com (accessed on 21 February 2017).
  41. Housing and Urban-Rural Development. China Urban Construction Statistical Yearbook, 2011st ed.; China Planning Press: Beijing, China, 2011. [Google Scholar]
  42. Product Data Service Plan, Institute of Remote Sensing and Digital Earth of Chinese Academy of Sciences. Available online: http://ids.ceode.ac.cn (accessed on 28 February 2017).
  43. Li, Q.; Lu, L.; Weng, Q.; Xie, Y.; Guo, H. Monitoring urban dynamics in the southeast U.S.A. Using time-series DMSP/OLS nightlight imagery. Remote Sens. 2016, 8, 578. [Google Scholar] [CrossRef]
  44. Xiao, P.; Wang, X.; Feng, X.; Zhang, X.; Yang, Y. Detecting China’s urban expansion over the past three decades using nighttime light data. IEEE J. Sel. Top. Appl. Earth Obs. Remote Sens. 2014, 7, 4095–4106. [Google Scholar] [CrossRef]
  45. Cao, Z.; Wu, Z.; Kuang, Y.; Huang, N. Correction of DMSP/OLS Night-time light images and its application in China. J. Geo-Inf. Sci. 2015, 17, 1092–1102. [Google Scholar]
  46. Liao, L.; Song, J.; Wang, J.; Xiao, Z.; Wang, J. Bayesian method for building frequent Landsat-like NDVI datasets by integrating MODIS and Landsat NDVI. Remote Sens. 2016, 8, 452. [Google Scholar] [CrossRef]
  47. Brown, J.C.; Kastens, J.H.; Coutinho, A.C.; Victoria, D.D.; Bishop, C.R. Classifying multiyear agricultural land use data from Mato Grosso using time-series MODIS vegetation index data. Remote Sens. Environ. 2013, 130, 39–50. [Google Scholar] [CrossRef]
  48. Landmann, T.; Schramm, M.; Huettich, C.; Dech, S. MODIS-based change vector analysis for assessing wetland dynamics in Southern Africa. Remote Sens. Lett. 2013, 4, 104–113. [Google Scholar] [CrossRef]
  49. Pal, M.; Foody, G.M. Evaluation of SVM, RVM and SMLR for accurate image classification with limited ground data. IEEE J. Sel. Top. Appl. Earth Obs. Remote Sens. 2012, 5, 1344–1355. [Google Scholar] [CrossRef]
  50. Zhang, Q.; Seto, K.C. Mapping urbanization dynamics at regional and global scales using multi-temporal DMSP/OLS nighttime light data. Remote Sens. Environ. 2011, 115, 2320–2329. [Google Scholar] [CrossRef]
  51. Small, C.; Pozzi, F.; Elvidge, C.D. Spatial analysis of global urban extent from DMSPOLS night lights. Remote Sens. Environ. 2005, 96, 277–291. [Google Scholar] [CrossRef]
  52. Shi, K.; Huang, C.; Yu, B.; Yin, B.; Huang, Y.; Wu, J. Evaluation of NPP-VIIRS night-time light composite data for extracting built-up urban areas. Remote Sens. Lett. 2014, 5, 358–366. [Google Scholar] [CrossRef]
  53. Wu, B.; Zhang, L.; Li, P. Unmixing of hyperspectral imagery based on probabilistic outputs of support vector machines. Geomat. Inf. Sci. 2006, 31, 51–54. [Google Scholar]
  54. He, C.; Shi, P.; Li, J.; Chen, J.; Pan, Y.; Li, J.; Zhuo, L.; Toshiaki, I. Restoring urbanization process in China in the 1990 by using non-radiance calibrated DMSP/OLS nighttime light imagery and statistical data. Chin. Sci. Bull. 2006, 51, 1614–1620. [Google Scholar] [CrossRef]
  55. Liu, Z.; He, C.; Zhang, Q.; Huang, Q.; Yang, Y. Extracting the dynamics of urban expansion in China using DMSP-OLS nighttime light data from 1992 to 2008. Landsc. Urban Plan. 2012, 106, 62–72. [Google Scholar] [CrossRef]
  56. Shi, K.; Chen, Y.; Yu, B.; Xu, T.; Li, L.; Huang, C.; Liu, R.; Chen, Z.; Wu, J. Urban expansion and agricultural land loss in China: A Multiscale Perspective. Sustainability 2016, 8, 790–906. [Google Scholar] [CrossRef]
  57. Meng, L.; Graus, W.; Worrell, E.; Huang, B. Estimating CO2 (carbon dioxide) emissions at urban scales by DMSP/OLS (Defense Meteorological Satellite Program’s Operational Linescan System) nighttime light imagery: Methodological challenges and a case study for China. Energy 2014, 71, 468–478. [Google Scholar] [CrossRef]
  58. Tan, M. Use of an inside buffer method to extract the extent of urban areas from DMSP/OLS nighttime light data in North China. GISci. Remote Sens. 2016, 53, 444–458. [Google Scholar] [CrossRef]
Figure 1. DMSP-OLS image covers four cities in 2010. (AD) those different experimental areas, respectively, i.e., Yinchuang, Xining, Chengdu and Kunming.
Remotesensing 09 00236 g001
Figure 2. GlobeLand30 data (taking regions over China as an example).
Remotesensing 09 00236 g002
Figure 3. Workflow of the proposed approach.
Remotesensing 09 00236 g003
Figure 4. Comparison results in the process of sample optimization.
Remotesensing 09 00236 g004
Figure 5. Urban built-up extraction results comparison among the different methods.
Remotesensing 09 00236 g005
Figure 6. Pattern spots comparison among the different methods.
Remotesensing 09 00236 g006
Table 1. Description of the remote sensing data sets used in this study.
Data SourceProduct DescriptionSpatial Resolution
DMSP-OLS dataYearly stable nighttime light composite1 km
GlobeLand30 productLand cover types mainly include water bodies, tundra, bare land, cultivated land, forest, shrub land, grassland, permanent snow/ice, artificial surfaces, and wetland30 m
Landsat image productSeven images covering 4 cities, band 3–5 are selected in our study30 m
Table 2. Inter-calibration model coefficients for each image from 2006 to 2012.
Satellite NumberYearAbR2
F1620060.82961.18830.9647
20070.73141.21320.9369
20080.79271.14870.9186
20090.60511.15250.8923
F1820100.34271.21880.8387
20110.70351.08720.8545
20120.48211.18660.8849
Table 3. Rule for refined samples selection by combining multi-source data information.
Rule Properties P b u T Pixels Belong to Artificial Surface P n o n b u T Pixels Belong to Vegetation Cover
Urban built-up class××
Non-urban built-up class××
Table 4. Sample results in the iterative updating procedure.
Iteration Time (I)Training Sample (Pixel)Accuracy
Built-Up AreaNon-Built-Up AreaProducer AccuracyUser AccuracyOverall Accuracy
057246840.760.600.89
145698860.590.950.92
244910,0580.720.970.96
Table 5. Accuracy assessment of the urban built-up areas based on the statistics and the proposed method in Chengdu, Kunming, Xining, and Yinchuan in China.
RegionCityStatistical Areas (km2)Extracted Areas (km2)Relative Error (%)
Western ChinaChengdu455.56423.55−7.03
Kunming295.03266.48−9.68
Xining66.7773.359.85
Yinchuan120.57110.62−8.25
Table 6. Quantitative analysis results of the three methods by cities.
CityThreshold Dichotomy MethodImproved NFS MethodSample-Optimized SVM Approach
OA (%)KappaCE (%)OE (%)OA (%)KappaCE (%)OE (%)OA (%)KappaCE (%)OE (%)
Chengdu89.140.5413.8453.9491.930.6732.6421.4396.200.803.2728.13
Kunming96.250.631.2151.4897.450.693.9445.2597.980.8313.0218.95

