1. Introduction
With the advance of global urbanization, an increasing consumption of natural resources and energy in the past 100 years has reached unprecedented levels in the human history. Although urban areas are a relatively small fraction of the total surface of the Earth, urban expansion has coincided with global environmental degradation, e.g., habitat loss and ecosystem change [
1]. In addition, the process of urbanization is linked to the changes in land surface properties, for example, heat storage, soil moisture, and albedo. The urban heat island (UHI) induced by urbanization has been verified in many big cities around the world [
2]. The magnitude of UHI is particularly enhanced in China, which has experienced a rapid urbanization during the last three decades [
3,
4]. The UHI effect can have impacts on weather and climate [
5], increase the energy usage in comparatively hot regions, and impair nearby water quality [
6] and the health of urban residents [
7,
8]. Furthermore, it increases subsurface temperatures and alters the groundwater system both chemically and microbiologically, via geochemical and geobiological reactions under the city [
9].
It has been acknowledged in previous studies that urbanization has significant impacts on the climate [
10,
11,
12,
13]. Of all the factors associated with the urban environment, the anthropogenic heat released from energy consumption is an important contributor to the local thermal environment [
14]. Zhang et al. (2013) [
15] pointed out that, although energy consumption is sparsely distributed over the surface of the Earth and is only ~0.3% of the total energy transported to the extra-tropics via atmospheric and oceanic circulations, this anthropogenic heat could disturb the normal pattern of the circulations and cause a significant effect on the surface temperature at local, regional, and even global scales.
Cities are usually the most concentrated areas with regards to energy consumption. With the development of urbanization, people ceaselessly migrate to cities, resulting in a continuous increase in the energy consumption within cities. Several modeling studies have shown that the effects of human activity related to energy consumption play a significant role in the formation of UHI. By comparing simulations with and without anthropogenic heat conditions, Ichinose et al. (1999) [
16] showed that the maximum temperature difference for sites near large releases of anthropogenic heat was around 1.5 °C. Similarly, Fan and Sailor (2005) [
17] found that there was a rise of 2–3 °C, caused by the release of anthropogenic heat to the nighttime UHI, during the winter months in Philadelphia. Narumi et al. (2009) [
18] found that anthropogenic heat contributed to a rise of 0.4 °C and 1.1 °C during the daytime and nighttime, respectively, in the inner-city district of the Japanese megacity (Keihanshin district).
Accurate and detailed energy consumption data are a prerequisite for examining the impacts of anthropogenic heat on UHI. Several studies have constructed the annual or diurnal spatial variability of anthropogenic heat flux, by summing up the different sources of heat emissions, e.g., buildings, transportation, and human metabolism [
18,
19]. However, these annual and diurnal changes in the energy consumption data are sometimes not collected in many countries and regions. In China, the statistical data on the energy consumption for each municipality or province are open access and can be obtained from the China Energy Statistical Yearbook. However, the data on intra-provincial or inner-city spatial variability of energy consumption are still not available. As a result, less attention has been paid to the effect of energy consumption on climate, when compared to the studies about the impacts of land-use change on the climate [
14,
18].
Population density is a useful proxy for depicting the geographic distribution of human activities [
20]. However, its use in China is limited due to the coarse temporal resolution (once-in-a-decade census). The remotely sensed nighttime light imaging data derived from the Defense Meteorological Satellite Program’s Operational Linescan System (DMSP/OLS) for calendar years, have been archived since 1992. The DMSP/OLS nighttime light data have been widely used to analyze the process of urban expansion [
21,
22], and to map CO
2 emissions from fossil fuel combustion [
23] and electrical power consumption [
24]. In addition, Coscime et al. (2013) [
25] identified a good correlation between the intensity of nighttime light and non-renewable energy consumption. Overall, nighttime light not only reflects the intensity of human activity on large scales, but also has a finer temporal resolution. Thus, nighttime light is considered a suitable indicator for constructing consecutive energy consumption maps.
Various studies have documented the magnitude and spatial pattern of UHI intensity for different regions around the world [
2,
3,
4,
26]. The nighttime light contrast between urban and suburban areas is used as a proxy for anthropogenic heat emissions, in order to indirectly study its linkage with UHI intensity [
2,
26]. However, until now, few studies have directly discussed the relationship between energy consumption and UHI, based on statistical analysis of the historical observation data [
14]. The purpose of this study is to explore the impact of energy consumption on the surface urban heat island in China’s 32 major cities. We use version 5 of the Moderate Resolution Imaging Spectroradiometer (MODIS) Land Surface Temperature (LST) data during the period 2008–2012, to evaluate the average intensity of the surface urban heat island over each city. In the meantime, DMSP/OLS nighttime light images are used to distribute the statistical energy consumption data and extract the energy consumption difference between urban and suburban areas. On this basis, the correlation between energy consumption and surface urban heat island intensity, is then directly analyzed.
The rest of the paper is organized as follows.
Section 2 describes the data used in this study. The methodologies employed to evaluate surface urban heat land intensity and to map the statistical energy consumption data, are showed in
Section 3. The results and discussion are presented in
Section 4, and are followed by the conclusions in
Section 5.
2. Materials
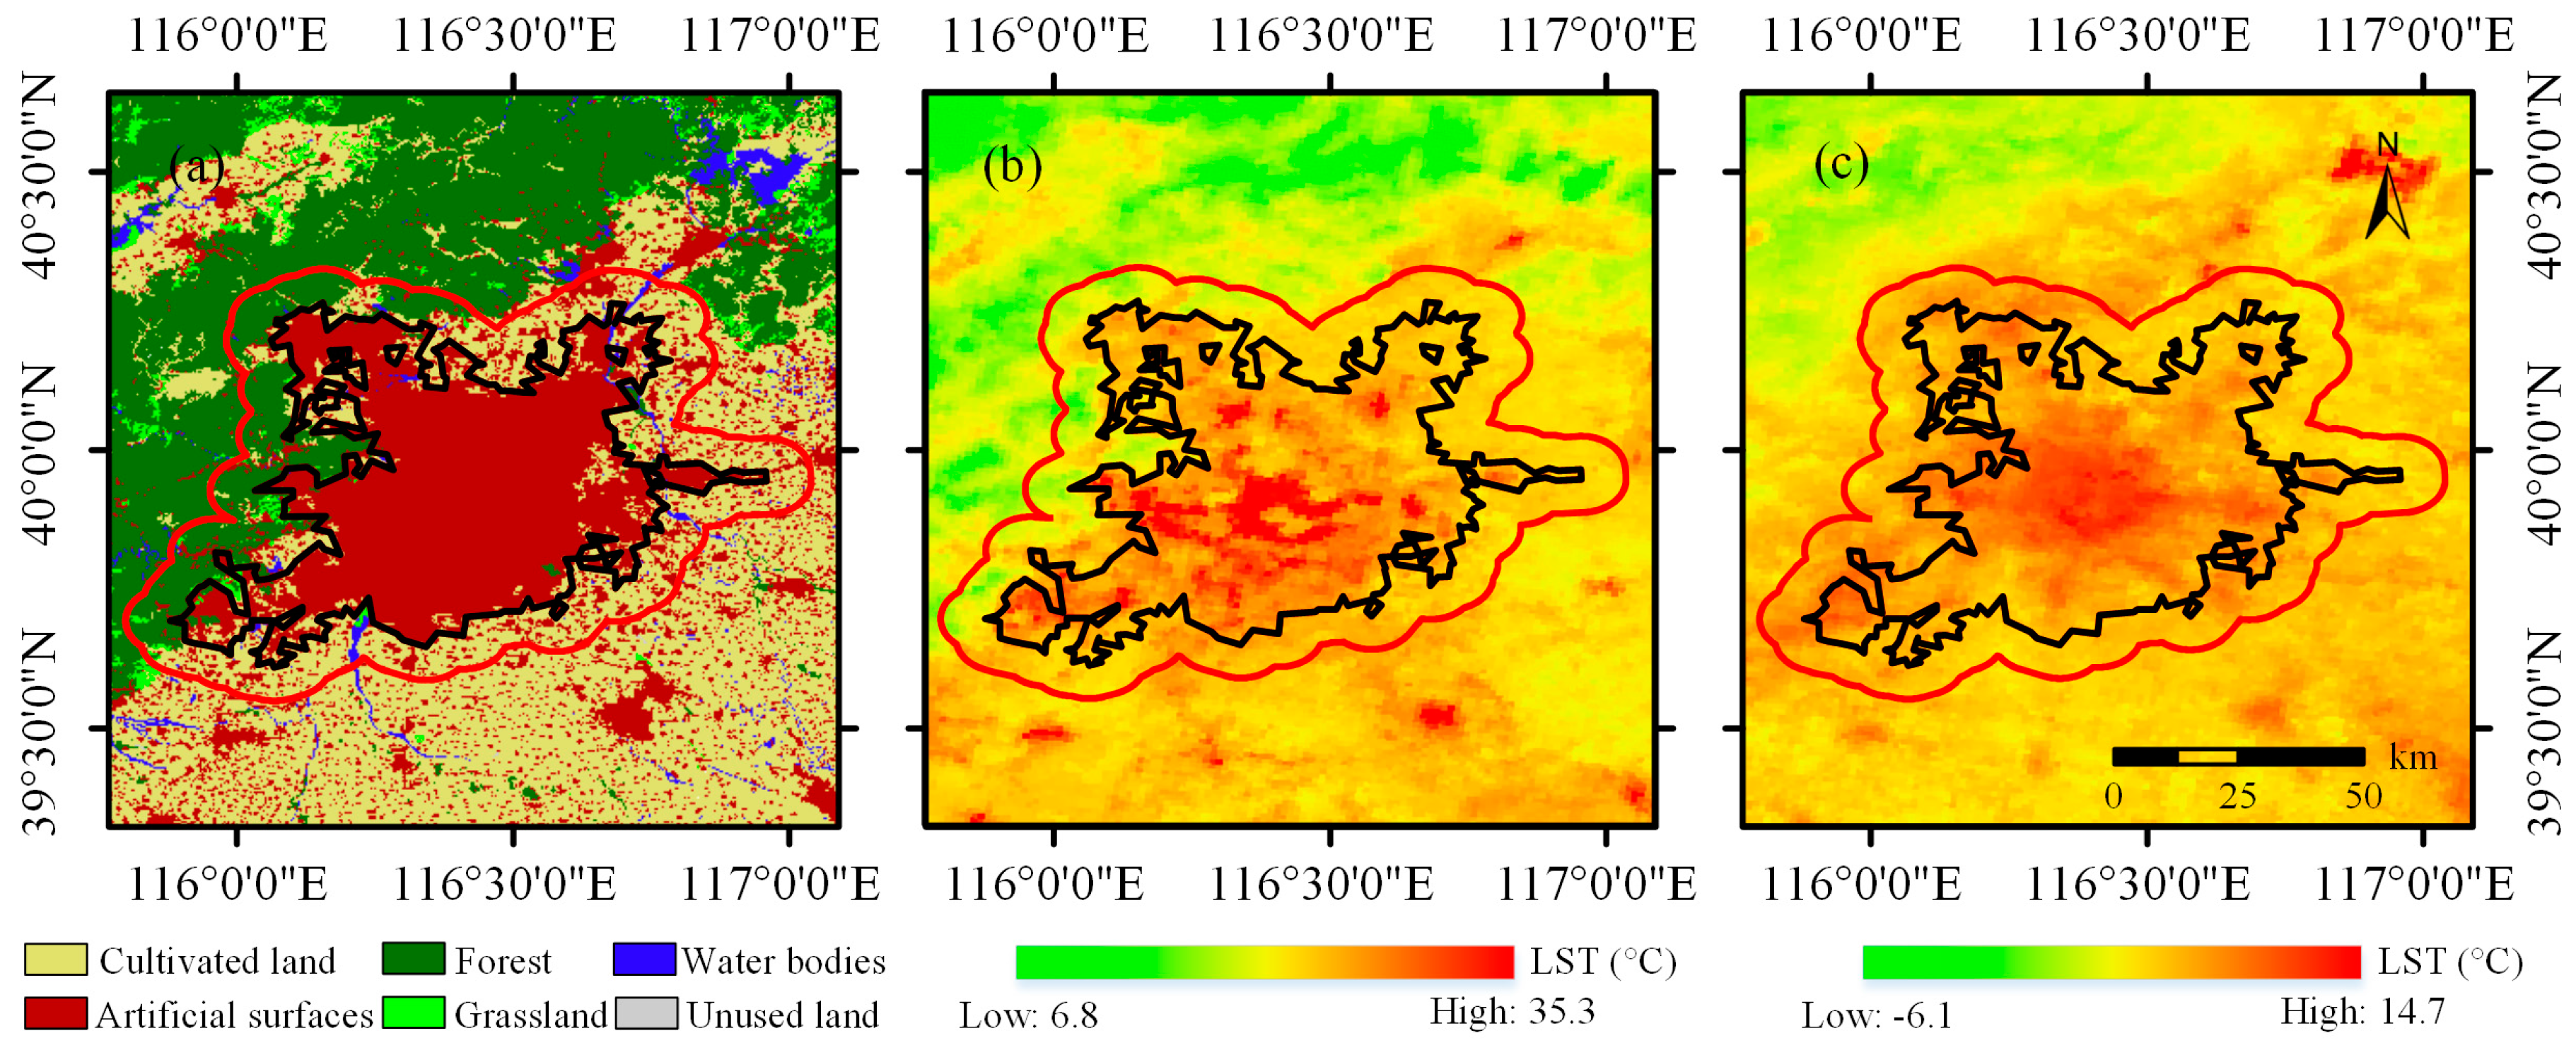
A land cover/use map of China in 2010, with a spatial resolution of 30 m, which was generated through visual interpretations of the Landsat TM/ETM+ images [
27], was utilized to extract the extent of urban areas within the study area. This dataset was provided by the Data Center for Resources and Environmental Sciences, Chinese Academy of Sciences (RESDC). It contained six land use types, i.e., artificial surfaces, cultivated land, forest, grassland, water bodies, and unused land. The type of artificial surface, which consisted of the impervious surfaces of cities, towns, and industrial and traffic lands, was used to define the extent of urban areas in this study.
The land surface temperature (LST) was obtained from Aqua MODIS 8-days composite products (version 5) with a spatial resolution of 1 km (MYD11A2), from 2008 to 2012. The LST data included temperature observations made during the daytime (~13:30) and nighttime (~01:30). The retrieval of LST data was refined by correcting for the noise resulting from topographic differences, cloud contamination, and zenith angle changes [
28]. Compared with in-situ values of LST measurements, the bias of MODIS V5 LST was less than 1 °C in most cases and the root of the mean squares of differences was less than 0.7 °C [
29].
DMSP/OLS nighttime light images (version 4) from 2008 to 2012 were obtained from the National Oceanic and Atmospheric Administration (NOAA) of the National Geophysical Data Center (NGDC). The data were cloud-free composites made using all of the available archived DMSP/OLS smooth resolution data for calendar years [
30]. These stable light products contained the lights from cities, towns, and other sites with persistent lighting. The DN values of the stable lights ranged from 1 to 63 in each image, while ephemeral lights and background noise had been identified and replaced with values of zero. The products were produced in 30 arc-second geographic grids, whose size was approximately 1 km
2 at the equator.
The total energy consumption of each province in mainland China from 2008 to 2012, except for the Taiwan and Tibet provinces, were obtained from the China Energy Statistical Yearbook [
31]. The total energy consumption of 25 cities (Guiyang, Hefei, Datong, Taiyuan, Yangquan, Changzhi, Jincheng, Shuozhou, Yuncheng, Xinzhou, Linfen, Jingmen, Shiyan, YiChang, Xiamen, Ningde, Guangzhou, Shenzhen, Huizhou, Dongguan, Beijing, Shanghai, Tianjin, Chongqing, and Liuzhou) from 2008 to 2012 were obtained from the Statistical Yearbook of each city. The total energy consumption included the utilization of coal, oil, natural gas, and electricity in different sectors or industries. They were all converted into the ton of standard coal equivalent (tce) and aggregated as a total number for each province or city.
3. Methods
China has undergone a very rapid economic and urban development following the reform and open-gate policy [
32,
33,
34]. Statistical data indicates that the energy consumption in China has dramatically increased from 602.75 million tce in 1980, to 3617.32 million tce in 2012 [
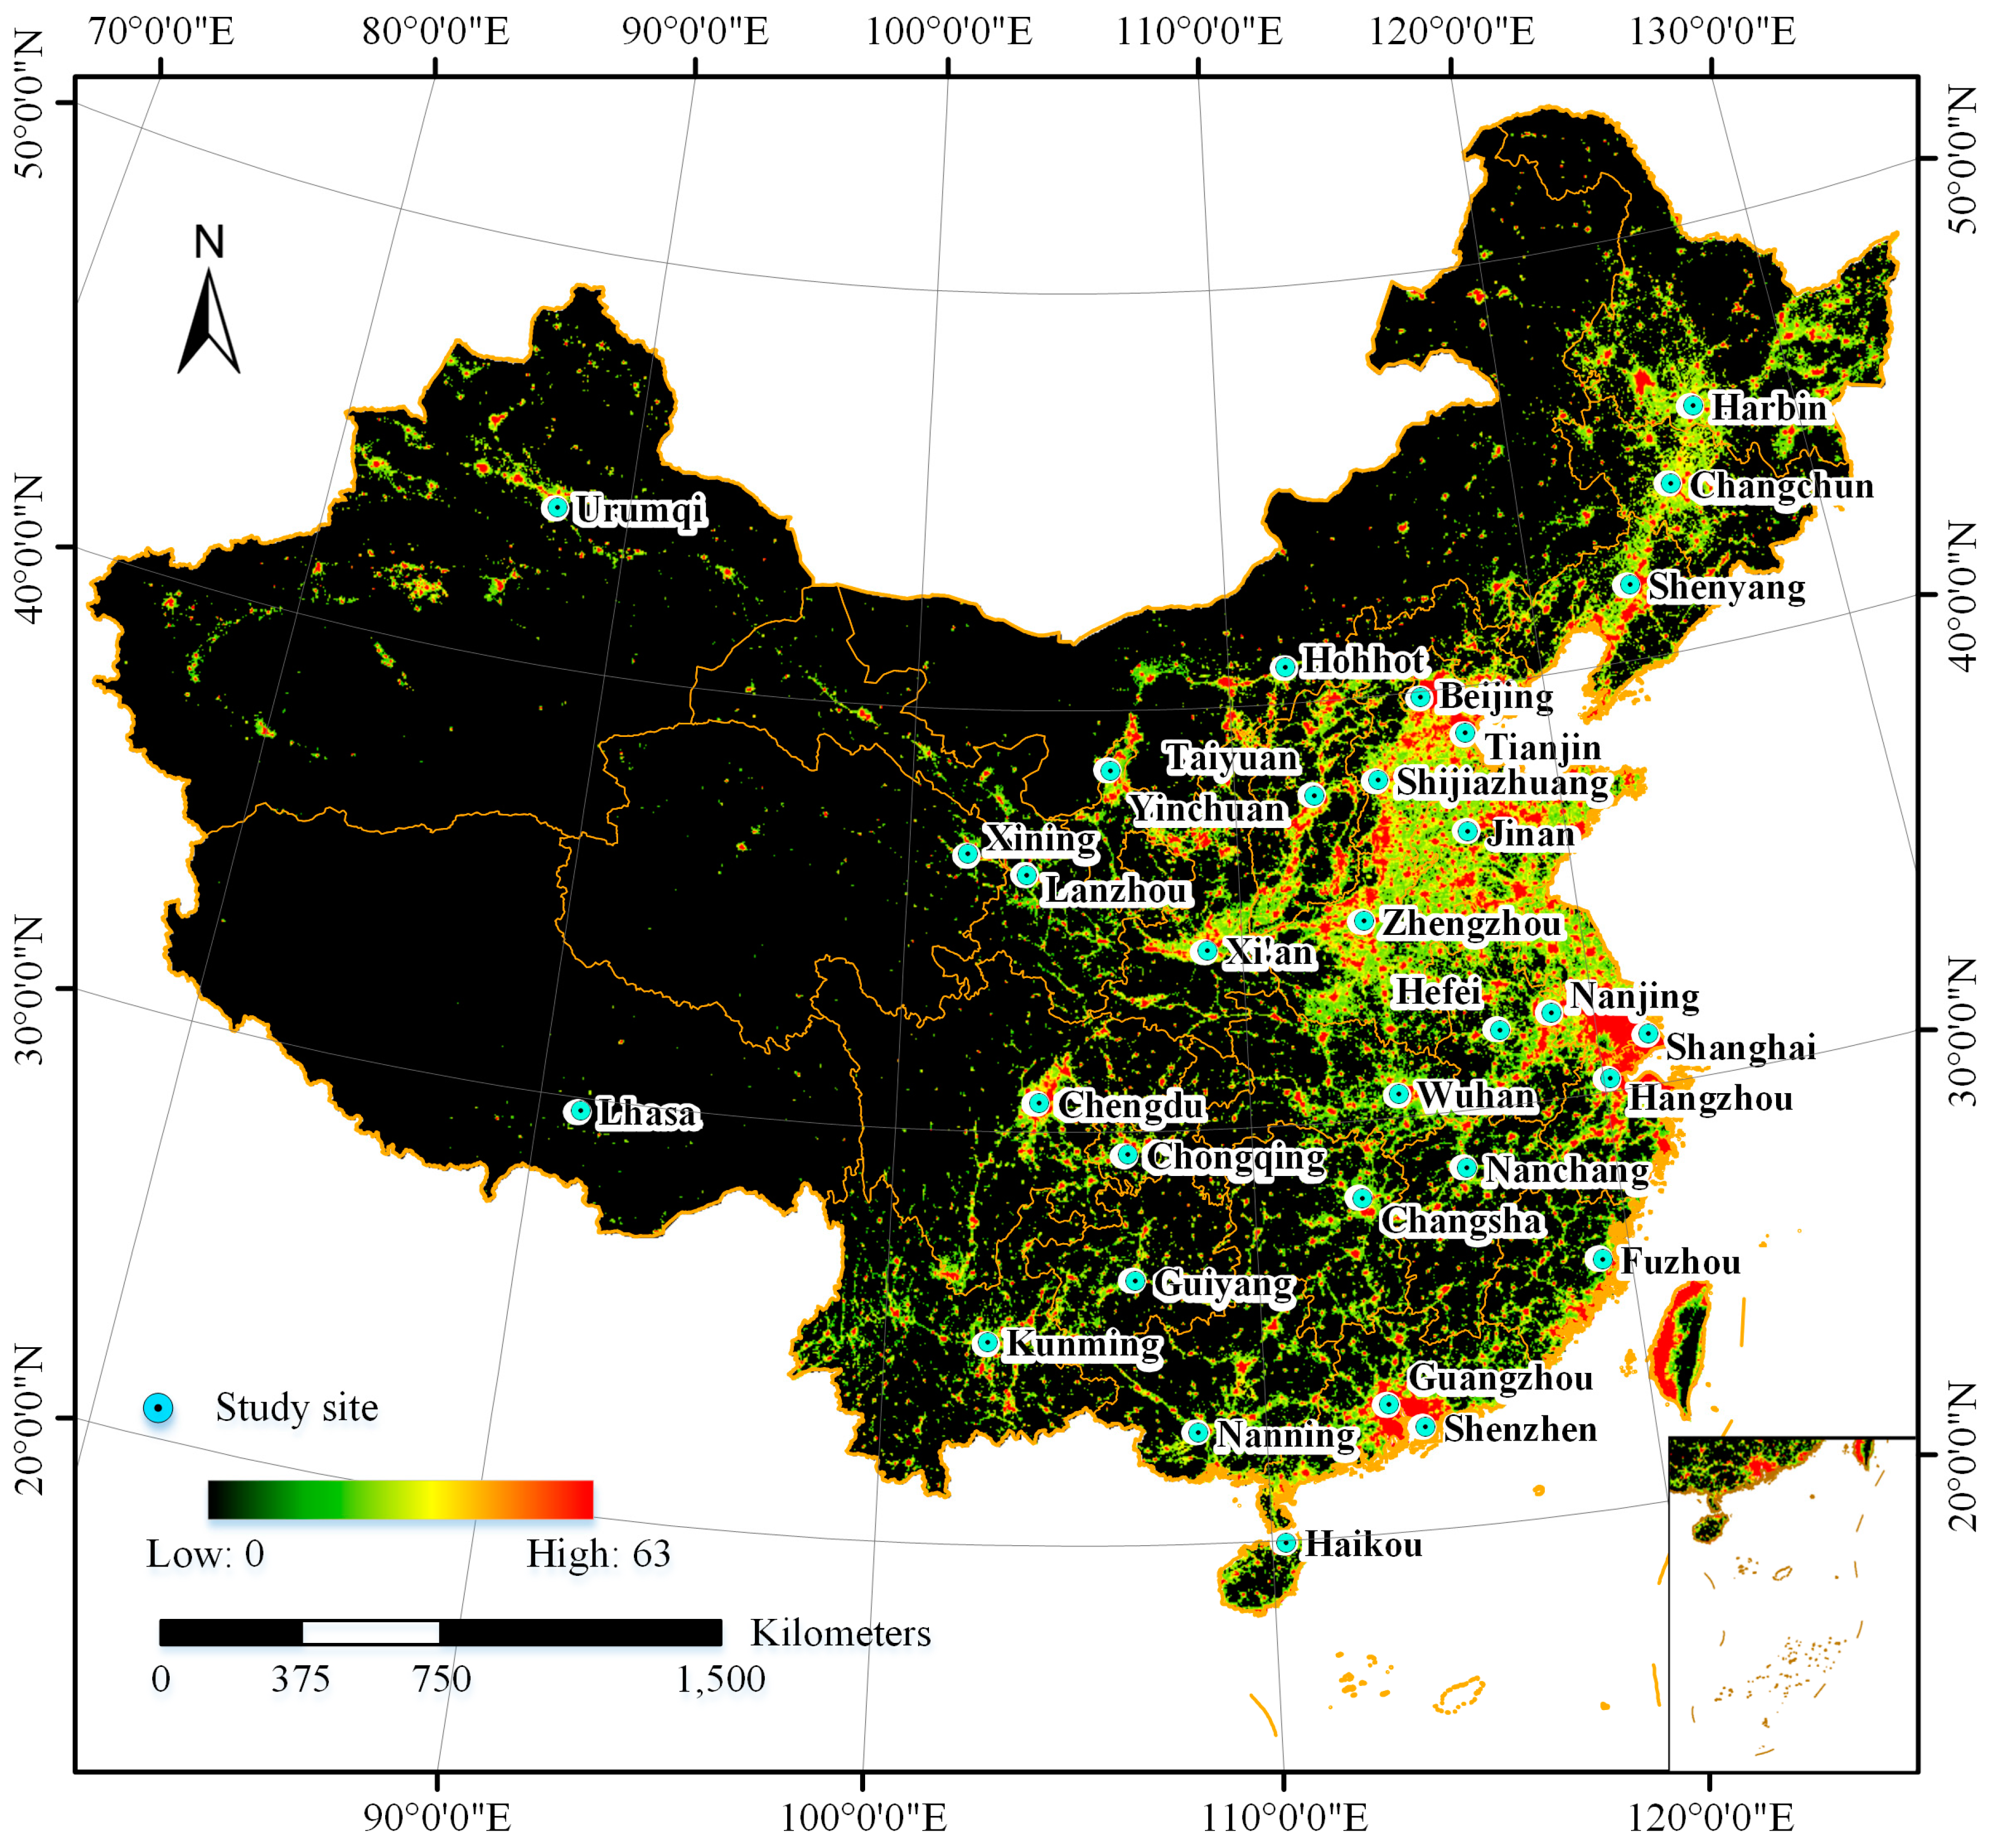
31]. The influence of human activities on the climate can be expected, especially in the fast-growing cities during the end of this period. Hence, this study focuses on a total of 32 cities, of which 31 are either municipalities or provincial capitals in mainland China, and the last is a special city, Shenzhen, which is one of the fastest growing cities in the world (
Figure 1). First, we mapped the statistical energy consumption data based on the spatial distribution of DMSP/OLS nighttime lights. Meanwhile, we estimated the surface urban heat island intensity (SUHII) for each city, based on the surface temperature. We then directly investigated the difference in energy consumption per unit area between urban and suburban areas, and its linkage with SUHII. The scheme of evaluating SUHII and mapping statistical energy consumption data is presented as follows.
3.1. Evaluating Surface Urban Heat Island Intensity
The SUHII was defined as the LST difference between urban and surrounding suburban areas. Similar to Zhou et al. (2014) [
26], urban and suburban areas were delineated for each city, as follows:
- (1)
The proportion of artificial surface areas in each MODIS LST pixel was calculated using a 1 km × 1 km moving window, based on the 30 m land cover/use map of China in 2010.
- (2)
A 50% threshold of the proportion of artificial surface areas was used as a criterion to extract the high-intensity built-up polygons. In order to include the scattered and most adjacent high-intensity built-up patches in the urban class, a 2 km aggregation distance was used to aggregate these polygons. As a result, the land within the urban border was delineated as an urban area.
- (3)
The suburban area was defined as all of the nonurban pixels within the buffer zone around the urban area, which covered the same area of urban extend (excluding water pixels) (
Figure 2).
According to the procedures mentioned above, the borders of urban and suburban areas were generated for the 32 major cities in mainland China, respectively. We assumed that the urban and suburban areas generated from the land cover/use map in 2010 could represent those in the period from 2008 to 2012. As the urban areas of the 32 cities were different, buffer distances should be changed to obtain the same area of urban extend (excluding water pixels) for suburban areas. As a result, the buffer distances used for the 32 cities varied from 1.18 to 8.08 km. The annual mean daytime and nighttime SUHII were then calculated from MODIS LST data for the period 2008–2012, for each individual city.
3.2. Mapping Statistical Energy Consumption Data
Anthropogenic heat released from energy consumption is generated by human activities. Most studies have estimated the spatial distribution of energy consumption using the inventory-based approach, which can be further divided into bottom-up and top-down approaches. With the bottom-up inventory approach, the seasonal and diurnal variability of anthropogenic heat flux are estimated, based on the aggregate of detailed energy consumption data, e.g., flows of vehicles, and the number of buildings and people in each grid point [
16,
19]. However, this approach places very high demands on the statistical energy consumption data. Collecting such detailed energy consumption data is a formidable task in many countries and regions. With the top-down inventory approach, the energy consumption data from energy statistics on a province-level scale or a larger spatial scale are downscaled to smaller scales, based on a finer spatial indicator, for example, population density, land use data, gross domestic product (GDP) data, and nighttime light data [
14,
20,
25]. In China, the statistical energy consumption data on the province-level scale can be obtained from the China Energy Statistical Yearbook. Since the remotely sensed nighttime light imaging data is a suitable indicator of energy consumption maps in consecutive calendar years, we can construct the spatial distribution of an energy consumption map by combining the statistical energy consumption with the nighttime light data. We use the top-down inventory approach to map the statistical energy consumption data, based on the nighttime light data in this study.
Because DMSP/OLS nighttime light data were produced by different satellites and OLS sensors which had no on-board calibration, we could not directly use the multi-year nighttime light to map the statistical energy consumption, due to the lack of continuity and comparability [
35,
36]. We first preprocessed the nighttime light data, according to the methodology developed by Liu et al. (2012) [
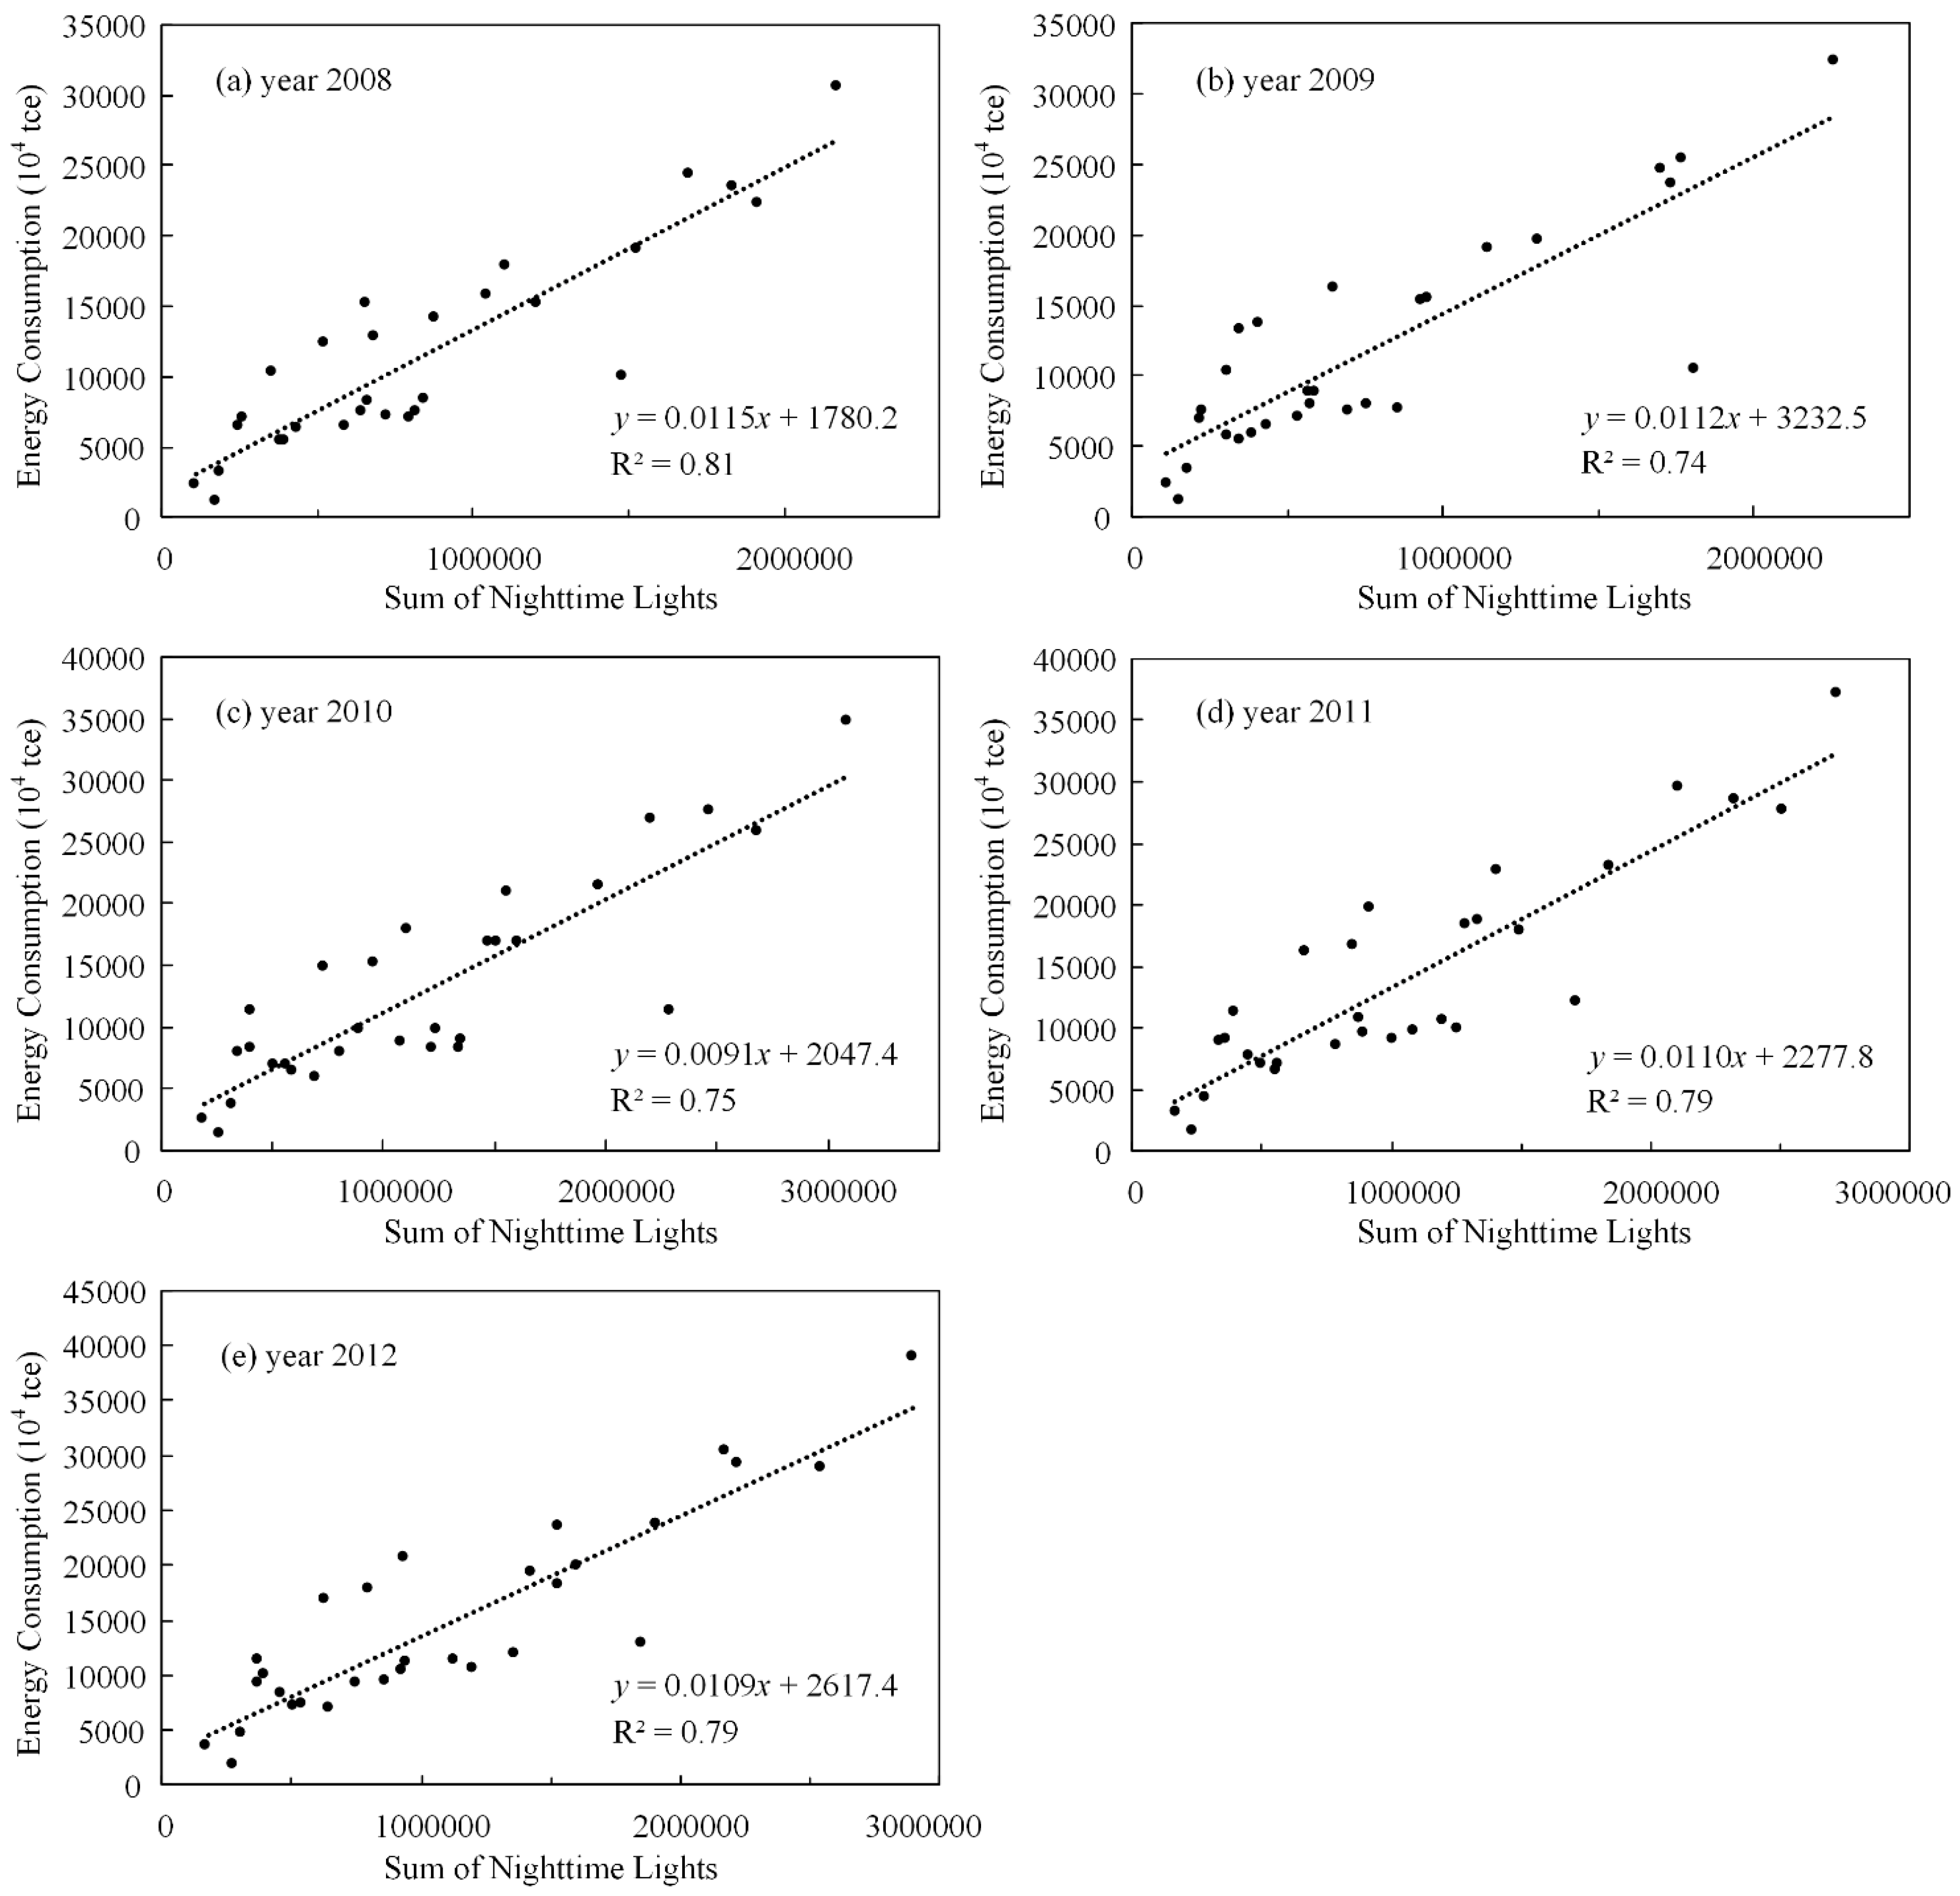
37]. Then, a linear regression analysis was conducted to identify the relationship between the total energy consumption on the provincial scale, and the sum of nighttime lights within each corresponding province. The linear regression model is presented as follows:
where
EC and
NTL are the statistical energy consumption and the sum of nighttime lights within each province, respectively, and
and
are different regression coefficients.
Figure 3 shows the relationship between energy consumption and the sum of nighttime lights on the provincial scale, for each year over the period of 2008–2012. R
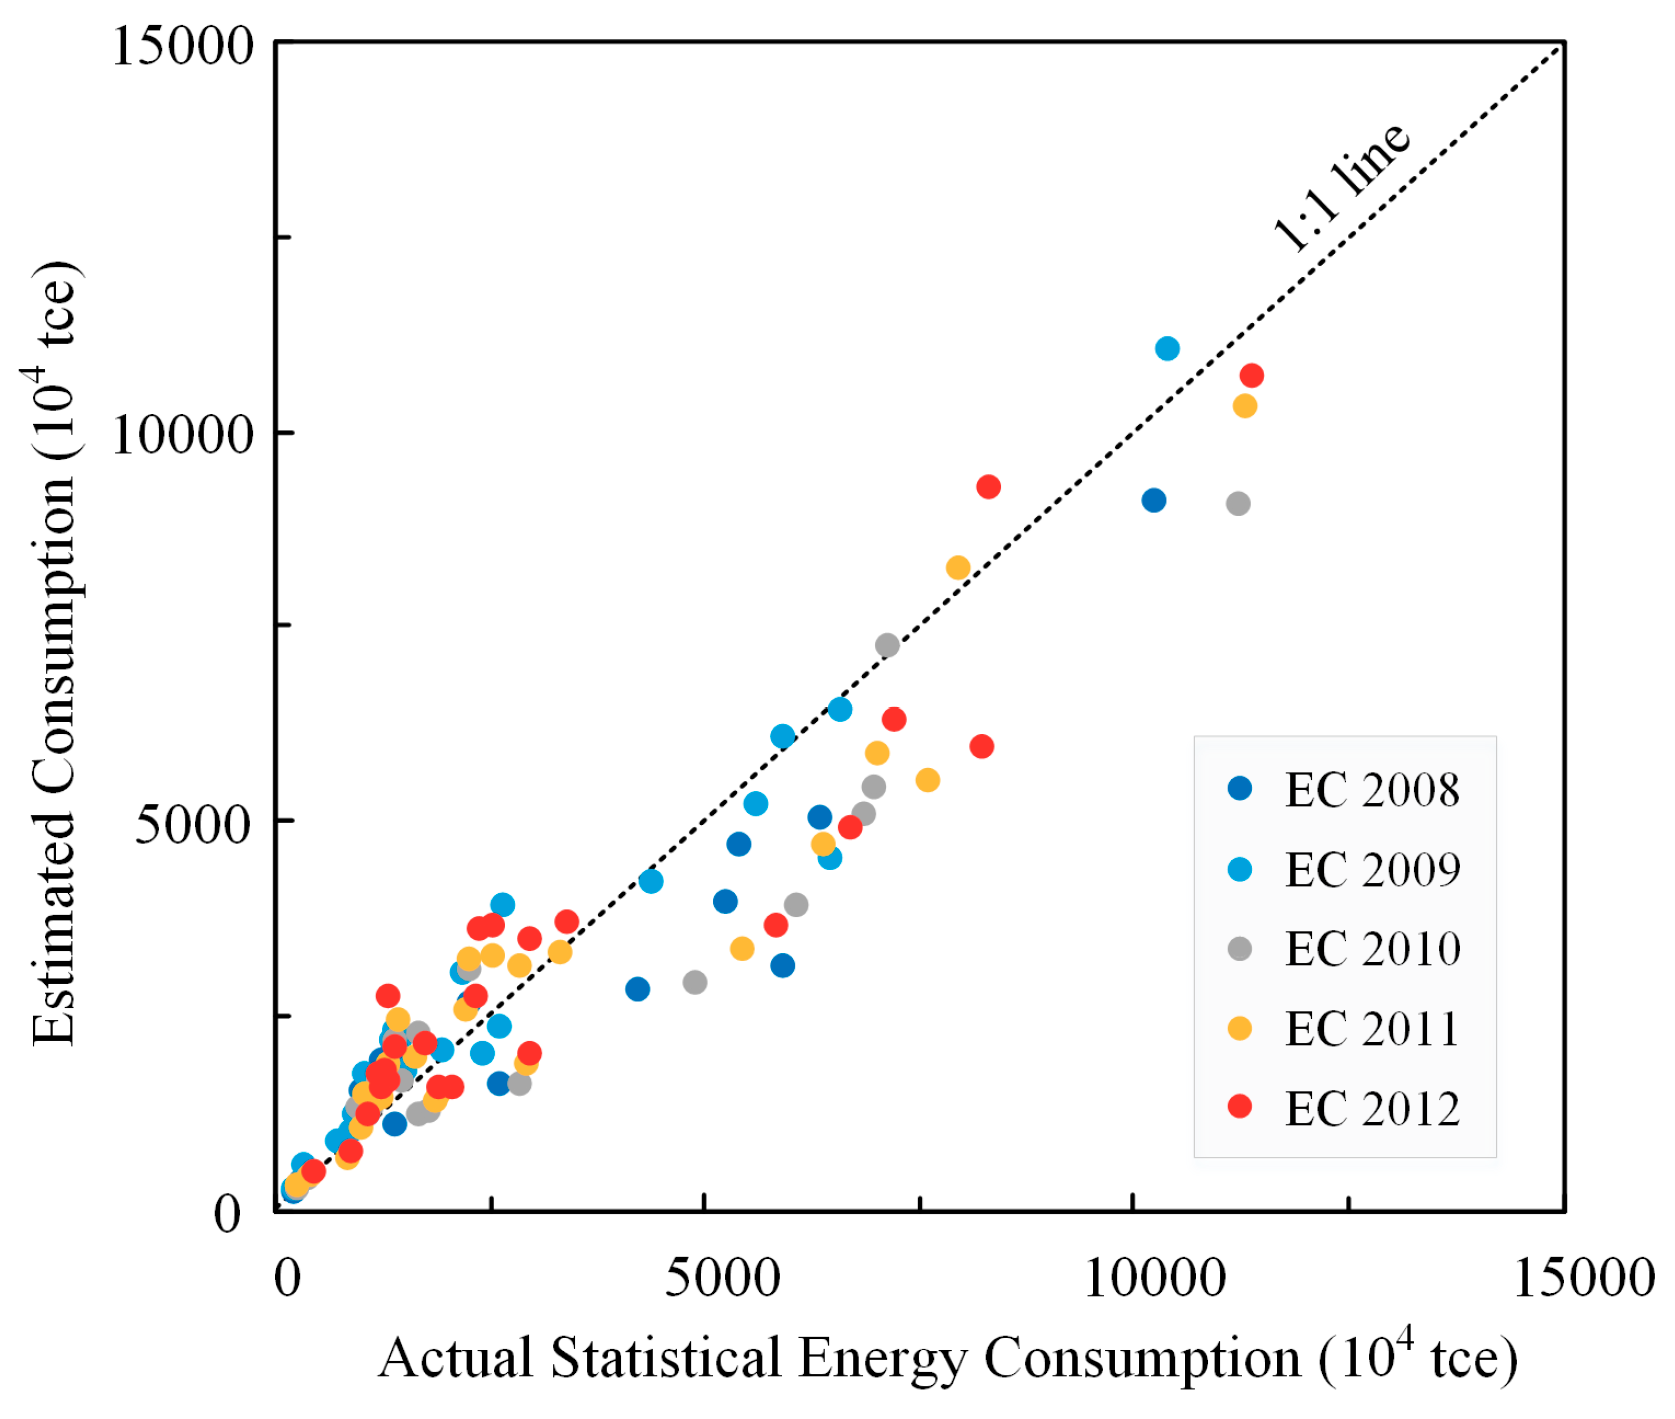
2, which represents the goodness of the fit, varies from 0.74 to 0.81 for the linear regression models in different years. These significant correlations indicate that energy consumption has a similar variability or range in the spatial relationship with nighttime lights. To verify that the statistical energy consumption data at the provincial level could be downscaled, based on the nighttime light images through these linear regression models, we used the statistical energy consumption data from 25 cities to assess the reliability of the models.
Figure 4 presents a scatterplot of the actual statistical energy consumption at the city level and the corresponding energy consumption estimated by the models over the period of 2008–2012. As a whole, the estimated consumption values were close to those from the actual statistical data at the city level, during different years. In order to further evaluate the performance of the model for mapping the spatial distribution of energy consumption, we applied the mean relative error (
MRE) and root mean-squared error (
RMSE) to assess the difference between the estimated consumption and the actual statistical data. The calculations of these metrics are expressed as follows:
where
n is the total number of pairs of data, and
and
are the actual statistical energy consumption data and its corresponding estimation at the city level during the period of 2008–2012, respectively.
According to the calculations of the metrics above, the values of the MRE were 0.33, 0.32, 0.30, 0.26, and 0.30 for the linear regression models from 2008 to 2012, respectively, while the values of the RMSE were 1031.1 × 104, 657.8 × 10⁴, 1112.7 × 104, 866.8 × 10⁴, and 987.9 × 10⁴ tce. In fact, the statistical standards of energy consumption at the city level were still varied within different provinces in China. Considering that the accuracy of the statistical energy consumption data would also affect the assessment of the model, we think that the estimation biases were acceptable, while using the regression relationship to downscale the energy consumption. We assumed that the similar variability or range existing in the spatial relationship between energy consumption and nighttime lights enabled us to represent its spatial variability within a province. In other words, the models established by the statistical energy consumption and nighttime lights will be used to estimate energy consumption on a smaller scale. Therefore, energy consumption within a certain region can be estimated by the sum of nighttime lights within its corresponding region, based on the linear regression models.
Using the borders of urban and suburban areas over the 32 major cities in mainland China, we calculated the sum of nighttime lights within each area and then translated it into energy consumption based on the linear models during the period of 2008–2012. Similar to SUHII, the energy consumption intensity (ECI) (energy consumption per unit area) contrast between urban and suburban areas was individually extracted for each city. Because the temporal resolution of the statistical energy consumption data was once a year in China, it was still hard to separate the energy consumption during the daytime from that during the nighttime, using the top-down inventory approach. We assumed that the change in the energy consumption was uniform during the day and night.
4. Results
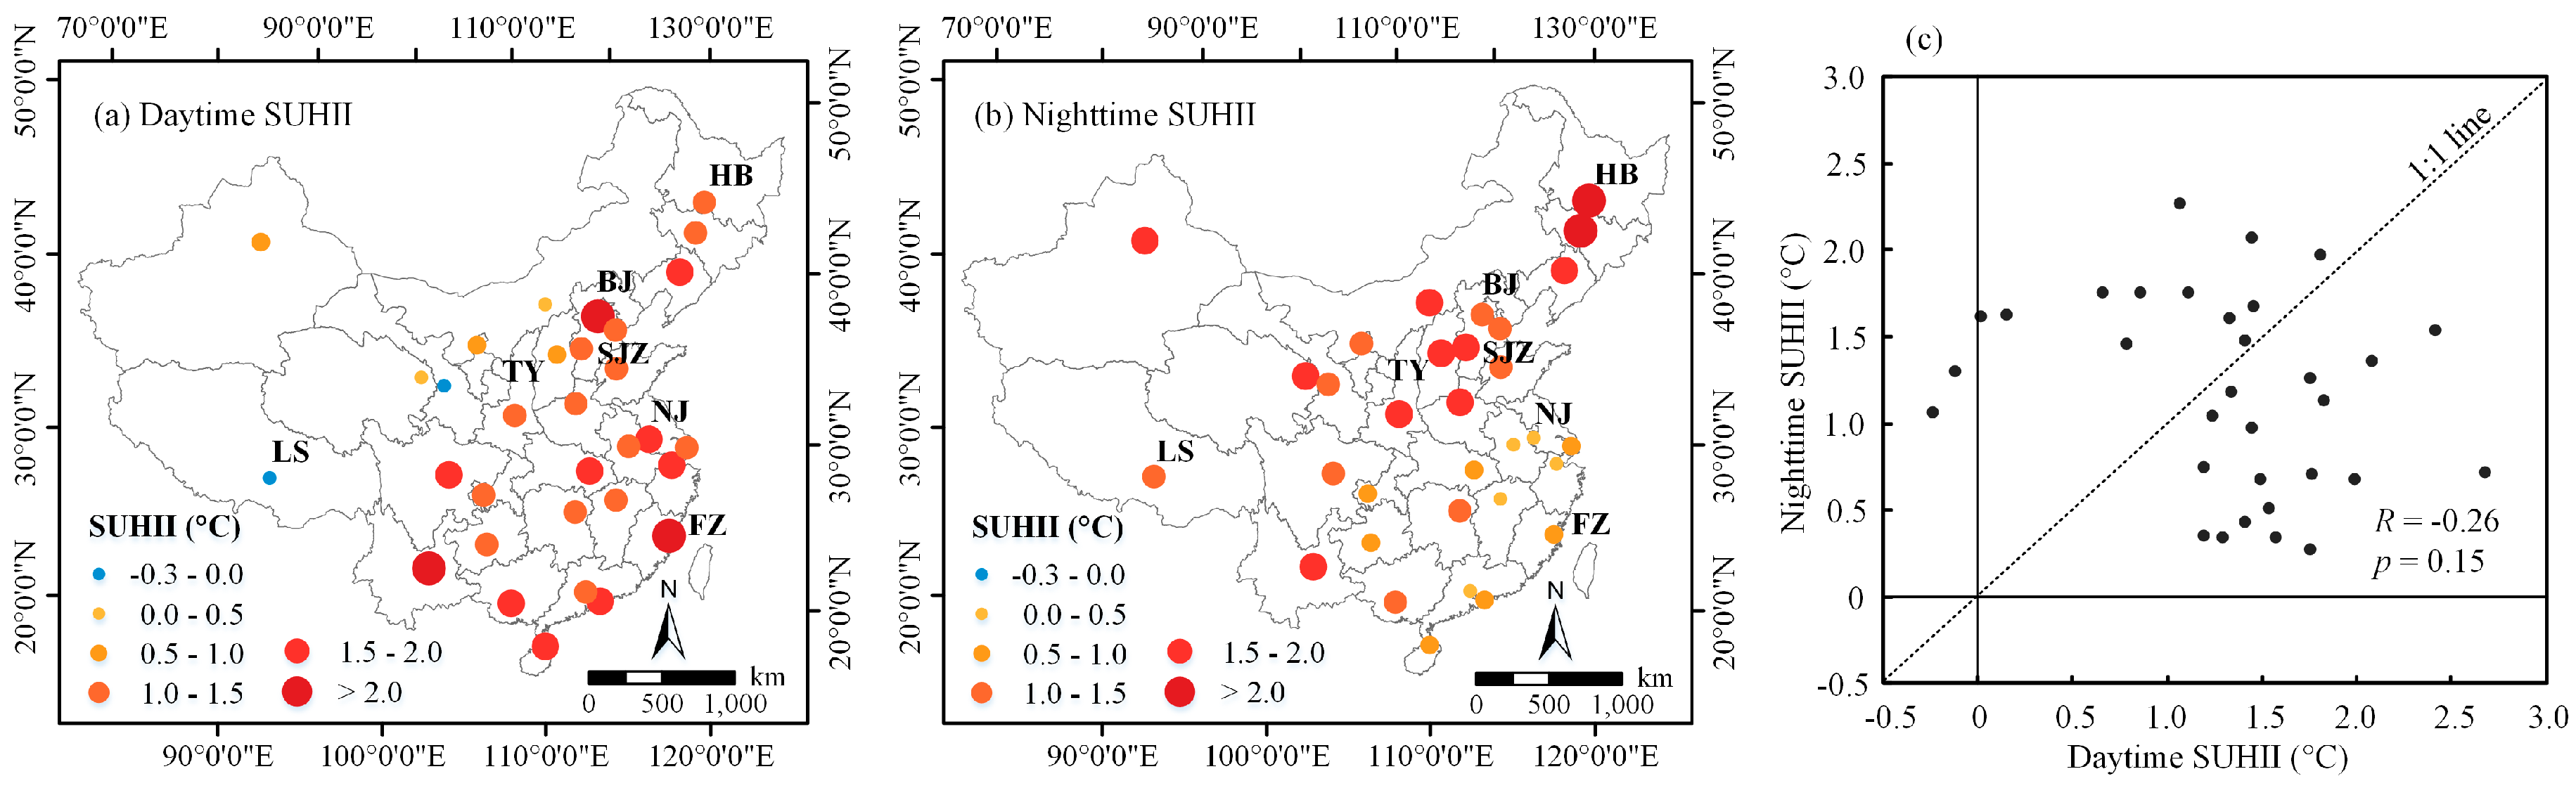
The spatial distribution of the annual mean daytime and nighttime SUHII, averaged over the period of 2008–2012 for the 32 major cities in mainland China, is showed in
Figure 5. The annual mean daytime SUHII varied from −0.24 °C in Lhasa to 2.68 °C in Fuzhou, and was positive over most cities (94%). The cities with a more intense daytime SUHII were mainly located in Northeast, East, and South China. The annual mean nighttime SUHII varied from 0.28 °C in Nanjing to 2.27 °C in Harbin. In contrast to the spatial pattern of the daytime SUHII, the cities located in Northern China experienced a more intense nighttime SUHII than those in the South. To further explore the relationship between the daytime and nighttime SUHII,
Figure 5c shows that there was a weak correlation between the annual mean daytime and nighttime SUHII across the 32 major cities in mainland China (
R = −0.26,
p = 0.15).
The values of the annual mean ECI, averaged over the period of 2008–2012 for the 32 major cities in urban areas, varied from 1.75 × 10
4 tce/km
2 in Beijing to 50.89 × 10
4 tce/km
2 in Lhasa, while they varied from 1.28 × 10
4 tce/km
2 in Beijing to 50.70 × 10
4 tce/km
2 in Lhasa in their corresponding suburban areas. As a whole, the values for the annual mean ECI in urban areas were consistently larger than those in the suburban areas of each city. In the meantime, the maximum difference in the annual mean ECI between urban and suburban areas was found in Beijing (0.46 × 10
4 tce/km
2), followed by Shijiazhuang (0.43 × 10
4 tce/km
2) and Taiyuan (0.38 × 10
4 tce/km
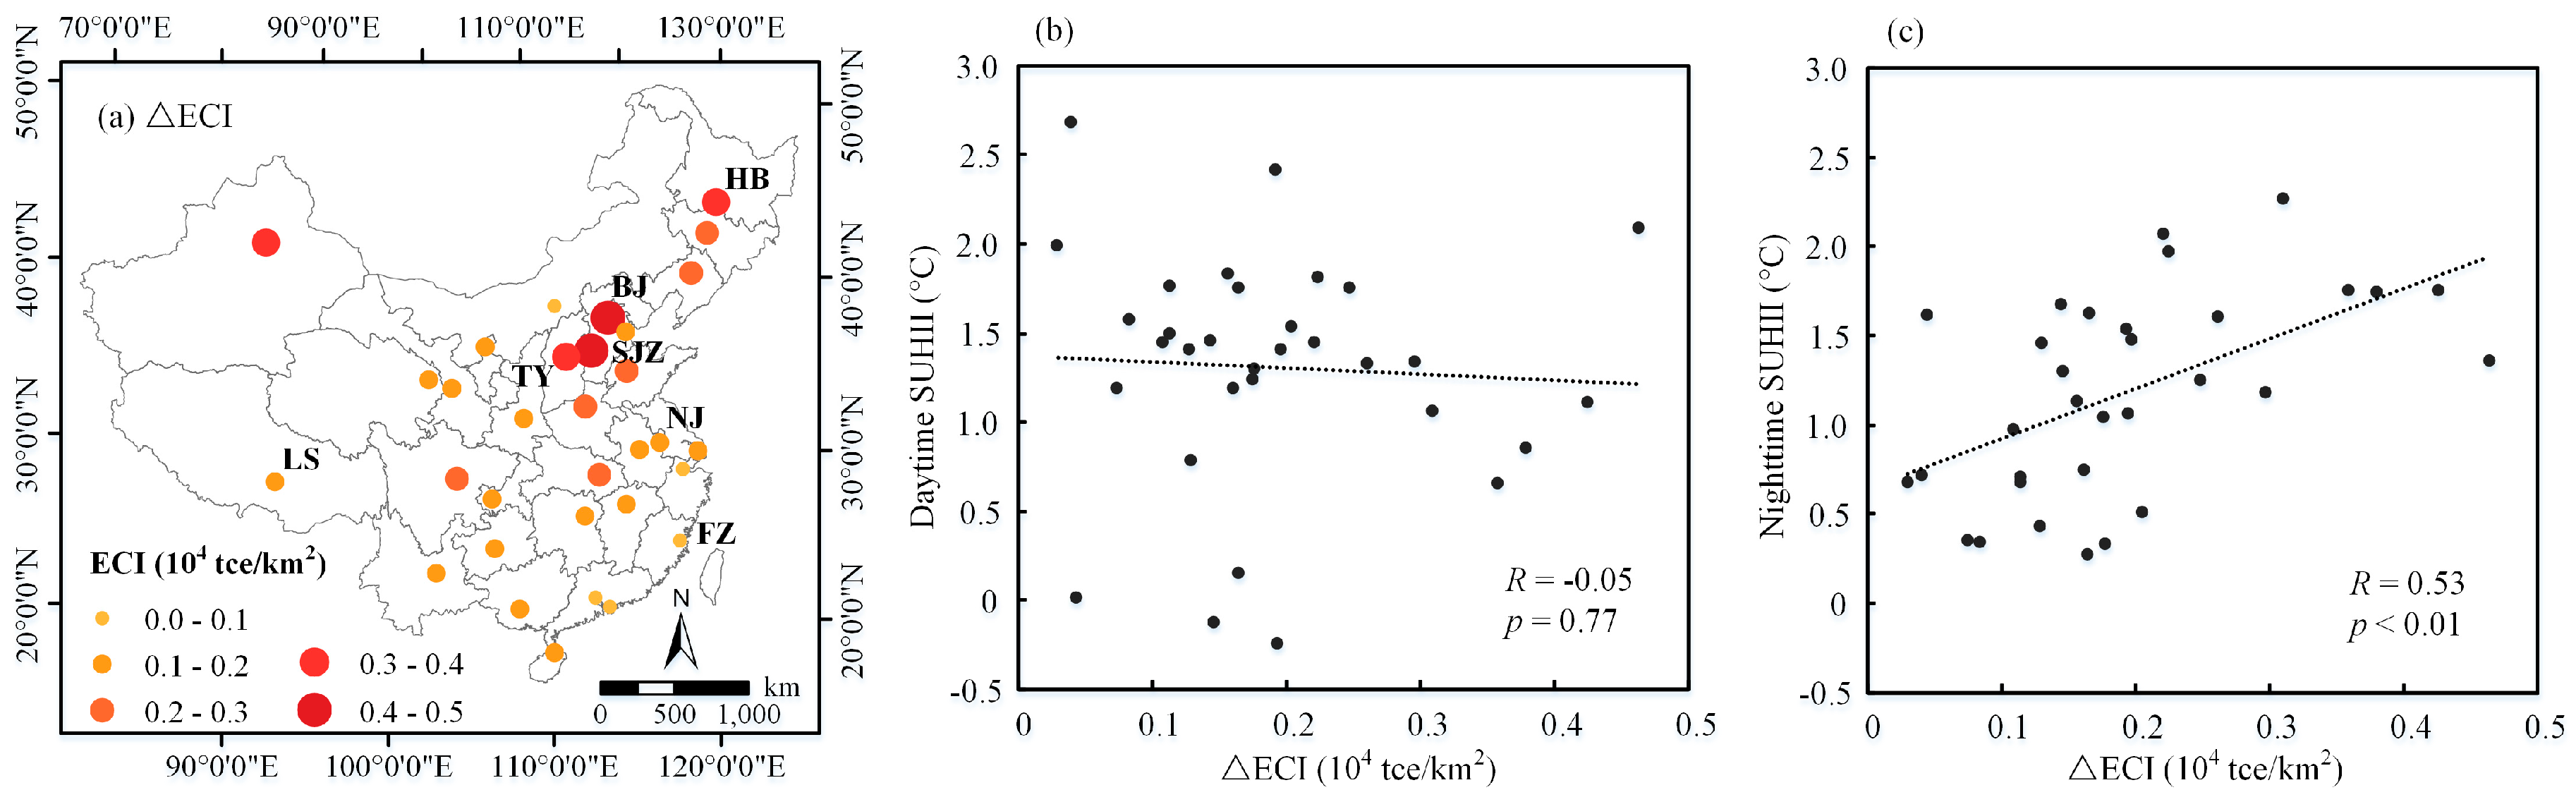
2). Additionally, the spatial distribution of the urban-suburban difference in the annual mean ECI (ΔECI), averaged over the period of 2008–2012 for the 32 major cities in mainland China, is shown in
Figure 6a. Similar to the nighttime SUHII, the cities located in Northern China experienced a more intense ΔECI than those in the South.
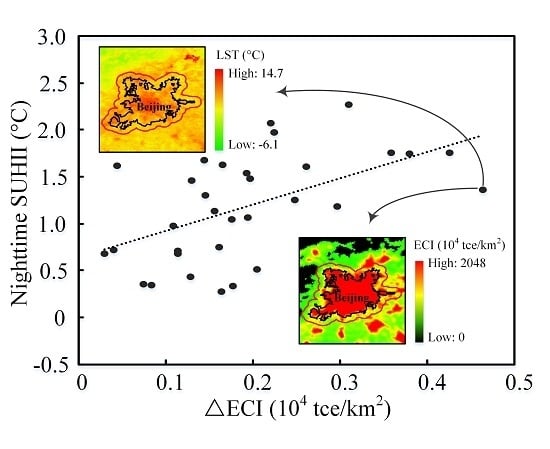
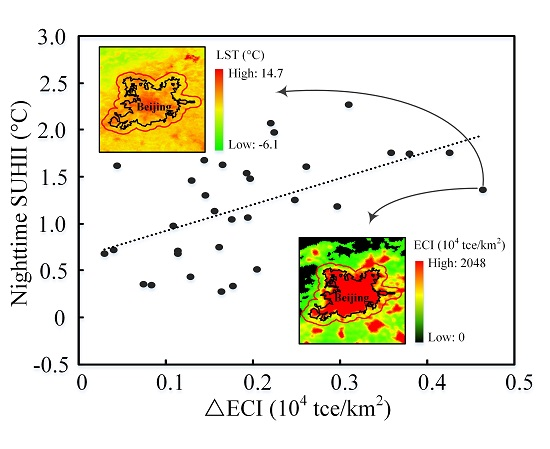
In order to explore the relationship between energy consumption and the surface urban heat island,
Figure 6 shows the scatterplots of ΔECI values versus the annual mean daytime and nighttime SUHII, respectively. There was no correlation between the △ECI and daytime SUHII (
R = −0.05,
p = 0.77). In contrast, ΔECI had a strongly positive correlation, which was significant at the 99% confidence level (
R = 0.53,
p < 0.01), with the nighttime SUHII.
5. Discussion
As showed in
Figure 5, the spatial pattern of the annual mean daytime SUHII is different from that of the nighttime SUHII. The weak correlation between the daytime and nighttime SUHII across the 32 major cities in mainland China is consistent with the finding of Peng et al. (2011) [
2], who reported that no correlation between the annual mean daytime and nighttime SUHII was observed for 419 large global cities. Besides, Peng et al. (2011) [
2] found that the urban-suburban differences in vegetation cover and albedo can explain about 51% and 2% of the between-city variance in the daytime SUHII, while the urban-suburban differences in vegetation cover, albedo, and nighttime light, explain about 2%, 18%, and 13% of the nighttime SUHII, respectively. Furthermore, Zhou et al. (2014) [
26] stated that the distribution of the daytime SUHII closely correlated with the distribution of vegetation activity and nighttime lights in summer, and with the climate (temperature and precipitation) in winter, while the distribution of the nighttime SUHII strongly correlated with that of albedo, nighttime lights, built-up intensity, and climate, in both seasons. These results suggest that the drivers of the urban heat island during the daytime are different from those during the nighttime.
Anthropogenic heat flux can be converted into sensible heat flux or other heat flux, and can indirectly influence the SUHII [
38]. Compared with suburban areas, inland cities are usually observed to be concentrated areas with a large energy consumption. Anthropogenic heat released from energy consumption is an important contributor to the urban thermal environment. However, the magnitude of the urban-suburban difference in ECI varies considerably among the cities in mainland China (
Figure 6a). The correlation between energy consumption and SUHII indicates that anthropogenic heat released from energy consumption has different impacts on the daytime and nighttime SUHII. The cities with a larger ΔECI have a far greater impact on SUHII during the nighttime.
Results from previous studies also demonstrate that anthropogenic heat released from energy consumption have a small impact on the daytime SUHII, but a large impact on the nighttime SUHII [
16,
17,
18]. This phenomenon can be explained based on the contrast of surface energy exchange between urban and suburban areas. The downward net solar radiation flux and anthropogenic heat flux produced by human activities (building, cooling and heating, transportation, and human metabolism) are the two major energy sources which affect the evolution of the urban heat island [
39]. These two energy sources are converted into sensible heat flux, latent heat flux, and surface heat storage, according to the surface energy balance on the land surface. During the daytime, net solar radiation flux is far greater than the heat flux released by anthropogenic sources. Sensible heat flux, latent heat flux, and surface heat storage, are mainly driven by net solar radiation flux. As a result, the anthropogenic heat produced by energy consumption has less impact on the daytime SUHII. After sunset, without the heat flux from solar radiation, sensible heat flux and latent heat flux are mainly converted from the sum of surface heat storage during the daytime and anthropogenic heat released from energy consumption during the nighttime. However, as time goes on, the heat flux from surface heat storage decreases. The proportion of anthropogenic heat release in the heat flux during the night, is relatively larger than that during the daytime [
18]. As a result, the cities with a larger urban-suburban difference in ECI tend to experience a more intense SUHII during the nighttime.
Nighttime light was considered as a suitable proxy for anthropogenic heat released from energy consumption in previous studies [
2,
26]. However, the use of the urban-suburban difference in ECI when directly exploring the relationship between energy consumption and SUHII, is to some extent, different from the indirect use of nighttime light. Nighttime light can indirectly reflect the intensity of human activities, but the spatial distribution of energy consumption downscaled from energy statistics, can directly reflect the intensity of the anthropogenic heat released from energy consumption in space. In other words, compared with nighttime light, energy consumption is a more physically meaningful proxy for analyzing the impact of energy consumption on SUHII in this study. In order to further investigate the difference in the correlation with SUHII, between ECI and nighttime light, we extracted the nighttime light difference between urban and suburban areas and repeated the same correlation analysis as that for energy consumption. The results show that nighttime light has no correlation with the daytime SUHII (
R = 0.05,
p = 0.77), while it had a positive correlation with the nighttime SUHII (
R = 0.39,
p = 0.03). However, a much stronger correlation is detected between energy consumption and the nighttime SUHII, when compared with the correlation between nighttime light and SUHII (
R = 0.53 versus
R = 0.39); although both correlations are positive. This indicated that, by directly examining the correlation between the SUHII and the urban-suburban difference in ECI, we can better detect the impact of energy consumption on the surface urban heat island.
As the intensity of energy consumption downscaled from energy statistics is strongly correlated with SUHII, it can be incorporated into urban climate models to better improve the representation of anthropogenic heat release. Recently, Chen et al. (2016) [
38] incorporated the anthropogenic heat release data, which were estimated based on energy statistics and multisensory remote-sensing data, into model simulations, and effectively detected the impact of anthropogenic heat on the urban environment of Hangzhou City in China. In contrast, Cao et al. (2016) [
40] conducted a study based on satellite observations and a land surface model, to investigate the contributions of each component (i.e., radiation, efficiency of sensible heat convection, evaporation, heat storage, and anthropogenic heat release) to the UHI. However, due to the lack of a realistic anthropogenic heat parameterization in the land surface model, the modeled urban heat island intensity is very different from that derived from satellite observations. Therefore, to improve the performance of the model for capturing the urban climate, the inclusion of the energy consumption-based anthropogenic heat source into the surface energy balance is necessary in model parameterizations.
For the first time, we have analyzed the impact of energy consumption on the surface urban heat island in China’s 32 major cities, based on the historical observation data. We have discussed the annual average change of energy consumption and SUHII during the period of 2008–2012. The seasonal variability of energy consumption was not addressed in this study, due to the lack of seasonal data. As a matter of fact, both energy consumption and SUHII vary with the season [
19,
26]. If we assumed that energy consumption does not change across the seasons, but that SUHII varies with the season, the urban-suburban difference in ECI had a stronger positive correlation with SUHII during the nighttime in the summer (June–August) (
R = 0.57,
p < 0.01), followed by autumn (September–November) (
R = 0.52,
p < 0.01), spring (March–May) (
R = 0.48,
p < 0.01), and winter (December–February) (
R = 0.48,
p < 0.01). Hence, the impacts of energy consumption on the surface urban heat island are likely to be different in different seasons. This seasonality of impact should be addressed in future research, when the seasonal energy consumption data become available.
6. Conclusions
In this study, the annual mean daytime and nighttime SUHII, averaged over the period of 2008–2012, were evaluated, based on the MODIS LST data for the 32 major cities in mainland China. The energy consumption was estimated, based on a relationship between energy consumption and the sum of nighttime lights. We then investigated the impact of energy consumption on the surface urban heat island in these cities, by directly exploring the correlation between SUHII and the urban-suburban difference in ECI. The results suggest that the annual mean daytime SUHII across the 32 major cities in mainland China has a weak correlation with the nighttime SUHII. However, energy consumption has a significant impact on the nighttime SUHII, but a limited impact on the daytime SUHII. The more intense SUHII during the nighttime is found in the cities with a larger urban-suburban difference in ECI.
In contrast to previous studies [
2,
26], the urban-suburban difference in the annual mean ECI is used to directly examine the relationship between energy consumption and SUHII. Additionally, for the first time, the impact of energy consumption on the surface urban heat island is examined, based on the analysis of historical observation data. The results in the present study are in good agreement with those simulated in numerical models [
16,
17,
18,
38]. It is further demonstrated that the anthropogenic heat released from energy consumption is an important contributor to the urban thermal environment. However, the energy consumption might be underestimated in city centers, due to the saturation of the nighttime light in this study. It is believed that the bias of the estimated energy consumption, caused by the saturation issue, can be reduced with the improvement of relevant algorithms in the future.
During the last three decades, China has experienced rapid urbanization and dramatic economic growth [
41]. Alongside this, energy consumption has continued to grow and has coincided with environmental degradation in China. Although China’s economic growth is slowing down and has undergone transformation in recent years, China is still the largest energy consumer in the world. Results from this study suggest that the impact of the anthropogenic heat released from energy consumption on the urban climate is apparent and should not be ignored in future research. Therefore, the effect of energy consumption has to be considered in the development of mitigation strategies to combat the adverse effect of the surface urban heat island on socioeconomic development and human wellbeing.


