1. Introduction
Accurate and timely updated 3D building models are a core element of urban scene reconstruction. Virtual models serve as an important information source to support various domains such as urban planning, disaster management, navigation and tourism. A permanently increasing spectrum of applications urgently demands advanced methods for efficient and automated reconstruction algorithms providing up-to-date products. Despite worldwide intensive efforts to improve the modeling process, reconstruction of highly accurate building models still remains a challenging task (e.g., [
1,
2]).
Due to the needs for efficient modeling covering large areas, the base information for building extraction mainly comes from airborne data. With regard to the data type used in the modeling process, the algorithms can be classified into three groups: (i) based on airborne laser scanning (ALS) generated point clouds; (ii) based on aerial stereo imagery; and (iii) combining these both sources. With the advancement of sensor technologies, airborne laser scanning has proven to be a strong basis for 3D building model generation. Facilitating high automation of a reconstruction scheme, ALS point clouds have been used in a large variety of modeling methods (e.g., [
3,
4,
5,
6,
7,
8,
9]). The high vertical accuracy of such reconstructed rooftops is adequate even for demanding engineering applications. Unfortunately, building models derived from ALS data are restricted by the point spacing of datasets. Hence, it is difficult to achieve high planimetric accuracy of a reconstructed scene. While ridge lines inherit a good precision from the redundancy in extracted plane intersection processes, the precision of the outer perimeter of reconstructed roofs suffers from the limited point spacing. An alternative 3D modeling approach is to make use of aerial imagery [
10,
11,
12,
13,
14]. Compared to laser scanning, optical imagery with its much higher spatial resolution allows for a more accurate extraction of building edges [
15]. On the other hand, a major shortcoming of image-based modeling relates to their 2D nature, requiring reliable image matching techniques to achieve automation. Moreover, common problems encountered by image processing (such as shadows, occlusions, and poor contrast) can hinder effective reconstruction [
16]. For the two aforementioned groups of methods that are based on one type of data, it is hard to obtain both, planimetric and height accuracy at the same level [
17]. All of these facts are the motivation for the third type of building reconstruction approach, which benefits from synergetic properties of LiDAR and image data and uses both of these sources. Employing multiple data types enables the combination of modeling cues and covers shortcomings inherited from the acquisition technique. It can be expected that the limitations coming from one sensor (such as data gaps, occlusions, shadows, and resolution issues) will be compensated for by the information provided by the second sensor.
The integration of laser scanning and imagery for 3D building reconstruction can be performed in two ways using a parallel or a sequential approach [
18]. In the case of the former one, the modeling process employs two data sources at the same time. Usually, each type of data is used for the extraction of distinct modeling cues. Thus, linear features are derived from aerial images while 3D point clouds are utilized to validate them or to support the generation of new lines. In [
19], 3D image lines generated by stereo imagery matched with the boundaries derived from point clouds in order to improve the accuracy of ALS-based roof patches. The integration of building boundaries extracted from aerial images and roof planes derived by laser scanning can be executed in various ways, e.g., by split and merging strategy [
20] or binary space partitioning [
21]. The possibility of using LiDAR data to guide an edge detection process is also discussed in [
22]. Lee et al. [
15] extract initial building regions from ALS point clouds and merge them with the regions segmented from images. A line matching process performed in 3D space is described by [
23]. Three-dimensional straight edges extracted from photographs are assigned to the corresponding roof planes, giving more precise outlines of a roof. An alternative approach is proposed in [
24], where constraints from LiDAR data and aerial imagery are exploited simultaneously in order to optimize parameters of a building model. In the second group of methods, following a sequential data fusion approach, building models are generated based on a single information source and later refined by the other data, mostly using ALS point clouds for initial 3D building model generation. The sequential building modeling also gives an opportunity for an effective update of virtual cities already reconstructed from LiDAR. In these terms, existing 3D models are refined by newly collected information. In the method reported by [
25], the initial polyhedral models are back-projected to the images, where their edges can be matched with image-derived lines. The following model fitting is based on hierarchical matching, applying the scheme of hypotheses generation and verification. Alternatively, building refinement given by [
26] utilizes stereo imagery information and roof constraints. Markov Random Fields (MRF) models are employed by geometric refinement of building roof contours developed by [
27]. Sohn et al. [
18] describe a sequential modeling process, in which ALS-based models are improved by a hypothesis-test scheme based on Minimum Description Length (MDL). Perera et al. [
28] produces rooftop models using LiDAR data and improves their initial model accuracy by applying scene constraints to edges derived by the Burns extractor. An interesting approach that employs oblique images in the refinement process is presented in [
29]. Since oblique images reveal a greater level of detail about building facades, they enable the enrichment of existing models by the automatic reconstruction of building overhangs. In order to match two sources of the information, existing building models and imagery, the projected wireframe models are fit to the image by a least square adjustment.
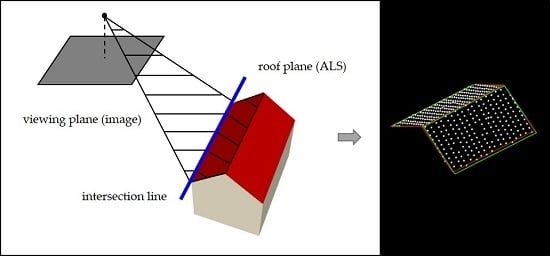
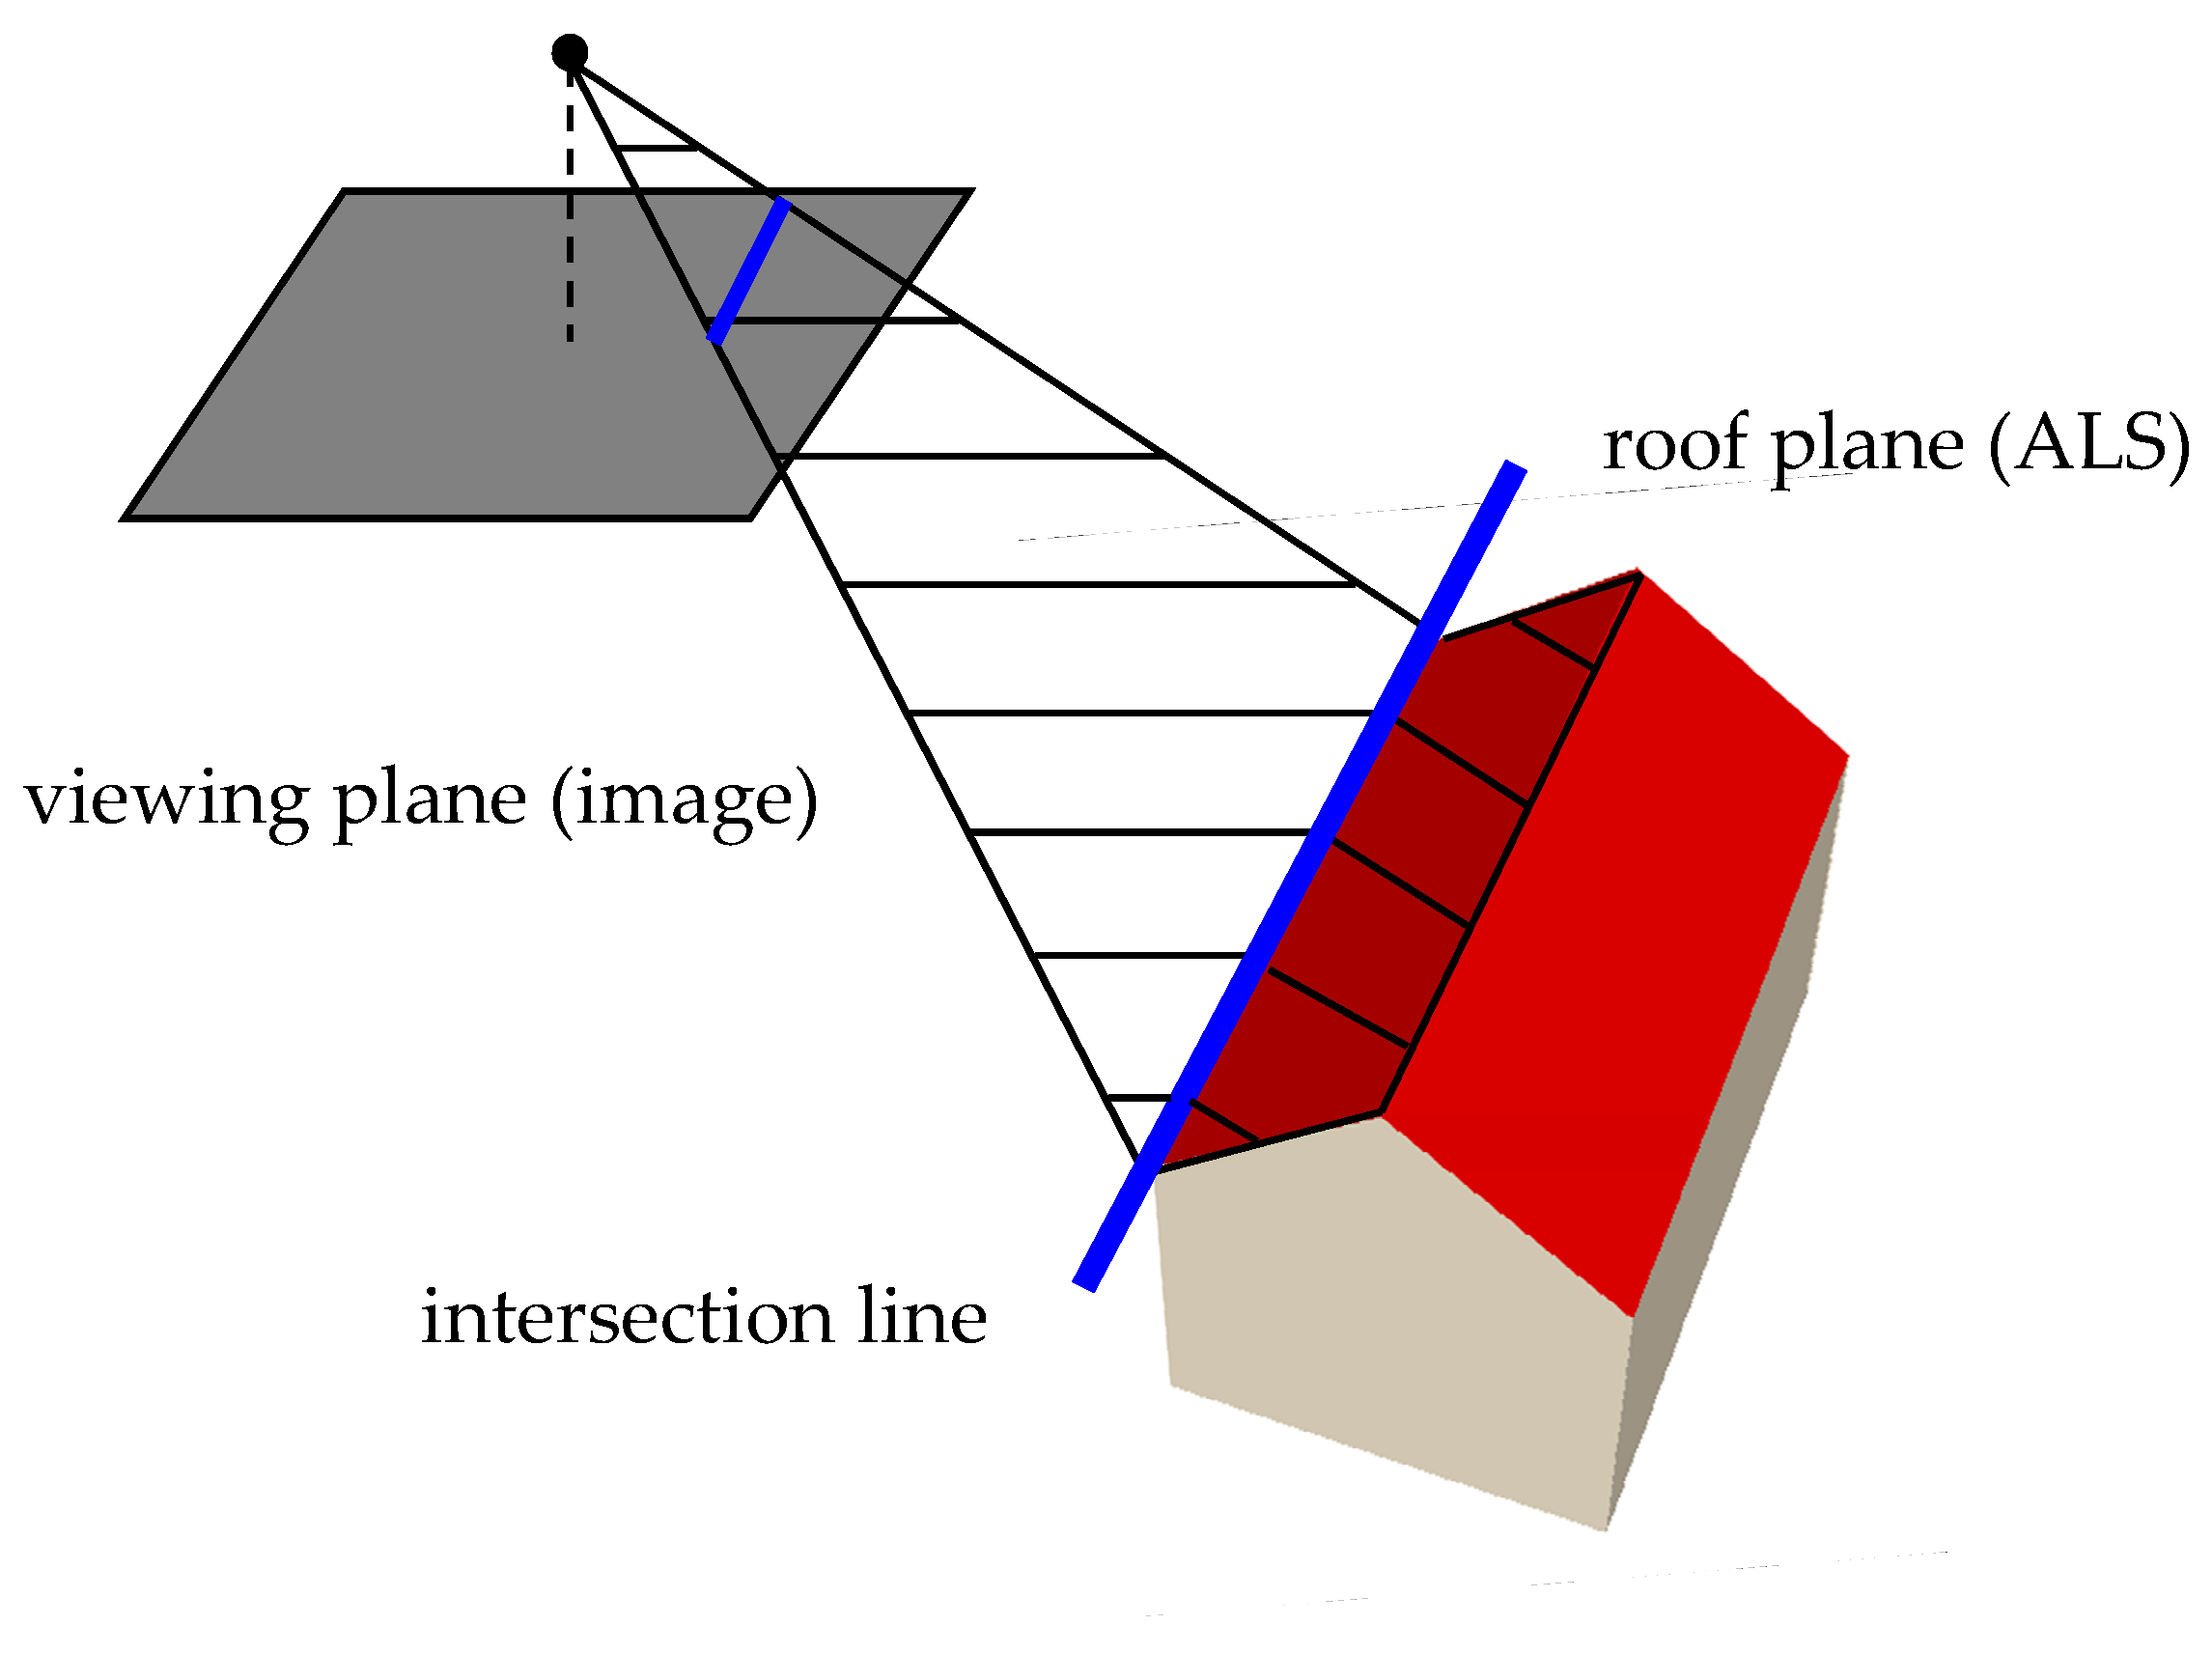
An inherent problem for the reconstruction methods based on multiple data sources is matching ambiguities of the extracted modeling cues. For the time being, the question of how to optimally use ALS data together with aerial imagery has still not been fully solved. In this paper, we present a novel approach for sequential refinement of 3D building models using a single aerial image. The core idea of modeling improvement is to obtain refined model edges by intersecting roof planes accurately extracted from 3D point clouds and viewing planes assigned to the building edges detected in a high resolution aerial photograph (cf.
Figure 1). In order to minimize ambiguities that may arise during the integration of modeling cues, the ALS data is used as the master, providing initial information about buildings being processed. While roof plane outlines derived from ALS data may suffer from ALS point spacing effects in planimetry, they are still a rather good approximation for reality. Therefore, 3D buildings derived from ALS data serve as input information on the shape and topology of building roofs. The aim of our research is to increase the geometric accuracy of those models and thus improve the overall quality of the reconstruction. In order to evaluate the performance of our refinement algorithm, we compare the results of 3D reconstruction executed using only laser scanning data, with a reconstruction enhanced by image information. Furthermore, quality assessment of both reconstruction outputs is performed based on a comparison to reference data, according to the validation methods standardized by the International Society for Photogrammetry and Remote Sensing [
1].
The structure of the paper is as follows: the strategy of the building refinement process is described in
Section 2; it comprises four main implementation steps presented in detail in the consecutive subsections.
Section 3 presents results and discusses the performance of the proposed algorithm. Conclusions and summary of the presented work are given in
Section 4.
2. Refinement Methodology
The presented method allows for the refinement of existing 3D models derived from ALS by their integration with modeling cues extracted from single image. The workflow of the implemented procedure is illustrated in
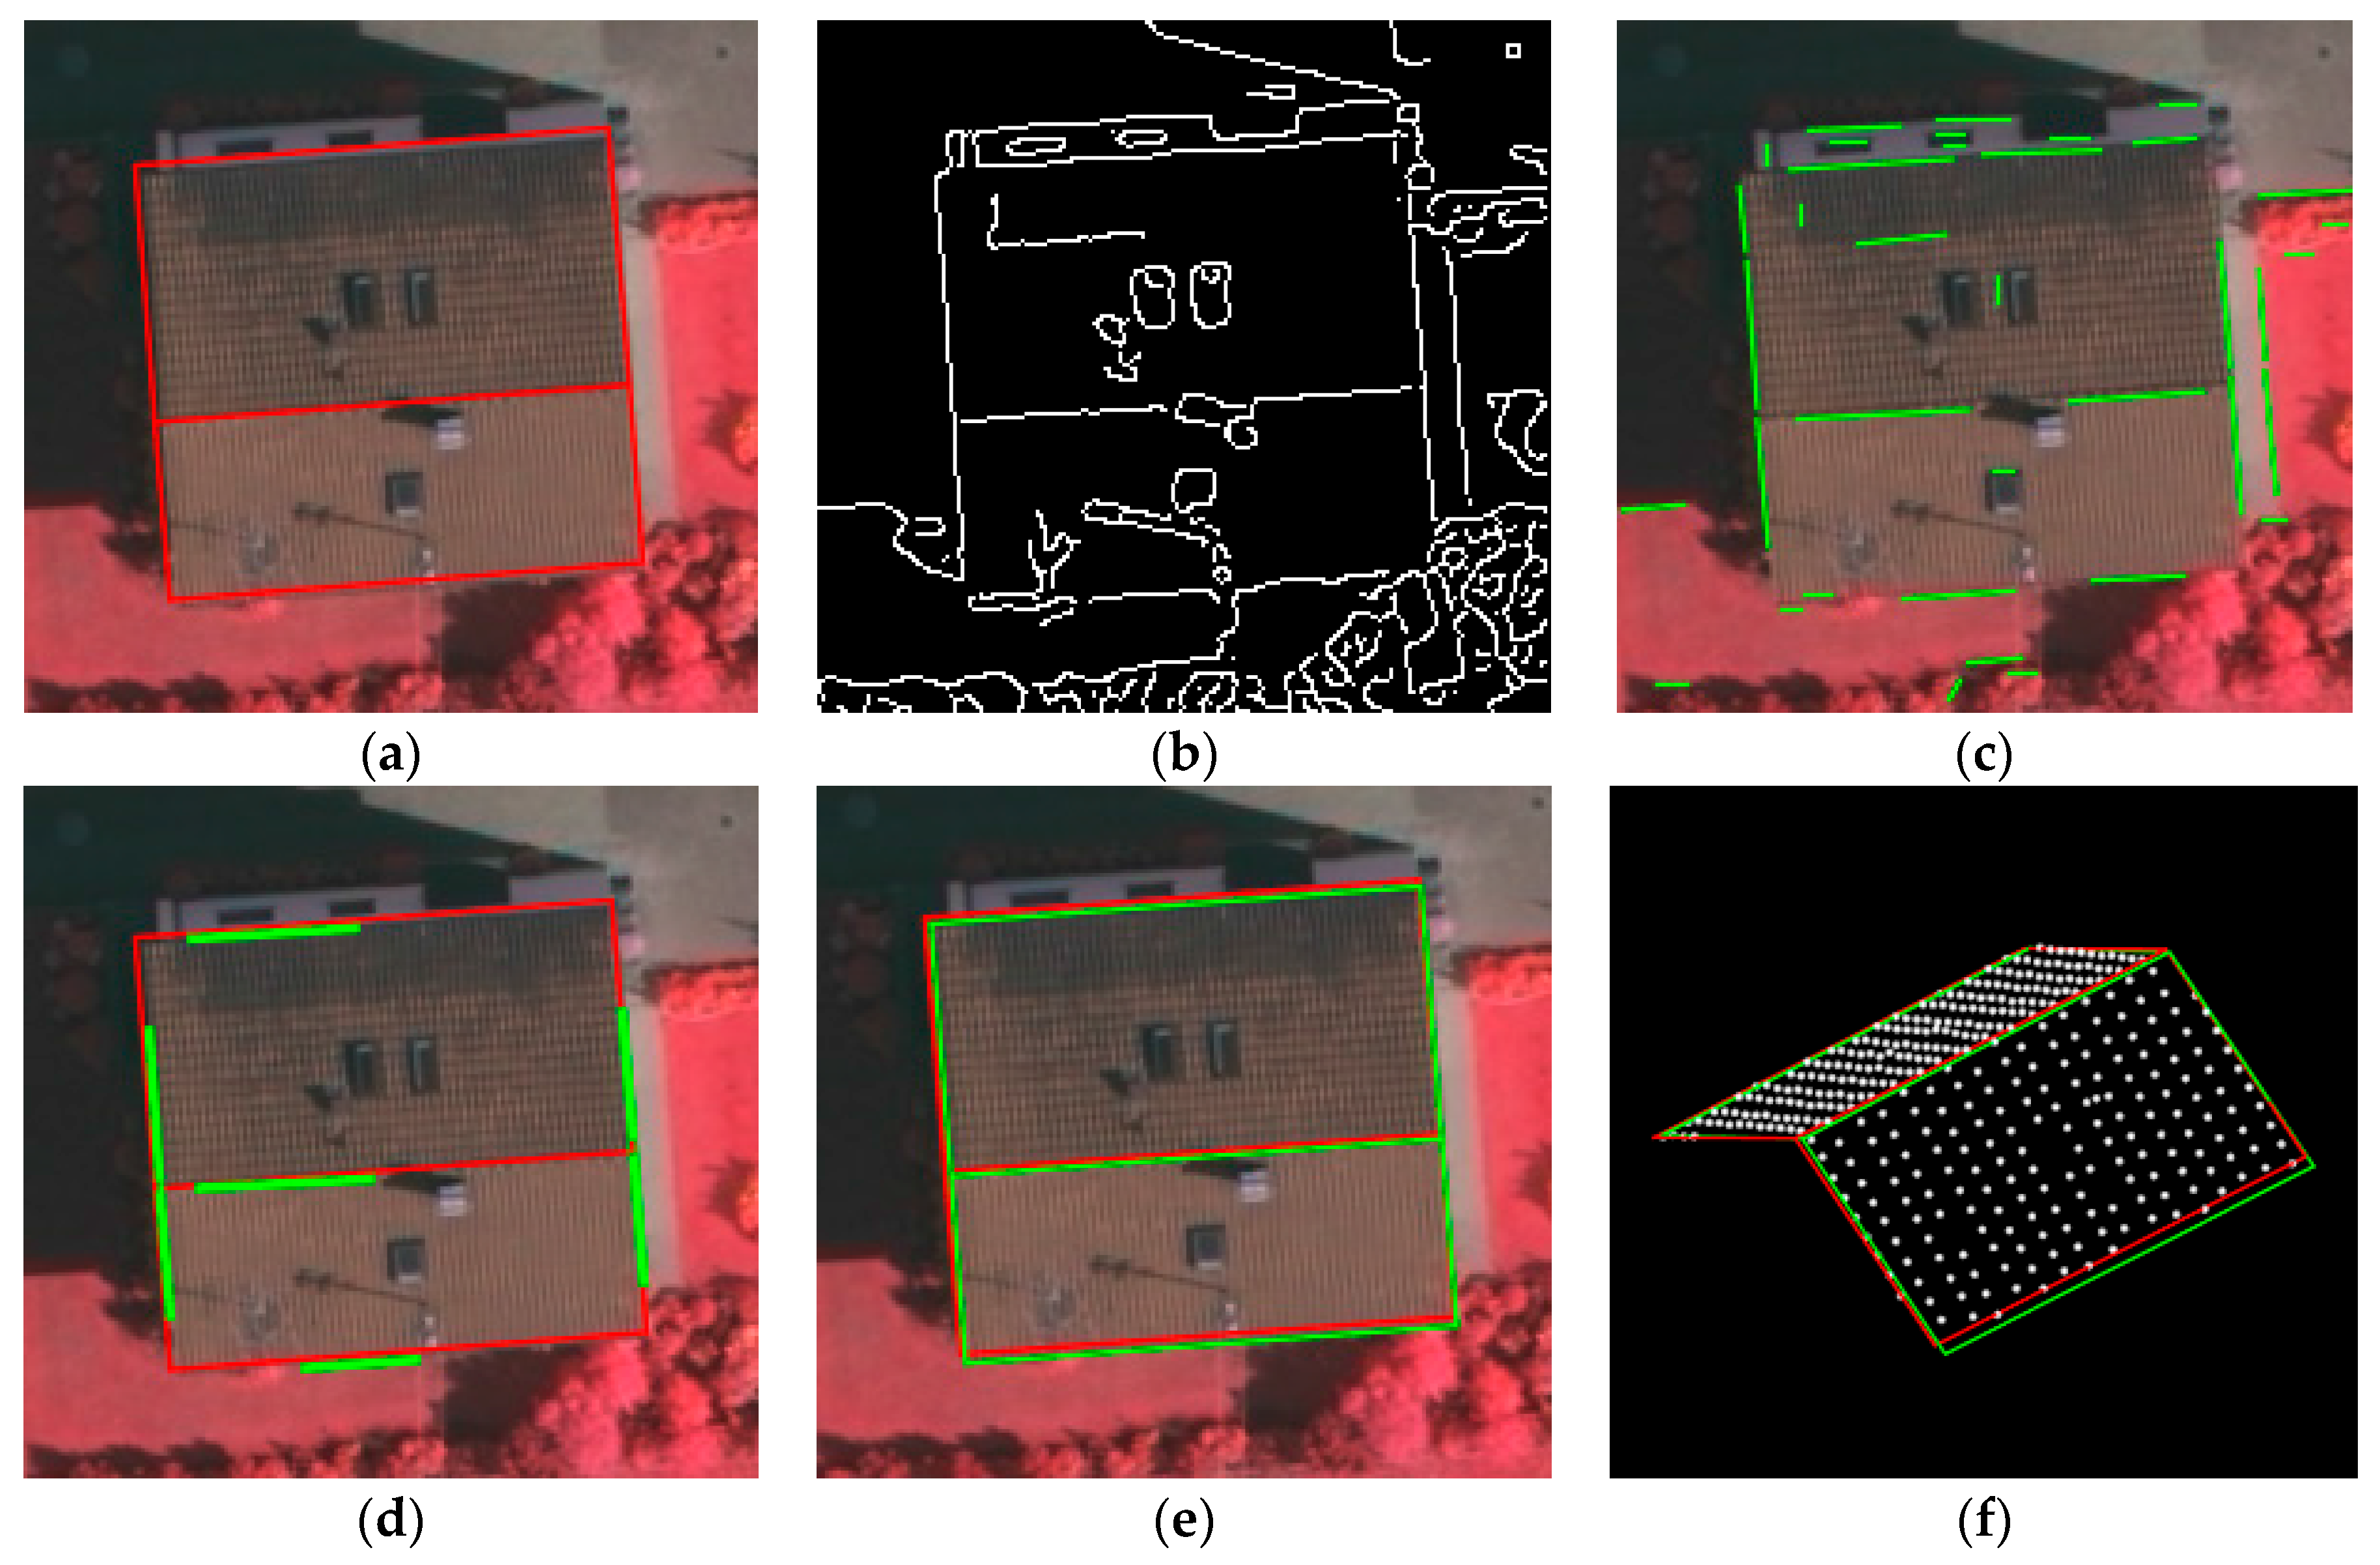
Figure 2 and described in detail in the following sub-sections. In order to improve the precision of roof plane outlines, 3D roof edges are projected into the image space (
Figure 2a). The orientation parameters of the aerial images are assumed to be known, hence the process of co-registration is not the focus of this work (for details on the procedure and the results that were used as an input in the presented work cf. [
30,
31]).
A projection of the ALS wireframe model defines an area of interest in the aerial image where linear features are extracted (
Figure 2b,c). In the next step, ALS-based roof edges are substituted by the best matching linear segments extracted from the image (
Figure 2d). Geometrical constraints given by the projected line segments are used to reduce the search space for correspondence matching. Lines extracted from the image are projected to planes’ 3D space and intersected with relevant planes from the ALS data. New 3D coordinates of roof corners are computed by intersection of the thus obtained outer building edges (
Figure 2e,f). In order to intersect proper planes, the computation is guided by the topology information provided by input building models, which remains unchanged. The underlying methodology so far assumes that the models initially derived from laser scanning data are topologically correct.
2.1. Projection of ALS 3D Model to Image Space
Initial building models subject to image-based refinement are reconstructed from ALS point clouds according to an approach described in [
32]. The method allows for a reconstruction of polyhedral buildings models by unambiguous decomposition of complex objects into predefined parametric primitives. The 3D models are stored as a list of
X,
Y, Z coordinates of roof vertices and their topological relations (connecting edges). The first step of the implemented algorithm is to project the input wireframe model into image space. The projection is performed through the collinearity equations, along with known exterior and interior camera orientation parameters. First, object space points (3D roof vertices) are transformed into the camera coordinate system. Then, the internal camera model and the interior orientation parameters are used to transform camera points into the image space. Finally, the projected 2D points are connected according to the topology information provided by the input models. As a result, initial 3D boundaries of roof planes are transformed into lines in the image.
2.2. Linear Feature Extraction
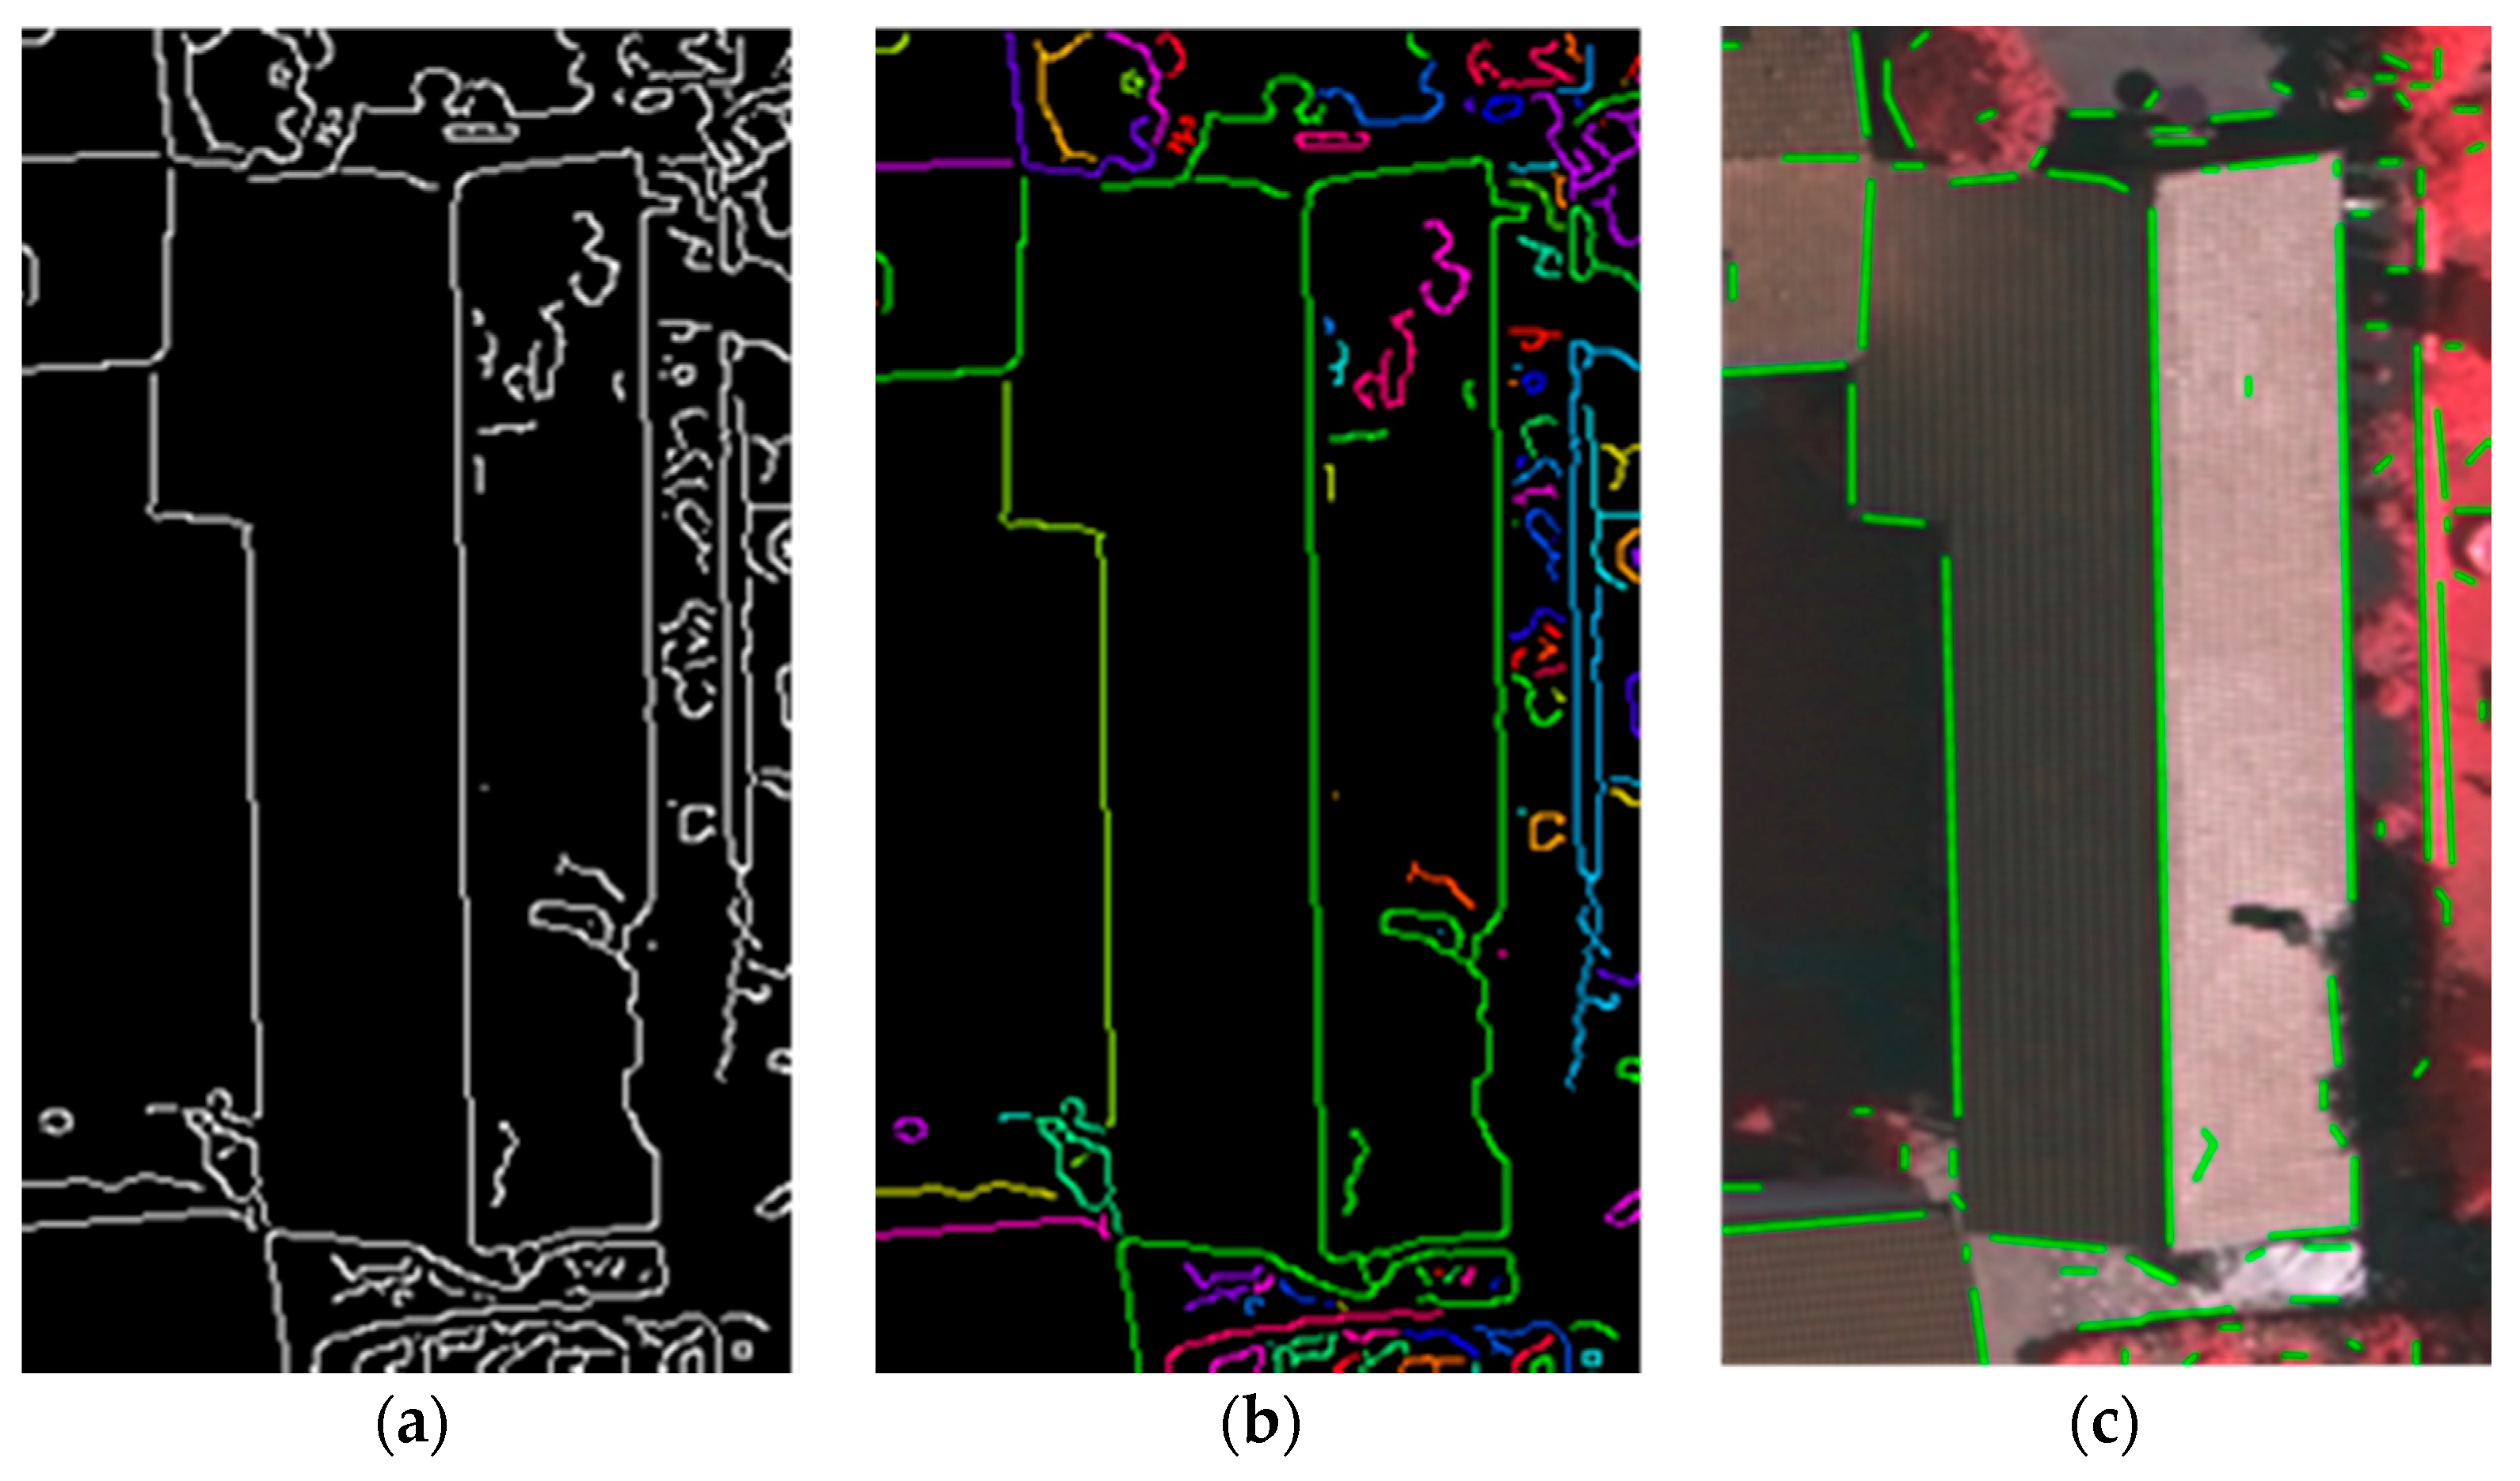
To automatically extract straight line segments from aerial photographs, we use the Canny edge detector followed by connected component analysis and a line growing algorithm. Processing can be limited to a bounding box constructed around each projected building model. The result of the Canny operator (presented in
Figure 3a) is a binary image with marked edge pixels associated to object boundaries. Connected component labeling is then applied (cf.
Figure 3b) to reduce the search space for potential straight lines. Straight line extraction is performed by a modified region growing algorithm, executed for each connected component. Before the growing process starts, data preparation is performed. For each pixel and its
n neighbors, we determine the best fitting line using a regression method. After the estimation process, each input pixel is provided with local line parameters and statistics values describing its estimation quality. The line growing process starts from the pixel with the least deviation from the locally estimated line. The investigation of pixels potentially belonging to the line involves the distance between the candidate pixel and the growing line as well as the angle between the estimated local line of the candidate pixel and the growing line. The pixels meeting the above requirements, predetermined by parameter thresholds, are added to the growing line segment. If there are no more acceptable candidates, a new seed is recognized and the growing process starts for the next line. The clusters with more pixels than a predefined number are used to extract straight lines, i.e., to determine end points of the line segment and to compute the related line equation. Detected straight line segments are shown in
Figure 3c.
The presented procedure, similarly to other edge extraction methods, does not consider if the extracted lines are relevant or correct. Besides building edges, extracted lines may also relate to other, irrelevant objects such as vegetation, fences, shadows or roof patterns. On the other side, some desired roof boundaries may not be derived due to shadow areas and occlusions. Hence, all of the extracted linear features are only treated as potential boundary information and serve as an input for correspondence matching, performed in the next step.
2.3. Similarity Measures and Line Matching
Although roof plane outlines derived from ALS data show deficits in planimetric accuracy, they serve as good input information for structural arrangement of roofs and convergence priors. Therefore, in our method, ALS-based building models are used as guides for finding correspondences between projected input lines and new edges derived from the image. The aim of line matching is to substitute each building edge initially reconstructed from ALS by the best candidate chosen from line segments extracted by image processing. As the topology derived from the ALS-data remained unchanged, there must be a 1:1 matching between line origin from ALS-data processing and lines detected in the image, i.e., no “new” lines are generated. Both edge sets, reference and candidate, follow the same pixel coordinate system. It is possible to compute mutual geometric relationships and find corresponding pairs of boundary lines. To support choosing a correct image line for each reference edge, the following similarity measures, equally weighted, are applied:
proximity of both lines, defined by a distance from both end-points of a candidate segment to a reference line segment (specified as a buffer around a reference line segment),
similar orientation, defined by an angle between reference and candidate line,
length difference, calculated in percentages.
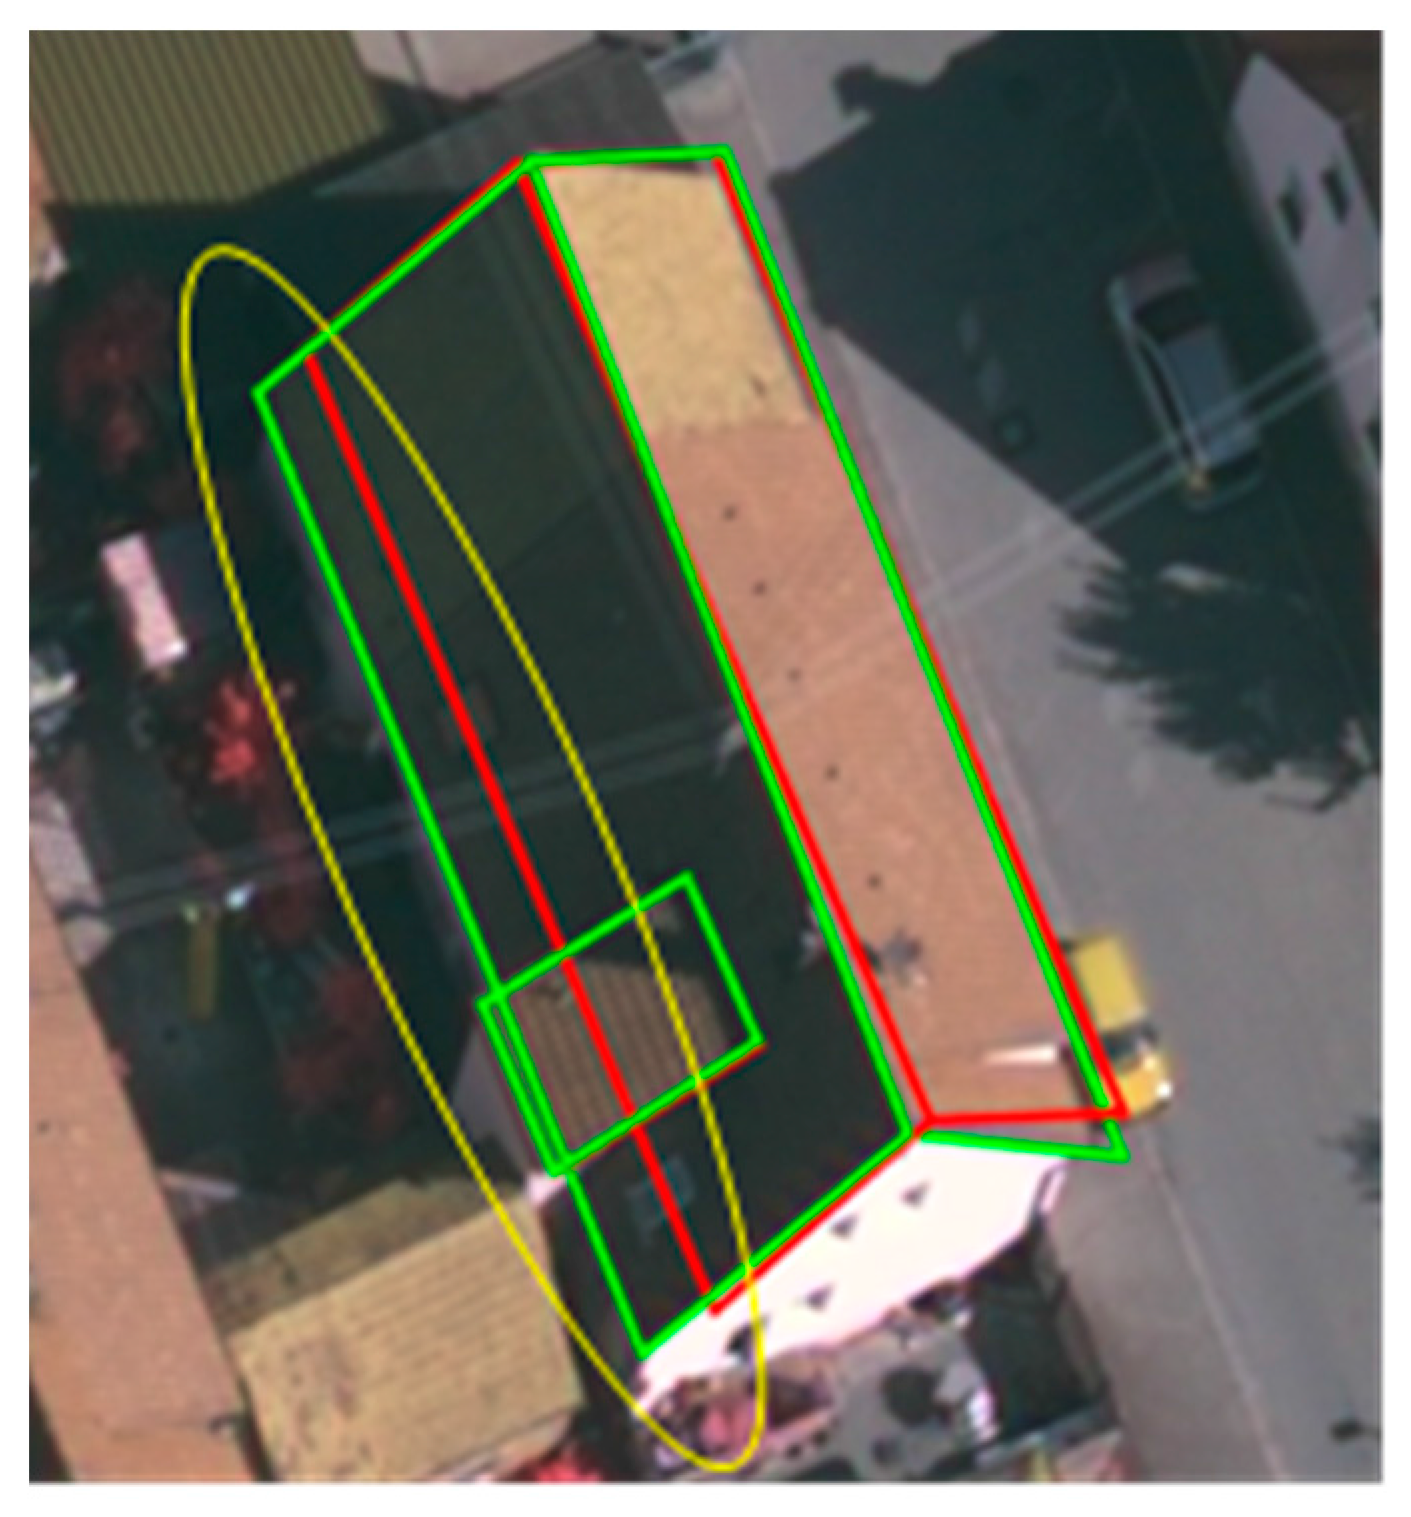
If there is more than one line fulfilling all of the requirements pre-determined by parameter thresholds, the most outer line of the accepted candidate set is chosen. This rule is driven by the fact that, in most cases, objects reconstructed from ALS points are slightly shrunk due to the spacing between ALS scan lines. In order to optimize the candidate selection process, we introduced an incremental threshold: the initial search space is limited into a narrow buffer, thus discarding many potentially irrelevant edge candidates. If no edge is accepted as a best matching line, thresholds are released and the matching process is repeated in a wider buffer. The concept of increasing search space enables achieving correct line matching in the case of large deficiencies in input models. Moreover, it prevents spurious matching results, which could appear when using a large search buffer from the very beginning of the search process. An exemplary result of line matching performed with an iteratively increasing search buffer is illustrated in
Figure 4.
Proper extraction of all relevant building edges may be hindered by several factors, such as shadows along the desired edge, poor contrast, occlusions, or erroneous reference. Hence, it is not always possible to find a corresponding line for each reference edge. In this case, the initial line is used in further proceedings.
2.4. Reconstruction of a Refined 3D Model
As a result of the correspondence matching presented in the previous step, we obtain a set of image lines linked to roof outlines of an input model. To integrate this newly extracted information with 3D clues derived from ALS, image-based edges are back-projected into object space. Then, a refined 3D building model is generated by the intersection of roof planes extracted from ALS data with viewing planes assigned to newly detected edges. In order to reconstruct viewing planes, viewing ray vectors are generated for both end points of a 2D line. A viewing plane is created based on the plane normal derived by the cross product of viewing ray vectors and coordinates of the projection center. The intersection of viewing planes and 3D planes of a roof (labelled as neighbouring in the input models) allows for obtaining refined 3D coordinates of roof corners (the idea behind the intersection scheme is illustrated in
Figure 1). If more than three planes intersect (e.g., two ALS planes and two viewing planes of eave edges intersecting in the end point of a ridge line), 3D coordinates are calculated using least squares adjustment. The neighboring planes are identified according to the topology information stored in the input building models. For evaluation purposes, refined building models are projected back to image space, where wireframe models before and after refinement can be compared.
3. Results and Discussion
To validate the presented refinement approach, we used data provided by International Society for Photogrammetry and Remote Sensing (ISPRS) WGIII/4 2012–2016 [
1]. The Vaihingen data set consists of three test sites that vary in urban characteristics and pose different reconstruction challenges. Area 1 presents older buildings with complex shapes, located in a densely built centre of the city. Area 2 contains high-rise residential buildings with flat roofs. Area 3 is characterized by detached houses in a residential area. The ALS point cloud was collected by a Leica ALS50 laser scanner system with a density of 4 points/m
2. The aerial images were acquired using an Intergraph/ZI digital mapping camera with a ground sampling distance of 8 cm and a radiometric resolution of 12 bits. The interior and exterior parameters were determined with an accuracy corresponding to one ground pixel.
The refinement method was applied to a set of 3D building models generated from ALS point clouds on LoD 2 (Level of Detail). The performance of the proposed method was investigated threefold by: (1) visual comparison of the reconstruction results before and after refinement; (2) analysis of an amount of applied correction calculated with respect to edge types; and (3) analysis of the accuracy of reconstructed 3D models performed according to the validation methods standardized by the ISPRS test.
3.1. Visual Analysis of the Refinement Performance
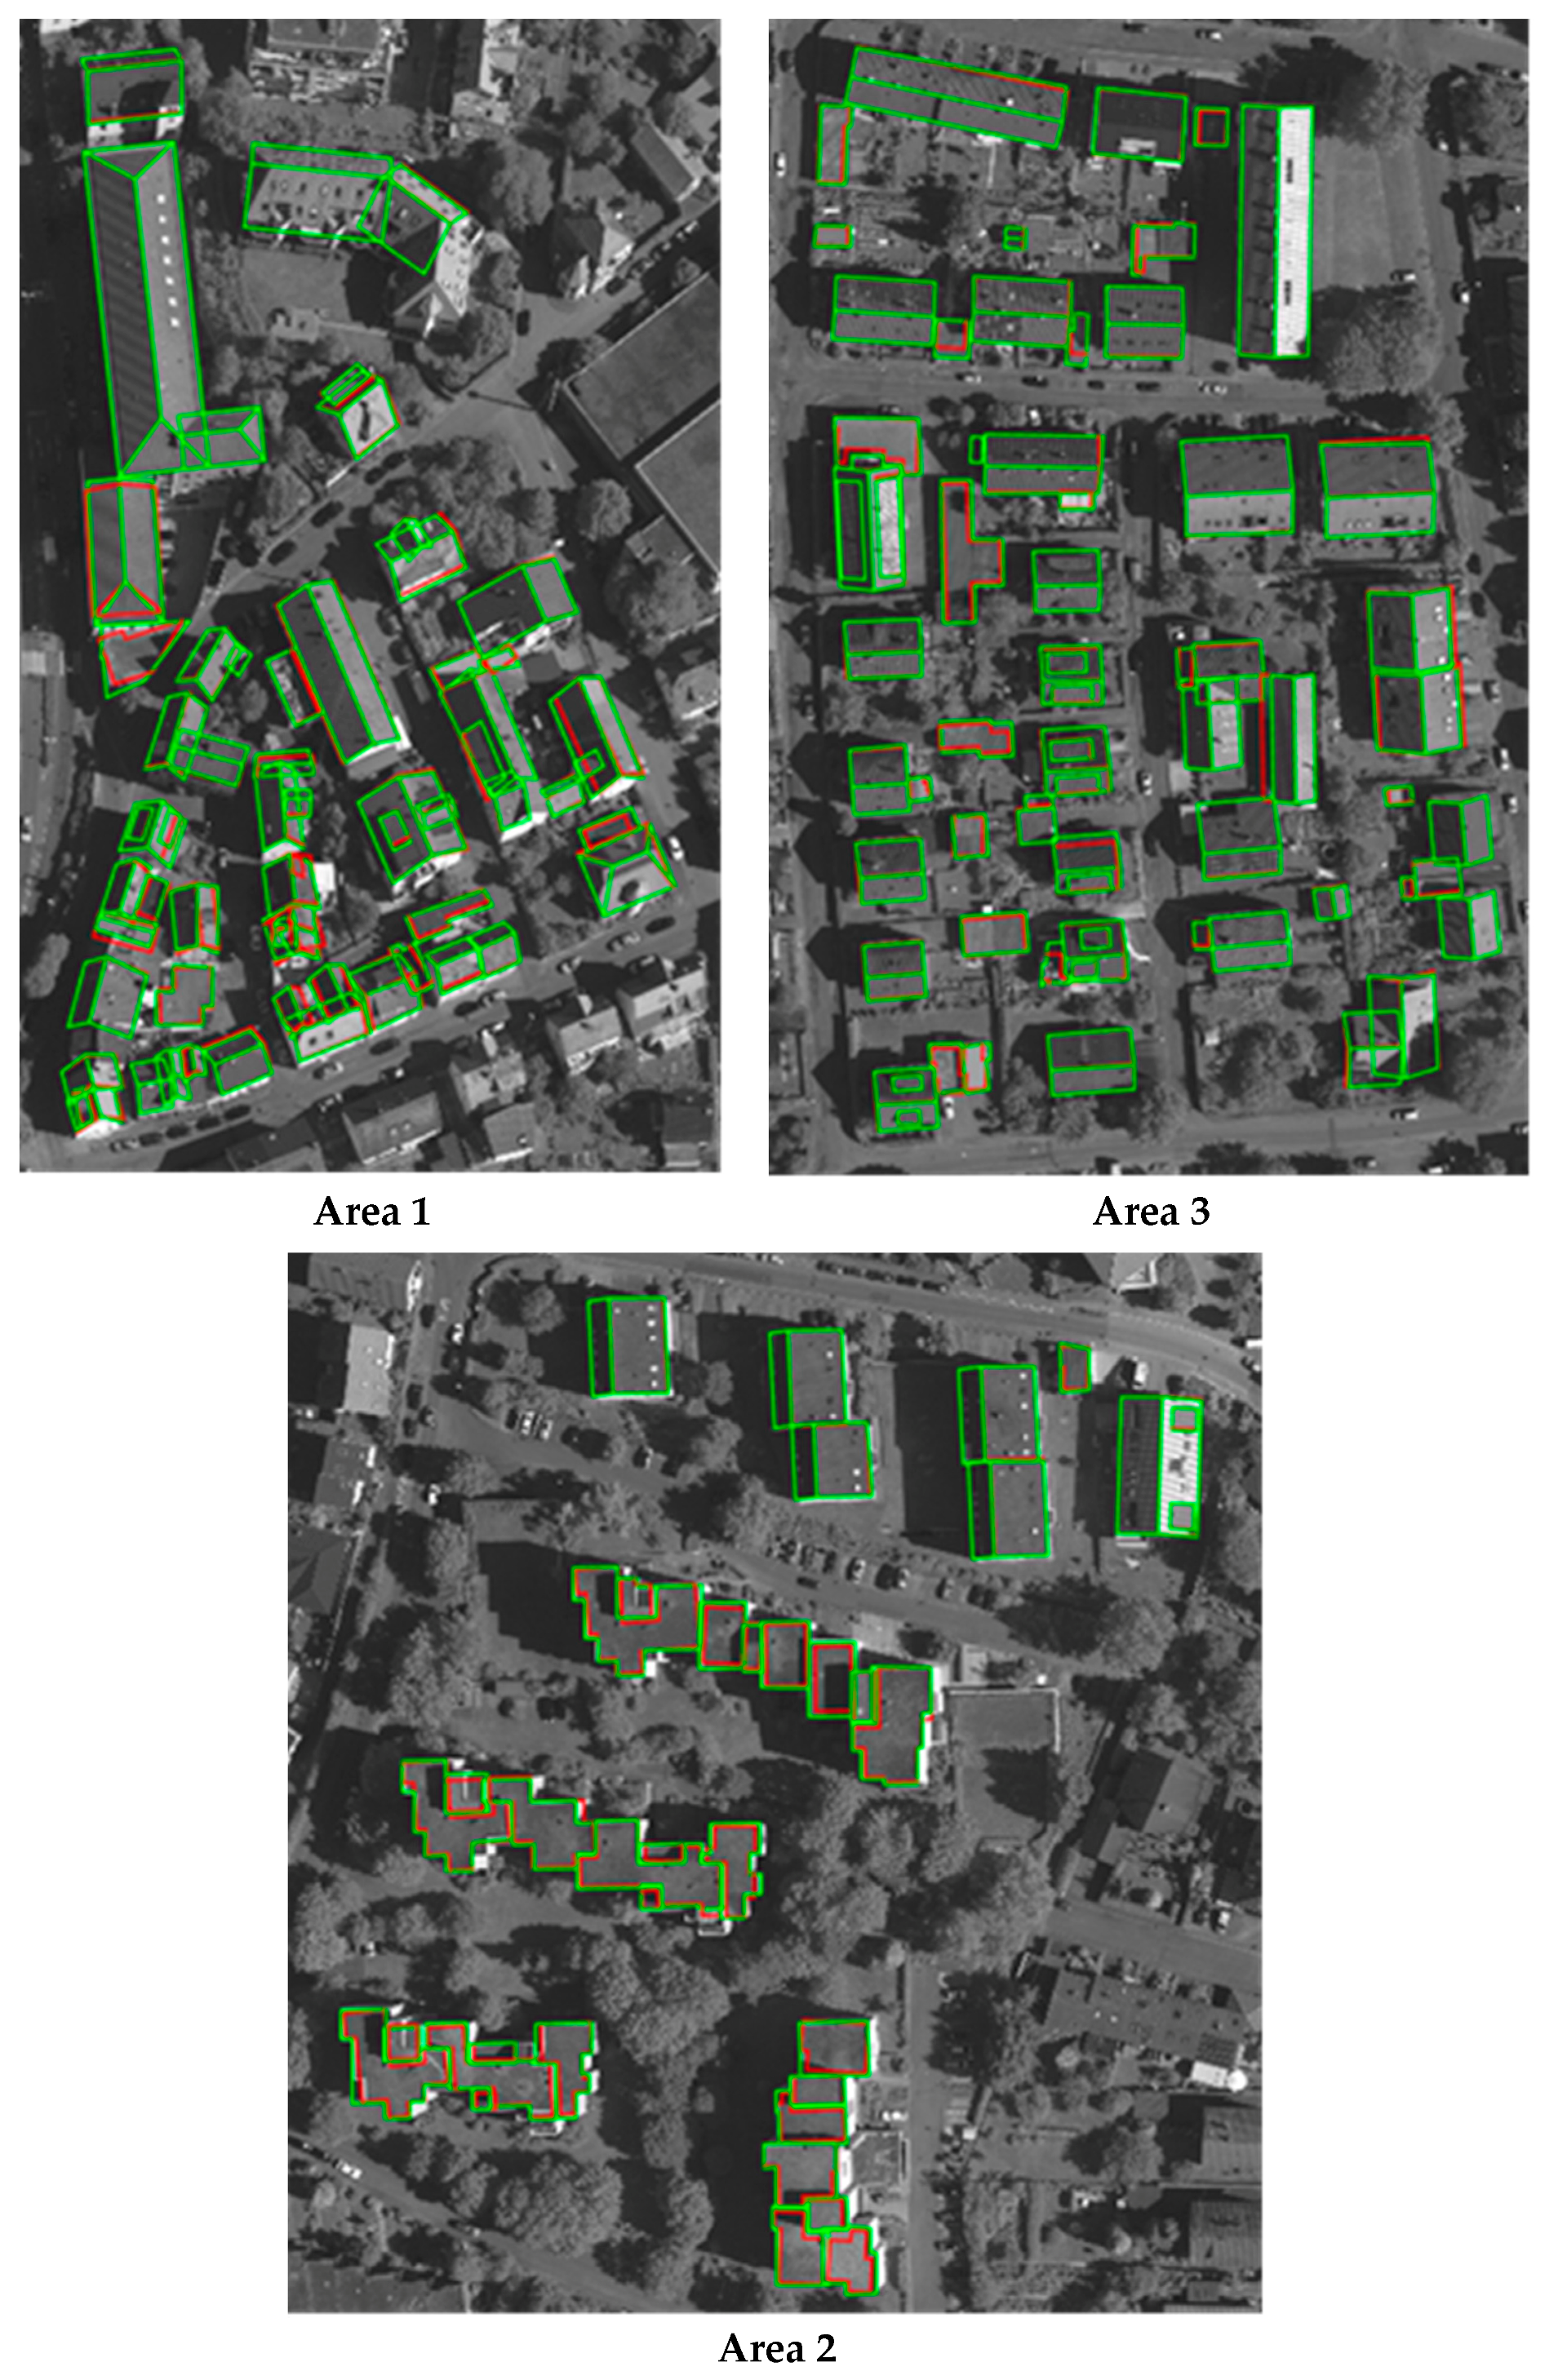
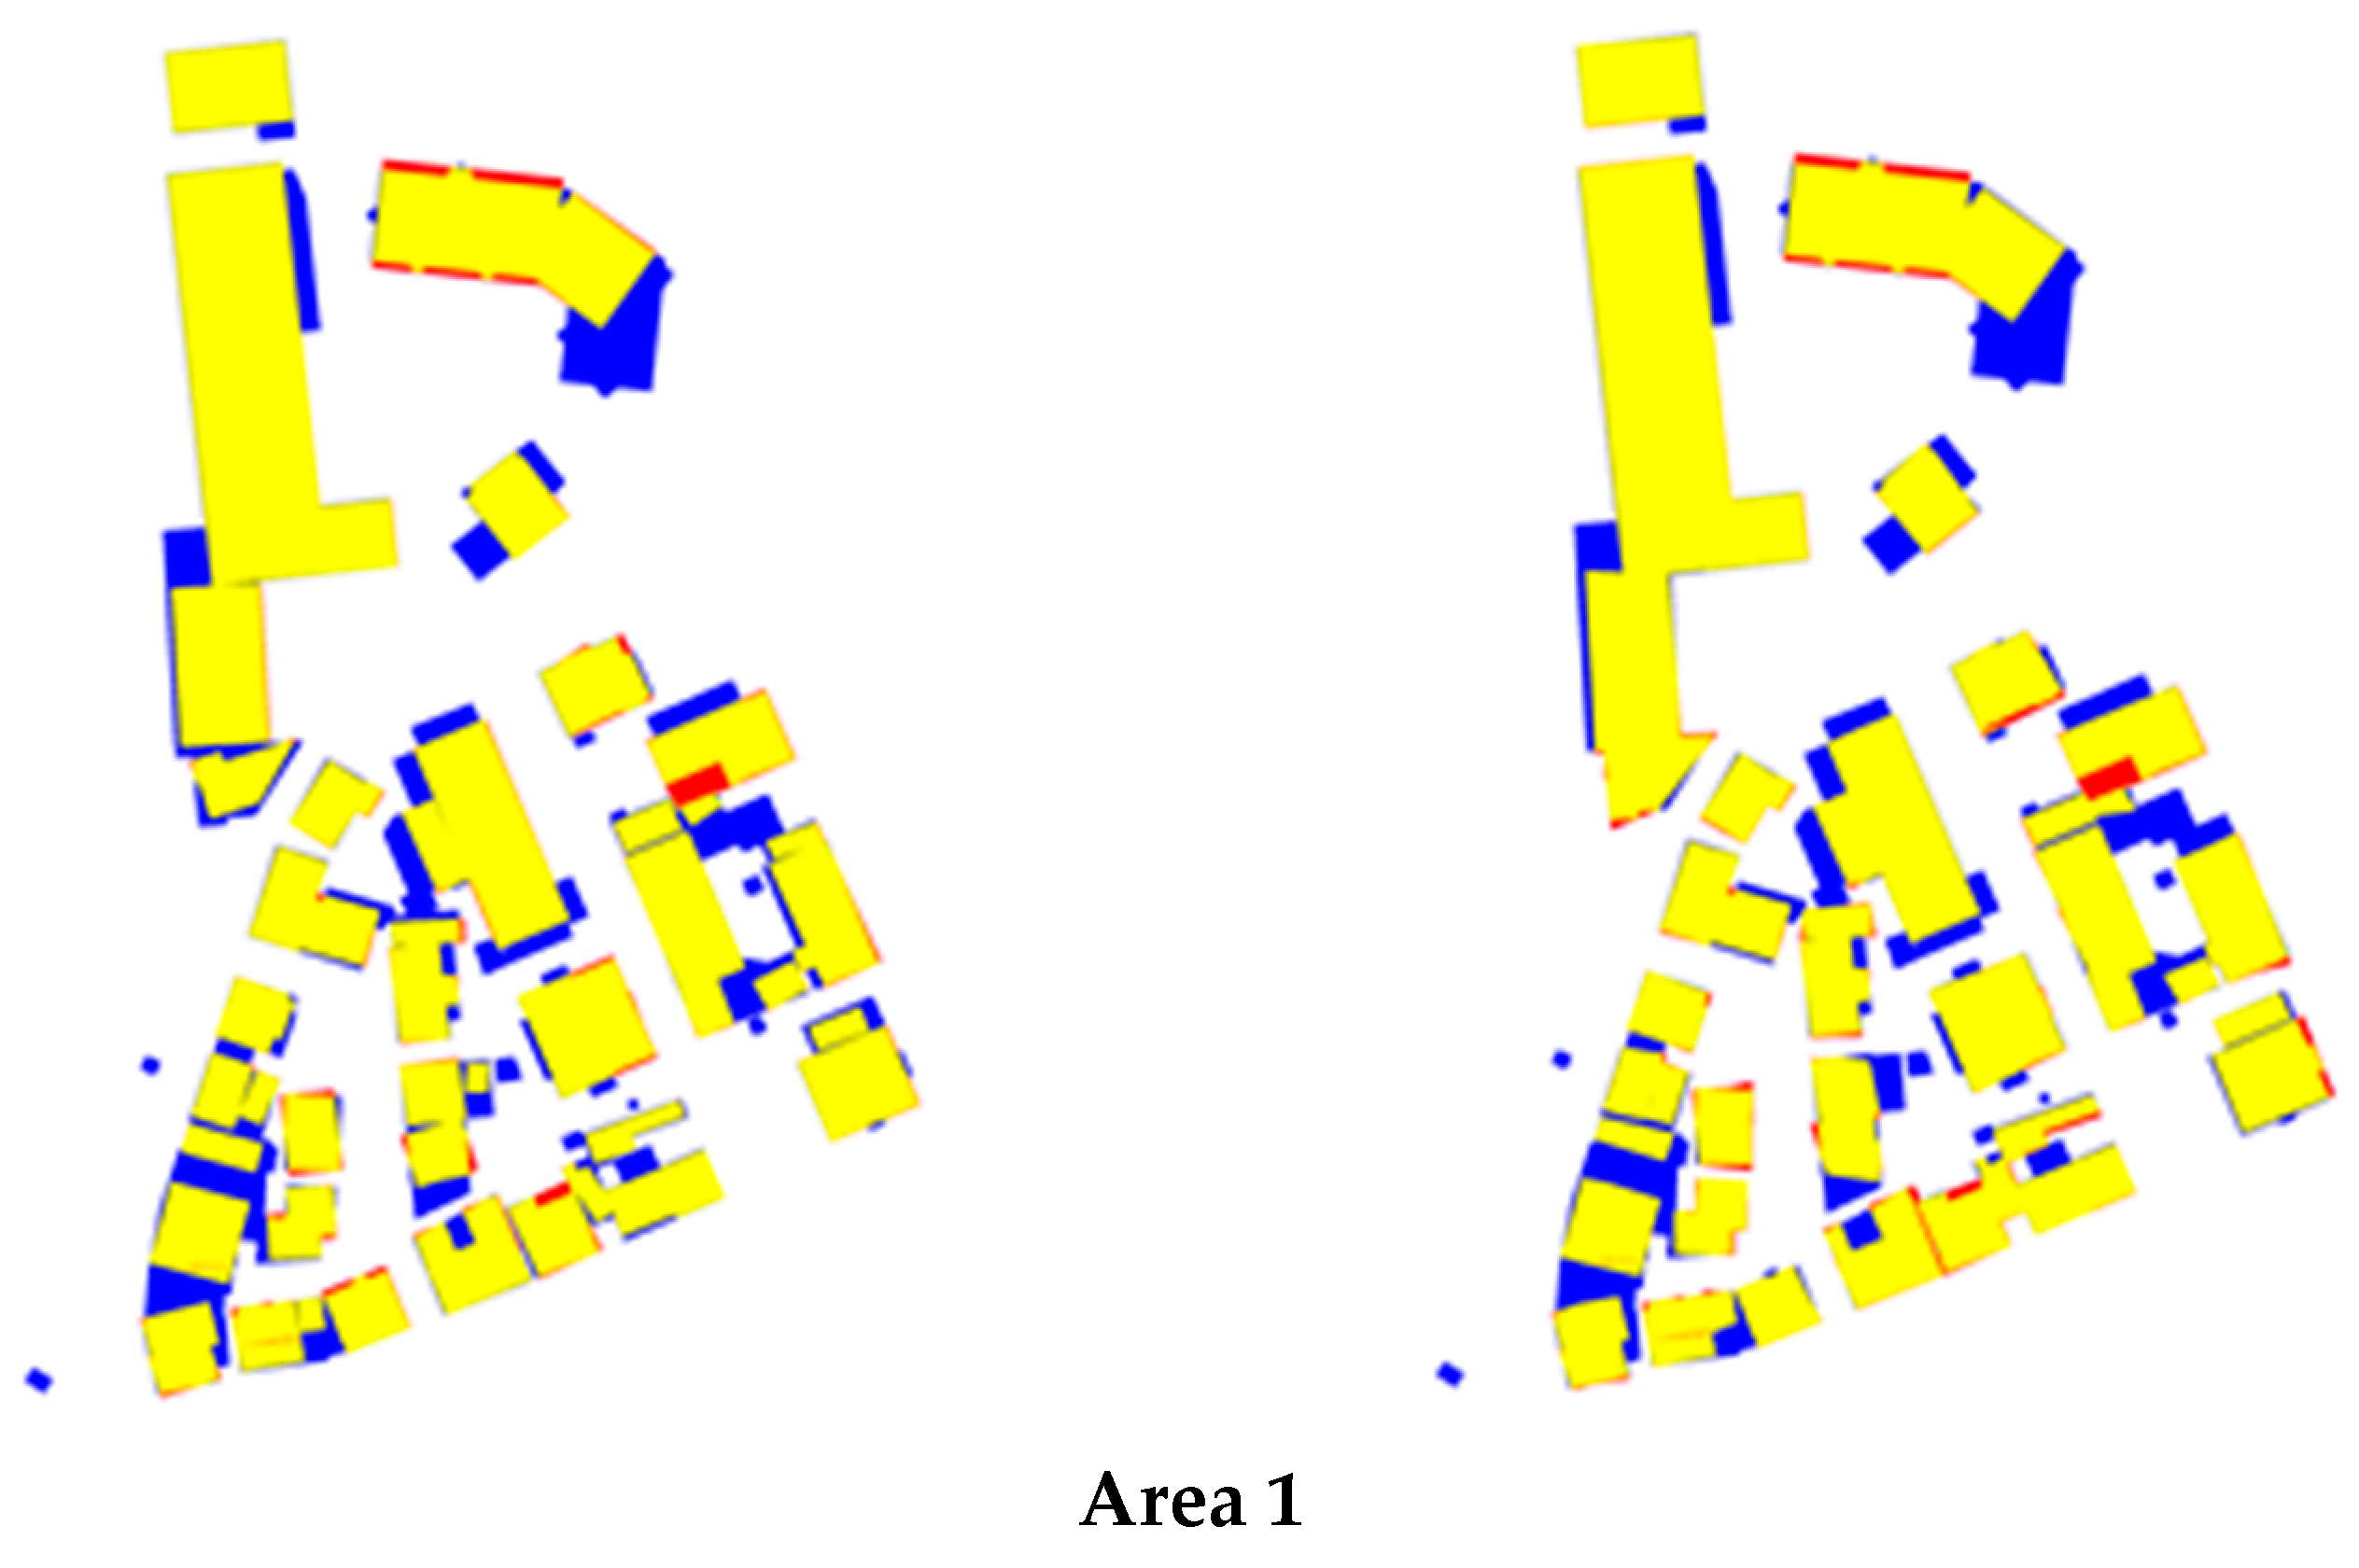
An overview on the results of our data processing is shown in
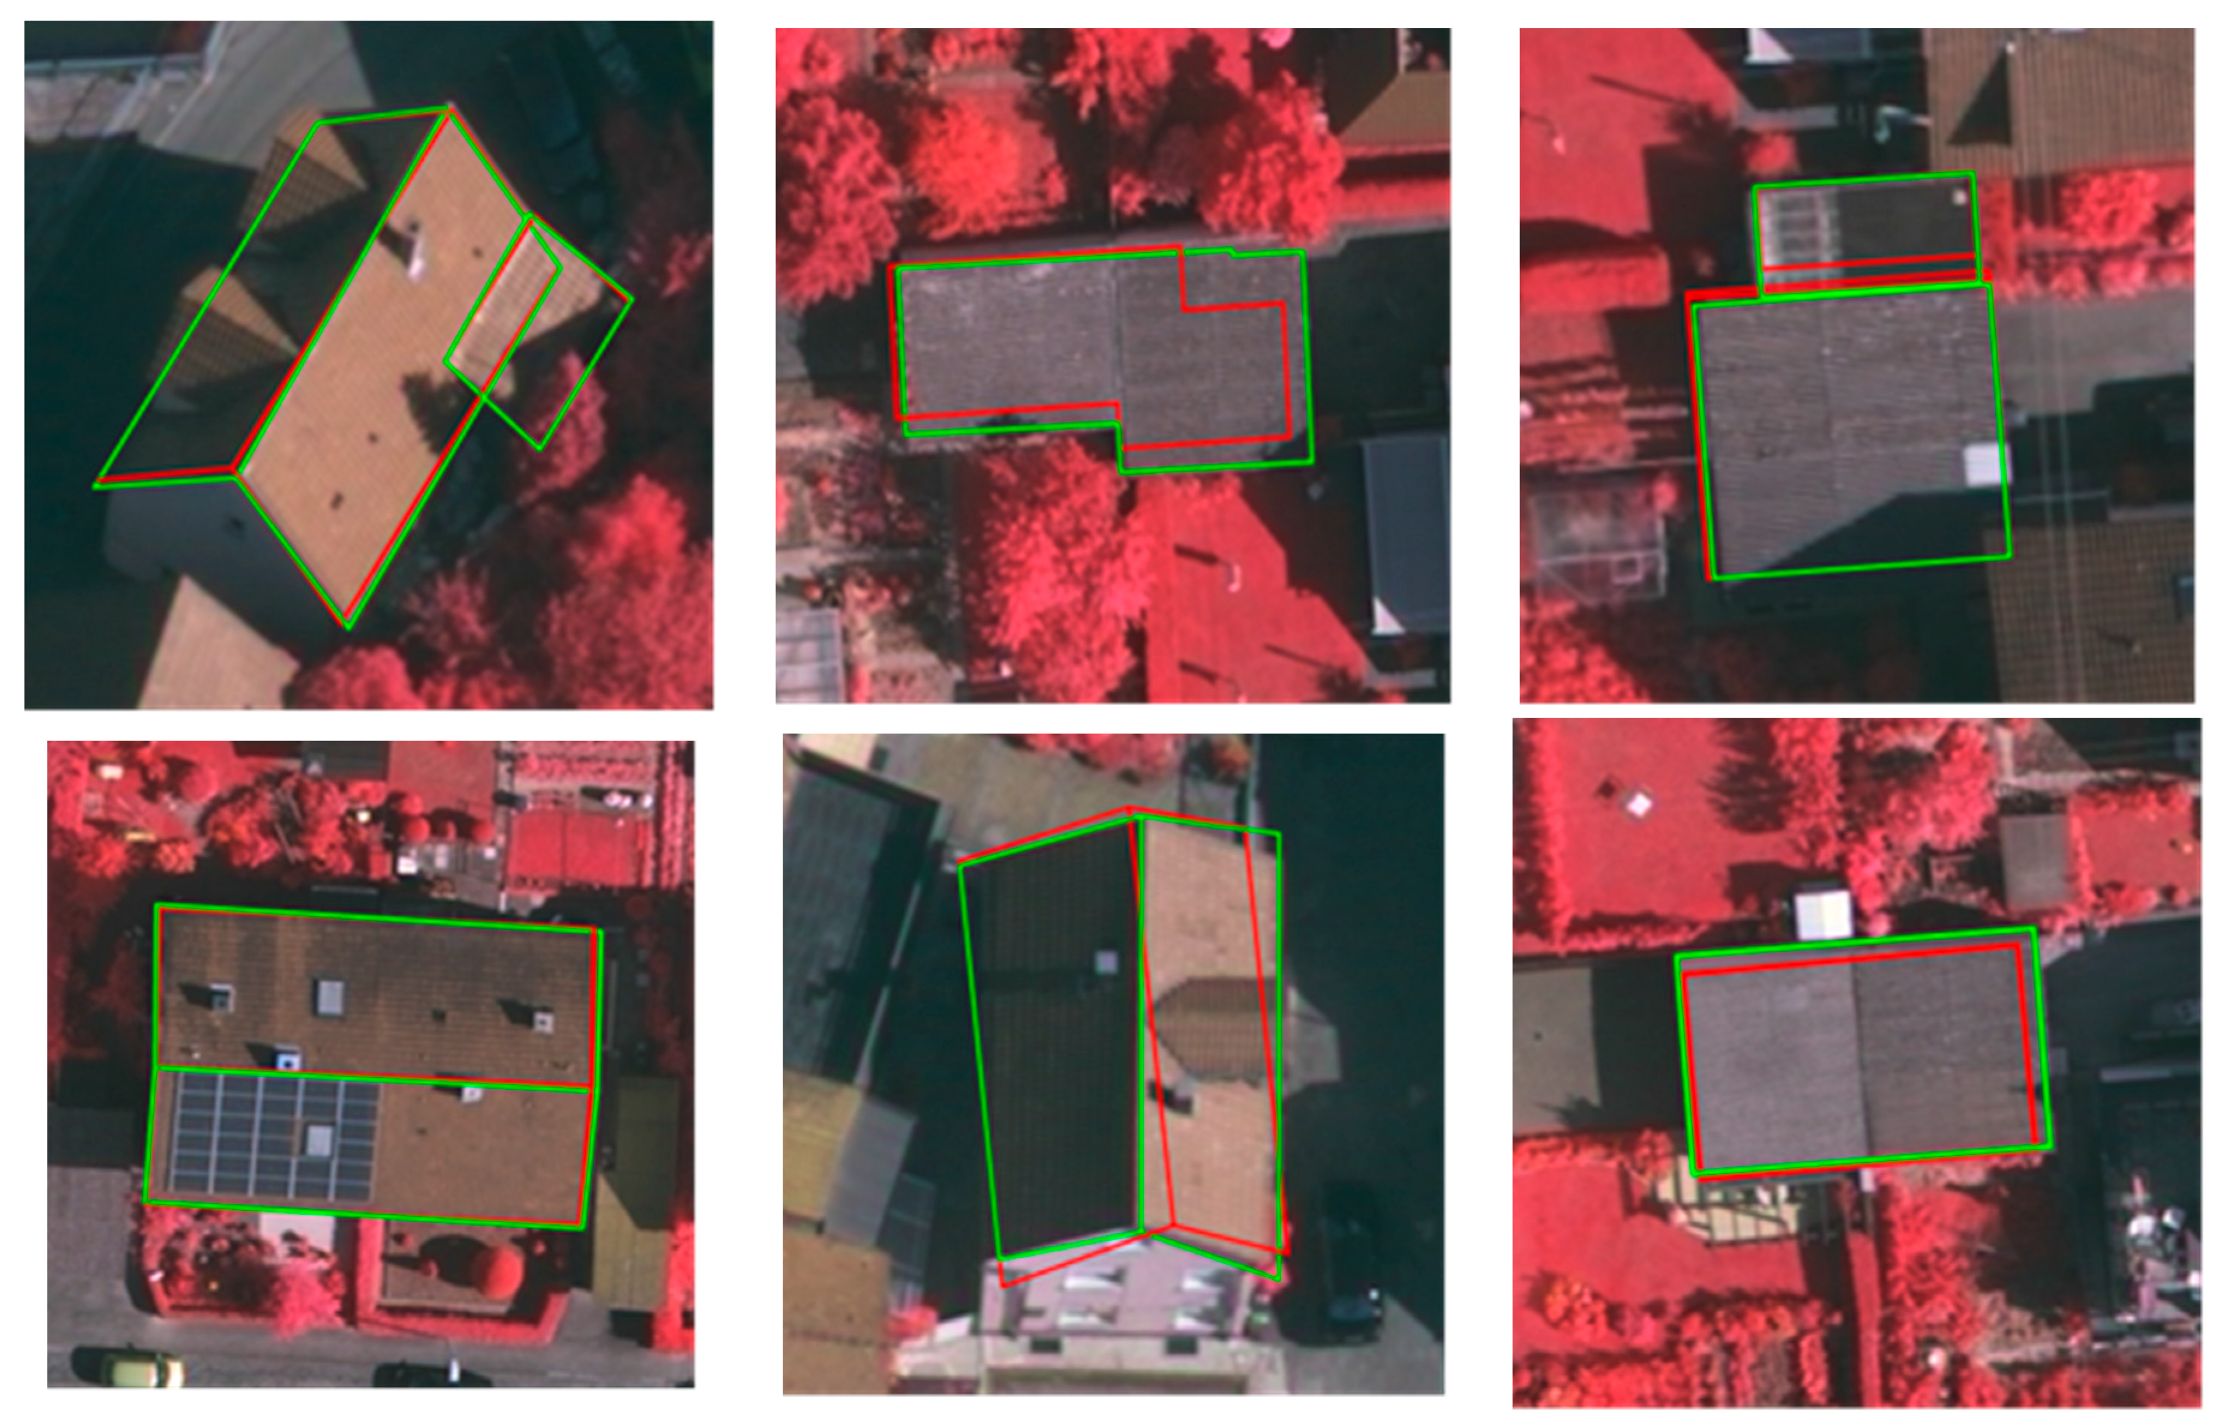
Figure 5. The two sets of 3D building models, reconstructed solely from ALS data and enhanced by image analysis, are transformed into the image space and compared. Visual comparison of the refinement performance indicates that the correction impact is not distributed regularly. In many cases, no substantial edge shift is obtained. However, in some cases of large positional deviations, the applied refinement clearly compensates for reconstruction drawbacks in the ALS data. Some examples of significant changes are presented in
Figure 6. Buildings reconstructed from the ALS data were often slightly shrunken, which is mainly a consequence of the point spacing in the data set. Thus, in most cases, building models refined by image information are enlarged. If no outer line is detected in the image, the presented refinement procedure also allows for an edge shift into the inner direction. It is important to notice that the methodology underlying the refinement process only allows for a geometric correction of building corners. As the topology structure of the initial 3D models is preserved, we are not able to add new edges to the roof outlines.
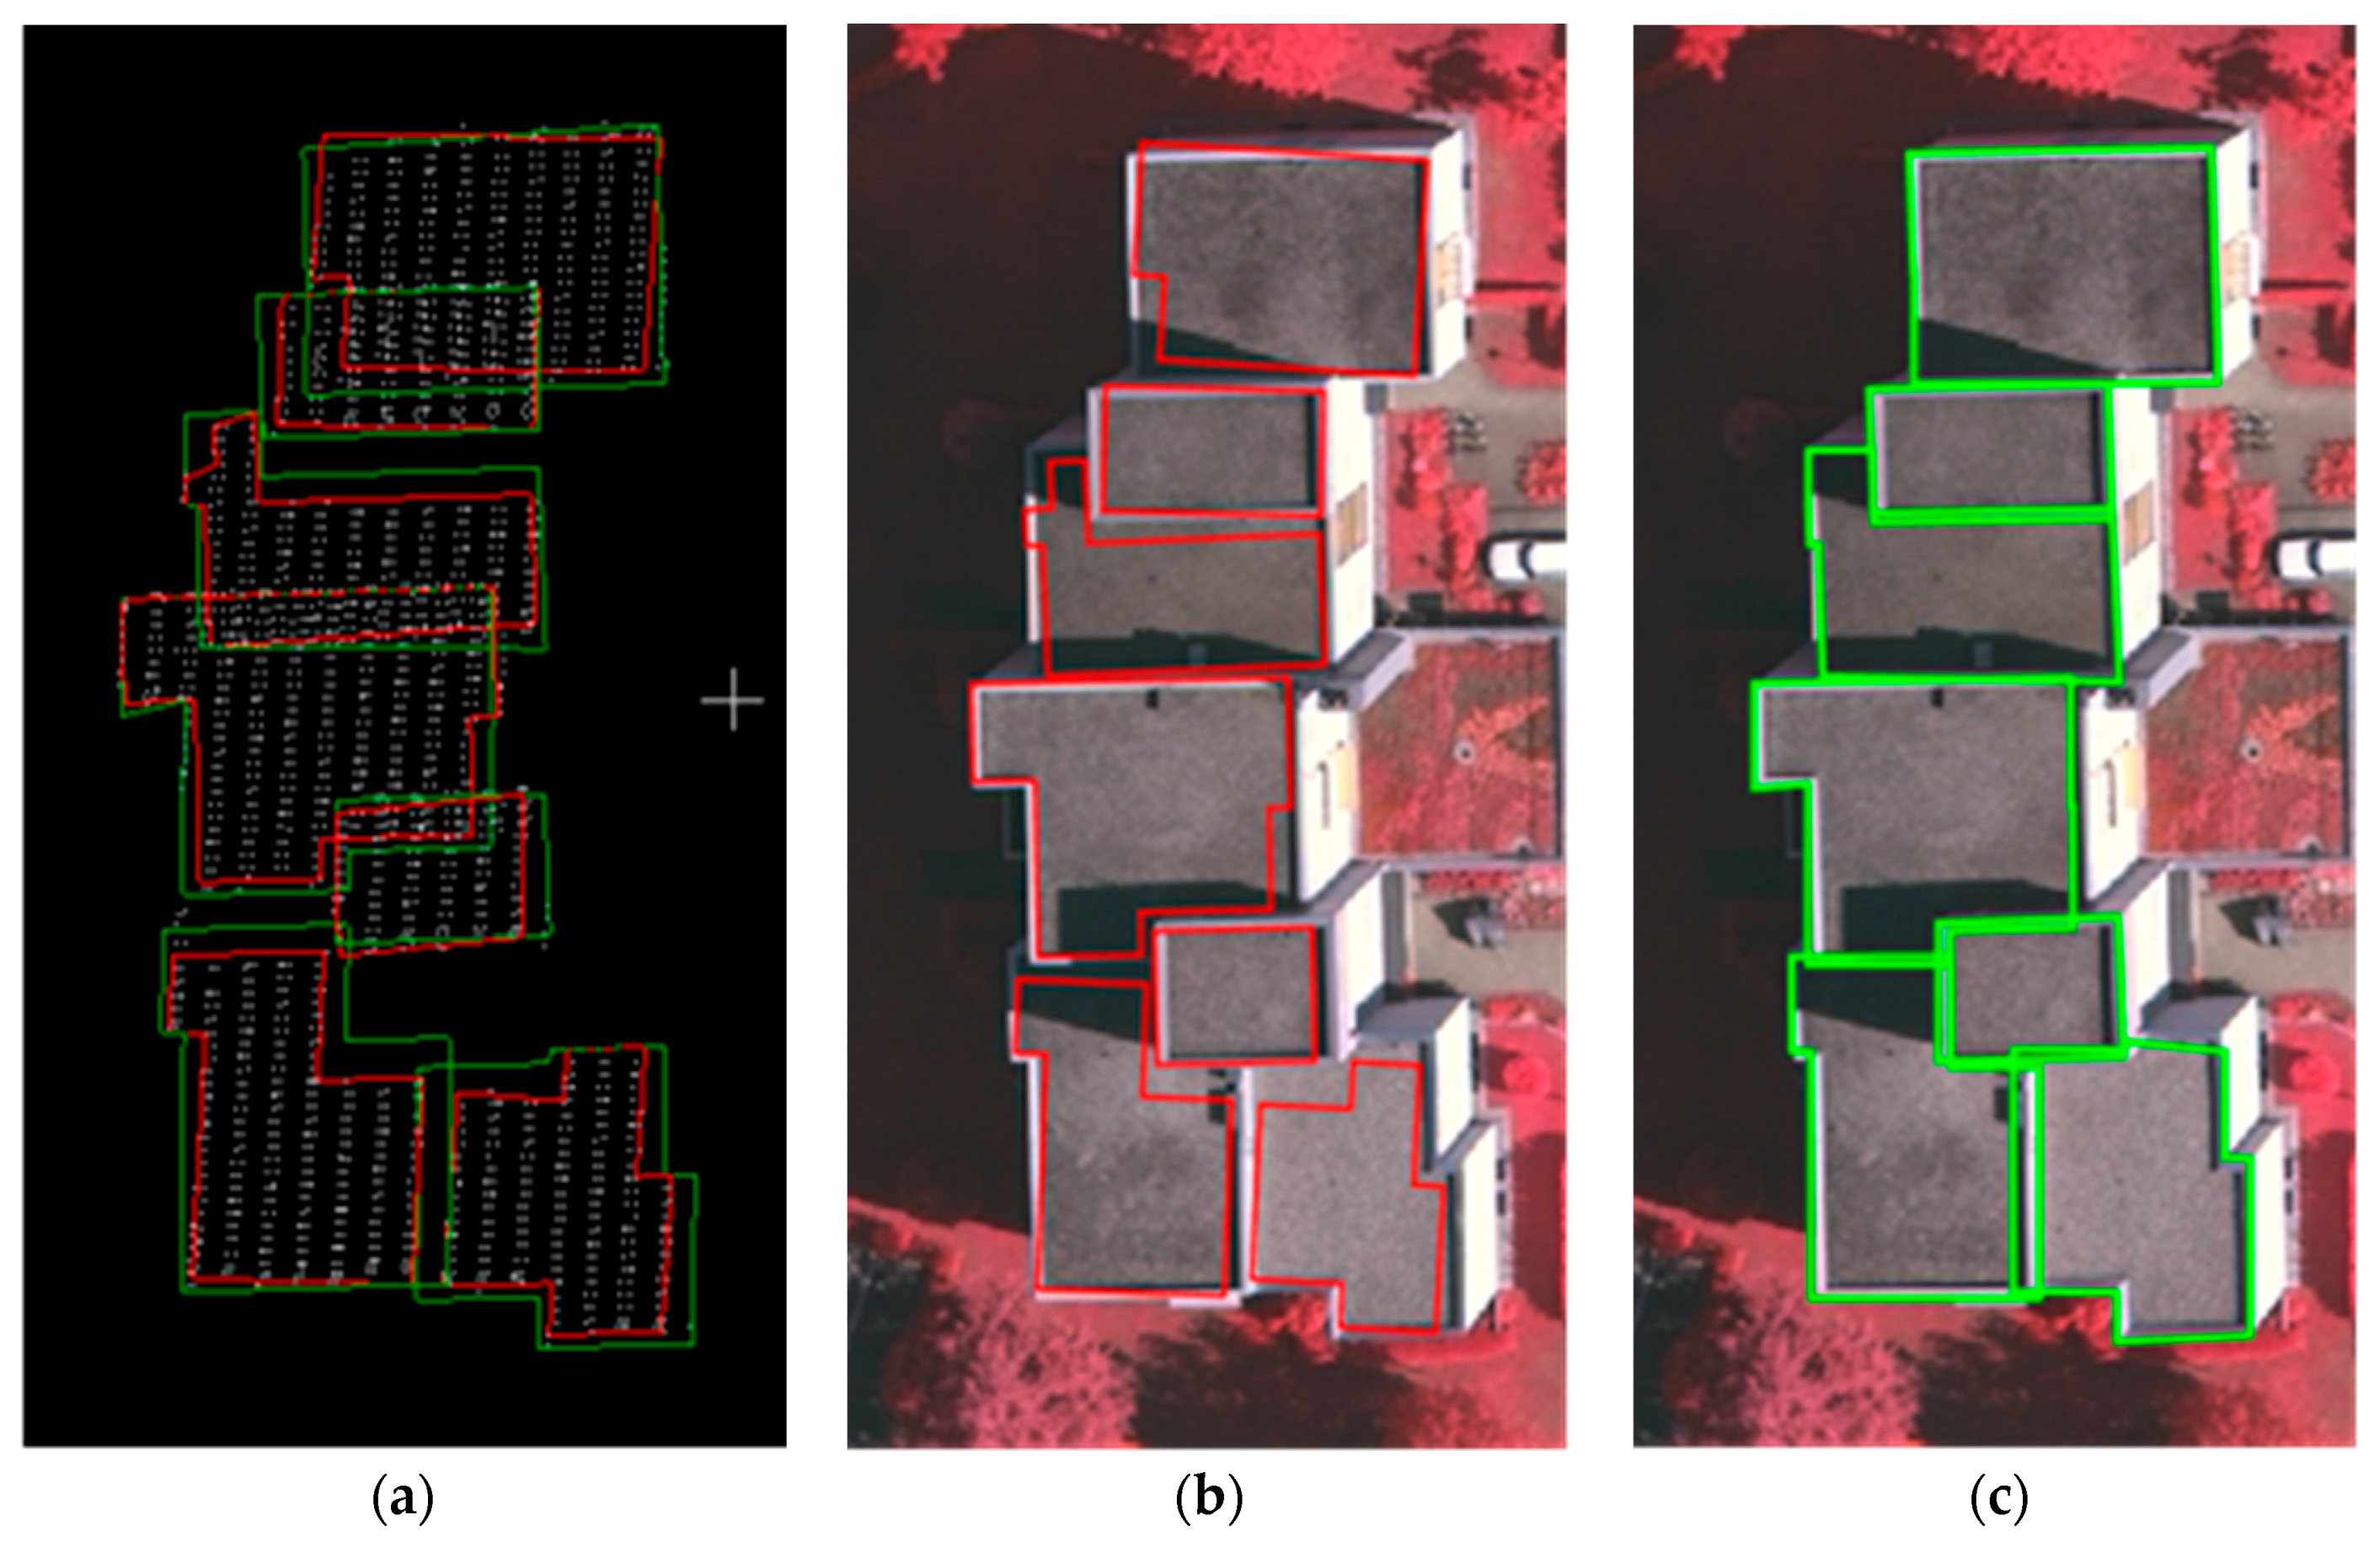
The most evident displacements of the refined edges are observed for flat roofs. Such edges are extracted as outlines of segments of ALS points belonging to the roof plane. Therefore, opposite to intersection lines in the case of intersecting tilted roof planes, they cannot benefit from the high vertical accuracy of ALS, which is implicitly stored in the extracted 3D planes. Moreover, in the case of height differences within a multi-flat roof, some parts of roof planes may be occluded by others. Due to the resolution issues and occlusion effects, it is challenging to precisely define a step edge only from a 3D point cloud [
33]. A typical case is illustrated in
Figure 7. As a result of data gaps, roof outlines reconstructed from LiDAR points are falsely shifted. The aerial image information enables compensating for this effect. By fusing line segments derived from photographs, we can refine input edges and relocate them. Since photogrammetric flights are usually conducted with overlapping images taken under a different perspective, we intend to extend the refinement process to the use of multiple images, thus increasing an amount of input information and their reliability. Moreover, the enhancement of the presented refinement procedure by the use of oblique images that allow for providing more detail information about building walls captured from different views (as for example indicated in [
29]) might further help with avoiding reconstruction deficits related to occlusions.
3.2. Analysis of the Applied Correction
To quantify the amount of correction added by the refinement procedure, we calculate measures describing the planar displacements of roof edges. The displacement is described by a perpendicular distance between end-points of a refined edge and the corresponding initial line. In order to get a broader view on the influence of the refinement process, edges are analyzed with respect to their types. The results of the quantitative analysis are collected in
Table 1 and illustrated in
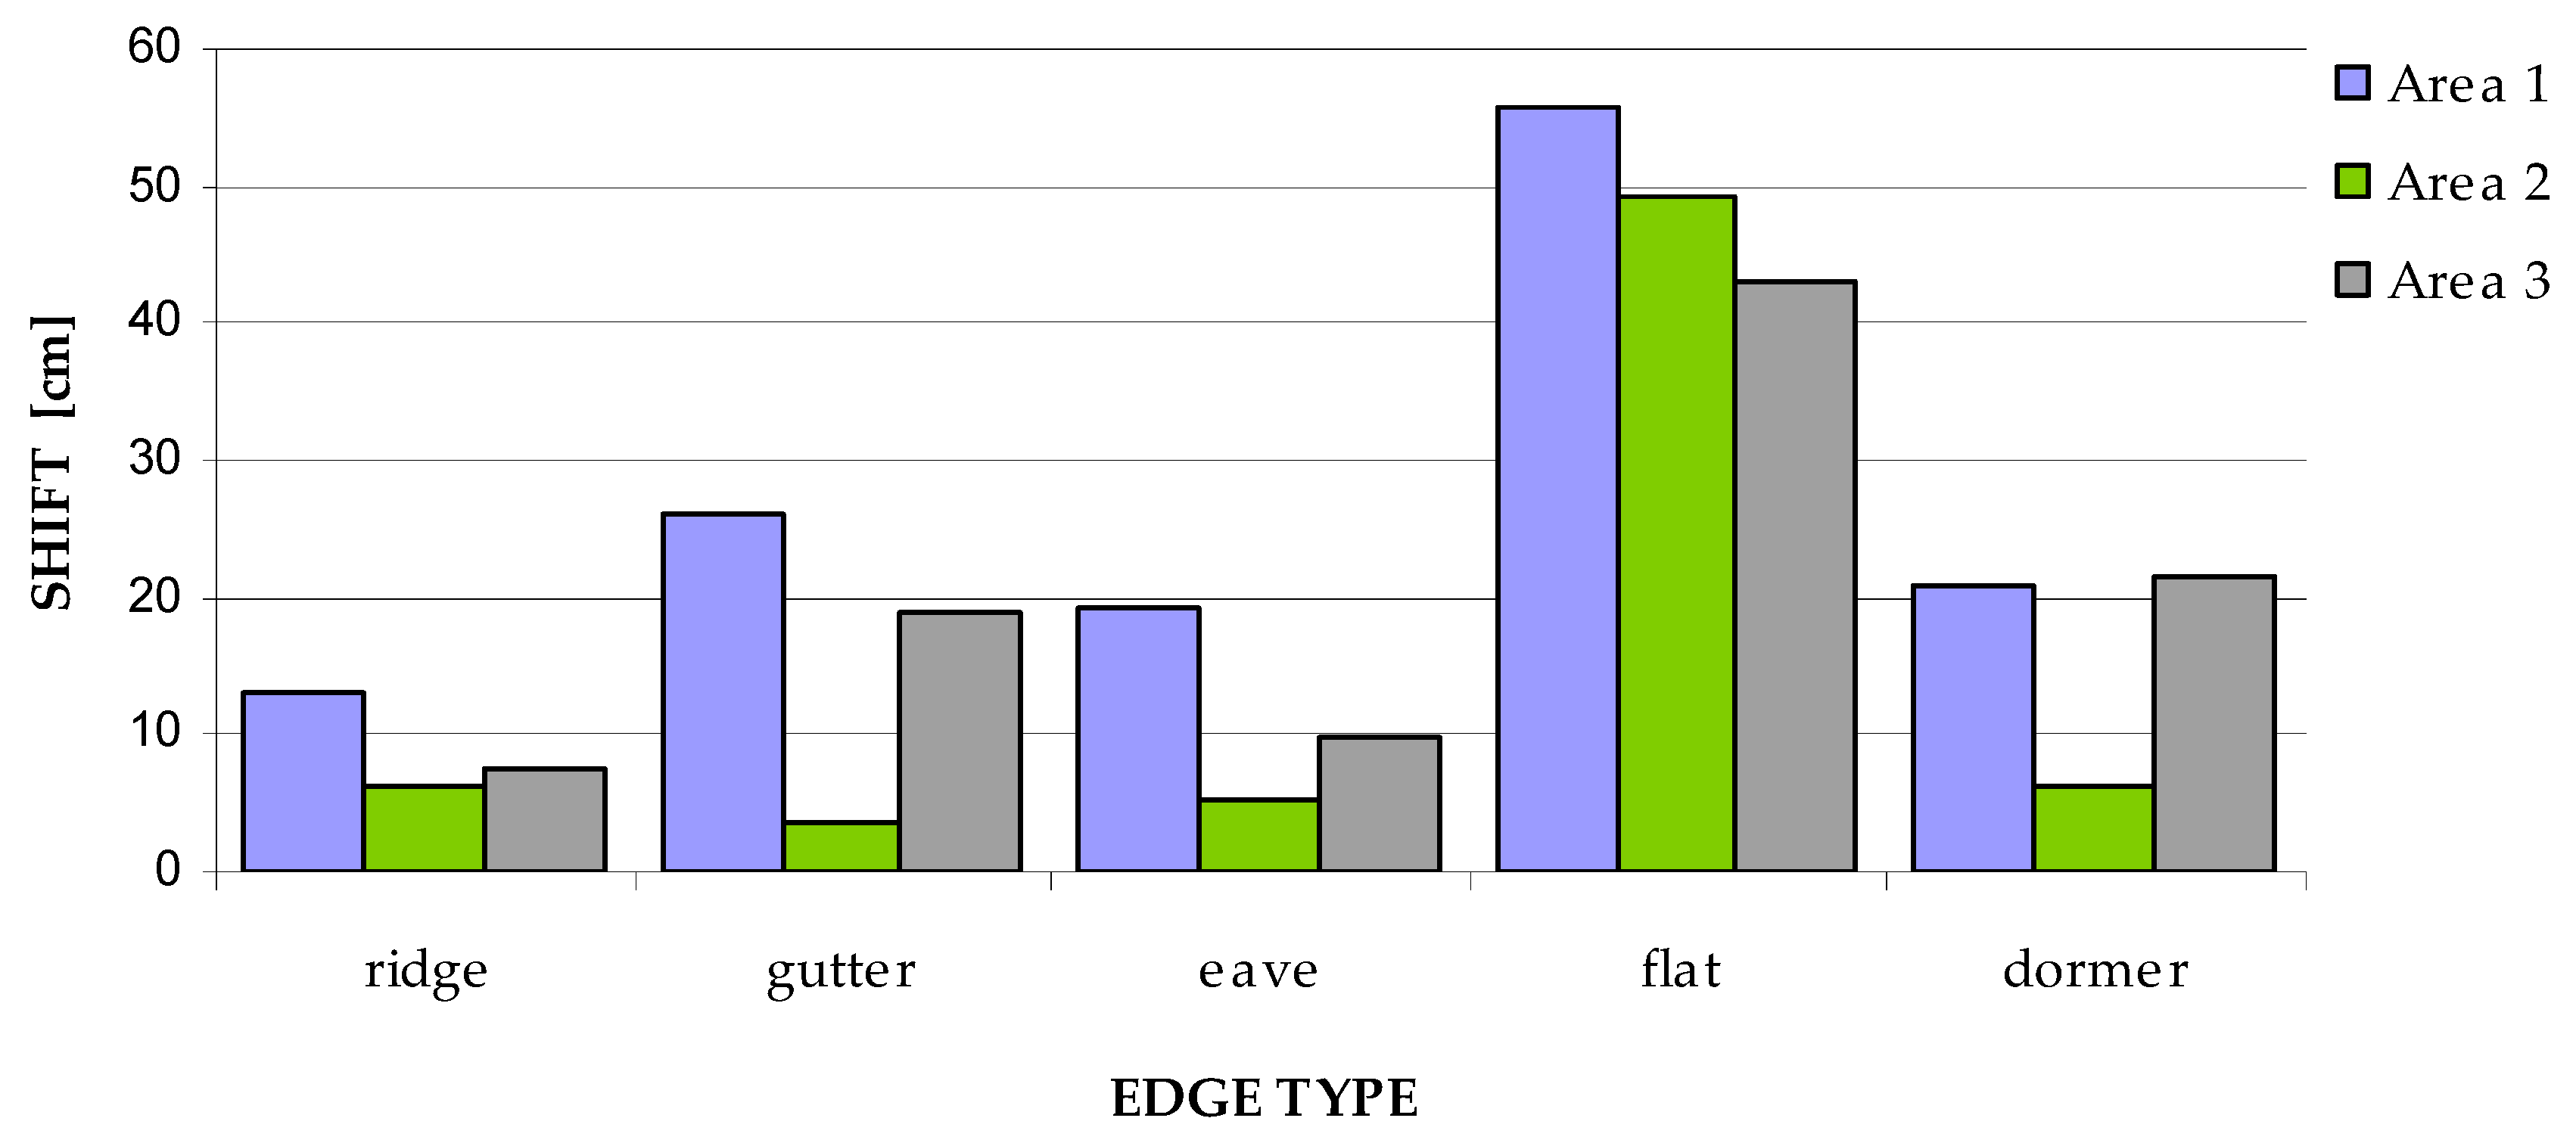
Figure 8.
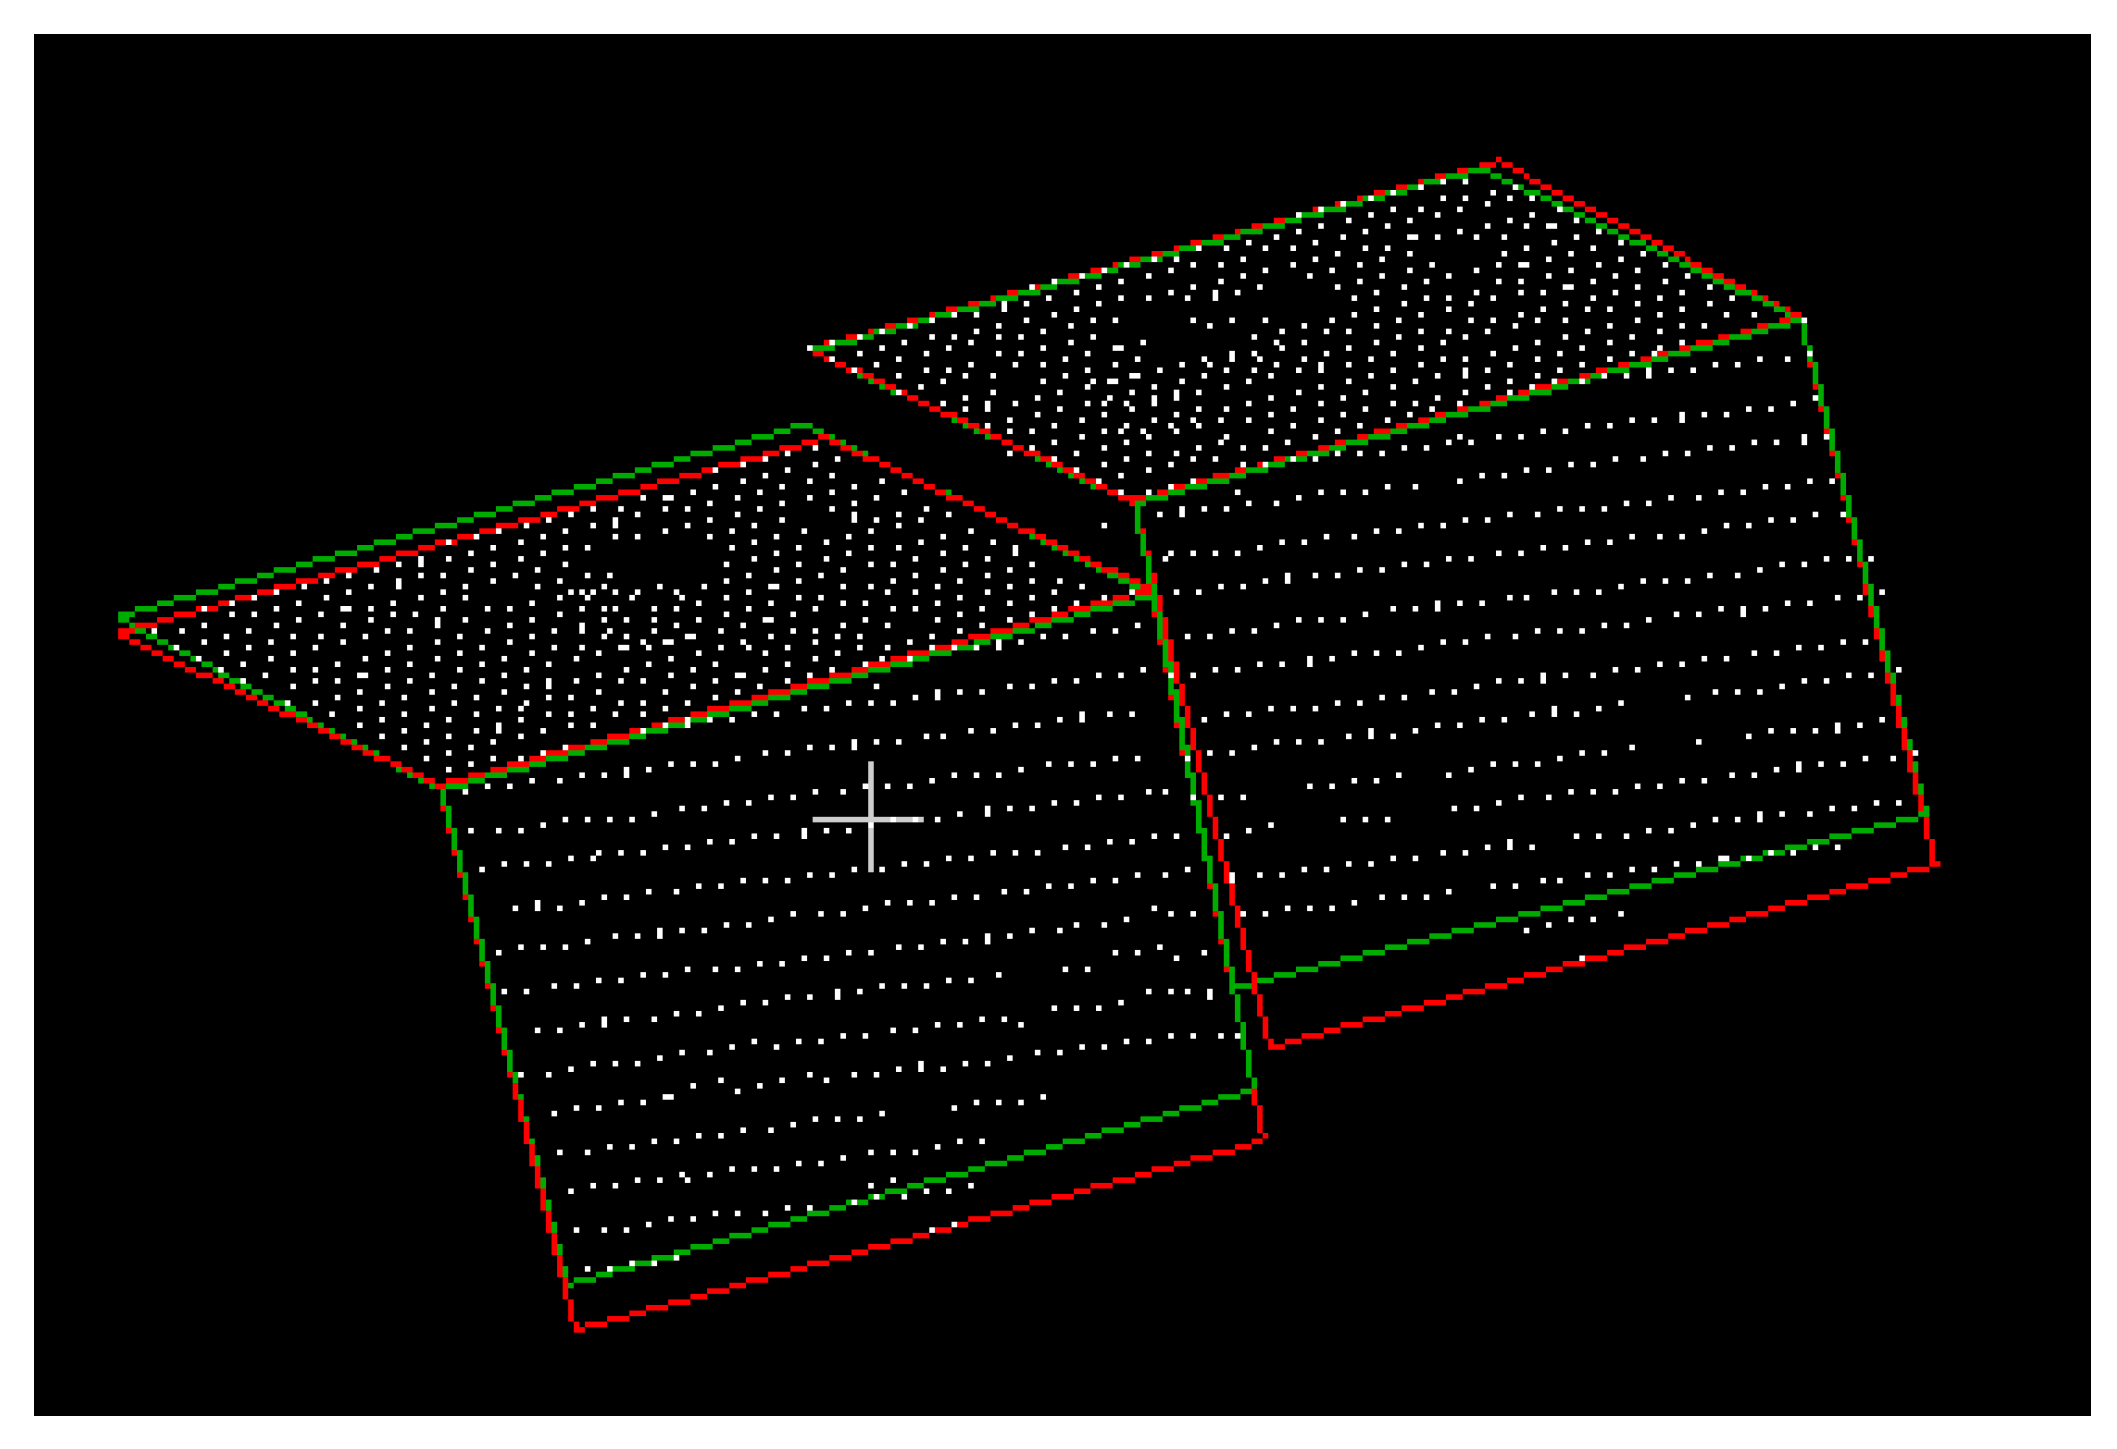
The largest displacements (from 43 to 56 cm, depending on the test site) are observed for the outlines of flat roofs in Area 2, which are sensitive to ALS point spacing and the alignment of scan lines with respect to the building azimuth. The statistics for Area 1 and Area 3 show that the displacement of gutters (26 cm and 19 cm) is significantly larger than the displacement of eave lines (19 cm and 10 cm). Gutter lines extracted from ALS are associated with the outermost LiDAR points. If a small part of a roof plane is protruding (e.g., in case of a bay-window), then the whole edge will be falsely shifted. By the refinement process, the edges are relocated to the correct position (cf.,
Figure 9).
As expected, the smallest average displacement after applied refinement is observed for ridge lines, which are determined from ALS data by 3D plane intersection. For Area 2 and Area 3, the values are equal to 6 cm and 8 cm, respectively. The larger displacement is noted for Area 1 (13 cm). Due to the complex building shapes present in this data set, a few errors occurred in 3D point cloud segmentation and led to an imprecise detection of 3D planes. Consequently, the accuracy of ridge lines computed as the intersection of such planes was deteriorated. These defects could be corrected by the line segments extracted from aerial image.
3.3. Accuracy Assessment
Quality assessment of the reconstructed 3D models was conducted as part of the ISPRS Test Project on Urban Classification and 3D Building Reconstruction. The benchmark allows for the evaluation of the modeling results according to unified criteria [
34]. The two sets of the modeling results (before and after image-based correction) were verified independently with respect to the reference data. The accuracy of the reference roof models is about 10 cm in planimetry and height.
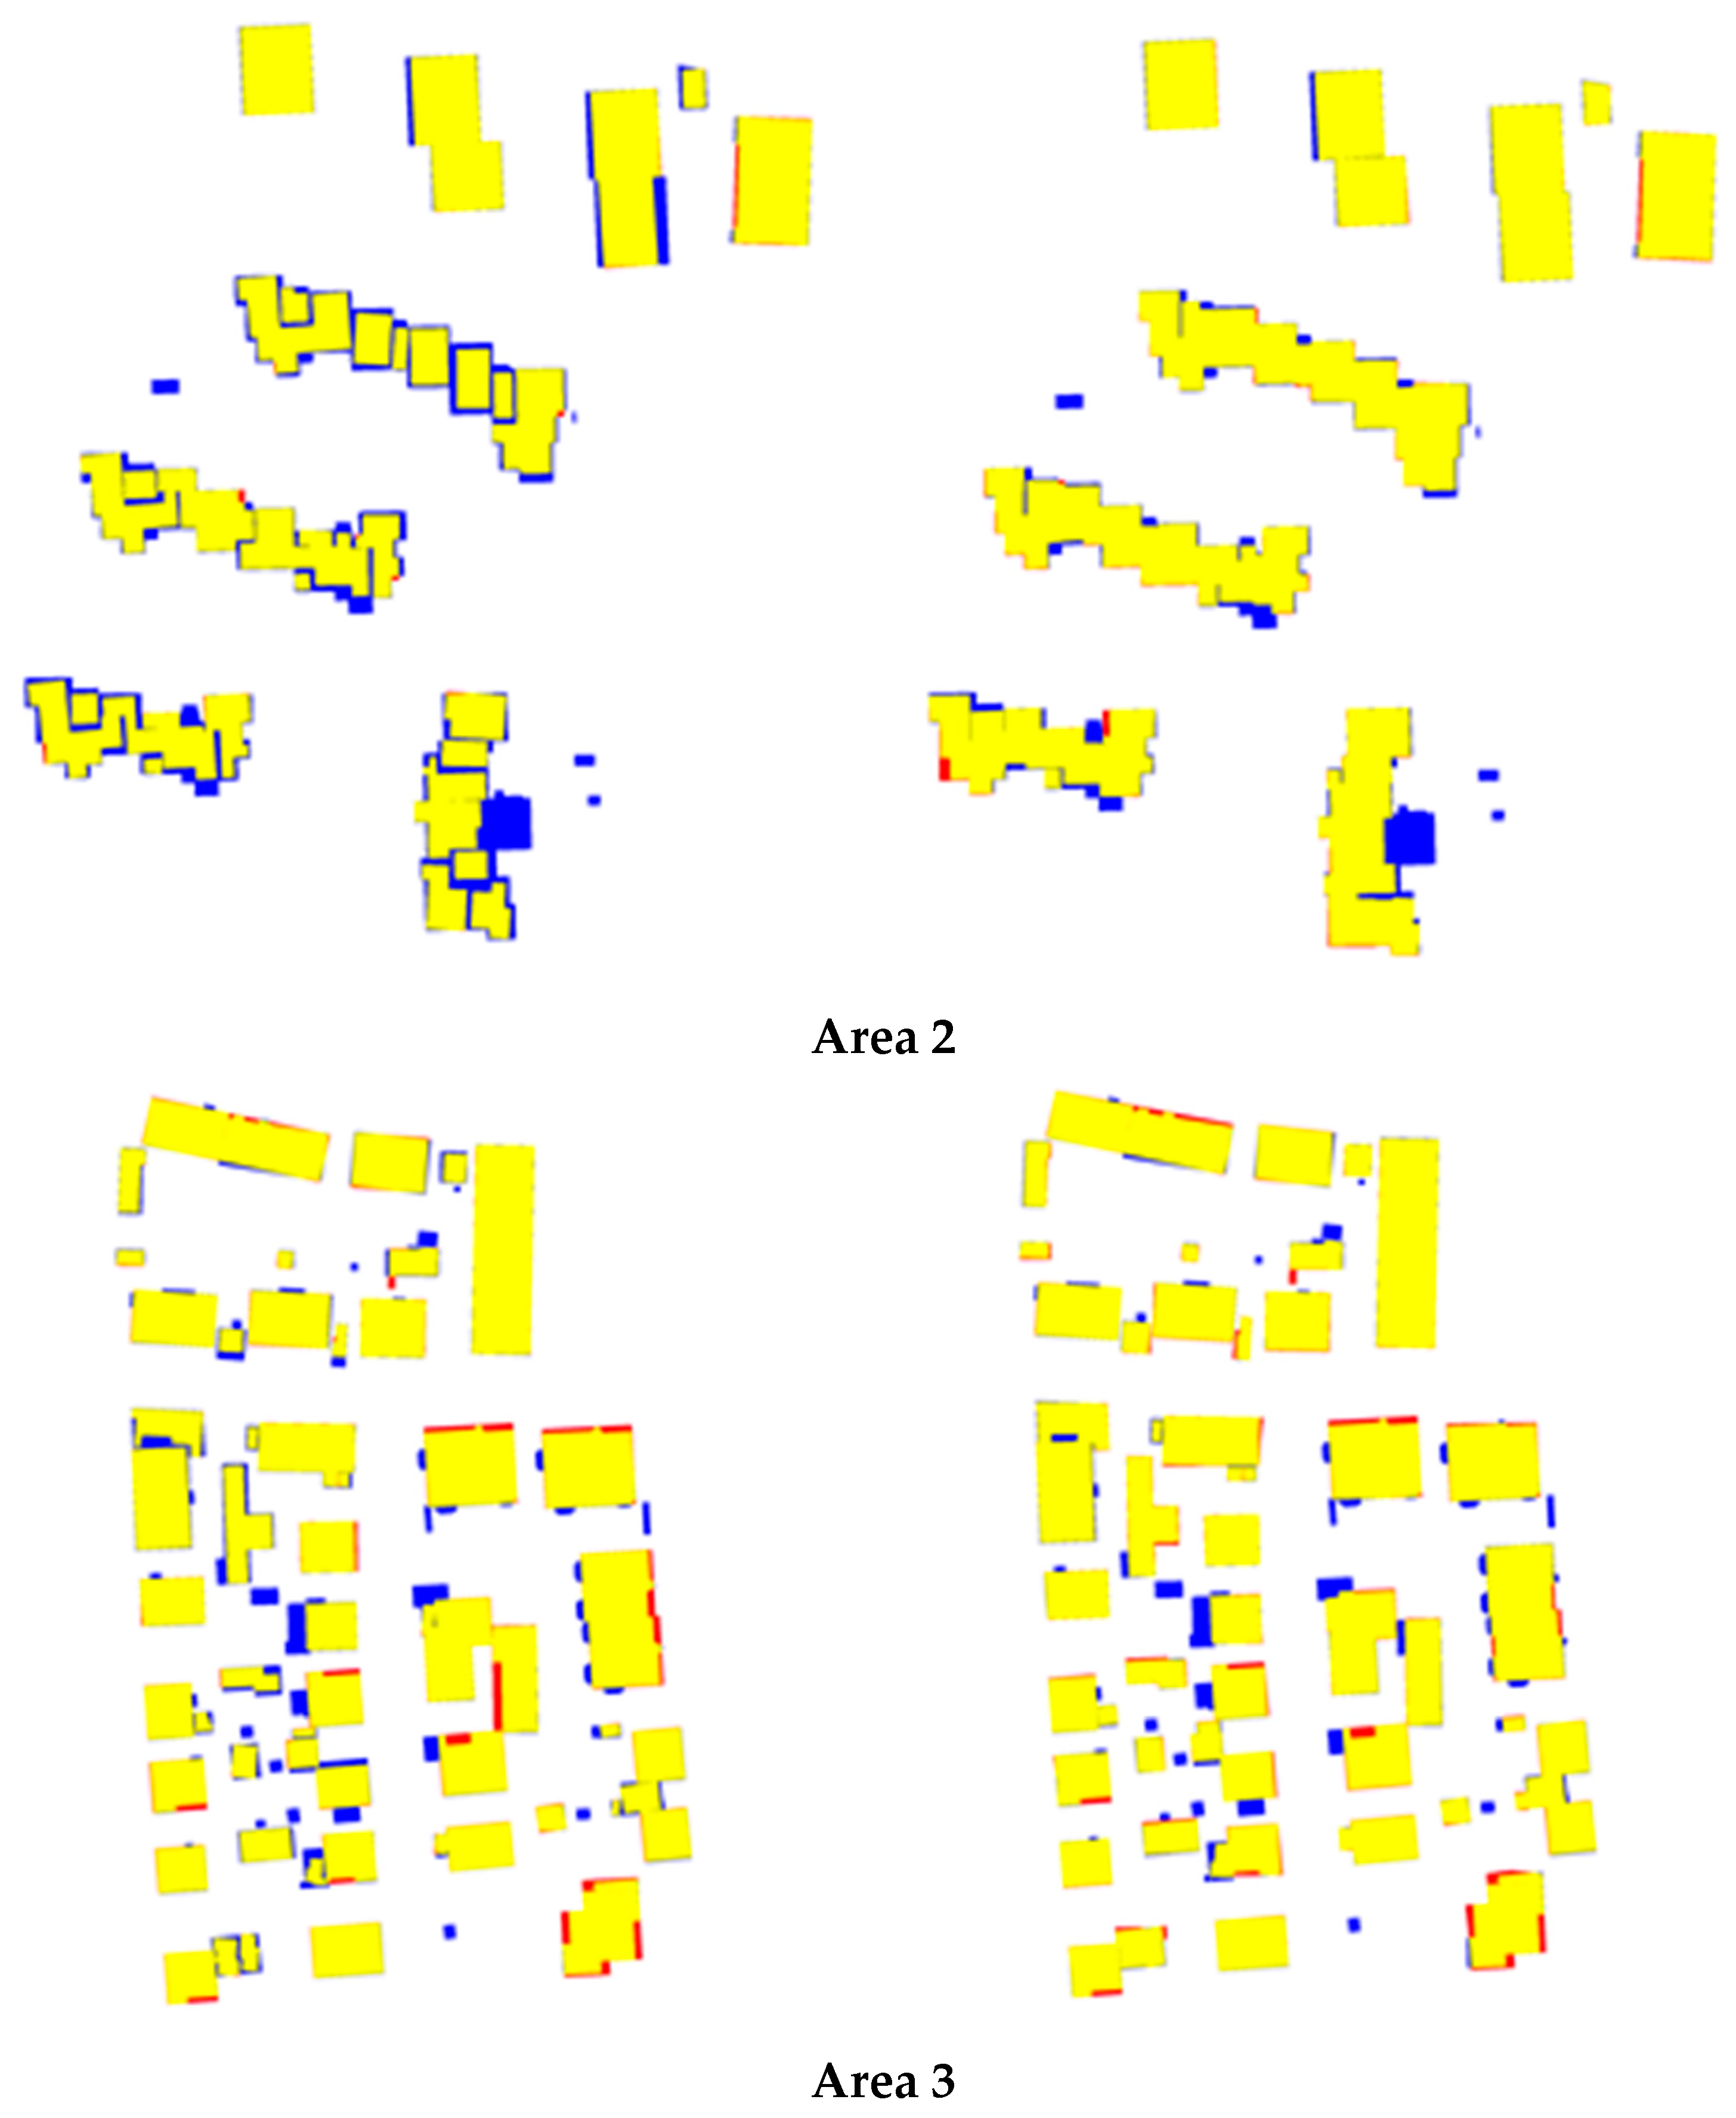
Figure 10 presents a visual comparison of the qualitative assessment of building roofs extracted from ALS data and those enhanced by image analysis. Differences in the accuracy assessment between reconstruction results before and after refinement are illustrated in
Figure 11. The statistics on the corresponding qualitative analysis are collected in
Table 2. The values contain the effects of some gross errors (with reference to
Figure 10), which may dilute the quantification of the gain in precision obtained by integrating the image information.
The geometrical errors in planimetry is evaluated by the RMS errors of the planimetric distances of the reference roof plane boundary points to their nearest neighbours (within the radius of 3 m) on the corresponding extracted roof plane boundaries [
1]. However, the two nearest neighbors from these two data sets do not necessarily represent the same vertex of a plane. Especially in the case of large outliers or missing small superstructures on roofs, reference points can be falsely matched. As shown in
Table 2, the average RMS error calculated with respect to the extracted boundaries is reduced by 5 cm, 17 cm and 2 cm, respectively, for each test site. Since Area 1 and Area 3 include complex buildings with small planes undetected in ALS and missing in the input models, the presented statistic values might be biased by the effect mentioned above.
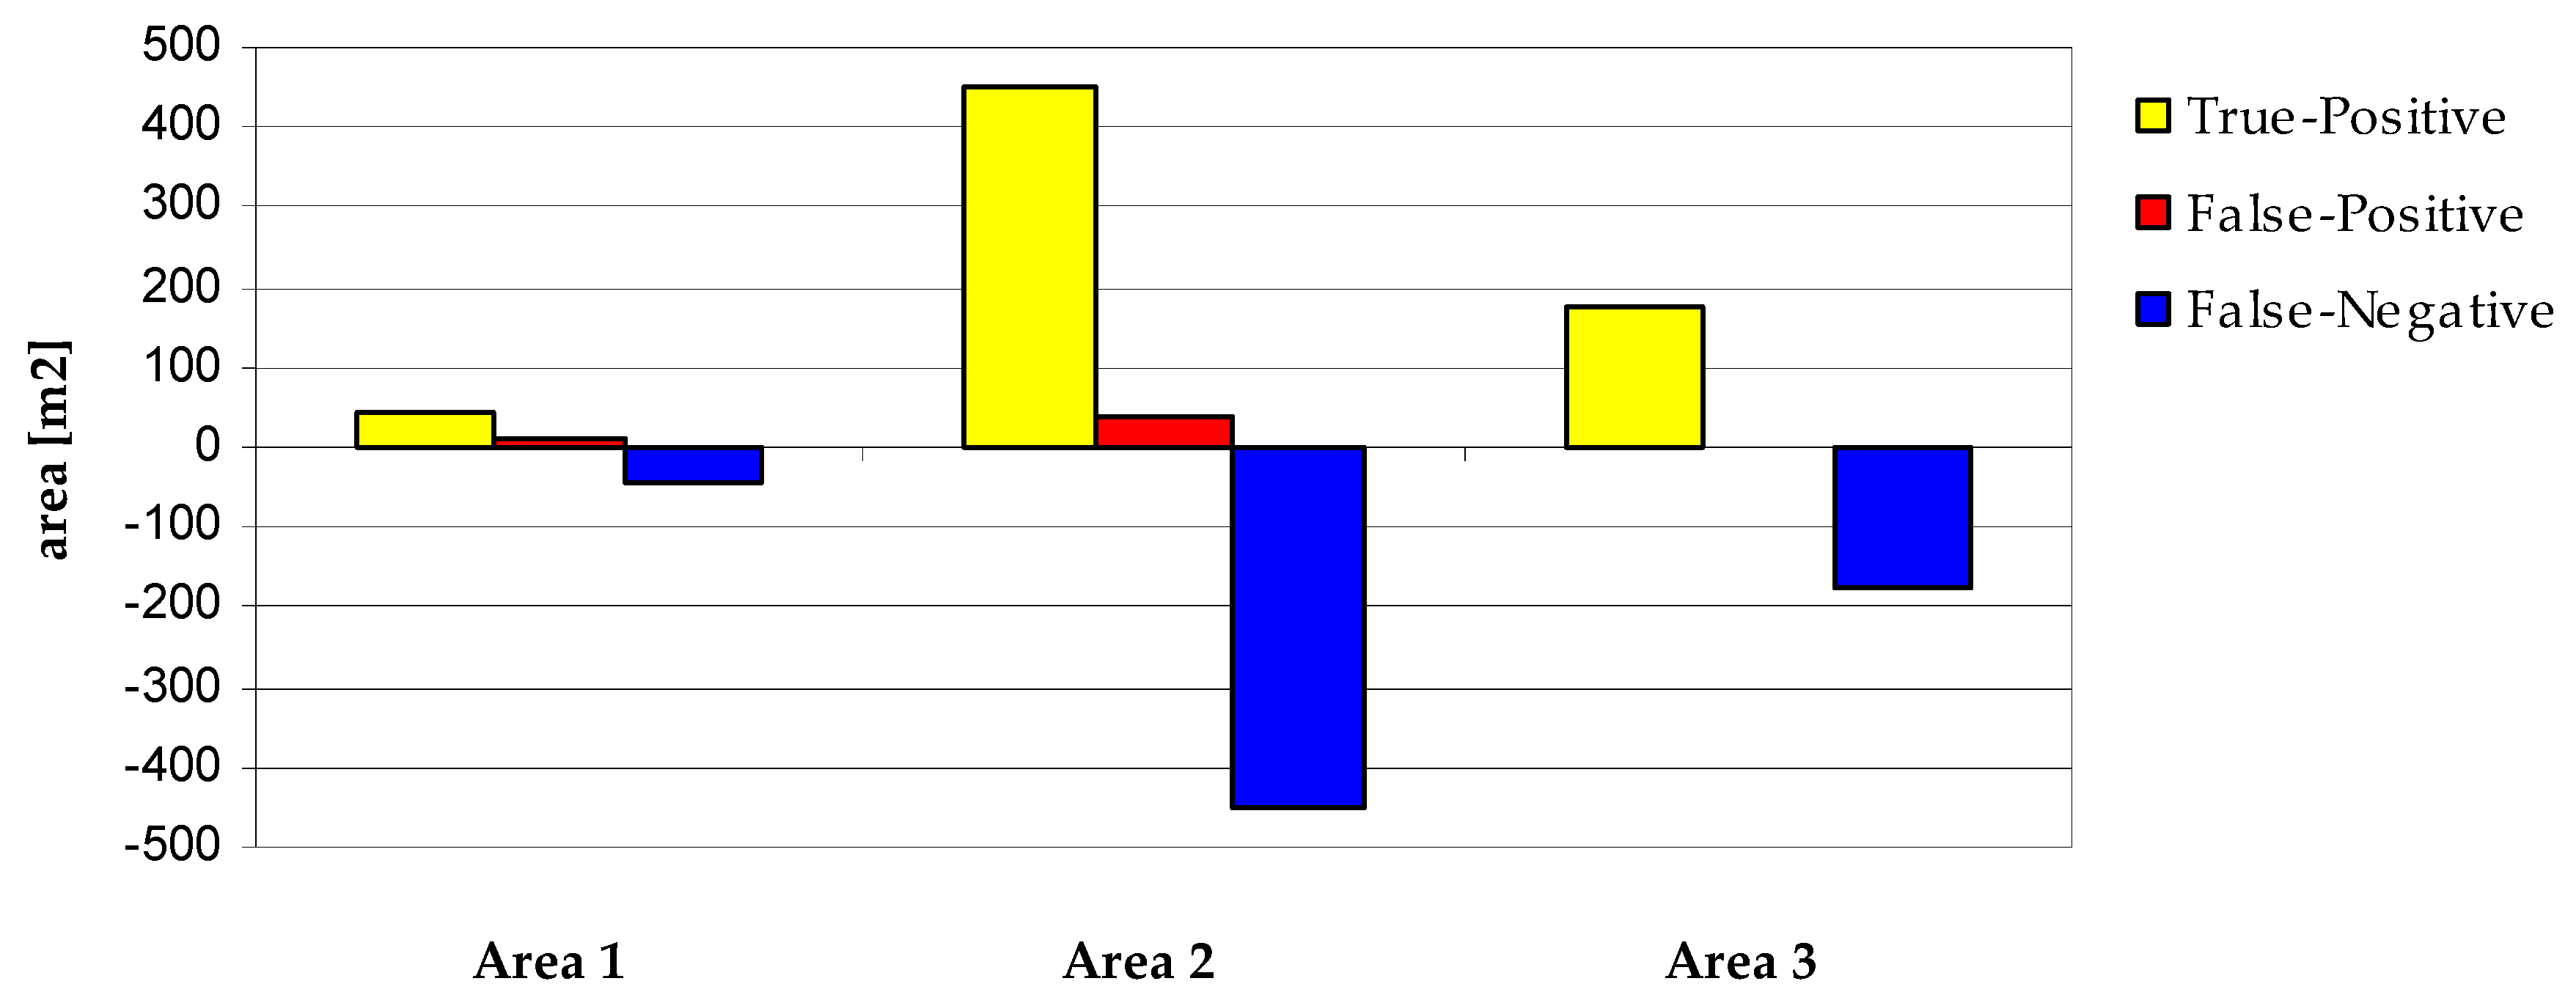
In the evaluation of coverage, the largest improvements are observed for Area 2. After refinement, the True Positive indicator increased by 453 m2, while the False Positive area grew only by 37 m2. Smaller variations are seen for Area 1 and Area 3, where the True Positive area increased by 43 m2 and 177 m2, respectively. In Area 3, the final indicator for geometric accuracy of the building boundaries (correctness) is the lowest. However, only in this test site, we have noticed a simultaneous increase of True Positive area with an accompanying decrease of the False Positive area, indicating a high correctness of the applied edge shift. Correctness measures observed for Area 1 and Area 2 are slightly lower after image-aided correction is applied (0.2% and 0.5%, respectively). Since in the refinement procedure we tend to choose most outer lines of all accepted candidates, we may obtain more False Positive pixels. However, the benefits in completeness, final quality, and visual performance are still much bigger than the slight deficits in the correctness (especially for Area 2).
The final evaluation of the reconstruction results is reported by three measures: completeness, correctness and quality (as defined in [
34]). For Area 1 and Area 3, the final quality metric increased from 79.3% to 79.8% and from 88.6% to 90.7%, respectively. Judging from this moderate improvement, one has to keep in mind that the presented refinement approach preserves the initial roof structure of a model obtained from ALS-data processing, thus preventing the correction of blunders in the building reconstruction, as can be seen in
Figure 10. As no new building component can appear in the refined scene, the overall quality indicators computed per-area level (which are dominated by some reconstruction blunders) are not expected to dramatically change. For Area 2, however, we can observe a large improvement. The prevailing objects in this data set are multi-flat roofs, which experience the largest improvement by the correction procedure. Here, the final quality indicator of the reconstructed 3D scene increased from 81.3% to 90%.
4. Conclusions
We have presented a method for sequential refinement of ALS-based building models using monoscopic aerial images. The proposed reconstruction approach is based on extracting refined roof corners by an intersection of 3D roof planes previously detected from ALS data with viewing planes assigned to roof edges extracted from an image. The projected line segments of the input model are used to restrict the search space for candidate line segments derived from the imagery. Knowledge on the structural arrangement of roof models and convergence priors are introduced to the refinement procedure in order to guide the line extraction process. Information provided by the initial roof model enables the avoidance of faulty correspondences and reduces ambiguities of the edge matching.
The practical validation demonstrates that the integration of linear cues retrieved from imagery allows for improving the planar accuracy of roof plane outlines and rectifying several defects such as large positional deviations and deformed shapes along roof outlines. The conducted experiments show that different building types profited from the refinement in a different manner. The biggest improvement, observed in the visual comparison and proven by quality indicators, is observed for flat roofs, which are most sensitive to ALS point spacing and data gaps (up to 17 cm reduction in RMS error calculated with respect to the extracted boundaries).
The refined building models confirmed that introducing image data to the reconstruction process can enhance its quality. The efficient integration of modeling cues compensates for the inherent limitations of LiDAR data and resulting reconstruction deficits. The underlying methodology so far assumes that the structural arrangements of model edges derived from ALS data are topologically correct. In future work, we will extend the range of the refinement with a possibility for model shape modification. Moreover, the method could be extended to the simultaneous use of multiple aerial images.


