Article

Limited Effects of Water Absorption on Reducing the Accuracy of Leaf Nitrogen Estimation

1
International Institute for Earth System Science, Nanjing University, Nanjing 210023, China
2
Department of Geography and Program in Planning, University of Toronto, Toronto, ON M5S 3G3, Canada
3
Department of Statistics, Wuhan University of Technology, Wuhan 430070, China
*
Author to whom correspondence should be addressed.
Remote Sens. 2017, 9(3), 291; https://doi.org/10.3390/rs9030291
Submission received: 20 December 2016 / Revised: 10 March 2017 / Accepted: 16 March 2017 / Published: 19 March 2017

Abstract

:
Nitrogen is an essential nutrient in many terrestrial ecosystems because it affects vegetation’s primary production. Due to the variety of nitrogen-containing substances and the differences in their composition across species, statistical approaches are now dominant in remote sensing retrieval of leaf nitrogen content. Many studies remove spectral regions characterized by strong water absorptions before retrieving nitrogen content, because water is believed to mask the absorption features of nitrogen. The objectives of this study are to discuss the necessity of this practice and to explore how water absorption affects leaf nitrogen estimation. Spectral measurements and chemical analyses for Maize, Sawtooth Oak, and Sweetgum leaves were carried out in 2014. The leaf optical properties model PROSPECT5 was used to eliminate the influences of water on the measured reflectance spectra. The inversion accuracy of PROPECT5 for chlorophyll, carotenoid, water, and dry matter of Maize was also discussed. Measured, simulated, and water-removed spectra were used to: (1) find the optimal nitrogen-related spectral index; and (2) regress with the area-based leaf nitrogen concentration (LNC) using the partial least square regression technique (PLSR). Two types of spectral indices were selected in this study: Normalized Difference Spectral Index (NDSI) and Ratio Spectral Index (RSI). Additionally, first-order derivative forms of measured, simulated, and water-removed spectra were devised to search for the optimal spectral indices. Finally, species-specific optimal indices and cross-species optimal indices, as well as their root mean square errors (RMSE) and coefficients of determination (R2), were obtained. The Ending Top Percentile (ETP), an indicator of the performance of cross-species optimal indices, was also calculated. PLSR was combined with leave-one-out cross validation (LOOCV) for each species. The predicted root mean square errors (RMSEP) and predicted R2 were finally calculated. The results showed that chlorophyll, carotenoid, and water contents could be estimated with R2 of 0.75, 0.59, and 0.69, respectively, which were acceptable for fresh leaves. The dry matter was retrieved with a relatively lower accuracy because of the fixed absorption coefficients adopted by PROSPECT5. The performances of species-specific optimal indices using water-free spectra were comparable to or worse than the corresponding indices derived with measured or simulated spectra. Compared with measured spectra, ETP did not change much after the effects of water were removed, and the R2 between cross-species optimal spectral indices and area-based LNC for Sawtooth Oak and Sweetgum decreased while it remained almost the same for Maize, suggesting that the water-removed cross-species optimal indices were inferior to the corresponding optimal indices found without water removal. ETP was larger than 30% for all spectra, demonstrating the non-existence of common optimal NDSI or RSI for the three species. After water removal, the accuracy of PLSR for Sawtooth Oak and Sweetgum decreased and increased negligibly for Maize. The results suggest that water absorption has limited effects on reducing the accuracy of leaf nitrogen estimation. On the contrary, the accuracy may decrease due to the loss of spectral information caused by the removal of water-sensitive spectral regions.

Graphical Abstract

1. Introduction

Nitrogen is believed to be an essential nutrient that limits net primary production (NPP) in most terrestrial ecosystems [1]. Interactions between nitrogen and carbon regulate the responses of terrestrial ecosystems to CO2 fertilization [2,3,4]. From a physiological perspective, nitrogen is related to various plant biochemical functions, such as photosynthesis, respiration, and transpiration [5], which makes nitrogen an important indicator of plant health and growth status. Hence, nitrogen plays an important role in terrestrial ecosystem carbon dynamics and is a necessary parameter in ecosystem process models.
Estimating canopy or leaf biochemical composition has been a hotspot in the remote sensing community in recent years, with the improvement of sensors’ spectral resolution as well as the development of inversion algorithms. There are empirical and physical inversion models for this purpose. Empirical models make use of spectral indices, stepwise multiple linear regression (SMLR), partial least square regression (PLSR), random forest [6], etc. The drawback of empirical models is their limited generality and transferability. An empirical model built for one specific site often shows poor performance for other sites. Physical models can avoid such drawback. The commonly used leaf-scale physical models include PROSPECT [7], LIBERTY (Leaf Incorporating Biochemistry Exhibiting Reflectance and Transmittance Yields) [8], 2-flux Kubelka-Munk (K-M) model [9,10], 4-flux K-M model [11], Radiative Transfer Equation [12], and ray tracing. The scaling issue must be considered if leaf-scale models are used to predict biochemistry at the canopy scale. These models have clear physical meanings and can be applied to different species. However, they require complex parameters. Physical models have been successfully used to estimate biochemical constituents such as chlorophyll, water, and dry matter. However, nitrogen content is quite different from these biochemical components. Nitrogen is an element which exists in various forms within leaves such as proteins, free amino acids, alkaloids, phosphatides, and nucleic acids. In addition, nitrogen partitioning strategies are different across species [5]. Most leaf nitrogen is allocated into organelles such as chloroplasts, cell walls, cell nucleus, and mitochondria, and only a small proportion exists in free components. Nitrogen that is allocated into chloroplasts accounts for 50%–75% [5], while the allocation to cell walls is 10%–30% [13]. The percentage of nitrogen allocated into cell walls is related to the toughness of a leaf: the tougher the leaf is, the more nitrogen is in the cell walls. Therefore, it is difficult to estimate leaf nitrogen content (LNC) with a physically-based model. Since nitrogen mainly exists in proteins [14], many studies focused on the absorption features of proteins. Wang et al. [15] tried to determine nitrogen content with the PROSPECT model in an indirect way, but their method turned out to be empirical. Hence, empirical models are dominant in LNC estimation.
Empirical models used in remote sensing of LNC generally fall into two categories: simple regression models and multiple regression models. Simple regression models usually correlate measured nitrogen content with variables such as chlorophyll, two-band, or three-band spectral indices [16,17,18,19,20,21,22,23]. However, the decoupling of leaf chlorophyll content and LNC might exist in ecosystems where N limitations are not strong [24]. In canopy nitrogen estimation applications, the accuracy is always affected by the canopy structure and background reflectance [25]. Ignoring these factors, the established relationships may turn out to be wrong [26,27,28]. Another empirical approach is multiple regression models among which SMLR and PLSR are the most commonly used [20,21,29,30,31,32,33,34]. Influences of canopy structure and background are always neglected when nitrogen content is estimated with multiple regression models at the canopy scale. Other inspirations from machine learning, such as ensemble learning [35], Bayesian model averaging [36], wavelet transformation, neural network [37], random forest [6], etc., have also been used to predict nitrogen content.
One problem that is unclear in previous studies is whether water absorption will reduce the accuracy of leaf nitrogen estimation. The absorption features of nitrogen, which mainly result from the vibration of chemical bonds, are shadowed by water or are affected by the signal/noise ratio (SNR) [38]. Therefore, many studies at the canopy scale removed spectral regions with strong water absorptions after atmospheric correction, e.g., [17,29,30,32,39,40]. However, this practice may lead to the loss of useful spectral information. Should these regions be excluded? How does water absorption affect the accuracy of nitrogen estimation in these regions? A study on these questions is needed. One simple solution is to remove the influences of water on the measured reflectance spectra. Once water-removed spectra have been simulated, they can be compared with measured spectra to check whether water absorption will reduce the accuracy of nitrogen estimation by taking both of them into the same nitrogen estimation procedure. Gao and Goetz [41] extracted reflectance spectra of dry leaves from those of fresh leaves using a nonlinear least squares spectral matching technique. An improved version of this algorithm was proposed by Schlerf et al. [42]. Ramoelo et al. [43] increased the accuracy of nitrogen and phosphorus estimation using this water-removal method. It assumes that the fresh leaf spectrum is a nonlinear combination of a leaf water spectrum and a dry-matter spectrum. However, this approach is essentially an empirical spectral transformation technique rather than a water-removal technique. Based on the plate model by Allen et al. [44], Jacquemoud and Baret [7] proposed a leaf optical properties model: PROSPECT, which now not only can be used to simulate leaf reflectance and transmittance with provided biochemical and structural parameters, but also can be run in a reversed way to estimate the absorption of biophysical contents in leaves. PROSPECT makes it possible to eliminate the influences of water on the measured spectra.
This study simulated the water-removed reflectance spectra by running PROSPECT first in the backward mode then in the forward mode. The main objective is to explore how water absorption affects the accuracy of LNC estimation.

2. Materials and Methods
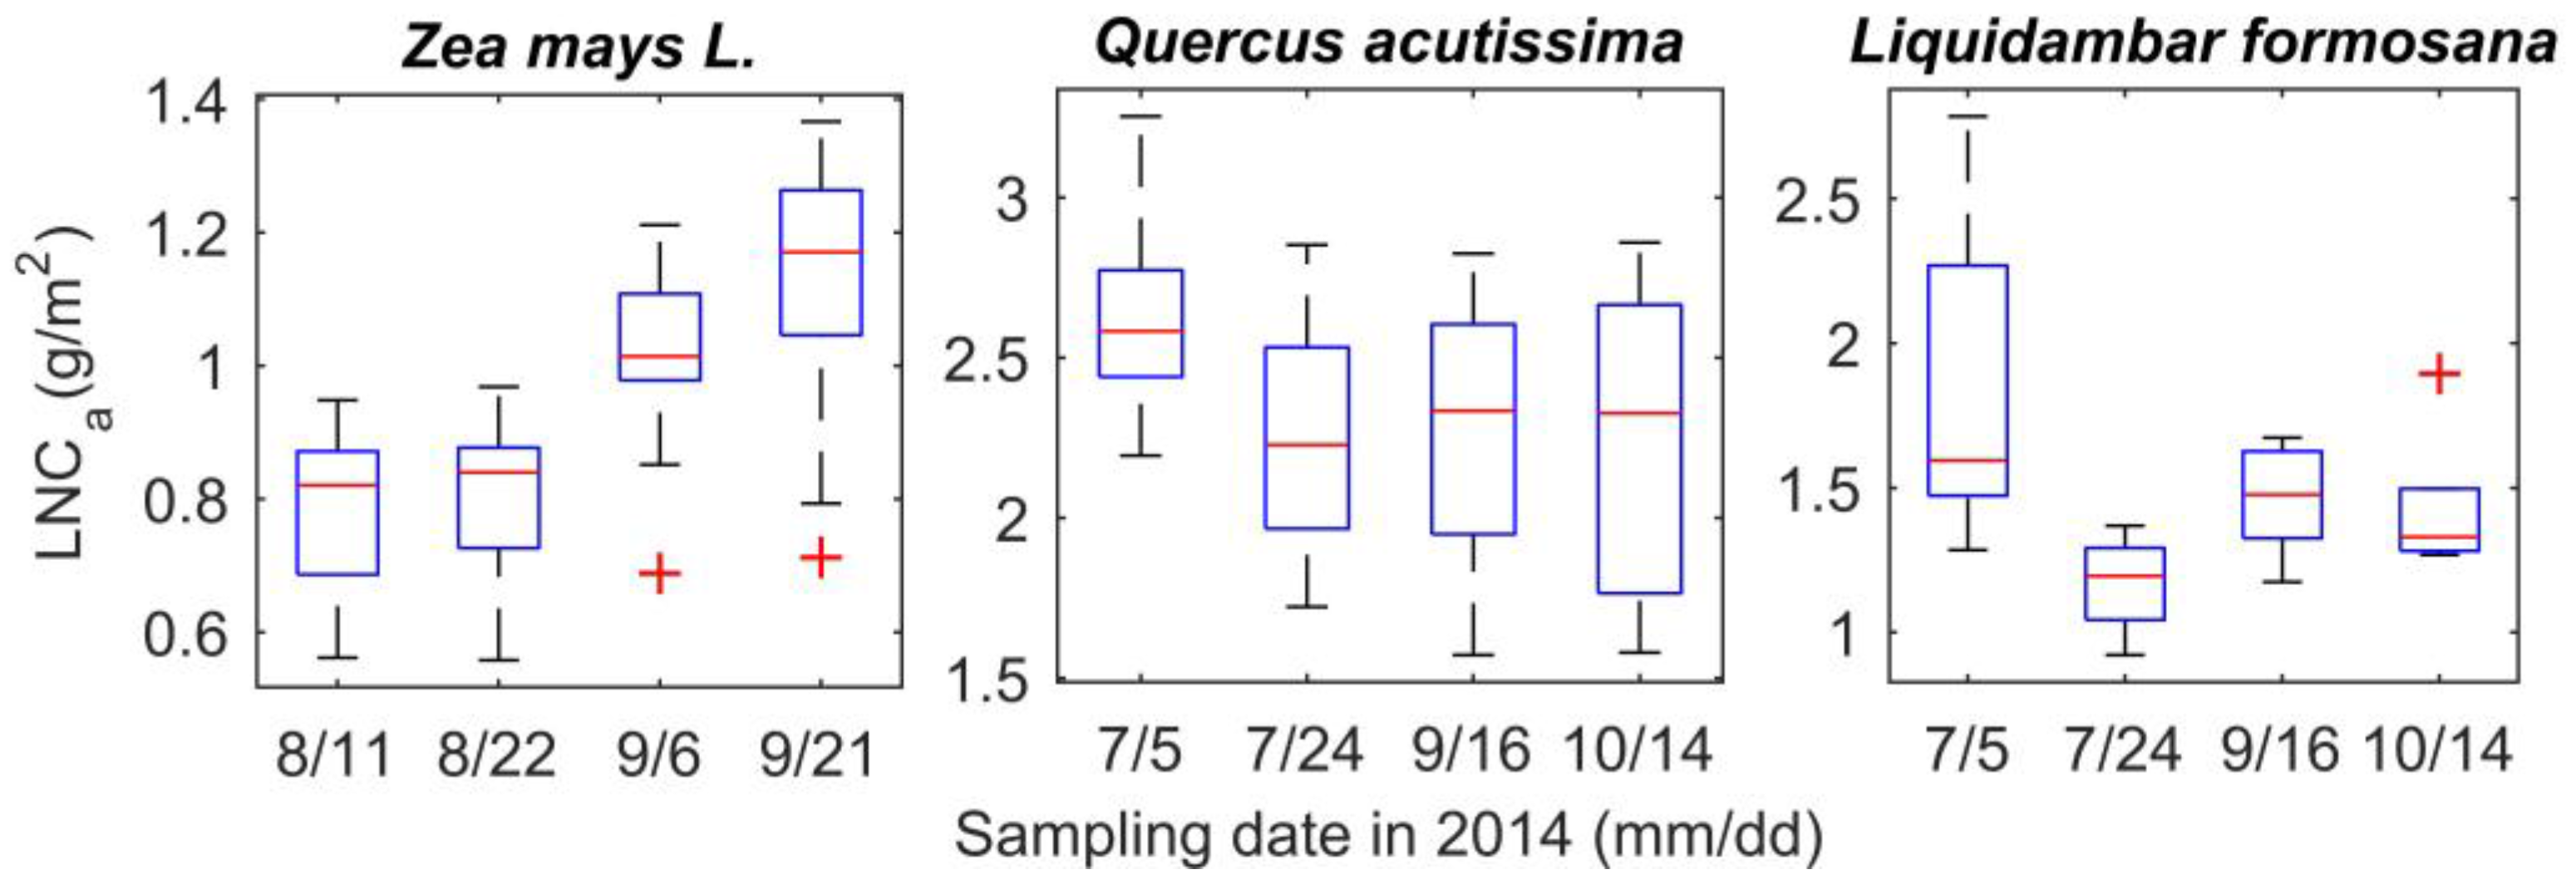
2.1. Study Sites

Field campaigns were conducted in 2014 at two sites. The first site is located in the agro-meteorological station (32.20°N, 118.70°E, 22.0 m) of Nanjing University of Information Science and Technology (NUIST), Nanjing, Jiangsu Province, China. The soil texture was loam clay (26.1% clay) with a pH of 6.1 ± 0.2. Soil organic matter and total nitrogen were 19.4 g·kg−1 and 11.5 g·kg−1, respectively. A split plot design with three replications of five different levels of water treatments was used for the experiment. The plots were with the same size of 2.5 × 2.5 m2 and separated by concrete crisscross footpaths in order to avoid lateral seepage of water. The plots were randomly arranged. Maize (Zea mays L., cultivar is Jiangyu 403) was planted on July 12th with a row spacing of 0.625 m. Water treatments included severe water stress (35%–45% field capacity-FC), serious water stress (50%–60% FC), moderate water stress (65%–75% FC), sufficient water supply (80%–90% FC), and mild waterlogging (95%–105% FC). Every plot was equipped with a sensor to detect the average water content of the soil every 60 minutes. Water could be automatically supplied through a PVC pipe according to the calculated irrigation amount. These sensors were calibrated every ten days using the soil humidity measured by weighing the oven-dried soil samples. Water treatment started five days after stem elongation. An automatic movable iron cover was used during raining days to prevent the interference of precipitation. Leaves were sampled at different growing stages (Table 1).
The second experiment was carried out in a temperate forest dominated by Sawtooth Oak (Quercus acutissima) and Sweetgum (Liquidambar formosana). It was located at the Ecological Station of Nanjing Forestry University (32.13° N, 119.20° E, 163.0 m) in Xiashu, Zhenjiang, Jiangsu Province, China. The average annual precipitation of Xiashu is 1105 mm and the average annual temperature is 15.1 °C. An eddy covariance tower was used to access the top of the canopy and collect leaf samples. The information on the sampling data is shown in Table 1.

2.2. Spectral Measurements and Chemical Analysis

For the maize site, one plant in each plot was selected and marked as the sampling target. Three leaves were taken from each chosen plant at the upper, middle, and lower layers of the canopy. At the second site, four plants of Sawtooth Oak and two plants of Sweetgum around the eddy covariance tower were chosen as sampling trees. Leaves were collected by clipping small branches from the canopy using a lopper, with each sample consisting of leaves collected from three different heights in the canopy. Sampled leaves were sealed in a Ziplock bag labeled with the plot/tree number and were then placed in an icebox.
Immediately after detachment, leaf samples were transported to a laboratory where the directional-hemispherical reflectance of each leaf’s adaxial surface was measured over the 350–2500 nm range using a FieldSpec® FR spectroradiometer (ASD Inc., Boulder, CO, USA) connected with a BaSO4 integrating sphere (LI-COR Inc., Lincoln, NE, USA). The spectroradiometer has a field of view of 15° and its optic cable was mounted against the top port of the integrating sphere. The integrating sphere has four ports in total. Spectral measurements need manipulation by presenting different surfaces at the other three ports. With multiple configurations of a white plug, a black plug, and a halogen lamp (the light source), the reflectance and transmittance could be measured. Three scans were made each time and the average of these scans produced the final spectra with 1 nm resolution and 2151 channels. The reflectance curves were smoothed using the Savitzky-Golay (SG) method (Savitzky and Golay, 1964) with the third-order polynominal function and 25 nm bandwidth prior to data processing. Since the spectral range available in PROSPECT is 400–2500 nm and the signal to noise ratio (SNR) of measured spectra between 2300 nm and 2500 nm was very low, the wavelengths beyond the range of 400–2300 nm were removed. All data were handled within the MATLAB (The MathWorks, Inc., Natick, MA, USA) software.
After spectral measurements, disks with known diameters (2.54 cm and 1.27 cm) were taken from the leaf samples with sharpened metal punches. Meanwhile, the fresh weights were measured. Then the disk samples were oven-dried at 70 °C for 48 h, and weighed to obtain the dry weights. Mass-based LNC (or total nitrogen, denoted as %N) was determined by an automatic Kjeldahl instrument (Hanon Instruments Co., Ltd., Jinan, Shandong, China). Mass-based LNC was converted to area-based LNC ( LNC a ) by
LNC a =   % N × W d S
where W d is the dry weight and S is the area of a sample. A total number of 231 samples were measured from the experiment (Table 1). The temporal variations of area-based LNC for three species are shown in Figure 1. Synchronous measurements of leaf chlorophyll and carotenoid contents were also conducted, but for Maize only. Pigments were extracted using organic solvents (acetone) by grinding leaf disks in a mortar with a pestle. The extracted solution was then centrifuged followed by photometric determination of pigments with a UV-Vis spectrophotometer. Chlorophyll and carotenoid content were calculated from the recorded absorbance values at certain wavelengths [45]. For Sawtooth Oak and Sweetgum, the leaves were kept in an ice box and then taken from the station to the laboratory to be punched and weighed, which took more than 10 h. Therefore, the accuracy of measured water content for these two species were compromised.

2.3. Water Removal Technique

The PROSPECT model was used in this study to remove water’s influences on the measured spectra. This model was originally developed to simulate leaf reflectance and transmittance with inputs of biochemical and structural parameters in the forward mode [7]. Jacquemoud et al. [46] successfully used PROSPECT to estimate leaf biochemical constituents in the reverse mode. Since the establishment of PROSPECT, it has undergone several important improvements. They correspond to introductions of new leaf biochemical constituents such as dry matter [47,48] and brown pigments. Feret et al. [49] reassessed the angle of incidence of incoming radiation, the refractive index, and specific absorption coefficients in this model, and improved its performance. The improved versions are PROSPECT4 and PROSPECT5. The difference between these two versions is the separation of total chlorophylls and total carotenoids, which improves the chlorophyll retrieval in PROSPECT5. PROSPECT5 was used in this study. When run in the forward mode, PROSPECT5 needs six input parameters in total. They are chlorophylls, carotenoids, brown pigments, structural parameter N, equivalent water thickness (EWT), and dry matter (DMA). PROSPECT can be noted using the following simplified equation
[ R m o d ( λ ) , T m o d ( λ ) ] = PROSPECT ( N , n ( λ ) , k ( λ ) )
where R m o d ( λ ) and T m o d ( λ ) are the reflectance and transmittance at wavelength λ , N is the structural parameter, and n ( λ ) is the refractive index, which has been calibrated in PROSPECT and takes constant values according to the wavelength. k ( λ ) is the linear combination of the contents of the biochemical constituents C i and their corresponding absorption coefficients.
k ( λ ) = i k i ( λ ) C i N
The specific absorption coefficients of the six biochemical components at one specific wavelength are set to fixed values. The outputs in the forward mode are the reflectance and transmittance spectra ranging from 400 to 2500 nm with 1 nm spectral resolution. When run in the inverse mode, the inputs are the reflectance and transmittance spectra while the outputs are the six parameters mentioned above. The mechanism of the inversion is to find the combination of these parameters minimizing the difference between the modeled and input spectra, which can be expressed as follows:
C i = min ( λ [ ( R m o d ( λ ) R m e s ( λ ) ) 2 + ( T m o d ( λ ) T m e s ( λ ) ) 2 ] )
where R m e s ( λ ) and T m e s ( λ ) are the measured reflectance and transmittance at wavelength λ . The source code of PROSPECT5 can be found here.
The influence of water on the spectra was removed through the following steps: (1) Run PROSPECT5 in the inverse mode. In this step, the measured reflectance and transmittance spectra were entered into PROSPECT5 as input parameters while the outputs were the six parameters mentioned above; and (2) Run PROSPECT5 in the forward mode to simulate the water-removed reflectance and transmittance by setting EWT as zero and the other biochemical constituents the same as the outputs obtained in the first step. Finally the water-removed reflectance and transmittance were simulated. In this study, only reflectance spectra were used. To test the validity of our water-removing method, we compared the measured and predicted chlorophyll, carotenoid, water, and dry matter of maize. The results of the other two species were not shown because of inaccurate measurements of water content and the absence of pigment data.

2.4. Correlation Analysis

In order to analyze the influences of water absorptions on the accuracy of leaf nitrogen estimation, we carried out our research based on optimal spectral indices and partial least square regression (PLSR).
Several definitions should be given before introducing the optimal spectral index searching algorithm. The spectral index space is defined by taking different combinations of wavelengths in the range from 400–2300 nm into the formula of the corresponding spectral index. The R2 space is a set of R2 derived by correlating every member in the spectral index space with measured area-based LNC. For each species, a species-specific R2 space can be calculated. The spectral index with a maximum value in the species-specific R2 space is the species-specific optimal spectral index. Two typical forms of spectral indices were adopted in this study: RSI and NDSI. Their relationship is shown in the equation below:
NDSI = R 2 R 1 R 2 + R 1 = R 2 / R 1 1 R 2 / R 1 + 1 = RSI 1 RSI + 1
where R 1 and R 2 are the reflectances at wavelength λ 1 and λ 2 , respectively. Additionally, we used first-order derivative spectra to calculate these two spectral indices, denoted as NDSI1st/RSI1st. The first-order derivative reflectance spectra were calculated according to Tsai and Philpot [50].
Cross-species spectral indices were determined in the following steps:
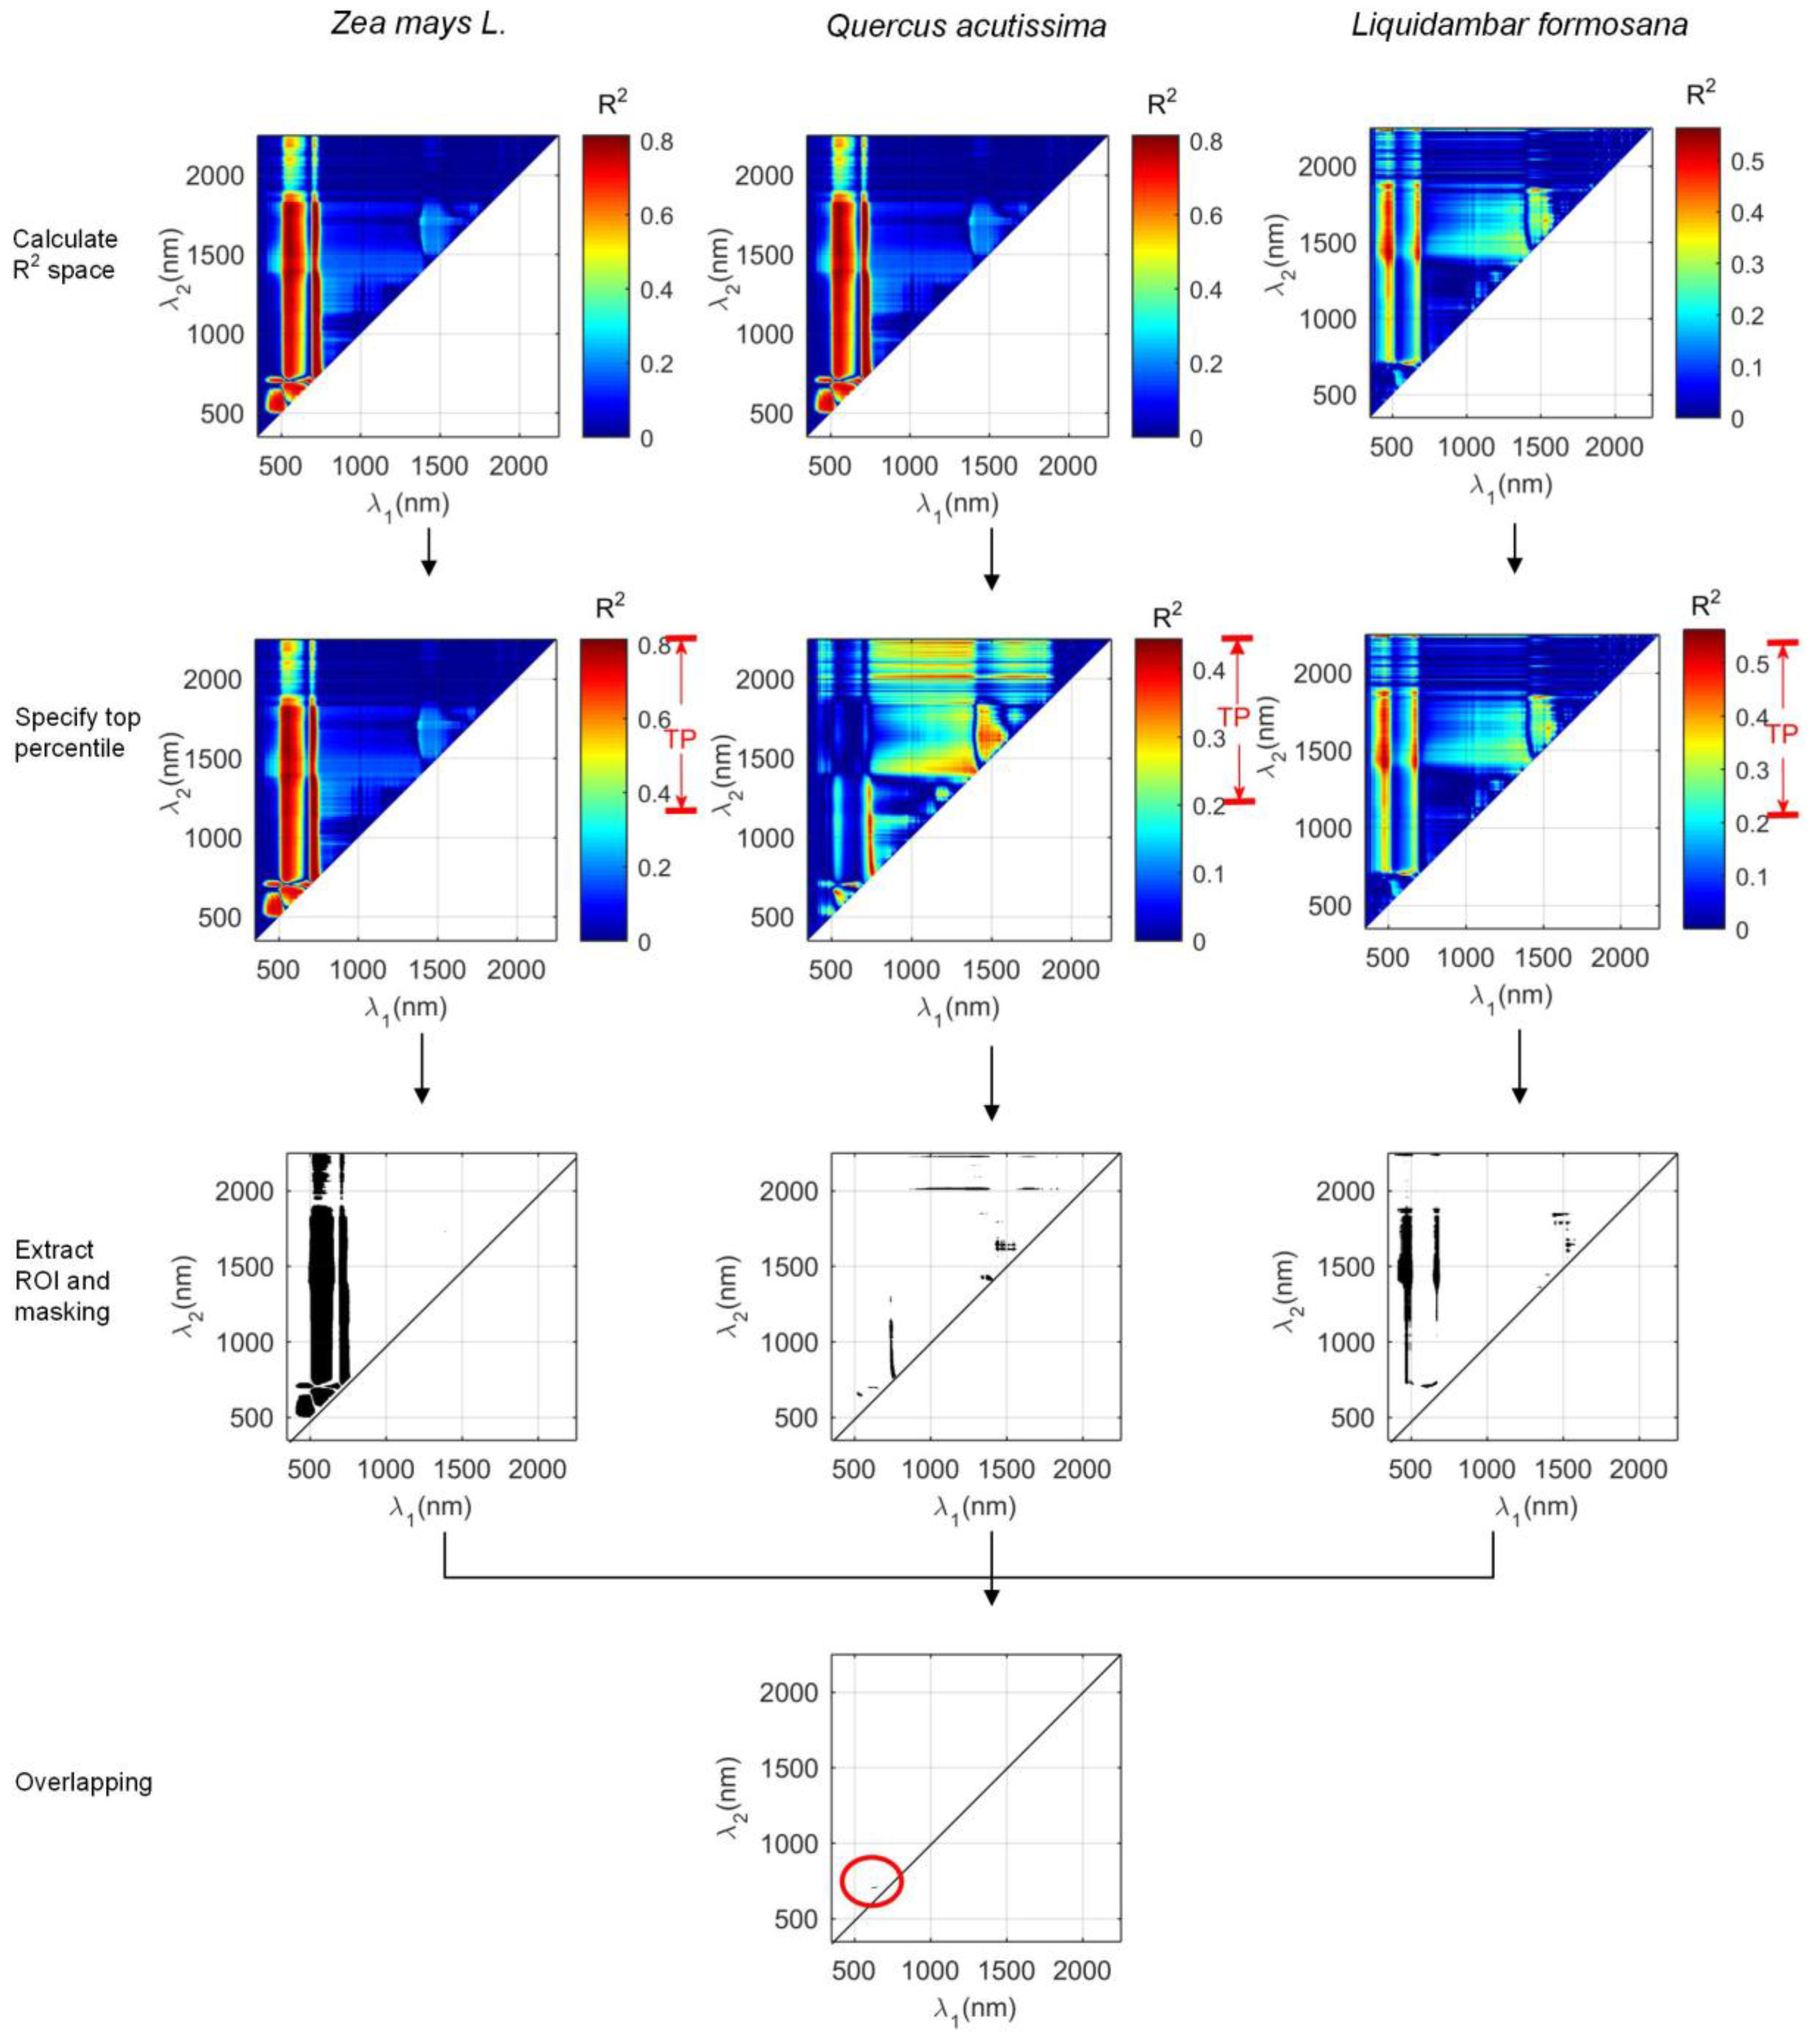
  • Calculate the species-specific R2 space according to the spectral index space and area-based LNC;
  • Extract regions of interest (ROI) from the entire spectral index space. Members in the spectral index space who satisfy R m a x 2 R 2 < T P × R m a x 2 were extracted. R m a x 2 is the maximum value in the R2 space, and TP is the specified top percentile which represents the value range near R m a x 2 . The equation means spectral indices, whose R2 with area-based LNC lies in the value range near R m a x 2 , will be extracted. The values of the extracted members in the spectral index space were assigned 1 while others were assigned 0 in a mask file.
  • Add up the values in the mask files of the three species. The spectra area with the summation of values from mask files equal to 3 are thought to be able to estimate LNC for all species.
Figure 2 gives a more intuitive description of the steps above. The spectral indices extracted based on the method mentioned above are cross-species but not optimal cross-species. Since the cross-species spectral indices result from overlapping of the three species’ spectral index spaces, we define the proportion of cross-species spectral indices to the total spectral index space as an overlapping index. In this study, the overlapping index sequences were derived by increasing the top percentile from 10% to 90% at a 2% step. The ending top percentile (ETP) is the top percentile corresponding to the smallest positive value in the overlapping index sequence. The cross-species spectral index determined under ETP is called the optimal spectral index. Hence ETP is an important indicator of the performance of the optimal cross-species spectral index. The smaller the value is, the better the result is.
Apart from searching for the optimal spectral indices, we also compared the performance of measured and water-removed spectra based on PLSR. PLSR is a type of eigenvector analysis that reduces the full spectrum to a smaller set of independent factors, with corresponding field data used directly during the spectral decomposition process [51]. Leave-one-out cross validation (LOOCV) was performed in regressions to select the optimal number of components for the PLSR models. To avoid overfitting, the number of components was limited to 10. Predicted root mean squared error (RMSEP) and predicted R2 were calculated. PLSR was applied to measured and water-removed spectra, but not their derivative forms. The full range of spectra (1901 wavelengths) was used in PLSR.

3. Results and Discussion

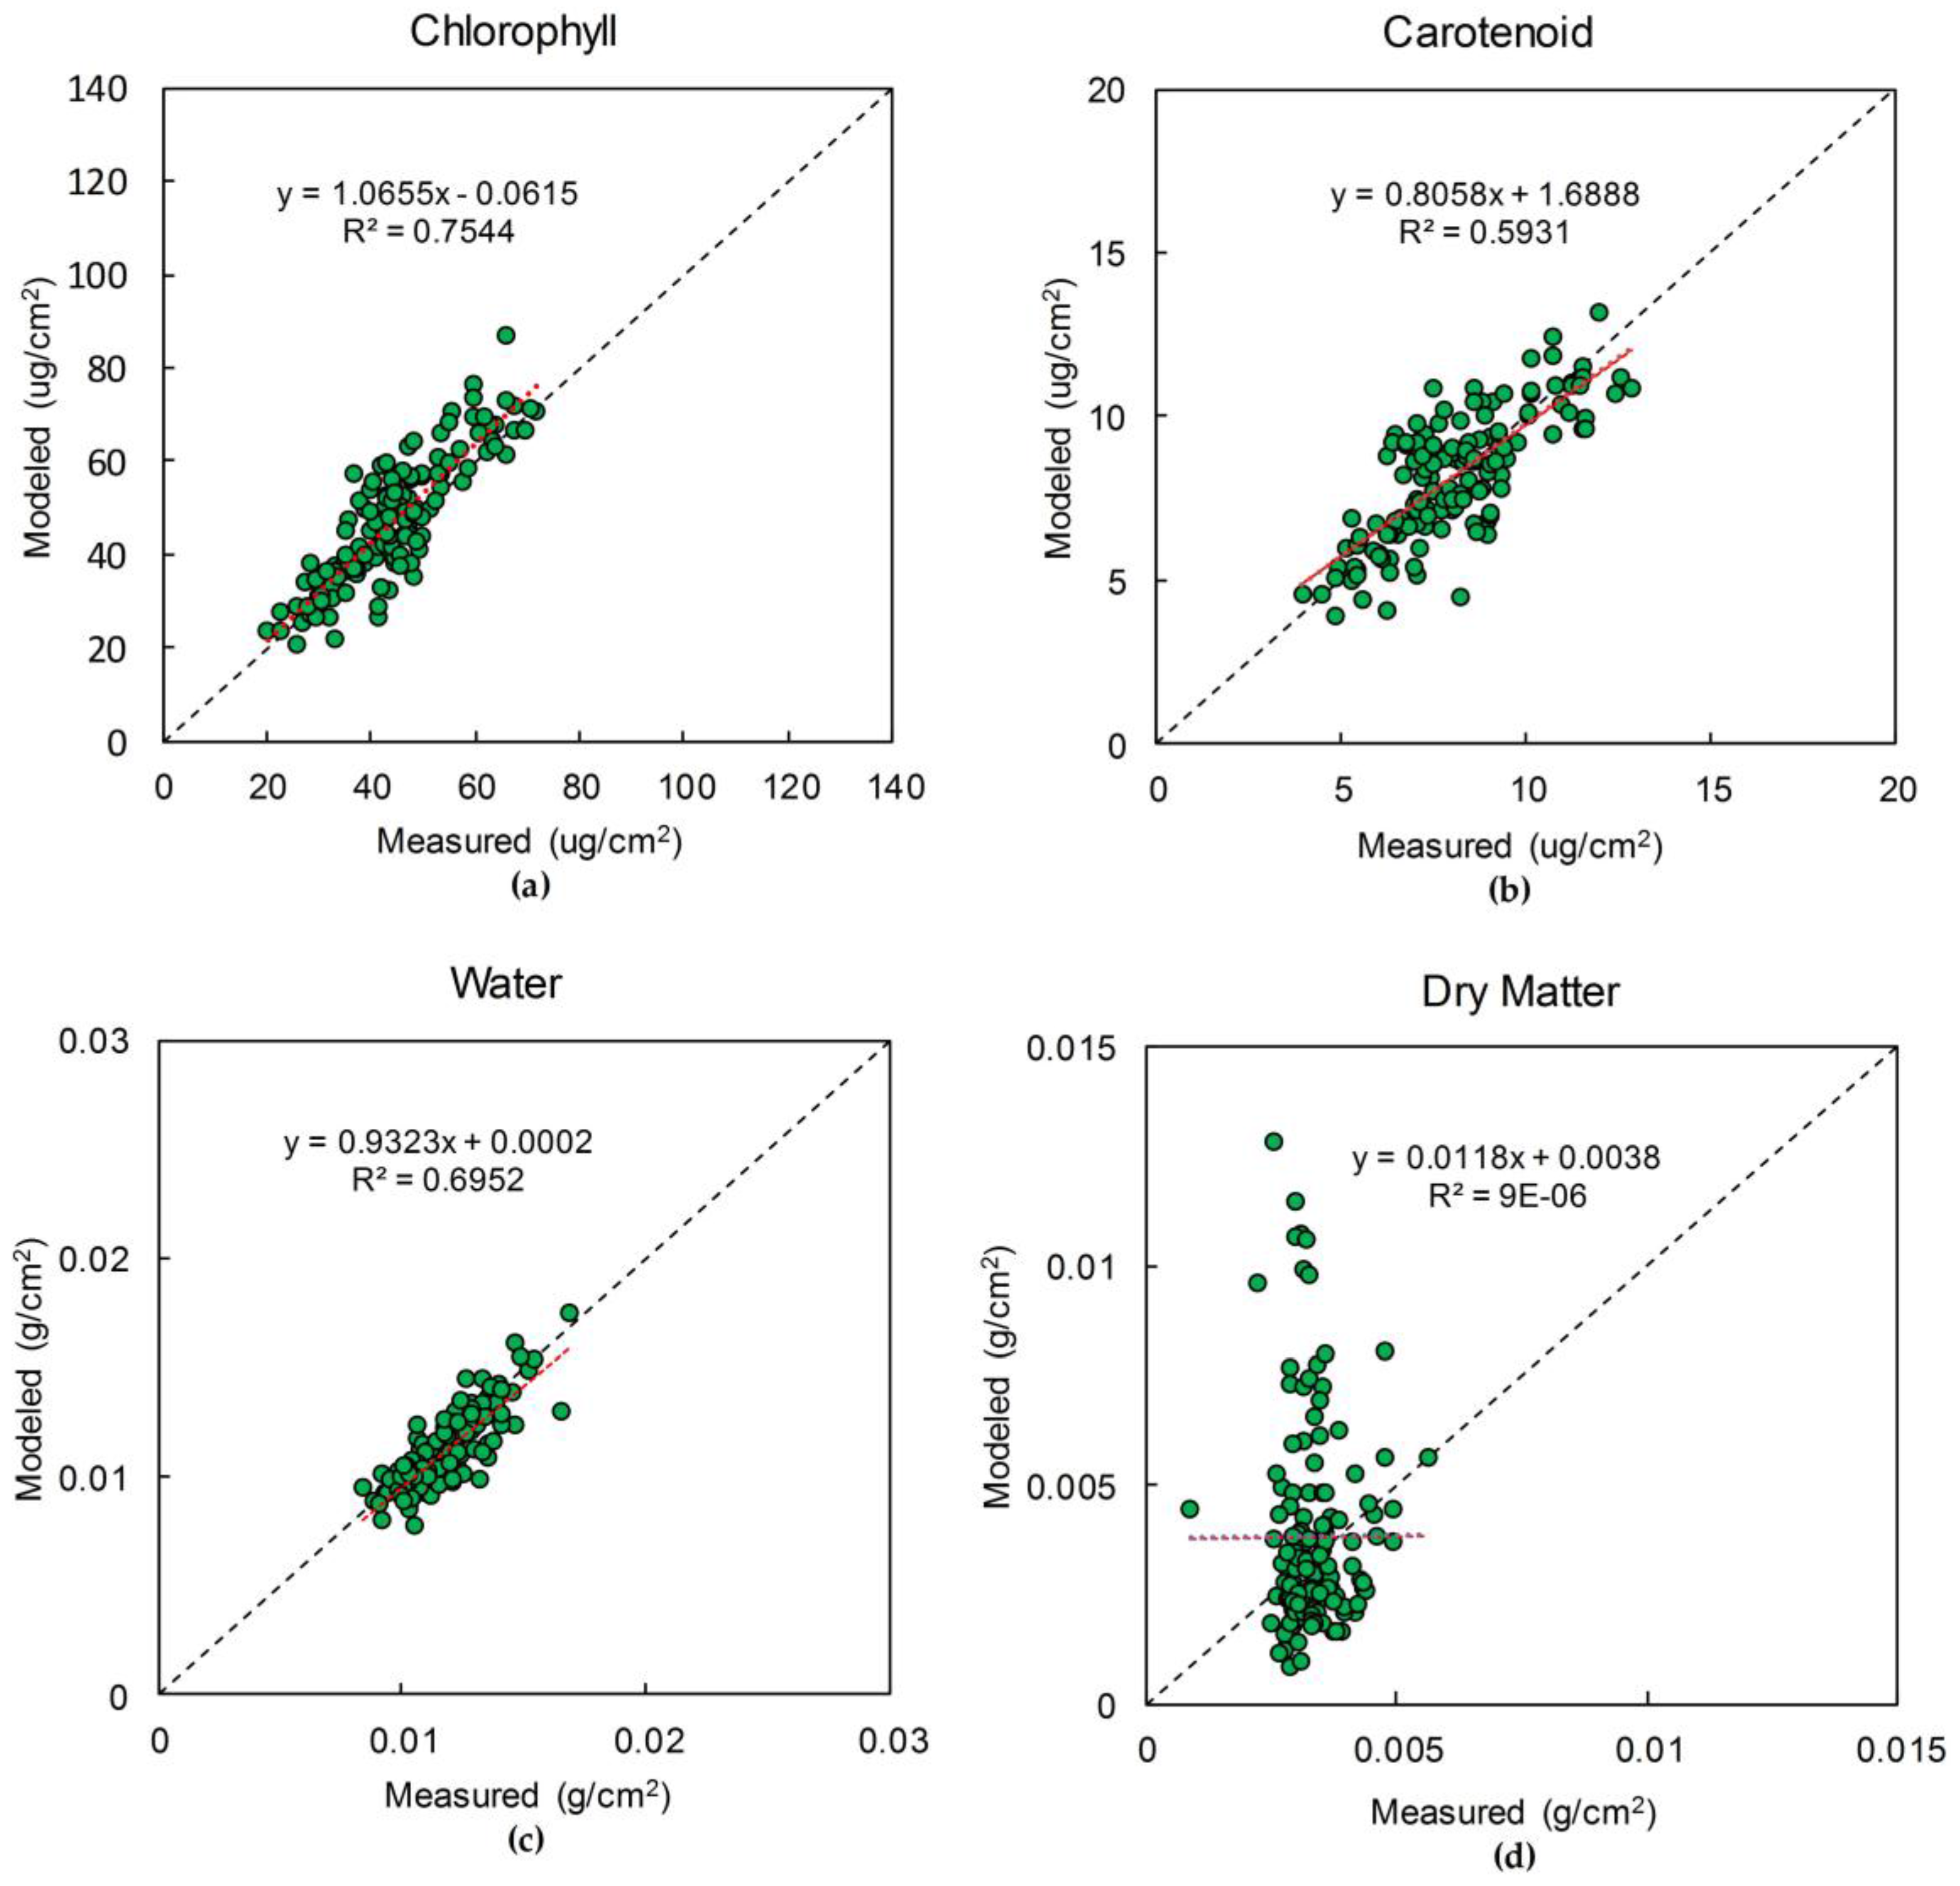
3.1. Inversion Accuracy of PROSPECT5 for the Maize Dataset

The inversion of PROSPECT5 based on the measured reflectance and transmittance of the maize dataset showed that chlorophyll, carotenoid, and water could be retrieved with R2 of 0.75, 0.59, and 0.69, respectively (Figure 3). The accuracy of inverted chlorophyll, carotenoid, and water contents were acceptable, but dry matter was poorly estimated. This is due to the fixed absorption coefficients used in PROSPECT. The inversion accuracy of leaf constituents is greatly affected by their absorption coefficients (see Equation (3)). The absorption coefficients of chlorophyll, carotenoid, brown pigment, and water are more reliable than dry matter due to their identical and stable chemical compositions across species. However, dry matter encompasses different biochemical components, such as cellulose, lignin, protein, starch, and sugar whose proportions vary across species [48]. This means that the composition of dry matter varies across species as well, and thus theoretically we cannot treat the absorption coefficients of dry matter as fixed values and should recalibrate them for each species. However, this cannot be realized in our research because of the limited sample numbers. Instead, we can regard retrieved dry matter content as the equivalent dry matter content with fixed chemical compositions.

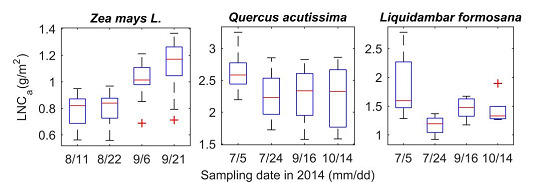
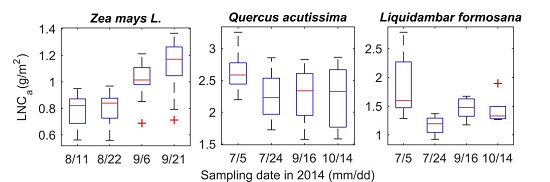
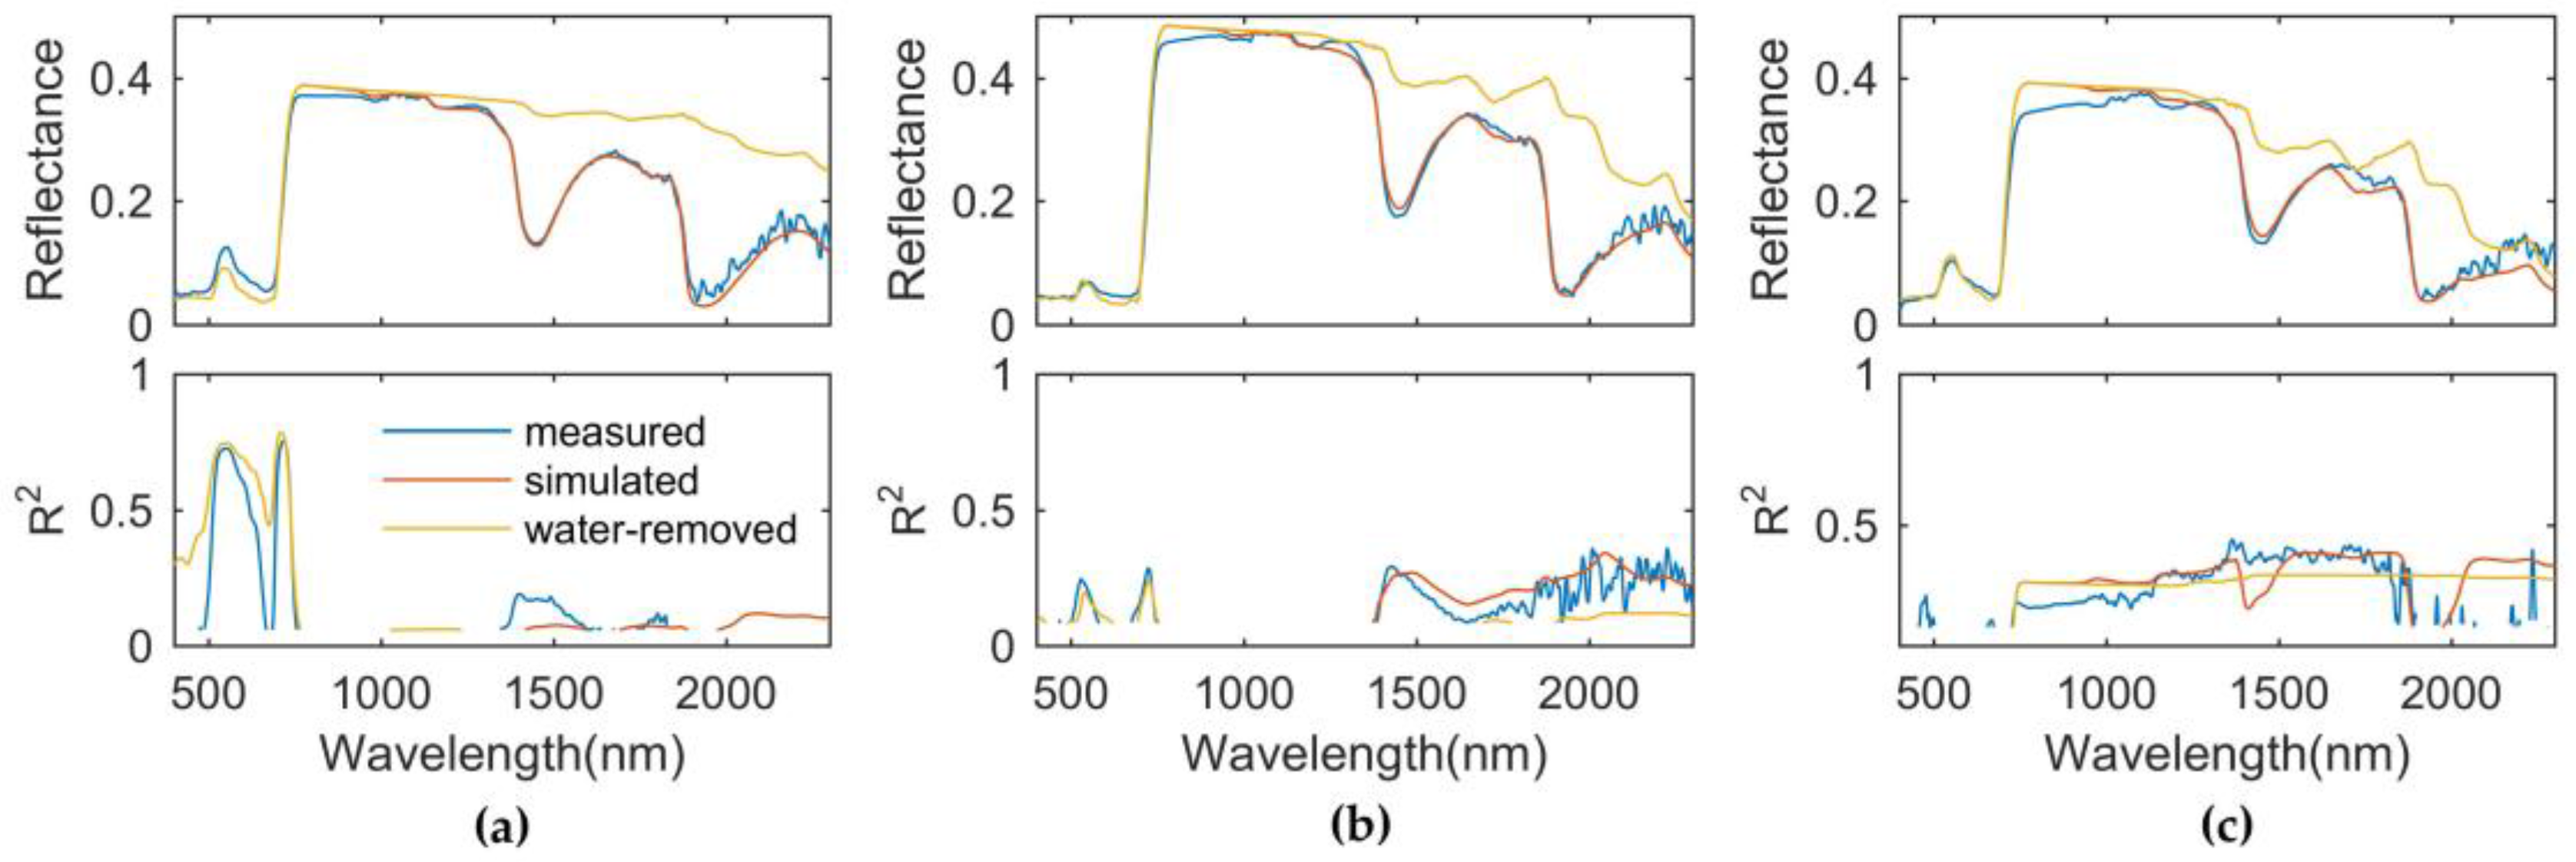
3.2. Responses of Measured, Simulated, and Water-Removed Spectra to Area-Based LNC

The shapes of simulated spectra agreed well with the measured ones for all three species (Figure 4). Both simulated and water-removed spectra had more smooth features, especially at wavelengths larger than 1900 nm where the SNR of measured spectra is relatively low. It is obvious that water mainly affects the spectral range greater than 790 nm. After removing the influence of water with PROSPECT5, the reflectance increased at wavelengths larger than 790 nm, especially in the spectral regions characterized by strong water absorption such as 1400–1500 nm and 1800–2000 nm. Although the reflectance increased after eliminating the influence of water, we observed limited improvements in the relationship between reflectance and area-based LNC. For maize, almost all the wavelengths with high nitrogen correlations lie in the visible region where chlorophyll absorption dominates. This is because chlorophyll is an important nitrogen-containing agent and can serve as an indicator of the photosynthetic rate. Fifty to seventy-five percent of total nitrogen is allocated into chloroplasts to participate in photosynthesis [5]. Water absorption plays the leading role at 1400 nm. The measured reflectance at this wavelength showed a significant relationship with area-based LNC, while the relationship became insignificant after the water removal procedure. Previous studies show that water absorption features will mask the effects of nitrogen at this wavelength. According to this conclusion, there should be an improved relationship between reflectance at this wavelength and area-based LNC after removing the influence of water from the measured spectra. However, our results did not conform to this expectation because we found that water absorption did not mask the effects of nitrogen, and instead interfered with the absorption features of nitrogen in some cases. For Sawtooth Oak, the spectral response to area-based LNC at 1400 nm was quite strong before water removal while the magnitude dropped significantly after water removal. When measured spectra were used without water removal, Sweetgum showed a different response pattern from Maize and Sawtooth Oak in chlorophyll-sensitive regions, but the reflectance correlated well with nitrogen content starting at the red edge and larger wavelengths. Weaker responses of reflectance to nitrogen content were witnessed in the spectral range of 1000–1900 nm, except at the wavelengths greater than 1900 nm.
The reflectance at the wavelength of 2100 nm is related to protein absorption, indicated by many studies on dry leaves [52,53,54]. However, such relationships turned out to vary across species and spectra types in this research (Figure 4). The worst correlations were found for Maize (R2 was smaller than 0.1 for all spectra types). For Sawtooth Oak, R2 at 2100 nm was nearly 0.3 for measured and simulated spectra, which was significant across the whole spectra. However, after water removal, R2 decreased to 0.1. For Sweetgum, this wavelength showed no significant relationship with nitrogen content for the measured spectra but correlated well with the simulated and water-removed spectra. Low SNR at this wavelength might be responsible for the observed variations. But other reasons may also be able to explain the variations: (1) the spectral transformation techniques are different. Kokaly [52] used Log(1/R) and derivative spectra in their study, which might highlight the absorption features; and (2) the spectra used by Kokaly [52] were scanned from dry leaves. Proteins will denature after drying, influencing the spectral response to nitrogen content. In this study, water free spectra were derived by setting the water content as zero and other biochemical and structural parameters were unchanged during PROSPECT5 simulation, which avoided the effect of protein denaturation.

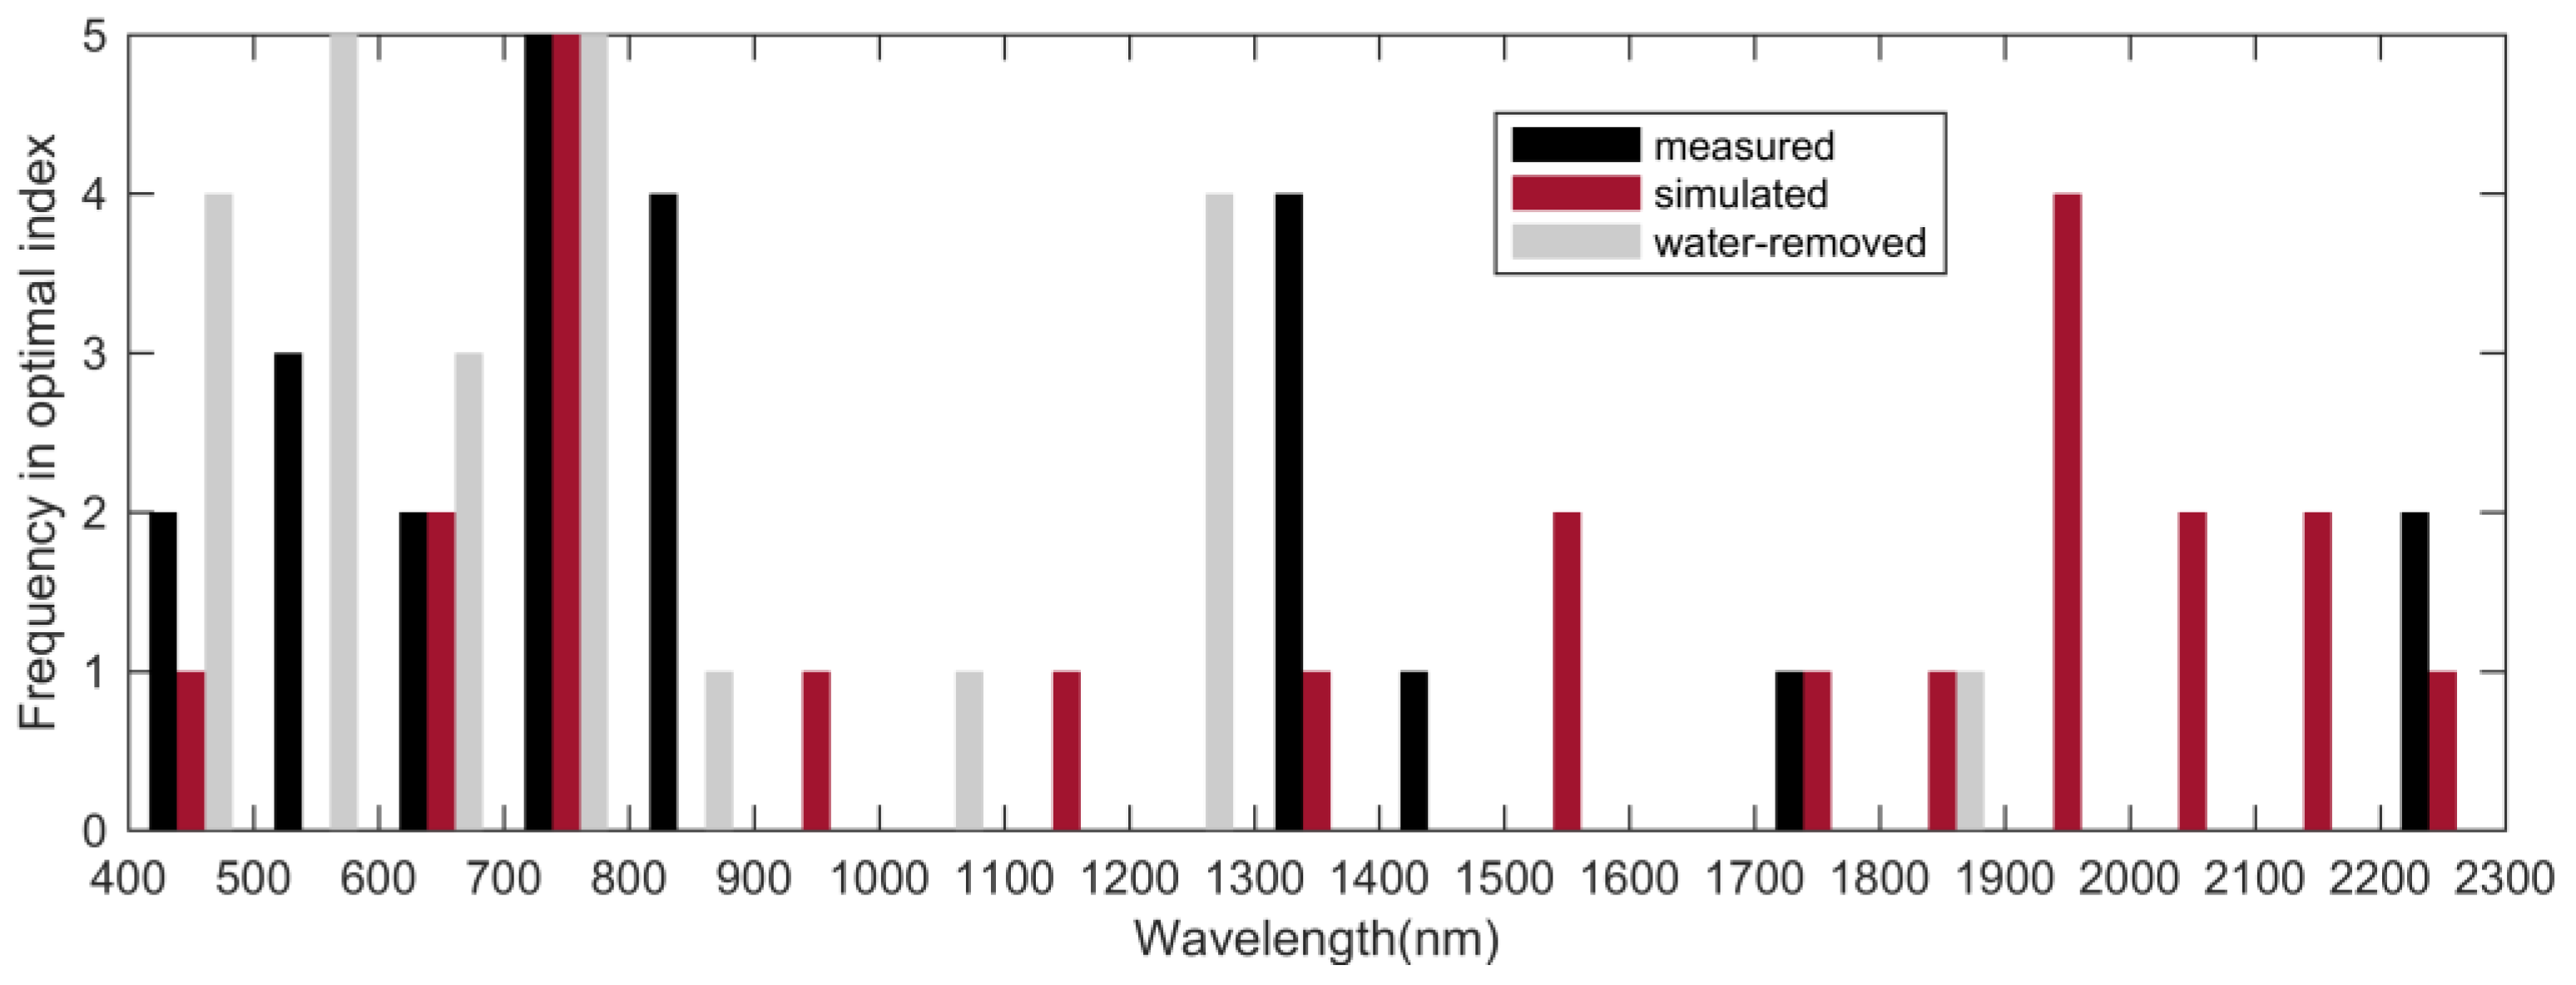
3.3. Water Absorption Did Not Degrade the Performance of the Optimal Nitrogen-Related Spectral Index

Between the measured and simulated spectra, R2 between species-specific optimal spectral indices and area-based LNC showed limited differences (Table 2). For maize, this value stabilized around 0.81. For Sawtooth Oak, the differences in R2 were less than 0.05 and for Sweetgum, they were larger with a maximum value of 0.13 for RSI. Despite the differences in selected wavelength combinations, the results demonstrate that the simulated spectra achieve fairly comparable accuracy against measured spectra, thus our water-removing method would be affected by PROSPECT5 in a limited manner.
R2 between species-specific optimal spectral indices and area-based LNC dropped or remained nearly the same after the influence of water was removed from measured spectra (Table 2). There was a 0.11–0.17 and a 0.14–0.25 decline in R2 for Sawtooth Oak and Sweetgum, respectively. In terms of the cross-species optimal spectral indices, ETP did not change much and was still larger than 30% after water absorption features were eliminated. Although ETP did not change much after water removal, the cross-species optimal spectral indices showed weaker relationships with area-based LNC for Sawtooth Oak and Sweetgum. However, for Maize, both R2 and RMSE changed negligibly (see Table 3). This indicates water absorption has limited effects on reducing the accuracy of LNC estimation across species using spectral indices.
As shown in Figure 5, the spectral regions with the two highest frequencies were 700–800 nm, 800–900 nm, and 1300–1400 nm for measured spectra, but were 400–500 nm, 500–600 nm, 700–800 nm, and 1200–1300 nm for water-removed spectra. Wavelengths near the red edge (750 nm) were most frequently recorded in species-specific optimal spectra indices for all three spectra types. Many selected wavelengths are located in the optical range where chlorophyll absorption dominates. Several wavelengths (1386 nm, 1378 nm, 1392 nm) are located near the inflection point in the water absorption valley at 1400 nm. After the influence of water was removed, the absorption feature of nitrogen at this wavelength was weakened. That is why water-removed species-specific spectral indices do not select wavelengths near 1400 nm. There is a wider distribution of wavelengths in species-specific optimal indices found with simulated spectra than with measured spectra. Several selected wavelengths are located in the range from 1900–2200 nm, where SNR was relatively low for measured spectra. The spectral regions that were not used for either measured nor water-removed spectra were 900–1000 nm, 1100–1200 nm, 1500–1700 nm, and 1900–2200 nm.
The smallest value of ETP in our study was 30%. This value is unacceptable because it means there is no spectral index whose R2 with nitrogen content lies in the top 30% of the R2 space for all species. This conclusion agrees with Shi, Wang, Liu and Wu [16], who proved that there is no common optimal three-band spectral index (TBSI) and normalized difference spectral index (NDSI) applicable for estimating the LNC of different crop species.

3.4. Water Absorption Did Not Reduce the Accuracy of PLSR

The performances of PLSR on maize nitrogen estimation showed little difference across the three spectra types, and the predicted R2 and the predicted root mean square error (RMSEP) were almost the same (Table 4). For the other two species, a similar pattern across the three spectra types was observed. Generally, the predictive power of PLSR using the measured spectra was the best followed by the simulated spectra, and the water-removed spectra produced the worst relationships. The difference in the predicted and simulated R2 between the measured and simulated spectra for Sawtooth Oak was tiny, while the difference for Sweetgum was greater. The results indicate that removing water-sensitive spectral regions will reduce the accuracy of PLSR.

3.5. Uncertainties

We can infer from the results of the optimal spectral indices and PLSR that water absorption has limited effects on reducing the accuracy of leaf nitrogen estimation. Therefore, it is unnecessary to remove water-sensitive spectral signatures before data processing as done by Martin and Aber [32], Serrano, Penuelas and Ustin [40], and Pellissier, Ollinger, Lepine, Palace and McDowell [29]. This preprocessing will not lead to the increase of estimation accuracy. On the contrary, it may reduce the accuracy due to the loss of spectral information.
Compared with dry leaf spectra, water free spectra simulated by PROSPECT5 preserves the biochemical and structural properties of nitrogen-containing components such as proteins, which may denature at high temperatures. However, the limitations of our water-removing technique should be addressed. We adopted the strategy of combining forward and inverse simulations, both of which contain errors. PROSPECT5 is just a simplified model of real leaf optical properties. Six parameters are included in this model: chlorophylls, carotenoids, brown pigments, structural parameter N, EWT, and dry matter. The inverse simulation may have misestimated the content of biochemical components, especially for the water content. Hosgood et al. [55] reported satisfactory results using the reflectance and transmittance spectra of the LOPEX93 data set to estimate chlorophyll, water, and dry matter, which could be retrieved with R2 of 0.67, 0.95, and 0.65, respectively. The corresponding values were lower in this study. The estimation of dry matter was the worst. Although the predicted dry matter content can be regarded as the equivalent dry matter content with fixed chemical compositions as explained in Section 3.1, the fixed absorption coefficients for dry matter in PROSPECT5 may affect the retrieval accuracy of other leaf constituents. The accuracy of the water content has marginal effects on the water-removed spectra at wavelengths with small absorptions such as the near-infrared (NIR) plateau, but it matters for spectral ranges characterized by strong water absorption since water has dominant contributions to the overall absorption. These spectral ranges are the main research objects in our study. Thus the results and conclusions depend largely on the accuracy of the inversion of biochemical constituents by PROSPECT5, and it is strongly recommended to recalibrate the absorption coefficients of dry matter in species-specific studies.

4. Conclusions

The PROSPECT5 model was used to remove the effect of water on measured leaf optical spectra. Through comparing the performances of the optimal spectral indices and partial least square regression (PLSR) before and after water removal, we observed a weaker predictive ability after water removal for the majority of spectral indices as well as for PLSR. The results indicate that water absorption has limited effects on reducing the accuracy of leaf nitrogen estimation. Removing water-sensitive spectral regions will not increase the predictive accuracy when estimating LNC with empirical methods. On the contrary, it may lead to the decrease of accuracy due to the loss of spectral information. However, we have to admit that this conclusion depends on the ability of PROSPECT5 to estimate the water free spectra with accurate absorption features of nitrogen-related molecule compounds.

Acknowledgments

This work is supported by the Key Research and Development Programs for Global Change and Adaptation (Grant No. 2016YFA0600202) and the National Natural Science Foundation of China (41671343, 41371070). We hereby express our sincere gratitude to our colleagues: Yongkang Feng, Fan Huang, Lin Yang, Xiaoman Lu, and Lun Gao, who provided their assistance for us to design and complete field experiments.

Author Contributions

Feng Qiu and Meihong Fang conceived and designed the experiments; Blowman J. Wang, Feng Qiu, Meihong Fang, and Qian Zhang performed the experiments; Blowman J. Wang and Feng Qiu analyzed the data; Fenge Chen contributed analysis tools; Blowman J. Wang wrote the paper under the guidance of Weimin Ju and Jing M. Chen.

Conflicts of Interest

The authors declare no conflict of interest.

References

  1. Vitousek, P.M.; Howarth, R.W. Nitrogen limitation on land and in the sea: How can it occur? Biogeochemistry 1991, 13, 87–115. [Google Scholar] [CrossRef]
  2. Reich, P.B.; Hobbie, S.E.; Lee, T.; Ellsworth, D.S.; West, J.B.; Tilman, D.; Knops, J.M.; Naeem, S.; Trost, J. Nitrogen limitation constrains sustainability of ecosystem response to CO2. Nature 2006, 440, 922–925. [Google Scholar] [CrossRef] [PubMed]
  3. Luo, Y.; Su, B.; Currie, W.S.; Dukes, J.S.; Finzi, A.; Hartwig, U.; Hungate, B.; McMurtrie, R.E.; Oren, R.; Parton, W.J. Progressive nitrogen limitation of ecosystem responses to rising atmospheric carbon dioxide. BioScience 2004, 54, 731–739. [Google Scholar] [CrossRef]
  4. Hungate, B.A.; Dukes, J.S.; Shaw, M.R.; Luo, Y.; Field, C.B. Nitrogen and climate change. Science 2003, 302, 1512–1513. [Google Scholar] [CrossRef] [PubMed]
  5. Evans, J.R. Photosynthesis and nitrogen relationships in leaves of c3 plants. Oecologia 1989, 78, 9–19. [Google Scholar] [CrossRef]
  6. Li, X.; Liu, X.; Liu, M.; Wu, L. Random forest algorithm and regional applications of spectral inversion model for estimating canopy nitrogen concentration in rice. J. Remote Sens. 2014, 18, 934–945. [Google Scholar]
  7. Jacquemoud, S.; Baret, F. Prospect: A model of leaf optical-properties spectra. Remote Sens. Environ. 1990, 34, 75–91. [Google Scholar] [CrossRef]
  8. Dawson, T.P.; Curran, P.J.; Plummer, S.E. Liberty—Modeling the effects of leaf biochemical concentration on reflectance spectra. Remote Sens. Environ. 1998, 65, 50–60. [Google Scholar] [CrossRef]
  9. Yamada, N.; Fujimura, S. Nondestructive measurement of chlorophyll pigment content in plant leaves from three-color reflectance and transmittance. Appl. Opt. 1991, 30, 3964–3973. [Google Scholar] [CrossRef] [PubMed]
  10. Fukshansky, L.; Fukshansky-Kazarinova, N.; Remisowsky, A.M.V. Estimation of optical parameters in a living tissue by solving the inverse problem of the multiflux radiative transfer. Appl. Opt. 1991, 30, 3145–3153. [Google Scholar] [CrossRef] [PubMed]
  11. Maheu, B.; Letoulouzan, J.N.; Gouesbet, G. Four-flux models to solve the scattering transfer equation in terms of lorenz-mie parameters. Appl. Opt. 1984, 23, 3353–3362. [Google Scholar] [CrossRef] [PubMed]
  12. Ganapol, B.D.; Johnson, L.F.; Hammer, P.D.; Hlavka, C.A.; Peterson, D.L. Leafmod: A new within-leaf radiative transfer model. Remote Sens. Environ. 1998, 63, 182–193. [Google Scholar] [CrossRef]
  13. Stitt, M.; Schulze, D. Does rubisco control the rate of photosynthesis and plant growth? An exercise in molecular ecophysiology. Plant Cell Environ. 1994, 17, 465–487. [Google Scholar] [CrossRef]
  14. Takashima, T.; Hikosaka, K.; Hirose, T. Photosynthesis or persistence: Nitrogen allocation in leaves of evergreen and deciduous quercus species. Plant Cell Environ. 2004, 27, 1047–1054. [Google Scholar] [CrossRef]
  15. Wang, Z.; Skidmore, A.K.; Darvishzadeh, R.; Heiden, U.; Heurich, M.; Wang, T. Leaf nitrogen content indirectly estimated by leaf traits derived from the prospect model. IEEE J. Sel. Top. Appl. Earth Obs. Remote Sens. 2015, 8, 3172–3182. [Google Scholar] [CrossRef]
  16. Shi, T.; Wang, J.; Liu, H.; Wu, G. Estimating leaf nitrogen concentration in heterogeneous crop plants from hyperspectral reflectance. IJRS 2015, 36, 4652–4667. [Google Scholar] [CrossRef]
  17. Yu, Q.; Wang, S.; Shi, H.; Huang, K.; Zhou, L. An evaluation of spaceborne imaging spectrometry for estimation of forest canopy nitrogen concentration in a subtropical conifer plantation of southern china. J. Resour. Ecol. 2014, 5, 1–10. [Google Scholar]
  18. Tian, Y.; Gu, K.; Chu, X.; Yao, X.; Cao, W.; Zhu, Y. Comparison of different hyperspectral vegetation indices for canopy leaf nitrogen concentration estimation in rice. Plant Soil 2014, 376, 193–209. [Google Scholar] [CrossRef]
  19. Quemada, M.; Gabriel, J.L.; Zarco-Tejada, P. Airborne hyperspectral images and ground-level optical sensors as assessment tools for maize nitrogen fertilization. Remote Sens. 2014, 6, 2940–2962. [Google Scholar] [CrossRef]
  20. Inoue, Y.; Sakaiya, E.; Zhu, Y.; Takahashi, W. Diagnostic mapping of canopy nitrogen content in rice based on hyperspectral measurements. Remote Sens. Environ. 2012, 126, 210–221. [Google Scholar] [CrossRef]
  21. Hansen, P.; Schjoerring, J. Reflectance measurement of canopy biomass and nitrogen status in wheat crops using normalized difference vegetation indices and partial least squares regression. Remote Sens. Environ. 2003, 86, 542–553. [Google Scholar] [CrossRef]
  22. Eitel, J.U.H.; Long, D.S.; Gessler, P.E.; Smith, A.M.S. Using in-situ measurements to evaluate the new rapideye™ satellite series for prediction of wheat nitrogen status. IJRS 2007, 28, 4183–4190. [Google Scholar]
  23. Muharam, F.M.; Maas, S.J.; Bronson, K.F.; Delahunty, T. Estimating cotton nitrogen nutrition status using leaf greenness and ground cover information. Remote Sens. 2015, 7, 7007–7028. [Google Scholar] [CrossRef]
  24. Kokaly, R.F.; Asner, G.P.; Ollinger, S.V.; Martin, M.E.; Wessman, C.A. Characterizing canopy biochemistry from imaging spectroscopy and its application to ecosystem studies. Remote Sens. Environ. 2009, 113, S78–S91. [Google Scholar] [CrossRef]
  25. Gitelson, A.A. Wide dynamic range vegetation index for remote quantification of biophysical characteristics of vegetation. J. Plant Physiol. 2004, 161, 165–173. [Google Scholar] [CrossRef] [PubMed]
  26. Knyazikhin, Y.; Schull, M.A.; Stenberg, P.; Mõttus, M.; Rautiainen, M.; Yang, Y.; Marshak, A.; Carmona, P.L.; Kaufmann, R.K.; Lewis, P. Hyperspectral remote sensing of foliar nitrogen content. PNAS 2013, 110, E185–E192. [Google Scholar] [CrossRef] [PubMed]
  27. Bartlett, M.K.; Ollinger, S.V.; Hollinger, D.Y.; Wicklein, H.F.; Richardson, A.D. Canopy-scale relationships between foliar nitrogen and albedo are not observed in leaf reflectance and transmittance within temperate deciduous tree species. Botany 2011, 89, 491–497. [Google Scholar] [CrossRef]
  28. Ollinger, S.; Richardson, A.; Martin, M.; Hollinger, D.; Frolking, S.; Reich, P.; Plourde, L.; Katul, G.; Munger, J.; Oren, R. Canopy nitrogen, carbon assimilation, and albedo in temperate and boreal forests: Functional relations and potential climate feedbacks. PNAS 2008, 105, 19336–19341. [Google Scholar] [CrossRef] [PubMed]
  29. Pellissier, P.A.; Ollinger, S.V.; Lepine, L.C.; Palace, M.W.; McDowell, W.H. Remote sensing of foliar nitrogen in cultivated grasslands of human dominated landscapes. Remote Sens. Environ. 2015, 167, 88–97. [Google Scholar] [CrossRef]
  30. Mitchell, J.J.; Glenn, N.F.; Sankey, T.T.; Derryberry, D.R.; Germino, M.J. Remote sensing of sagebrush canopy nitrogen. Remote Sens. Environ. 2012, 124, 217–223. [Google Scholar] [CrossRef]
  31. Martin, M.; Plourde, L.; Ollinger, S.; Smith, M.-L.; McNeil, B. A generalizable method for remote sensing of canopy nitrogen across a wide range of forest ecosystems. Remote Sens. Environ. 2008, 112, 3511–3519. [Google Scholar] [CrossRef]
  32. Martin, M.E.; Aber, J.D. High spectral resolution remote sensing of forest canopy lignin, nitrogen, and ecosystem processes. Ecol. Appl. 1997, 7, 431–443. [Google Scholar] [CrossRef]
  33. Wessman, C.A.; Aber, J.D.; Peterson, D.L.; Melillo, J.M. Foliar analysis using near infrared reflectance spectroscopy. Can. J. For. Res. 1988, 18, 6–11. [Google Scholar] [CrossRef]
  34. Wessman, C.A.; Aber, J.D.; Peterson, D.L.; Melillo, J.M. Remote sensing of canopy chemistry and nitrogen cycling in temperate forest ecosystems. Nature 1988, 335, 154–156. [Google Scholar] [CrossRef]
  35. Feilhauer, H.; Asner, G.P.; Martin, R.E. Multi-method ensemble selection of spectral bands related to leaf biochemistry. Remote Sens. Environ. 2015, 164, 57–65. [Google Scholar] [CrossRef]
  36. Zhao, K.; Valle, D.; Popescu, S.; Zhang, X.; Mallick, B. Hyperspectral remote sensing of plant biochemistry using bayesian model averaging with variable and band selection. Remote Sens. Environ. 2013, 132, 102–119. [Google Scholar] [CrossRef]
  37. Kalacska, M.; Lalonde, M.; Moore, T.R. Estimation of foliar chlorophyll and nitrogen content in an ombrotrophic bog from hyperspectral data: Scaling from leaf to image. Remote Sens. Environ. 2015, 169, 270–279. [Google Scholar] [CrossRef]
  38. Curran, P.J. Remote sensing of foliar chemistry. Remote Sens. Environ. 1989, 30, 271–278. [Google Scholar] [CrossRef]
  39. Axelsson, C.; Skidmore, A.K.; Schlerf, M.; Fauzi, A.; Verhoef, W. Hyperspectral analysis of mangrove foliar chemistry using plsr and support vector regression. IJRS 2013, 34, 1724–1743. [Google Scholar] [CrossRef]
  40. Serrano, L.; Penuelas, J.; Ustin, S.L. Remote sensing of nitrogen and lignin in mediterranean vegetation from aviris data: Decomposing biochemical from structural signals. Remote Sens. Environ. 2002, 81, 355–364. [Google Scholar] [CrossRef]
  41. Gao, B.-C.; Goetz, A.F.H. Extraction of dry leaf spectral features from reflectance spectra of green vegetation. Remote Sens. Environ. 1994, 47, 369–374. [Google Scholar] [CrossRef]
  42. Schlerf, M.; Atzberger, C.; Hill, J.; Buddenbaum, H.; Werner, W.; Schüler, G. Retrieval of chlorophyll and nitrogen in norway spruce (picea abies l. Karst.) using imaging spectroscopy. IJAEO 2010, 12, 17–26. [Google Scholar] [CrossRef]
  43. Ramoelo, A.; Skidmore, A.K.; Schlerf, M.; Mathieu, R.; Heitkönig, I.M.A. Water-removed spectra increase the retrieval accuracy when estimating savanna grass nitrogen and phosphorus concentrations. IJPRS 2011, 66, 408–417. [Google Scholar] [CrossRef]
  44. Allen, W.A.; Gausman, H.W.; Richardson, A.J.; Thomas, J.R. Interaction of isotropic light with a compact plant leaf. J. Opt. Soc. Am. 1969, 59, 1376–1379. [Google Scholar] [CrossRef]
  45. Lichtenthaler, H.K. [34] chlorophylls and carotenoids: Pigments of photosynthetic biomembranes. Methods Enzymol. 1987, 148, 350–382. [Google Scholar]
  46. Jacquemoud, S.; Ustin, S.; Verdebout, J.; Schmuck, G.; Andreoli, G.; Hosgood, B. Estimating leaf biochemistry using the prospect leaf optical properties model. Remote Sens. Environ. 1996, 56, 194–202. [Google Scholar] [CrossRef]
  47. Baret, F.; Fourty, T. Estimation of leaf water content and specific leaf weight from reflectance and transmittance measurements. Agronomie 1997, 17, 455–464. [Google Scholar] [CrossRef]
  48. Fourty, T.; Baret, F.; Jacquemoud, S.; Schmuck, G.; Verdebout, J. Leaf optical properties with explicit description of its biochemical composition: Direct and inverse problems. Remote Sens. Environ. 1996, 56, 104–117. [Google Scholar] [CrossRef]
  49. Feret, J.-B.; François, C.; Asner, G.P.; Gitelson, A.A.; Martin, R.E.; Bidel, L.P.; Ustin, S.L.; le Maire, G.; Jacquemoud, S. Prospect-4 and 5: Advances in the leaf optical properties model separating photosynthetic pigments. Remote Sens. Environ. 2008, 112, 3030–3043. [Google Scholar] [CrossRef]
  50. Tsai, F.; Philpot, W. Derivative analysis of hyperspectral data. Remote Sens. Environ. 1998, 66, 41–51. [Google Scholar] [CrossRef]
  51. Kramer, R. Chemometric Techniques for Quantitative Analysis; CRC Press: Boca Raton, FL, USA, 1998. [Google Scholar]
  52. Kokaly, R.F. Investigating a physical basis for spectroscopic estimates of leaf nitrogen concentration. Remote Sens. Environ. 2001, 75, 153–161. [Google Scholar] [CrossRef]
  53. Kokaly, R.F.; Clark, R.N. Spectroscopic determination of leaf biochemistry using band-depth analysis of absorption features and stepwise multiple linear regression. Remote Sens. Environ. 1999, 67, 267–287. [Google Scholar] [CrossRef]
  54. Bolster, K.L.; Martin, M.E.; Aber, J.D. Determination of carbon fraction and nitrogen concentration in tree foliage by near infrared reflectances: A comparison of statistical methods. Can. J. For. Res. 1996, 26, 590–600. [Google Scholar] [CrossRef]
  55. Hosgood, B.; Jacquemoud, S.; Andreoli, G.; Verdebout, J.; Pedrini, G.; Schmuck, G. Leaf Optical Properties Experiment 93 (lopex93); European Commision, Joint Research Center, Institute for Remote Sensing Applications Report EUR 16095 EN; European Commission, Joint Research Centre: Ispra, Italy, 1995. [Google Scholar]
Figure 1. Temporal variations of the area-based LNC for three species. The bottom and top of the box are the first and third quartiles. The band inside the box is the median. The ends of the whiskers represent upper and lower extremes.
Remotesensing 09 00291 g001
Figure 2. Main steps to finding the cross-species spectral index under a certain top percentile, taking Normalized Difference Spectral Index (NDSI) as an example.
Remotesensing 09 00291 g002
Figure 3. Measured versus modeled biochemical constituents for Maize (Zea mays L.) using PROSPECT5 inversion. (a) chlorophyll; (b) carotenoid; (c) water and (d) dry matter.
Remotesensing 09 00291 g003
Figure 4. Comparisons on reflectance and their R2 value with area-based LNC across three species. (a) Maize (Zea mays L.); (b) Sawtooth Oak (Quercus acutissima); (c) Sweetgum (Liquidambar formosana). The legend of the spectra type is given in (a). Only R2 values at the 0.01 significance level were presented.
Remotesensing 09 00291 g004
Figure 5. Histogram of the wavelength frequency in the species-specific optimal spectral indices.
Remotesensing 09 00291 g005
Table 1. The statistics of the sampling data in 2014.
SpeciesDate 1SiteNo. SamplesArea-Based LNC (g/m2) *
MinMaxMean
Maize (Zea mays L.)8/11, 8/22, 9/6, 9/21NUIST1120.561.370.96
Sawtooth Oak (Quercus acutissima)6/24, 7/21, 9/16, 10/14Xiashu791.573.252.36
Sweetgum (Liquidambar formosana)6/24, 7/21, 9/16, 10/14Xiashu400.922.781.49
1 the date format is mm/dd. * LNC stands for leaf nitrogen concentration.
Table 2. Statistics of the species-specific optimal spectral indices.
SpectraSpeciesSI *λ1 (nm)λ2 (nm)R2RMSE (g/m2)
MeasuredMaize (Zea mays L.)NDSI71517500.810.09
RSI56013860.820.09
NDSI1st6947490.800.09
RSI1st13927390.820.09
Sawtooth Oak (Quercus acutissima)NDSI7508150.440.29
RSI7508150.450.29
NDSI1st56113780.460.29
RSI1st13785610.480.28
Sweetgum (Liquidambar formosana)NDSI47622350.560.27
RSI14464760.580.27
NDSI1st6738600.600.26
RSI1st22218070.600.26
SimulatedMaize (Zea mays L.)NDSI7157160.820.09
RSI69713810.830.08
NDSI1st6529410.820.08
RSI1st15357360.830.08
Sawtooth Oak (Quercus acutissima)NDSI153318540.410.30
RSI112420460.410.30
NDSI1st76719370.500.27
RSI1st77119330.530.27
Sweetgum (Liquidambar formosana)NDSI218122420.440.31
RSI20764000.450.30
NDSI1st192221970.630.25
RSI1st193817710.580.27
Water-removedMaize (Zea mays L.)NDSI7157160.820.09
RSI7027240.820.09
NDSI1st5785830.820.09
RSI1st6035790.820.09
Sawtooth Oak (Quercus acutissima)NDSI5636930.280.33
RSI6935600.280.33
NDSI1st43112940.350.31
RSI1st43112940.340.32
Sweetgum (Liquidambar formosana)NDSI78212770.330.34
RSI40018960.330.34
NDSI1st43012860.460.30
RSI1st10328650.350.33
* SI stands for spectral index.
Table 3. Statistics of the cross-species optimal spectral indices.
SpectraSI *λ1 (nm)λ2 (nm)ETP (%)Maize (Zea mays L.)Sawtooth oak (Quercus acutissima)Sweetgum (Liquidambar formosana)
R2RMSE (g/m2)R2RMSE (g/m2)R2RMSE (g/m2)
measuredNDSI615705340.540.170.310.190.390.17
RSI705616340.550.170.310.190.380.17
NDSI1st6991356420.480.180.330.190.360.18
RSI1st7081390380.520.170.420.180.380.17
simulatedNDSI488731460.500.180.220.200.240.19
RSI5052095420.490.180.240.200.260.19
NDSI1st6991931420.490.180.360.190.360.18
RSI1st7031929400.550.170.390.180.350.18
water-removedNDSI420734340.550.170.200.210.220.20
RSI447734320.560.170.200.210.230.19
NDSI1st5651357440.460.180.200.210.280.19
RSI1st1292704300.600.160.270.200.250.19
* SI stands for spectral index.
Table 4. Statistics of the partial least square regression (PLSR) results.
SpeciesSpectraRMSEP*(g/m2)R2 PredictedNo. Components
Maize (Zea mays L.)Measured0.100.803
Simulated0.090.837
Water-removed0.090.827
Sawtooth Oak (Quercus acutissima)Measured0.280.563
Simulated0.300.514
Water-removed0.350.335
Sweetgum (Liquidambar formosana)Measured0.320.814
Simulated0.320.586
Water-removed0.36 1
* RMSEP is the predicted root mean square error.

