Next Issue
Volume 9, May
Previous Issue
Volume 9, March
 
 
remotesensing-logo

Journal Browser

Journal Browser

Remote Sens., Volume 9, Issue 4 (April 2017) – 96 articles

Cover Story (view full-size image): 
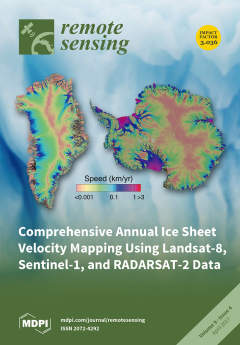
Ice sheets hold the largest potential for sea level rise in the upcoming decades to centuries and represent the largest source of uncertainty for projections. Ice sheet surface velocity is a fundamental observable aspect of their dynamics that has only recently become available from space. This provides essential information for assessments of past, current and future contributions to sea level, and our understanding of the physics of ice flow. In this issue, Mouginot et al., funded through the NASA’s MEaSUREs program, have developed a new methodology to fuse multisensor data sources, including CSA's RADARSAT-2, ESA's Sentinel-1 and USGS's Landsat-8, to form coherent and comprehensive time series of ice velocity over the entire Antarctic and Greenland ice sheets. These measurements of ice motion over the ice sheets provide a quantum leap improvement of observational constraints for ice sheet numerical [...] Read more.
Order results
Result details
Section
Select all
Export citation of selected articles as:
17366 KiB  
Article
Interference of Heavy Aerosol Loading on the VIIRS Aerosol Optical Depth (AOD) Retrieval Algorithm
by Yang Wang, Liangfu Chen, Shenshen Li, Xinhui Wang, Chao Yu, Yidan Si and Zili Zhang
Remote Sens. 2017, 9(4), 397; https://doi.org/10.3390/rs9040397 - 23 Apr 2017
Cited by 24 | Viewed by 6728
Abstract
Aerosol optical depth (AOD) has been widely used in climate research, atmospheric environmental observations, and other applications. However, high AOD retrieval remains challenging over heavily polluted regions, such as the North China Plain (NCP). The Visible Infrared Imaging Radiometer Suite (VIIRS), which was [...] Read more.
Aerosol optical depth (AOD) has been widely used in climate research, atmospheric environmental observations, and other applications. However, high AOD retrieval remains challenging over heavily polluted regions, such as the North China Plain (NCP). The Visible Infrared Imaging Radiometer Suite (VIIRS), which was designed as a successor to the Moderate Resolution Imaging Spectroradiometer (MODIS), will undertake the aerosol observations mission in the coming years. Using the VIIRS AOD retrieval algorithm as an example, we analyzed the influence of heavy aerosol loading through the 6SV radiative transfer model (RTM) with a focus on three aspects: cloud masking, ephemeral water body tests, and data quality estimation. First, certain pixels were mistakenly screened out as clouds and ephemeral water bodies because of heavy aerosols, resulting in the loss of AOD retrievals. Second, the greenness of the surface could not be accurately identified by the top of atmosphere (TOA) index, and the quality of the aggregation data may be artificially high. Thus, the AOD retrieval algorithm did not perform satisfactorily, indicated by the low availability of data coverage (at least 37.97% of all data records were missing according to ground-based observations) and overestimation of the data quality (high-quality data increased from 63.42% to 80.97% according to radiative simulations). To resolve these problems, the implementation of a spatial variability cloud mask method and surficial index are suggested in order to improve the algorithm. Full article
(This article belongs to the Special Issue Remote Sensing of Atmospheric Pollution)
Show Figures

Graphical abstract

26468 KiB  
Article
Soil Moisture Estimation over Vegetated Agricultural Areas: Tigris Basin, Turkey from Radarsat-2 Data by Polarimetric Decomposition Models and a Generalized Regression Neural Network
by Mehmet Siraç Özerdem, Emrullah Acar and Remzi Ekinci
Remote Sens. 2017, 9(4), 395; https://doi.org/10.3390/rs9040395 - 23 Apr 2017
Cited by 25 | Viewed by 6651
Abstract
Determining the soil moisture in agricultural fields is a significant parameter to use irrigation systems efficiently. In contrast to standard soil moisture measurements, good results might be acquired in a shorter time over large areas by remote sensing tools. In order to estimate [...] Read more.
Determining the soil moisture in agricultural fields is a significant parameter to use irrigation systems efficiently. In contrast to standard soil moisture measurements, good results might be acquired in a shorter time over large areas by remote sensing tools. In order to estimate the soil moisture over vegetated agricultural areas, a relationship between Radarsat-2 data and measured ground soil moistures was established by polarimetric decomposition models and a generalized regression neural network (GRNN). The experiments were executed over two agricultural sites on the Tigris Basin, Turkey. The study consists of four phases. In the first stage, Radarsat-2 data were acquired on different dates and in situ measurements were implemented simultaneously. In the second phase, the Radarsat-2 data were pre-processed and the GPS coordinates of the soil sample points were imported to this data. Then the standard sigma backscattering coefficients with the Freeman–Durden and H/A/α polarimetric decomposition models were employed for feature extraction and a feature vector with four sigma backscattering coefficients (σhh, σhv, σvh, and σvv) and six polarimetric decomposition parameters (entropy, anisotropy, alpha angle, volume scattering, odd bounce, and double bounce) were generated for each pattern. In the last stage, GRNN was used to estimate the regional soil moisture with the aid of feature vectors. The results indicated that radar is a strong remote sensing tool for soil moisture estimation, with mean absolute errors around 2.31 vol %, 2.11 vol %, and 2.10 vol % for Datasets 1–3, respectively; and 2.46 vol %, 2.70 vol %, 7.09 vol %, and 5.70 vol % on Datasets 1 & 2, 2 & 3, 1 & 3, and 1 & 2 & 3, respectively. Full article
Show Figures

Figure 1

7727 KiB  
Article
Simulated Imagery Rendering Workflow for UAS-Based Photogrammetric 3D Reconstruction Accuracy Assessments
by Richard K. Slocum and Christopher E. Parrish
Remote Sens. 2017, 9(4), 396; https://doi.org/10.3390/rs9040396 - 22 Apr 2017
Cited by 24 | Viewed by 6476
Abstract
Structure from motion (SfM) and MultiView Stereo (MVS) algorithms are increasingly being applied to imagery from unmanned aircraft systems (UAS) to generate point cloud data for various surveying and mapping applications. To date, the options for assessing the spatial accuracy of the SfM-MVS [...] Read more.
Structure from motion (SfM) and MultiView Stereo (MVS) algorithms are increasingly being applied to imagery from unmanned aircraft systems (UAS) to generate point cloud data for various surveying and mapping applications. To date, the options for assessing the spatial accuracy of the SfM-MVS point clouds have primarily been limited to empirical accuracy assessments, which involve comparisons against reference data sets, which are both independent and of higher accuracy than the data they are being used to test. The acquisition of these reference data sets can be expensive, time consuming, and logistically challenging. Furthermore, these experiments are also almost always unable to be perfectly replicated and can contain numerous confounding variables, such as sun angle, cloud cover, wind, movement of objects in the scene, and camera thermal noise, to name a few. The combination of these factors leads to a situation in which robust, repeatable experiments are cost prohibitive, and the experiment results are frequently site-specific and condition-specific. Here, we present a workflow to render computer generated imagery using a virtual environment which can mimic the independent variables that would be experienced in a real-world UAS imagery acquisition scenario. The resultant modular workflow utilizes Blender, an open source computer graphics software, for the generation of photogrammetrically-accurate imagery suitable for SfM processing, with explicit control of camera interior orientation, exterior orientation, texture of objects in the scene, placement of objects in the scene, and ground control point (GCP) accuracy. The challenges and steps required to validate the photogrammetric accuracy of computer generated imagery are discussed, and an example experiment assessing accuracy of an SfM derived point cloud from imagery rendered using a computer graphics workflow is presented. The proposed workflow shows promise as a useful tool for sensitivity analysis and SfM-MVS experimentation. Full article
Show Figures

Graphical abstract

2981 KiB  
Article
Extrapolating Forest Canopy Fuel Properties in the California Rim Fire by Combining Airborne LiDAR and Landsat OLI Data
by Mariano García, Sassan Saatchi, Angeles Casas, Alexander Koltunov, Susan L. Ustin, Carlos Ramirez and Heiko Balzter
Remote Sens. 2017, 9(4), 394; https://doi.org/10.3390/rs9040394 - 22 Apr 2017
Cited by 34 | Viewed by 6339
Abstract
Accurate, spatially explicit information about forest canopy fuel properties is essential for ecosystem management strategies for reducing the severity of forest fires. Airborne LiDAR technology has demonstrated its ability to accurately map canopy fuels. However, its geographical and temporal coverage is limited, thus [...] Read more.
Accurate, spatially explicit information about forest canopy fuel properties is essential for ecosystem management strategies for reducing the severity of forest fires. Airborne LiDAR technology has demonstrated its ability to accurately map canopy fuels. However, its geographical and temporal coverage is limited, thus making it difficult to characterize fuel properties over large regions before catastrophic events occur. This study presents a two-step methodology for integrating post-fire airborne LiDAR and pre-fire Landsat OLI (Operational Land Imager) data to estimate important pre-fire canopy fuel properties for crown fire spread, namely canopy fuel load (CFL), canopy cover (CC), and canopy bulk density (CBD). This study focused on a fire prone area affected by the large 2013 Rim fire in the Sierra Nevada Mountains, California, USA. First, LiDAR data was used to estimate CFL, CC, and CBD across an unburned 2 km buffer with similar structural characteristics to the burned area. Second, the LiDAR-based canopy fuel properties were extrapolated over the whole area using Landsat OLI data, which yielded an R2 of 0.8, 0.79, and 0.64 and RMSE of 3.76 Mg·ha−1, 0.09, and 0.02 kg·m−3 for CFL, CC, and CBD, respectively. The uncertainty of the estimates was estimated for each pixel using a bootstrapping approach, and the 95% confidence intervals are reported. The proposed methodology provides a detailed spatial estimation of forest canopy fuel properties along with their uncertainty that can be readily integrated into fire behavior and fire effects models. The methodology could be also integrated into the LANDFIRE program to improve the information on canopy fuels. Full article
Show Figures

Graphical abstract

12719 KiB  
Article
Hyperspectral and Multispectral Retrieval of Suspended Sediment in Shallow Coastal Waters Using Semi-Analytical and Empirical Methods
by Xiaochi Zhou, Marco Marani, John D. Albertson and Sonia Silvestri
Remote Sens. 2017, 9(4), 393; https://doi.org/10.3390/rs9040393 - 21 Apr 2017
Cited by 14 | Viewed by 4749
Abstract
Natural lagoons and estuaries worldwide are experiencing accelerated ecosystem degradation due to increased anthropogenic pressure. As a key driver of coastal zone dynamics, suspended sediment concentration (SSC) is difficult to monitor with adequate spatial and temporal resolutions both in the field and using [...] Read more.
Natural lagoons and estuaries worldwide are experiencing accelerated ecosystem degradation due to increased anthropogenic pressure. As a key driver of coastal zone dynamics, suspended sediment concentration (SSC) is difficult to monitor with adequate spatial and temporal resolutions both in the field and using remote sensing. In particular, the spatial resolutions of currently available remote sensing data generated by satellite sensors designed for ocean color retrieval, such as MODIS (Moderate Resolution Imaging Spectroradiometer) or SeaWiFS (Sea-Viewing Wide Field-of-View Sensor), are too coarse to capture the dimension and geomorphological heterogeneity of most estuaries and lagoons. In the present study, we explore the use of hyperspectral (Hyperion) and multispectral data, i.e., the Landsat TM (Thematic Mapper) and ETM+ (Enhanced Thematic Mapper Plus), ASTER (Advanced Spaceborne Thermal Emission and Reflection Radiometer), and ALOS (Advanced Land Observing Satellite), to estimate SSC through semi-analytical and empirical approaches in the Venice lagoon (Italy). Key parameters of the retrieval models are calibrated and cross-validated by matching the remote sensing estimates of SSC with in situ data from a network of water quality sensors. Our analysis shows that, despite the higher spectral resolution, hyperspectral data provide limited advantages over the use of multispectral data, mainly due to information redundancy and cross-band correlation. Meanwhile, the limited historical archive of hyperspectral data (usually acquired on demand) severely reduces the chance of observing high turbidity events, which are relatively rare but critical in controlling the coastal sediment and geomorphological dynamics. On the contrary, retrievals using available multispectral data can encompass a much wider range of SSC values due to their frequent acquisitions and longer historical archive. For the retrieval methods considered in this study, we find that the semi-analytical method outperforms empirical approaches, when applied to both the hyperspectral and multispectral dataset. Interestingly, the improved performance emerges more clearly when the data used for testing are kept separated from those used in the calibration, suggesting a greater ability of semi-analytical models to “generalize” beyond the specific data set used for model calibration. Full article
Show Figures

Graphical abstract

6406 KiB  
Article
Modeling Biomass Production in Seasonal Wetlands Using MODIS NDVI Land Surface Phenology
by Maria Lumbierres, Pablo F. Méndez, Javier Bustamante, Ramón Soriguer and Luis Santamaría
Remote Sens. 2017, 9(4), 392; https://doi.org/10.3390/rs9040392 - 21 Apr 2017
Cited by 75 | Viewed by 10942
Abstract
Plant primary production is a key driver of several ecosystem functions in seasonal marshes, such as water purification and secondary production by wildlife and domestic animals. Knowledge of the spatio-temporal dynamics of biomass production is therefore essential for the management of resources—particularly in [...] Read more.
Plant primary production is a key driver of several ecosystem functions in seasonal marshes, such as water purification and secondary production by wildlife and domestic animals. Knowledge of the spatio-temporal dynamics of biomass production is therefore essential for the management of resources—particularly in seasonal wetlands with variable flooding regimes. We propose a method to estimate standing aboveground plant biomass using NDVI Land Surface Phenology (LSP) derived from MODIS, which we calibrate and validate in the Doñana National Park’s marsh vegetation. Out of the different estimators tested, the Land Surface Phenology maximum NDVI (LSP-Maximum-NDVI) correlated best with ground-truth data of biomass production at five locations from 2001–2015 used to calibrate the models (R2 = 0.65). Estimators based on a single MODIS NDVI image performed worse (R2 ≤ 0.41). The LSP-Maximum-NDVI estimator was robust to environmental variation in precipitation and hydroperiod, and to spatial variation in the productivity and composition of the plant community. The determination of plant biomass using remote-sensing techniques, adequately supported by ground-truth data, may represent a key tool for the long-term monitoring and management of seasonal marsh ecosystems. Full article
(This article belongs to the Special Issue Remote Sensing of Above Ground Biomass)
Show Figures

Graphical abstract

14257 KiB  
Article
A Novel Pan-Sharpening Framework Based on Matting Model and Multiscale Transform
by Yong Yang, Weiguo Wan, Shuying Huang, Pan Lin and Yue Que
Remote Sens. 2017, 9(4), 391; https://doi.org/10.3390/rs9040391 - 21 Apr 2017
Cited by 49 | Viewed by 7541
Abstract
Pan-sharpening aims to sharpen a low spatial resolution multispectral (MS) image by combining the spatial detail information extracted from a panchromatic (PAN) image. An effective pan-sharpening method should produce a high spatial resolution MS image while preserving more spectral information. Unlike traditional intensity-hue-saturation [...] Read more.
Pan-sharpening aims to sharpen a low spatial resolution multispectral (MS) image by combining the spatial detail information extracted from a panchromatic (PAN) image. An effective pan-sharpening method should produce a high spatial resolution MS image while preserving more spectral information. Unlike traditional intensity-hue-saturation (IHS)- and principal component analysis (PCA)-based multiscale transform methods, a novel pan-sharpening framework based on the matting model (MM) and multiscale transform is presented in this paper. First, we use the intensity component (I) of the MS image as the alpha channel to generate the spectral foreground and background. Then, an appropriate multiscale transform is utilized to fuse the PAN image and the upsampled I component to obtain the fused high-resolution gray image. In the fusion, two preeminent fusion rules are proposed to fuse the low- and high-frequency coefficients in the transform domain. Finally, the high-resolution sharpened MS image is obtained by linearly compositing the fused gray image with the upsampled foreground and background images. The proposed framework is the first work in the pan-sharpening field. A large number of experiments were tested on various satellite datasets; the subjective visual and objective evaluation results indicate that the proposed method performs better than the IHS- and PCA-based frameworks, as well as other state-of-the-art pan-sharpening methods both in terms of spatial quality and spectral maintenance. Full article
Show Figures

Graphical abstract

4319 KiB  
Article
Evapotranspiration Mapping in a Heterogeneous Landscape Using Remote Sensing and Global Weather Datasets: Application to the Mara Basin, East Africa
by Tadesse Alemayehu, Ann van Griensven, Gabriel B. Senay and Willy Bauwens
Remote Sens. 2017, 9(4), 390; https://doi.org/10.3390/rs9040390 - 20 Apr 2017
Cited by 41 | Viewed by 6556
Abstract
Actual evapotranspiration (ET) is a major water use flux in a basin water balance with crucial significance for water resources management and planning. Mapping ET with good accuracy has been the subject of ongoing research. Such mapping is even more challenging [...] Read more.
Actual evapotranspiration (ET) is a major water use flux in a basin water balance with crucial significance for water resources management and planning. Mapping ET with good accuracy has been the subject of ongoing research. Such mapping is even more challenging in heterogeneous and data-scarce regions. The main objective of our research is to estimate ET using daily Moderate Resolution Imaging Spectroradiometer (MODIS) land surface temperature and Global Land Data Assimilation System (GLDAS) weather datasets based on the operational simplified surface energy balance (SSEBop) algorithm at a 1-km spatial scale and 8-day temporal resolution for the Mara Basin (Kenya/Tanzania). Unlike previous studies where the SSEBop algorithm was used, we use a seasonally-varying calibration coefficient for determining the “cold” reference temperature. Our results show that ET is highly variable, with a high inter-quartile range for wetlands and evergreen forest (24% to 29% of the median) and even up to 52% of the median for herbaceous land cover and rainfed agriculture. The basin average ET accounts for about 66% of the rainfall with minimal inter-annual variability. The basin scale validation using nine-years of monthly, gridded global flux tower-based ET (GFET) data reveals that our ET is able to explain 64% of the variance in GFET while the MOD16-NB (Nile Basin) explains 72%. We also observe a percent of bias (PBIAS) of 1.1% and 2.8%, respectively for SSEBop ET and MOD16-NB, indicating a good reliability in the ET estimates. Additionally, the SSEBop ET explains about 52% of the observed variability in the Normalized Difference Vegetation Index (NDVI) for a 16-day temporal resolution and 81% for the annual resolution, pointing to an increased reliability for longer aggregation periods. The annual SSEBop ET estimates are also consistent with the underlying primary (i.e., water and energy) and secondary (i.e., soil, topography, geology, land cover, etc.) controlling factors across the basin. This paper demonstrated how to effectively estimate and evaluate spatially-distributed and temporally-varying ET in data-scarce regions that can be applied elsewhere in the world where observed hydro-meteorological variables are limited. Full article
Show Figures

Graphical abstract

10570 KiB  
Article
Unassisted Quantitative Evaluation of Despeckling Filters
by Luis Gomez, Raydonal Ospina and Alejandro C. Frery
Remote Sens. 2017, 9(4), 389; https://doi.org/10.3390/rs9040389 - 20 Apr 2017
Cited by 68 | Viewed by 6692
Abstract
SAR (Synthetic Aperture Radar) imaging plays a central role in Remote Sensing due to, among other important features, its ability to provide high-resolution, day-and-night and almost weather-independent images. SAR images are affected from a granular contamination, speckle, that can be described by a [...] Read more.
SAR (Synthetic Aperture Radar) imaging plays a central role in Remote Sensing due to, among other important features, its ability to provide high-resolution, day-and-night and almost weather-independent images. SAR images are affected from a granular contamination, speckle, that can be described by a multiplicative model. Many despeckling techniques have been proposed in the literature, as well as measures of the quality of the results they provide. Assuming the multiplicative model, the observed image Z is the product of two independent fields: the backscatter X and the speckle Y. The result of any speckle filter is X ^ , an estimator of the backscatter X, based solely on the observed data Z. An ideal estimator would be the one for which the ratio of the observed image to the filtered one I = Z / X ^ is only speckle: a collection of independent identically distributed samples from Gamma variates. We, then, assess the quality of a filter by the closeness of I to the hypothesis that it is adherent to the statistical properties of pure speckle. We analyze filters through the ratio image they produce with regards to first- and second-order statistics: the former check marginal properties, while the latter verifies lack of structure. A new quantitative image-quality index is then defined, and applied to state-of-the-art despeckling filters. This new measure provides consistent results with commonly used quality measures (equivalent number of looks, PSNR, MSSIM, β edge correlation, and preservation of the mean), and ranks the filters results also in agreement with their visual analysis. We conclude our study showing that the proposed measure can be successfully used to optimize the (often many) parameters that define a speckle filter. Full article
(This article belongs to the Special Issue Learning to Understand Remote Sensing Images)
Show Figures

Graphical abstract

14675 KiB  
Article
A Glacier Surge of Bivachny Glacier, Pamir Mountains, Observed by a Time Series of High-Resolution Digital Elevation Models and Glacier Velocities
by Anja Wendt, Christoph Mayer, Astrid Lambrecht and Dana Floricioiu
Remote Sens. 2017, 9(4), 388; https://doi.org/10.3390/rs9040388 - 20 Apr 2017
Cited by 35 | Viewed by 7650
Abstract
Surge-type glaciers are characterised by relatively short phases of enhanced ice transport and mass redistribution after a comparatively long quiescent phase when the glacier is virtually inactive. This unstable behaviour makes it difficult to assess the influence of climate change on those glaciers. [...] Read more.
Surge-type glaciers are characterised by relatively short phases of enhanced ice transport and mass redistribution after a comparatively long quiescent phase when the glacier is virtually inactive. This unstable behaviour makes it difficult to assess the influence of climate change on those glaciers. We describe the evolution of the most recent surge of Bivachny Glacier in the Pamir Mountains, Tajikistan between 2011 and 2015 with respect to changes in its topography and dynamics. For the relevant time span, nine digital elevation models were derived from TanDEM-X data; optical satellite data (Landsat 5, 7 and 8, EO-1) as well as synthetic aperture radar data (TerraSAR-X and TanDEM-X) were used to analyse ice flow velocities. The comparison of the topography at the beginning of the surge with the one observed by the Shuttle Radar Topography Mission in 2000 revealed a thickening in the upper part of the ablation area of the glacier and a thinning further down the glacier as is typically observed during the quiescent phase. During the active phase, a surge bulge measuring up to around 80 m developed and travelled downstream for a distance of 13 km with a mean velocity of 4400 m year−1. Ice flow velocities increased from below 90 m year−1 duringthe quiescent phase in 2000 to up to 3400 m year−1 in spring 2014. After reaching the confluence with Fedchenko Glacier, the surge slowed down until it completely terminated in 2015. The observed seasonality of the glacier velocities with a regular speed-up during the onset of the melt period suggests a hydrological control of the surge related to the effectiveness of the subglacial drainage system. Full article
(This article belongs to the Special Issue Remote Sensing of Glaciers)
Show Figures

Graphical abstract

8617 KiB  
Article
A Fuzzy-GA Based Decision Making System for Detecting Damaged Buildings from High-Spatial Resolution Optical Images
by Milad Janalipour and Ali Mohammadzadeh
Remote Sens. 2017, 9(4), 349; https://doi.org/10.3390/rs9040349 - 20 Apr 2017
Cited by 27 | Viewed by 5675
Abstract
In this research, a semi-automated building damage detection system is addressed under the umbrella of high-spatial resolution remotely sensed images. The aim of this study was to develop a semi-automated fuzzy decision making system using Genetic Algorithm (GA). Our proposed system contains four [...] Read more.
In this research, a semi-automated building damage detection system is addressed under the umbrella of high-spatial resolution remotely sensed images. The aim of this study was to develop a semi-automated fuzzy decision making system using Genetic Algorithm (GA). Our proposed system contains four main stages. In the first stage, post-event optical images were pre-processed. In the second stage, textural features were extracted from the pre-processed post-event optical images using Haralick texture extraction method. Afterwards, in the third stage, a semi-automated Fuzzy-GA (Fuzzy Genetic Algorithm) decision making system was used to identify damaged buildings from the extracted texture features. In the fourth stage, a comprehensive sensitivity analysis was performed to achieve parameters of GA leading to more accurate results. Finally, the accuracy of results was assessed using check and test samples. The proposed system was tested over the 2010 Haiti earthquake (Area 1 and Area 2) and the 2003 Bam earthquake (Area 3). The proposed system resulted in overall accuracies of 76.88 ± 1.22%, 65.43 ± 0.29%, and 90.96 ± 0.15% over Area 1, Area 2, and Area 3, respectively. On the one hand, based on the concept of the proposed Fuzzy-GA decision making system, the automation level of this system is higher than other existing systems. On the other hand, based on the accuracy of our proposed system and four advanced machine learning techniques, i.e., bagging, boosting, random forests, and support vector machine, in the detection of damaged buildings, it seems that our proposed system is robust and efficient. Full article
(This article belongs to the Special Issue Learning to Understand Remote Sensing Images)
Show Figures

Graphical abstract

2031 KiB  
Article
Evaluation and Improvement of SMOS and SMAP Soil Moisture Products for Soils with High Organic Matter over a Forested Area in Northeast China
by Mengjie Jin, Xingming Zheng, Tao Jiang, Xiaofeng Li, Xiao-Jie Li and Kai Zhao
Remote Sens. 2017, 9(4), 387; https://doi.org/10.3390/rs9040387 - 19 Apr 2017
Cited by 23 | Viewed by 4483
Abstract
Soil moisture (SM) retrieval from SMOS (the Soil Moisture and Ocean Salinity mission) and SMAP (the Soil Moisture Active/Passive mission) passive microwave data over forested areas with required accuracy is of great significance and poses some challenges. In this paper, we [...] Read more.
Soil moisture (SM) retrieval from SMOS (the Soil Moisture and Ocean Salinity mission) and SMAP (the Soil Moisture Active/Passive mission) passive microwave data over forested areas with required accuracy is of great significance and poses some challenges. In this paper, we used Ground Wireless Sensor Network (GWSN) SM measurements from 9 September to 5 November 2015 to validate SMOS and SMAP Level 3 (L3) SM products over forested areas in northeastern China. Our results found that neither SMOS nor SMAP L3 SM products were ideal, with respective RMSE (root mean square error) values of 0.31 cm3/cm3 and 0.17 cm3/cm3. Nevertheless, some improvements in SM retrieval might be achievable through refinements of the soil dielectric model with respect to high percentage of soil organic matter (SOM) in the forested area. To that end, the potential of the semi-empirical soil dielectric model proposed by Jun Liu (Liu’s model) in improving SM retrieval results over forested areas was investigated. Introducing Liu’s model into the retrieval algorithms of both SMOS and SMAP missions produced promising results. For SMAP, the RMSE of L3 SM products improved from 0.16 cm3/cm3 to 0.07 cm3/cm3 for AM (local solar time around 06:00 am) data, and from 0.17 cm3/cm3 to 0.05 cm3/cm3 for PM (local solar time around 06:00 pm) data. For SMOS ascending orbit products, the accuracy was improved by 56%, while descending orbit products improved by 45%. Full article
Show Figures

Figure 1

6188 KiB  
Article
Discriminative Sparse Representation for Hyperspectral Image Classification: A Semi-Supervised Perspective
by Zhaohui Xue, Peijun Du, Hongjun Su and Shaoguang Zhou
Remote Sens. 2017, 9(4), 386; https://doi.org/10.3390/rs9040386 - 19 Apr 2017
Cited by 15 | Viewed by 4789
Abstract
This paper presents a novel semi-supervised joint dictionary learning (S2JDL) algorithm for hyperspectral image classification. The algorithm jointly minimizes the reconstruction and classification error by optimizing a semi-supervised dictionary learning problem with a unified objective loss function. To this end, we [...] Read more.
This paper presents a novel semi-supervised joint dictionary learning (S2JDL) algorithm for hyperspectral image classification. The algorithm jointly minimizes the reconstruction and classification error by optimizing a semi-supervised dictionary learning problem with a unified objective loss function. To this end, we construct a semi-supervised objective loss function which combines the reconstruction term from unlabeled samples and the reconstruction–discrimination term from labeled samples to leverage the unsupervised and supervised information. In addition, a soft-max loss is used to build the reconstruction–discrimination term. In the training phase, we randomly select the unlabeled samples and loop through the labeled samples to comprise the training pairs, and the first-order stochastic gradient descents are calculated to simultaneously update the dictionary and classifier by feeding the training pairs into the objective loss function. The experimental results with three popular hyperspectral datasets indicate that the proposed algorithm outperforms the other related methods. Full article
Show Figures

Graphical abstract

4832 KiB  
Article
MBES-CARIS Data Validation for Bathymetric Mapping of Shallow Water in the Kingdom of Bahrain on the Arabian Gulf
by Abderrazak Bannari and Ghadeer Kadhem
Remote Sens. 2017, 9(4), 385; https://doi.org/10.3390/rs9040385 - 19 Apr 2017
Cited by 18 | Viewed by 8540
Abstract
Sound navigating and ranging (SONAR) detection systems can provide valuable information for navigation and security, especially in shallow coastal areas. The last few years have seen an important increase in the volume of bathymetric data produced by Multi-Beam Echo-sounder Systems (MBES). Recently, the [...] Read more.
Sound navigating and ranging (SONAR) detection systems can provide valuable information for navigation and security, especially in shallow coastal areas. The last few years have seen an important increase in the volume of bathymetric data produced by Multi-Beam Echo-sounder Systems (MBES). Recently, the General Bathymetric Chart of the Oceans (GEBCO) released these MBES dataset preprocessed and processed with Computer Aided Resource Information System (CARIS) for public domain use. For the first time, this research focuses on the validation of these released MBES-CARIS dataset performance and robustness for bathymetric mapping of shallow water at the regional scale in the Kingdom of Bahrain (Arabian Gulf). The data were imported, converted and processed in a GIS environment. Only area that covers the Bahrain national water boundary was extracted, avoiding the land surfaces. As the released dataset were stored in a node-grid points uniformly spaced with approximately 923 m and 834 m in north and west directions, respectively, simple kriging was used for densification and bathymetric continuous surface map derivation with a 30 by 30 m pixel size. In addition to dataset cross-validation, 1200 bathymetric points representing different water depths between 0 and −30 m were selected randomly and extracted from a medium scale (1:100,000) nautical map, and they were used for validation purposes. The cross-validation results showed that the modeled semi-variogram was adjusted appropriately assuring satisfactory results. Moreover, the validation results by reference to the nautical map showed that when we consider the total validation points with different water depths, linear statistical regression analysis at a 95% confidence level (p < 0.05) provide a good coefficient of correlation (R2 = 0.95), a good index of agreement (D = 0.82), and a root mean square error (RMSE) of 1.34 m. However, when we consider only the validation points (~800) with depth lower than −10 m, both R2 and D decreased to 0.79 and 0.52, respectively, while the RMSE increased to 1.92 m. Otherwise, when we consider exclusively shallow water points (~400) with a depth higher than −10 m, the results showed a very significant R2 (0.97), a good D (0.84) and a low RMSE (0.51 m). Certainly, the released MBES-CARIS data are more appropriate for shallow water bathymetric mapping. However, for the relatively deeper areas the obtained results are relatively less accurate because probably the MBSE did not cover the bottom in several deeper pockmarks as the rapid change in depth. Possibly the steep slopes and the rough seafloor affect the integrity of the acquired raw data. Moreover, the interpolation of the missed areas’ values between MBSE acquisition data points may not reflect the true depths of these areas. It is possible also that the nautical map used for validation was not established with a good accuracy in the deeper regions. Full article
Show Figures

Graphical abstract

9894 KiB  
Article
Capturing the Diversity of Deprived Areas with Image-Based Features: The Case of Mumbai
by Monika Kuffer, Karin Pfeffer, Richard Sliuzas, Isa Baud and Martin Van Maarseveen
Remote Sens. 2017, 9(4), 384; https://doi.org/10.3390/rs9040384 - 19 Apr 2017
Cited by 43 | Viewed by 9176
Abstract
Many cities in the Global South are facing rapid population and slum growth, but lack detailed information to target these issues. Frequently, municipal datasets on such areas do not keep up with such dynamics, with data that are incomplete, inconsistent, and outdated. Aggregated [...] Read more.
Many cities in the Global South are facing rapid population and slum growth, but lack detailed information to target these issues. Frequently, municipal datasets on such areas do not keep up with such dynamics, with data that are incomplete, inconsistent, and outdated. Aggregated census-based statistics refer to large and heterogeneous areas, hiding internal spatial differences. In recent years, several remote sensing studies developed methods for mapping slums; however, few studies focused on their diversity. To address this shortcoming, this study analyzes the capacity of very high resolution (VHR) imagery and image processing methods to map locally specific types of deprived areas, applied to the city of Mumbai, India. We analyze spatial, spectral, and textural characteristics of deprived areas, using a WorldView-2 imagery combined with auxiliary spatial data, a random forest classifier, and logistic regression modeling. In addition, image segmentation is used to aggregate results to homogenous urban patches (HUPs). The resulting typology of deprived areas obtains a classification accuracy of 79% for four deprived types and one formal built-up class. The research successfully demonstrates how image-based proxies from VHR imagery can help extract spatial information on the diversity and cross-boundary clusters of deprivation to inform strategic urban management. Full article
Show Figures

Graphical abstract

21789 KiB  
Article
A Recognition and Geological Model of a Deep-Seated Ancient Landslide at a Reservoir under Construction
by Shengwen Qi, Yu Zou, Faquan Wu, Changgen Yan, Jinghui Fan, Mingdong Zang, Shishu Zhang and Ruyi Wang
Remote Sens. 2017, 9(4), 383; https://doi.org/10.3390/rs9040383 - 19 Apr 2017
Cited by 12 | Viewed by 4964
Abstract
Forty-six ancient Tibetan star-shaped towers and a village are located on a giant slope, which would be partially flooded by a nearby reservoir currently under construction. Ground survey, boreholes, and geophysical investigations have been carried out, with results indicating that the slope consists [...] Read more.
Forty-six ancient Tibetan star-shaped towers and a village are located on a giant slope, which would be partially flooded by a nearby reservoir currently under construction. Ground survey, boreholes, and geophysical investigations have been carried out, with results indicating that the slope consists of loose deposit with a mean thickness of approximately 80 m in addition to an overlying bedrock of micaceous schist and phyllite. Ground survey and Interferometric Synthetic Aperture Radar (InSAR) indicated that the slope is experiencing some local deformations, with the appearance of cracks and occurrence of two small landslides. Through using borehole logs with the knowledge of the regional geological background, it can be inferred that the loose deposit is a result of an ancient deep-seated translational landslide. This landslide was initiated along the weak layer of the bedding plane during the last glaciation in the late Pleistocene (Q3) period, which was due to deep incision of the Dadu River at that time. Although it has not shown a major reaction since the ancient Tibetan star-shaped towers have been built (between 200 and 1600 AD), and preliminary studies based on geological and geomorphological analyses incorporated with InSAR technology indicated that the landslide is deformable. Furthermore, these studies highlighted that the rate of deformation is gradually reducing from the head to the toe area of the landslide, with the deformation also exhibiting relationships with seasonal rainstorms. The state of the toe area is very important for stabilizing a landslide and minimizing damage. It can be expected that the coming impoundment of the reservoir will increase pore pressure of the rupture zone at the toe area, which will then reduce resistance and accelerate the deformation. Future measures for protection of the slope should be focused on toe erosion and some bank protection measures (i.e., rock armor) should be adopted in this area. Meanwhile, some long-term monitoring measures should be installed to gain a deep understanding on the stability of this important slope. Full article
(This article belongs to the Special Issue Remote Sensing of Landslides)
Show Figures

Graphical abstract

5867 KiB  
Article
Parallel Agent-as-a-Service (P-AaaS) Based Geospatial Service in the Cloud
by Xicheng Tan, Song Guo, Liping Di, Meixia Deng, Fang Huang, Xinyue Ye, Ziheng Sun, Weishu Gong, Zongyao Sha and Shaoming Pan
Remote Sens. 2017, 9(4), 382; https://doi.org/10.3390/rs9040382 - 19 Apr 2017
Cited by 8 | Viewed by 5053
Abstract
To optimize the efficiency of the geospatial service in the flood response decision making system, a Parallel Agent-as-a-Service (P-AaaS) method is proposed and implemented in the cloud. The prototype system and comparisons demonstrate the advantages of our approach over existing methods. The P-AaaS [...] Read more.
To optimize the efficiency of the geospatial service in the flood response decision making system, a Parallel Agent-as-a-Service (P-AaaS) method is proposed and implemented in the cloud. The prototype system and comparisons demonstrate the advantages of our approach over existing methods. The P-AaaS method includes both parallel architecture and a mechanism for adjusting the computational resources—the parallel geocomputing mechanism of the P-AaaS method used to execute a geospatial service and the execution algorithm of the P-AaaS based geospatial service chain, respectively. The P-AaaS based method has the following merits: (1) it inherits the advantages of the AaaS-based method (i.e., avoiding transfer of large volumes of remote sensing data or raster terrain data, agent migration, and intelligent conversion into services to improve domain expert collaboration); (2) it optimizes the low performance and the concurrent geoprocessing capability of the AaaS-based method, which is critical for special applications (e.g., highly concurrent applications and emergency response applications); and (3) it adjusts the computing resources dynamically according to the number and the performance requirements of concurrent requests, which allows the geospatial service chain to support a large number of concurrent requests by scaling up the cloud-based clusters in use and optimizes computing resources and costs by reducing the number of virtual machines (VMs) when the number of requests decreases. Full article
(This article belongs to the Special Issue Remote Sensing Big Data: Theory, Methods and Applications)
Show Figures

Graphical abstract

5701 KiB  
Article
Examining Spatial Distribution and Dynamic Change of Urban Land Covers in the Brazilian Amazon Using Multitemporal Multisensor High Spatial Resolution Satellite Imagery
by Yunyun Feng, Dengsheng Lu, Emilio F. Moran, Luciano Vieira Dutra, Miquéias Freitas Calvi and Maria Antonia Falcão De Oliveira
Remote Sens. 2017, 9(4), 381; https://doi.org/10.3390/rs9040381 - 19 Apr 2017
Cited by 39 | Viewed by 5755
Abstract
The construction of the Belo Monte hydroelectric dam began in 2011, resulting in rapidly increased population from less than 80,000 persons before 2010 to more than 150,000 persons in 2012 in Altamira, Pará State, Brazil. This rapid urbanization has produced many problems in [...] Read more.
The construction of the Belo Monte hydroelectric dam began in 2011, resulting in rapidly increased population from less than 80,000 persons before 2010 to more than 150,000 persons in 2012 in Altamira, Pará State, Brazil. This rapid urbanization has produced many problems in urban planning and management, as well as challenging environmental conditions, requiring monitoring of urban land-cover change at high temporal and spatial resolutions. However, the frequent cloud cover in the moist tropical region is a big problem, impeding the acquisition of cloud-free optical sensor data. Thanks to the availability of different kinds of high spatial resolution satellite images in recent decades, RapidEye imagery in 2011 and 2012, Pleiades imagery in 2013 and 2014, SPOT 6 imagery in 2015, and CBERS imagery in 2016 with spatial resolutions from 0.5 m to 10 m were collected for this research. Because of the difference in spectral and spatial resolutions among these satellite images, directly conducting urban land-cover change using conventional change detection techniques, such as image differencing and principal component analysis, was not feasible. Therefore, a hybrid approach was proposed based on integration of spectral and spatial features to classify the high spatial resolution satellite images into six land-cover classes: impervious surface area (ISA), bare soil, building demolition, water, pasture, and forest/plantation. A post-classification comparison approach was then used to detect urban land-cover change annually for the periods between 2011 and 2016. The focus was on the analysis of ISA expansion, the dynamic change between pasture and bare soil, and the changes in forest/plantation. This study indicates that the hybrid approach can effectively extract six land-cover types with overall accuracy of over 90%. ISA increased continuously through conversion from pasture and bare soil. The Belo Monte dam construction resulted in building demolition in 2015 in low-lying areas along the rivers and an increase in water bodies in 2016. Because of the dam construction, forest/plantation and pasture decreased much faster, while ISA and water increased much faster in 2011–2016 than they had between 1991 and 2011. About 50% of the increased annual deforestation area can be attributed to the dam construction between 2011 and 2016. The spatial patterns of annual urban land-cover distribution and rates of dynamic change provided important data sources for making better decisions for urban management and planning in this city and others experiencing such explosive demographic change. Full article
(This article belongs to the Special Issue Remote Sensing of Urban Ecology)
Show Figures

Graphical abstract

6155 KiB  
Article
InSAR Time-Series Analysis of Land Subsidence under Different Land Use Types in the Eastern Beijing Plain, China
by Chaofan Zhou, Huili Gong, Beibei Chen, Jiwei Li, Mingliang Gao, Feng Zhu, Wenfeng Chen and Yue Liang
Remote Sens. 2017, 9(4), 380; https://doi.org/10.3390/rs9040380 - 19 Apr 2017
Cited by 55 | Viewed by 7554
Abstract
In the Beijing plain, the long-term groundwater overexploitation, exploitation, and the utilization of superficial urban space have led to land subsidence. In this study, the spatial–temporal analysis of land subsidence in Beijing was assessed by using the small baseline subset (SBAS) interferometric synthetic [...] Read more.
In the Beijing plain, the long-term groundwater overexploitation, exploitation, and the utilization of superficial urban space have led to land subsidence. In this study, the spatial–temporal analysis of land subsidence in Beijing was assessed by using the small baseline subset (SBAS) interferometric synthetic aperture radar (InSAR) technique based on 47 TerraSAR-X SAR images from 2010 to 2015. Distinct variations of the land subsidence were found in the study regions. The maximum annual land subsidence rate was 146 mm/year from 2011 to 2015. The comparison between the SBAS InSAR results and the ground leveling measurements showed that the InSAR land subsidence results achieved a precision of 2 mm. In 2013, the maximum displacement reached 132 and 138 mm/year in the Laiguangying and DongbalizhuangDajiaoting area. Our analysis showed that the serious land subsidence mainly occurred in the following land use types: water area and wetland, paddy field, upland soils, vegetable land, and peasant-inhabited land. Our results could provide a useful reference for groundwater exploitation and urban planning. Full article
(This article belongs to the Special Issue Earth Observation in Planning for Sustainable Urban Development)
Show Figures

Graphical abstract

1708 KiB  
Article
Optical Backscattering Measured by Airborne Lidar and Underwater Glider
by James H. Churnside, Richard D. Marchbanks, Chad Lembke and Jordon Beckler
Remote Sens. 2017, 9(4), 379; https://doi.org/10.3390/rs9040379 - 18 Apr 2017
Cited by 24 | Viewed by 5648
Abstract
The optical backscattering from particles in the ocean is an important quantity that has been measured by remote sensing techniques and in situ instruments. In this paper, we compare estimates of this quantity from airborne lidar with those from an in situ instrument [...] Read more.
The optical backscattering from particles in the ocean is an important quantity that has been measured by remote sensing techniques and in situ instruments. In this paper, we compare estimates of this quantity from airborne lidar with those from an in situ instrument on an underwater glider. Both of these technologies allow much denser sampling of backscatter profiles than traditional ship surveys. We found a moderate correlation (R = 0.28, p < 10−5), with differences that are partially explained by spatial and temporal sampling mismatches, variability in particle composition, and lidar retrieval errors. The data suggest that there are two different regimes with different scattering properties. For backscattering coefficients below about 0.001 m−1, the lidar values were generally greater than the glider values. For larger values, the lidar was generally lower than the glider. Overall, the results are promising and suggest that airborne lidar and gliders provide comparable and complementary information on optical particulate backscattering. Full article
Show Figures

Figure 1

7566 KiB  
Article
Detection of Absorbing Aerosol Using Single Near-UV Radiance Measurements from a Cloud and Aerosol Imager
by Sujung Go, Mijin Kim, Jhoon Kim, Sang Seo Park, Ukkyo Jeong and Myungje Choi
Remote Sens. 2017, 9(4), 378; https://doi.org/10.3390/rs9040378 - 18 Apr 2017
Cited by 4 | Viewed by 5224
Abstract
The Ultra-Violet Aerosol Index (UVAI) is a practical parameter for detecting aerosols that absorb UV radiation, especially where other aerosol retrievals fail, such as over bright surfaces (e.g., deserts and clouds). However, typical UVAI retrieval requires at least two UV channels, while several [...] Read more.
The Ultra-Violet Aerosol Index (UVAI) is a practical parameter for detecting aerosols that absorb UV radiation, especially where other aerosol retrievals fail, such as over bright surfaces (e.g., deserts and clouds). However, typical UVAI retrieval requires at least two UV channels, while several satellite instruments, such as the Thermal And Near infrared Sensor for carbon Observation Cloud and Aerosol Imager (TANSO-CAI) instrument onboard a Greenhouse gases Observing SATellite (GOSAT), provide single channel UV radiances. In this study, a new UVAI retrieval method was developed which uses a single UV channel. A single channel aerosol index (SAI) is defined to measure the extent to which an absorbing aerosol state differs from its state with minimized absorption by aerosol. The SAI qualitatively represents absorbing aerosols by considering a 30-day minimum composite and the variability in aerosol absorption. This study examines the feasibility of detecting absorbing aerosols using a UV-constrained satellite, focusing on those which have a single UV channel. The Vector LInearized pseudo-spherical Discrete Ordinate Radiative Transfer (VLIDORT) was used to test the sensitivity of the SAI and UVAI to aerosol optical properties. The theoretical calculations showed that highly absorbing aerosols have a meaningful correlation with SAI. The retrieved SAI from OMI and operational OMI UVAI were also in good agreement when UVAI values were greater than 0.7 (the absorption criteria of UVAI). The retrieved SAI from the TANSO-CAI data was compared with operational OMI UVAI data, demonstrating a reasonable agreement and low rate of false detection for cases of absorbing aerosols in East Asia. The SAI retrieved from TANSO-CAI was in better agreement with OMI UVAI, particularly for the values greater than the absorbing threshold value of 0.7. Full article
Show Figures

Graphical abstract

16212 KiB  
Article
In-Field High-Throughput Phenotyping of Cotton Plant Height Using LiDAR
by Shangpeng Sun, Changying Li and Andrew H. Paterson
Remote Sens. 2017, 9(4), 377; https://doi.org/10.3390/rs9040377 - 18 Apr 2017
Cited by 81 | Viewed by 10506
Abstract
A LiDAR-based high-throughput phenotyping (HTP) system was developed for cotton plant phenotyping in the field. The HTP system consists of a 2D LiDAR and an RTK-GPS mounted on a high clearance tractor. The LiDAR scanned three rows of cotton plots simultaneously from the [...] Read more.
A LiDAR-based high-throughput phenotyping (HTP) system was developed for cotton plant phenotyping in the field. The HTP system consists of a 2D LiDAR and an RTK-GPS mounted on a high clearance tractor. The LiDAR scanned three rows of cotton plots simultaneously from the top and the RTK-GPS was used to provide the spatial coordinates of the point cloud during data collection. Configuration parameters of the system were optimized to ensure the best data quality. A height profile for each plot was extracted from the dense three dimensional point clouds; then the maximum height and height distribution of each plot were derived. In lab tests, single plants were scanned by LiDAR using 0.5° angular resolution and results showed an R2 value of 1.00 (RMSE = 3.46 mm) in comparison to manual measurements. In field tests using the same angular resolution; the LiDAR-based HTP system achieved average R2 values of 0.98 (RMSE = 65 mm) for cotton plot height estimation; compared to manual measurements. This HTP system is particularly useful for large field application because it provides highly accurate measurements; and the efficiency is greatly improved compared to similar studies using the side view scan. Full article
Show Figures

Graphical abstract

93796 KiB  
Article
Automatic UAV Image Geo-Registration by Matching UAV Images to Georeferenced Image Data
by Xiangyu Zhuo, Tobias Koch, Franz Kurz, Friedrich Fraundorfer and Peter Reinartz
Remote Sens. 2017, 9(4), 376; https://doi.org/10.3390/rs9040376 - 17 Apr 2017
Cited by 47 | Viewed by 15997
Abstract
Recent years have witnessed the fast development of UAVs (unmanned aerial vehicles). As an alternative to traditional image acquisition methods, UAVs bridge the gap between terrestrial and airborne photogrammetry and enable flexible acquisition of high resolution images. However, the georeferencing accuracy of UAVs [...] Read more.
Recent years have witnessed the fast development of UAVs (unmanned aerial vehicles). As an alternative to traditional image acquisition methods, UAVs bridge the gap between terrestrial and airborne photogrammetry and enable flexible acquisition of high resolution images. However, the georeferencing accuracy of UAVs is still limited by the low-performance on-board GNSS and INS. This paper investigates automatic geo-registration of an individual UAV image or UAV image blocks by matching the UAV image(s) with a previously taken georeferenced image, such as an individual aerial or satellite image with a height map attached or an aerial orthophoto with a DSM (digital surface model) attached. As the biggest challenge for matching UAV and aerial images is in the large differences in scale and rotation, we propose a novel feature matching method for nadir or slightly tilted images. The method is comprised of a dense feature detection scheme, a one-to-many matching strategy and a global geometric verification scheme. The proposed method is able to find thousands of valid matches in cases where SIFT and ASIFT fail. Those matches can be used to geo-register the whole UAV image block towards the reference image data. When the reference images offer high georeferencing accuracy, the UAV images can also be geolocalized in a global coordinate system. A series of experiments involving different scenarios was conducted to validate the proposed method. The results demonstrate that our approach achieves not only decimeter-level registration accuracy, but also comparable global accuracy as the reference images. Full article
Show Figures

Graphical abstract

10271 KiB  
Article
Improving Fractional Impervious Surface Mapping Performance through Combination of DMSP-OLS and MODIS NDVI Data
by Wei Guo, Dengsheng Lu and Wenhui Kuang
Remote Sens. 2017, 9(4), 375; https://doi.org/10.3390/rs9040375 - 17 Apr 2017
Cited by 33 | Viewed by 5963
Abstract
Impervious surface area (ISA) is an important parameter for many studies such as urban climate, urban environmental change, and air pollution; however, mapping ISA at the regional or global scale is still challenging due to the complexity of impervious surface features. The Defense [...] Read more.
Impervious surface area (ISA) is an important parameter for many studies such as urban climate, urban environmental change, and air pollution; however, mapping ISA at the regional or global scale is still challenging due to the complexity of impervious surface features. The Defense Meteorological Satellite Program’s Operational Linescan System (DMSP-OLS) data have been used for ISA mapping, but high uncertainty existed due to mixed-pixel and data-saturation problems. This paper presents a new index called normalized impervious surface index (NISI), which is an integration of DMSP-OLS and Moderate Resolution Imaging Spectroradiometer (MODIS) normalized difference vegetation index (NDVI) data, in order to reduce these problems. Meanwhile, this newly developed index is compared with previously used indices—Human Settlement Index (HSI) and Vegetation Adjusted Nighttime light Urban Index (VANUI)—in ISA mapping performance. We selected China as an example to map fractional ISA distribution through a support vector regression approach based on the relationship between the index and Landsat-derived ISA data. The results indicate that the proposed NISI provided better ISA estimation accuracy than HSI and VANUI, especially when the fractional ISA in a pixel is relatively large (i.e., >0.6) or very small (i.e., <0.2). This approach can be used to rapidly update ISA datasets at regional and global scales. Full article
(This article belongs to the Special Issue Recent Advances in Remote Sensing with Nighttime Lights)
Show Figures

Graphical abstract

11612 KiB  
Article
Phenological Observations on Classical Prehistoric Sites in the Middle and Lower Reaches of the Yellow River Based on Landsat NDVI Time Series
by Yuqing Pan, Yueping Nie, Chege Watene, Jianfeng Zhu and Fang Liu
Remote Sens. 2017, 9(4), 374; https://doi.org/10.3390/rs9040374 - 17 Apr 2017
Cited by 9 | Viewed by 4059
Abstract
Buried archeological features show up as crop marks that are mostly visible using high-resolution image data. Such data are costly and restricted to small regions and time domains. However, a time series of freely available medium resolution imagery can be employed to detect [...] Read more.
Buried archeological features show up as crop marks that are mostly visible using high-resolution image data. Such data are costly and restricted to small regions and time domains. However, a time series of freely available medium resolution imagery can be employed to detect crop growth changes to reveal subtle surface marks in large areas. This paper aims to study the classical Chinese settlements of Taosi and Erlitou over large areas using Landsat NDVI time series crop phenology to determine the optimum periods for detection and monitoring of crop anomalies. Burial areas (such as the palace area and the sacrificial area) were selected as the research area while the surrounding empty fields with a low density of ancient features were used as reference regions. Landsat NDVI covering two years’ growth periods of wheat and maize were computed and analyzed using Pearson’s correlation coefficient and Euclidean distance. Similarities or disparities between the burial areas and their empty areas were computed using the Hausdorff distance. Based on the phenology of crop growth, the time series NDVI images of winter wheat and summer maize were generated to analyze crop anomalies in the archeological sites. Results show that the Hausdorff distance was high during the critical stages of water for both crops and that the images of high Hausdorff distance can provide more obvious subsurface archeological information. Full article
Show Figures

Graphical abstract

8909 KiB  
Article
Multispectral LiDAR Point Cloud Classification: A Two-Step Approach
by Biwu Chen, Shuo Shi, Wei Gong, Qingjun Zhang, Jian Yang, Lin Du, Jia Sun, Zhenbing Zhang and Shalei Song
Remote Sens. 2017, 9(4), 373; https://doi.org/10.3390/rs9040373 - 17 Apr 2017
Cited by 42 | Viewed by 7779
Abstract
Target classification techniques using spectral imagery and light detection and ranging (LiDAR) are widely used in many disciplines. However, none of the existing methods can directly capture spectral and 3D spatial information simultaneously. Multispectral LiDAR was proposed to solve this problem as its [...] Read more.
Target classification techniques using spectral imagery and light detection and ranging (LiDAR) are widely used in many disciplines. However, none of the existing methods can directly capture spectral and 3D spatial information simultaneously. Multispectral LiDAR was proposed to solve this problem as its data combines spectral and 3D spatial information. Point-based classification experiments have been conducted with the use of multispectral LiDAR; however, the low signal to noise ratio creates salt and pepper noise in the spectral-only classification, thus lowering overall classification accuracy. In our study, a two-step classification approach is proposed to eliminate this noise during target classification: routine classification based on spectral information using spectral reflectance or a vegetation index, followed by neighborhood spatial reclassification. In an experiment, a point cloud was first classified with a routine classifier using spectral information and then reclassified with the k-nearest neighbors (k-NN) algorithm using neighborhood spatial information. Next, a vegetation index (VI) was introduced for the classification of healthy and withered leaves. Experimental results show that our proposed two-step classification method is feasible if the first spectral classification accuracy is reasonable. After the reclassification based on the k-NN algorithm was combined with neighborhood spatial information, accuracies increased by 1.50–11.06%. Regarding identification of withered leaves, VI performed much better than raw spectral reflectance, with producer accuracy increasing from 23.272% to 70.507%. Full article
Show Figures

Graphical abstract

3648 KiB  
Article
Evaluation of Remote Sensing Inversion Error for the Above-Ground Biomass of Alpine Meadow Grassland Based on Multi-Source Satellite Data
by Baoping Meng, Jing Ge, Tiangang Liang, Shuxia Yang, Jinglong Gao, Qisheng Feng, Xia Cui, Xiaodong Huang and Hongjie Xie
Remote Sens. 2017, 9(4), 372; https://doi.org/10.3390/rs9040372 - 16 Apr 2017
Cited by 48 | Viewed by 7672
Abstract
It is not yet clear whether there is any difference in using remote sensing data of different spatial resolutions and filtering methods to improve the above-ground biomass (AGB) estimation accuracy of alpine meadow grassland. In this study, field measurements of AGB and spectral [...] Read more.
It is not yet clear whether there is any difference in using remote sensing data of different spatial resolutions and filtering methods to improve the above-ground biomass (AGB) estimation accuracy of alpine meadow grassland. In this study, field measurements of AGB and spectral data at Sangke Town, Gansu Province, China, in three years (2013–2015) are combined to construct AGB estimation models of alpine meadow grassland based on these different remotely-sensed NDVI data: MODIS, HJ-1B CCD of China and Landsat 8 OLI (denoted as NDVIMOD, NDVICCD and NDVIOLI, respectively). This study aims to investigate the estimation errors of AGB from the three satellite sensors, to examine the influence of different filtering methods on MODIS NDVI for the estimation accuracy of AGB and to evaluate the feasibility of large-scale models applied to a small area. The results showed that: (1) filtering the MODIS NDVI using the Savitzky–Golay (SG), logistic and Gaussian approaches can reduce the AGB estimation error; in particular, the SG method performs the best, with the smallest errors at both the sample plot scale (250 m × 250 m) and the entire study area (33.9% and 34.9%, respectively); (2) the optimum estimation model of grassland AGB in the study area is the exponential model based on NDVIOLI, with estimation errors of 29.1% and 30.7% at the sample plot and the study area scales, respectively; and (3) the estimation errors of grassland AGB models previously constructed at different spatial scales (the Tibetan Plateau, Gannan Prefecture and Xiahe County) are higher than those directly constructed based on the small area of this study by 11.9%–36.4% and 5.3%–29.6% at the sample plot and study area scales, respectively. This study presents an improved monitoring algorithm of alpine natural grassland AGB estimation and provides a clear direction for future improvement of the grassland AGB estimation and grassland productivity from remote sensing technology. Full article
(This article belongs to the Special Issue Remote Sensing of Above Ground Biomass)
Show Figures

Graphical abstract

3427 KiB  
Article
Surface Motion and Structural Instability Monitoring of Ming Dynasty City Walls by Two-Step Tomo-PSInSAR Approach in Nanjing City, China
by Fulong Chen, Yuhua Wu, Yimeng Zhang, Issaak Parcharidis, Peifeng Ma, Ruya Xiao, Jia Xu, Wei Zhou, Panpan Tang and Michael Foumelis
Remote Sens. 2017, 9(4), 371; https://doi.org/10.3390/rs9040371 - 15 Apr 2017
Cited by 31 | Viewed by 6451
Abstract
Spaceborne Multi-Temporal Synthetic Aperture Radar (SAR) Interferometry (MT-InSAR) has been a valuable tool in mapping motion phenomena in different scenarios. Recently, the capabilities of MT-InSAR for risk monitoring and preventive analysis of heritage sites have increasingly been exploited. Considering the limitations of conventional [...] Read more.
Spaceborne Multi-Temporal Synthetic Aperture Radar (SAR) Interferometry (MT-InSAR) has been a valuable tool in mapping motion phenomena in different scenarios. Recently, the capabilities of MT-InSAR for risk monitoring and preventive analysis of heritage sites have increasingly been exploited. Considering the limitations of conventional MT-InSAR techniques, in this study a two-step Tomography-based Persistent Scatterers (PS) Interferometry (Tomo-PSInSAR) approach is proposed for monitoring ground deformation and structural instabilities over the Ancient City Walls (Ming Dynasty) in Nanjing city, China. For the purpose of this study we utilized 26 Stripmap acquisitions from TerraSAR-X and TanDEM-X missions, spanning from May 2013 to February 2015. As a first step, regional-scale surface deformation rates on single PSs were derived (ranging from −40 to +5 mm/year) and used for identifying deformation hotspots as well as for the investigation of a potential correlation between urbanization and the occurrence of surface subsidence. As a second step, structural instability parameters of ancient walls (linear motion rates, non-linear motions and material thermodynamics) were estimated by an extended four-dimensional Tomo-PSInSAR model. The model applies a two-tier network strategy; that is, the detection of most reliable single PSs in the first-tier Delaunay triangulation network followed by the detection of remaining single PSs and double PSs on the second-tier local star network referring to single SPs extracted in the first-tier network. Consequently, a preliminary phase calibration relevant to the Atmospheric Phase Screen (APS) is not needed. Motion heterogeneities in the spatial domain, either caused by thermal kinetics or displacement trends, were also considered. This study underlines the potential of the proposed Tomo-PSInSAR solution for the monitoring and conservation of cultural heritage sites. The proposed approach offers a quantitative indicator to local authorities and planners for assessing potential damages as well as for the design of remediation activities. Full article
(This article belongs to the Special Issue Radar Systems for the Societal Challenges)
Show Figures

Graphical abstract

3319 KiB  
Article
Prototyping of LAI and FPAR Retrievals from MODIS Multi-Angle Implementation of Atmospheric Correction (MAIAC) Data
by Chi Chen, Yuri Knyazikhin, Taejin Park, Kai Yan, Alexei Lyapustin, Yujie Wang, Bin Yang and Ranga B. Myneni
Remote Sens. 2017, 9(4), 370; https://doi.org/10.3390/rs9040370 - 15 Apr 2017
Cited by 22 | Viewed by 6542
Abstract
Leaf area index (LAI) and fraction of photosynthetically active radiation (FPAR) absorbed by vegetation are key variables in many global models of climate, hydrology, biogeochemistry, and ecology. These parameters are being operationally produced from Terra and Aqua MODIS bidirectional reflectance factor (BRF) data. [...] Read more.
Leaf area index (LAI) and fraction of photosynthetically active radiation (FPAR) absorbed by vegetation are key variables in many global models of climate, hydrology, biogeochemistry, and ecology. These parameters are being operationally produced from Terra and Aqua MODIS bidirectional reflectance factor (BRF) data. The MODIS science team has developed, and plans to release, a new version of the BRF product using the multi-angle implementation of atmospheric correction (MAIAC) algorithm from Terra and Aqua MODIS observations. This paper presents analyses of LAI and FPAR retrievals generated with the MODIS LAI/FPAR operational algorithm using Terra MAIAC BRF data. Direct application of the operational algorithm to MAIAC BRF resulted in an underestimation of the MODIS Collection 6 (C6) LAI standard product by up to 10%. The difference was attributed to the disagreement between MAIAC and MODIS BRFs over the vegetation by −2% to +8% in the red spectral band, suggesting different accuracies in the BRF products. The operational LAI/FPAR algorithm was adjusted for uncertainties in the MAIAC BRF data. Its performance evaluated on a limited set of MAIAC BRF data from North and South America suggests an increase in spatial coverage of the best quality, high-precision LAI retrievals of up to 10%. Overall MAIAC LAI and FPAR are consistent with the standard C6 MODIS LAI/FPAR. The increase in spatial coverage of the best quality LAI retrievals resulted in a better agreement of MAIAC LAI with field data compared to the C6 LAI product, with the RMSE decreasing from 0.80 LAI units (C6) down to 0.67 (MAIAC) and the R2 increasing from 0.69 to 0.80. The slope (intercept) of the satellite-derived vs. field-measured LAI regression line has changed from 0.89 (0.39) to 0.97 (0.25). Full article
Show Figures

Graphical abstract

3859 KiB  
Article
Comparative Assessments of the Latest GPM Mission’s Spatially Enhanced Satellite Rainfall Products over the Main Bolivian Watersheds
by Frédéric Satgé, Alvaro Xavier, Ramiro Pillco Zolá, Yawar Hussain, Franck Timouk, Jérémie Garnier and Marie-Paule Bonnet
Remote Sens. 2017, 9(4), 369; https://doi.org/10.3390/rs9040369 - 13 Apr 2017
Cited by 52 | Viewed by 6517
Abstract
The new IMERG and GSMaP-v6 satellite rainfall estimation (SRE) products from the Global Precipitation Monitoring (GPM) mission have been available since January 2015. With a finer grid box of 0.1°, these products should provide more detailed information than their latest widely-adapted (relatively coarser [...] Read more.
The new IMERG and GSMaP-v6 satellite rainfall estimation (SRE) products from the Global Precipitation Monitoring (GPM) mission have been available since January 2015. With a finer grid box of 0.1°, these products should provide more detailed information than their latest widely-adapted (relatively coarser spatial scale, 0.25°) counterpart. Integrated Multi-satellitE Retrievals for GPM (IMERG) and Global Satellite Mapping of Precipitation version 6 (GSMaP-v6) assessment is done by comparing their rainfall estimations with 247 rainfall gauges from 2014 to 2016 in Bolivia. The comparisons were done on annual, monthly and daily temporal scales over the three main national watersheds (Amazon, La Plata and TDPS), for both wet and dry seasons to assess the seasonal variability and according to different slope classes to assess the topographic influence on SREs. To observe the potential enhancement in rainfall estimates brought by these two recently released products, the widely-used TRMM Multi-satellite Precipitation Analysis (TMPA) product is also considered in the analysis. The performances of all the products increase during the wet season. Slightly less accurate than TMPA, IMERG can almost achieve its main objective, which is to ensure TMPA rainfall measurements, while enhancing the discretization of rainy and non-rainy days. It also provides the most accurate estimates among all products over the Altiplano arid region. GSMaP-v6 is the least accurate product over the region and tends to underestimate rainfall over the Amazon and La Plata regions. Over the Amazon and La Plata region, SRE potentiality is related to topographic features with the highest bias observed over high slope regions. Over the TDPS watershed, the high rainfall spatial variability with marked wet and arid regions is the main factor influencing SREs. Full article
Show Figures

Graphical abstract

Previous Issue
Next Issue
Back to TopTop