Article

Prediction of Soil Physical and Chemical Properties by Visible and Near-Infrared Diffuse Reflectance Spectroscopy in the Central Amazon

by
Érika F. M. Pinheiro
1,*,
Marcos B. Ceddia
1,
Christopher M. Clingensmith
2,
Sabine Grunwald
2 and
Gustavo M. Vasques
3
1
Departamento de Solos, Instituto de Agronomia, Universidade Federal Rural do Rio de Janeiro, BR 465, km 7, Seropédica 23890-000, RJ, Brazil
2
Pedometrics, Landscape Analysis, and GIS Laboratory, Soil and Water Science Department, University of Florida, 2181 McCarty Hall A, P.O. Box 110290, Gainesville, FL 32611-0290, USA
3
Embrapa Solos, Rua Jardim Botânico, 1024, Rio de Janeiro 22460-000, RJ, Brazil
*
Author to whom correspondence should be addressed.
Remote Sens. 2017, 9(4), 293; https://doi.org/10.3390/rs9040293
Submission received: 28 October 2016 / Revised: 10 March 2017 / Accepted: 12 March 2017 / Published: 23 March 2017
(This article belongs to the Special Issue Remote Sensing Applied to Soils: From Ground to Space)

Abstract

:
Visible and near-infrared diffuse reflectance spectroscopy (VIS-NIR) has shown levels of accuracy comparable to conventional laboratory methods for estimating soil properties. Soil chemical and physical properties have been predicted by reflectance spectroscopy successfully on subtropical and temperate soils, whereas soils from tropical agro-forest regions have received less attention, especially those from tropical rainforests. A spectral characterization provides a proficient pathway for soil characterization. The first step in this process is to develop a comprehensive VIS-NIR soil library of multiple key soil properties to be used in future soil surveys. This paper presents the first VIS-NIR soil library for a remote region in the Central Amazon. We evaluated the performance of VIS-NIR for the prediction of soil properties in the Central Amazon, Brazil. Soil properties measured and predicted were: pH, Ca, Mg, Al, H, H+Al, P, organic C (SOC), sum of bases, cation exchange capacity (CEC), percentage of base saturation (V), Al saturation (m), clay, sand, silt, silt/clay (S/C), and degree of flocculation. Soil samples were scanned in the laboratory in the VIS-NIR range (350–2500 nm), and forty-one pre-processing methods were tested to improve predictions. Clay content was predicted with the highest accuracy, followed by SOC. Sand, S/C, H, Al, H+Al, CEC, m and V predictions were reasonably good. The other soil properties were poorly predicted. Among the soil properties predicted well, SOC is one of the critical soil indicators in the global carbon cycle. Besides the soil property of interest, the landscape position, soil order and depth influenced in the model performance. For silt content, pH and S/C, the model performed better in well-drained soils, whereas for SOC best predictions were obtained in poorly drained soils. The association of VIS-NIR spectral data to landforms, vegetation classes, and soil types demonstrate potential for soil characterization.

Graphical Abstract

1. Introduction

Achieving food security with the given limited soil and water resources and a rising world population set to breach breaching more than 9.5 billion within the next two decades will require the adoption and expansion of digital soil mapping (DSM), precision agriculture, best management practices, and geospatial spectral technologies [1]. Among the latter, visible and near-infrared (VIS-NIR) diffuse reflectance spectroscopy (DRS) allows for fast, quantitative, cost effective and non-destructive estimation of soil properties.
The quality of laboratory-based spectral models have been similar to traditional soil analytical methods, though some variations occur in the prediction performance [2,3]. Visible and near-infrared (350–2500 nm) DRS has been efficiently used to predict some physical (sand, silt and clay), chemical (cation exchange capacity (CEC), pH, organic carbon), and mineral (kaolinite, gibbsite, montmorillonite and iron oxides) soil properties [4,5,6,7,8,9]. The approach also allows estimation multiple soil properties from the same spectral data, but is limited by the need for a reasonable number of samples to calibrate and validate the predictive models. This is usually conducted using data-craving parametric and non-parametric multivariate methods. Partial least squares regression (PLSR) is the most common algorithm used to calibrate VIS-NIR spectra to predict soil properties [4]. Partial least squares regression, in conjunction with the variable importance in the projection (VIP) metric, is an important tool for identifying the most relevant explanatory variables for prediction [10]. In remote regions, where field access is more difficult, a spectral characterization is especially important and provides a proficient pathway for soil characterization. Once VIS-NIR soil models have been successfully built through calibration and validation, they offer future cost-effective and less laborious pathways for soil assessment. For instance, in the Central Amazon region, transportation is limited, expensive and difficult (often sites are only accessible by boat and a few airplanes). Proximal sensors offer advantages for soil measurement over remote sensing or traditional sampling and laboratory analysis [8,11]. One advantage of DRS is the capacity of computational storage in real-time of the measured spectra allowing the creation of databases called spectral libraries [12]. The geographic and attribute domain boundaries of these spectral libraries determine their applicability. Model predictions typically degrade and uncertainties rise if spectral models are used outside of their calibration domain boundaries.
Soil chemical and physical properties have been predicted by reflectance spectroscopy successfully in the past [5,6,7,8]. However, the focus has been on subtropical and temperate soils, whereas soils from tropical agro-forest regions have received less attention, especially those from tropical rainforests [6,7,8,9].
Soils from the Amazon rainforest share common parent materials and formation processes mediated geologically by the erosional processes that shaped the Amazon Sedimentary Basin, regionally by climatic gradients, and locally by the relief and seasonal fluctuations of the rivers forming the so-called várzea (lowland, floodplain) and terra firme (upland) forests. However, its size and remoteness forbids ample soil sampling due to the high costs and human risks (e.g., contraction of insect-borne diseases, attacks by wildlife, limited access pathways into the forest, etc.). Thus, few opportunities exist to sample soils in the Amazon that are still relatively unknown. Associating VIS-NIR spectral data to soil types, landforms characterized by specific terrain features, and vegetation classes offer new avenues to complement and enhance traditional labor-intensive soil assessments. Proximal soil sensing via VIS-NIR has been suggested to provide more comprehensive digital soil models, specifically if they are combined with aboveground landscape features, such as vegetation types, ecotypes or biome classes, often derived from remote sensing [1,13]. The objective of the study was to evaluate the performance of VIS-NIR for the prediction of a suite of soil chemical and physical properties in the Central Amazon, Brazil.

2. Materials and Methods
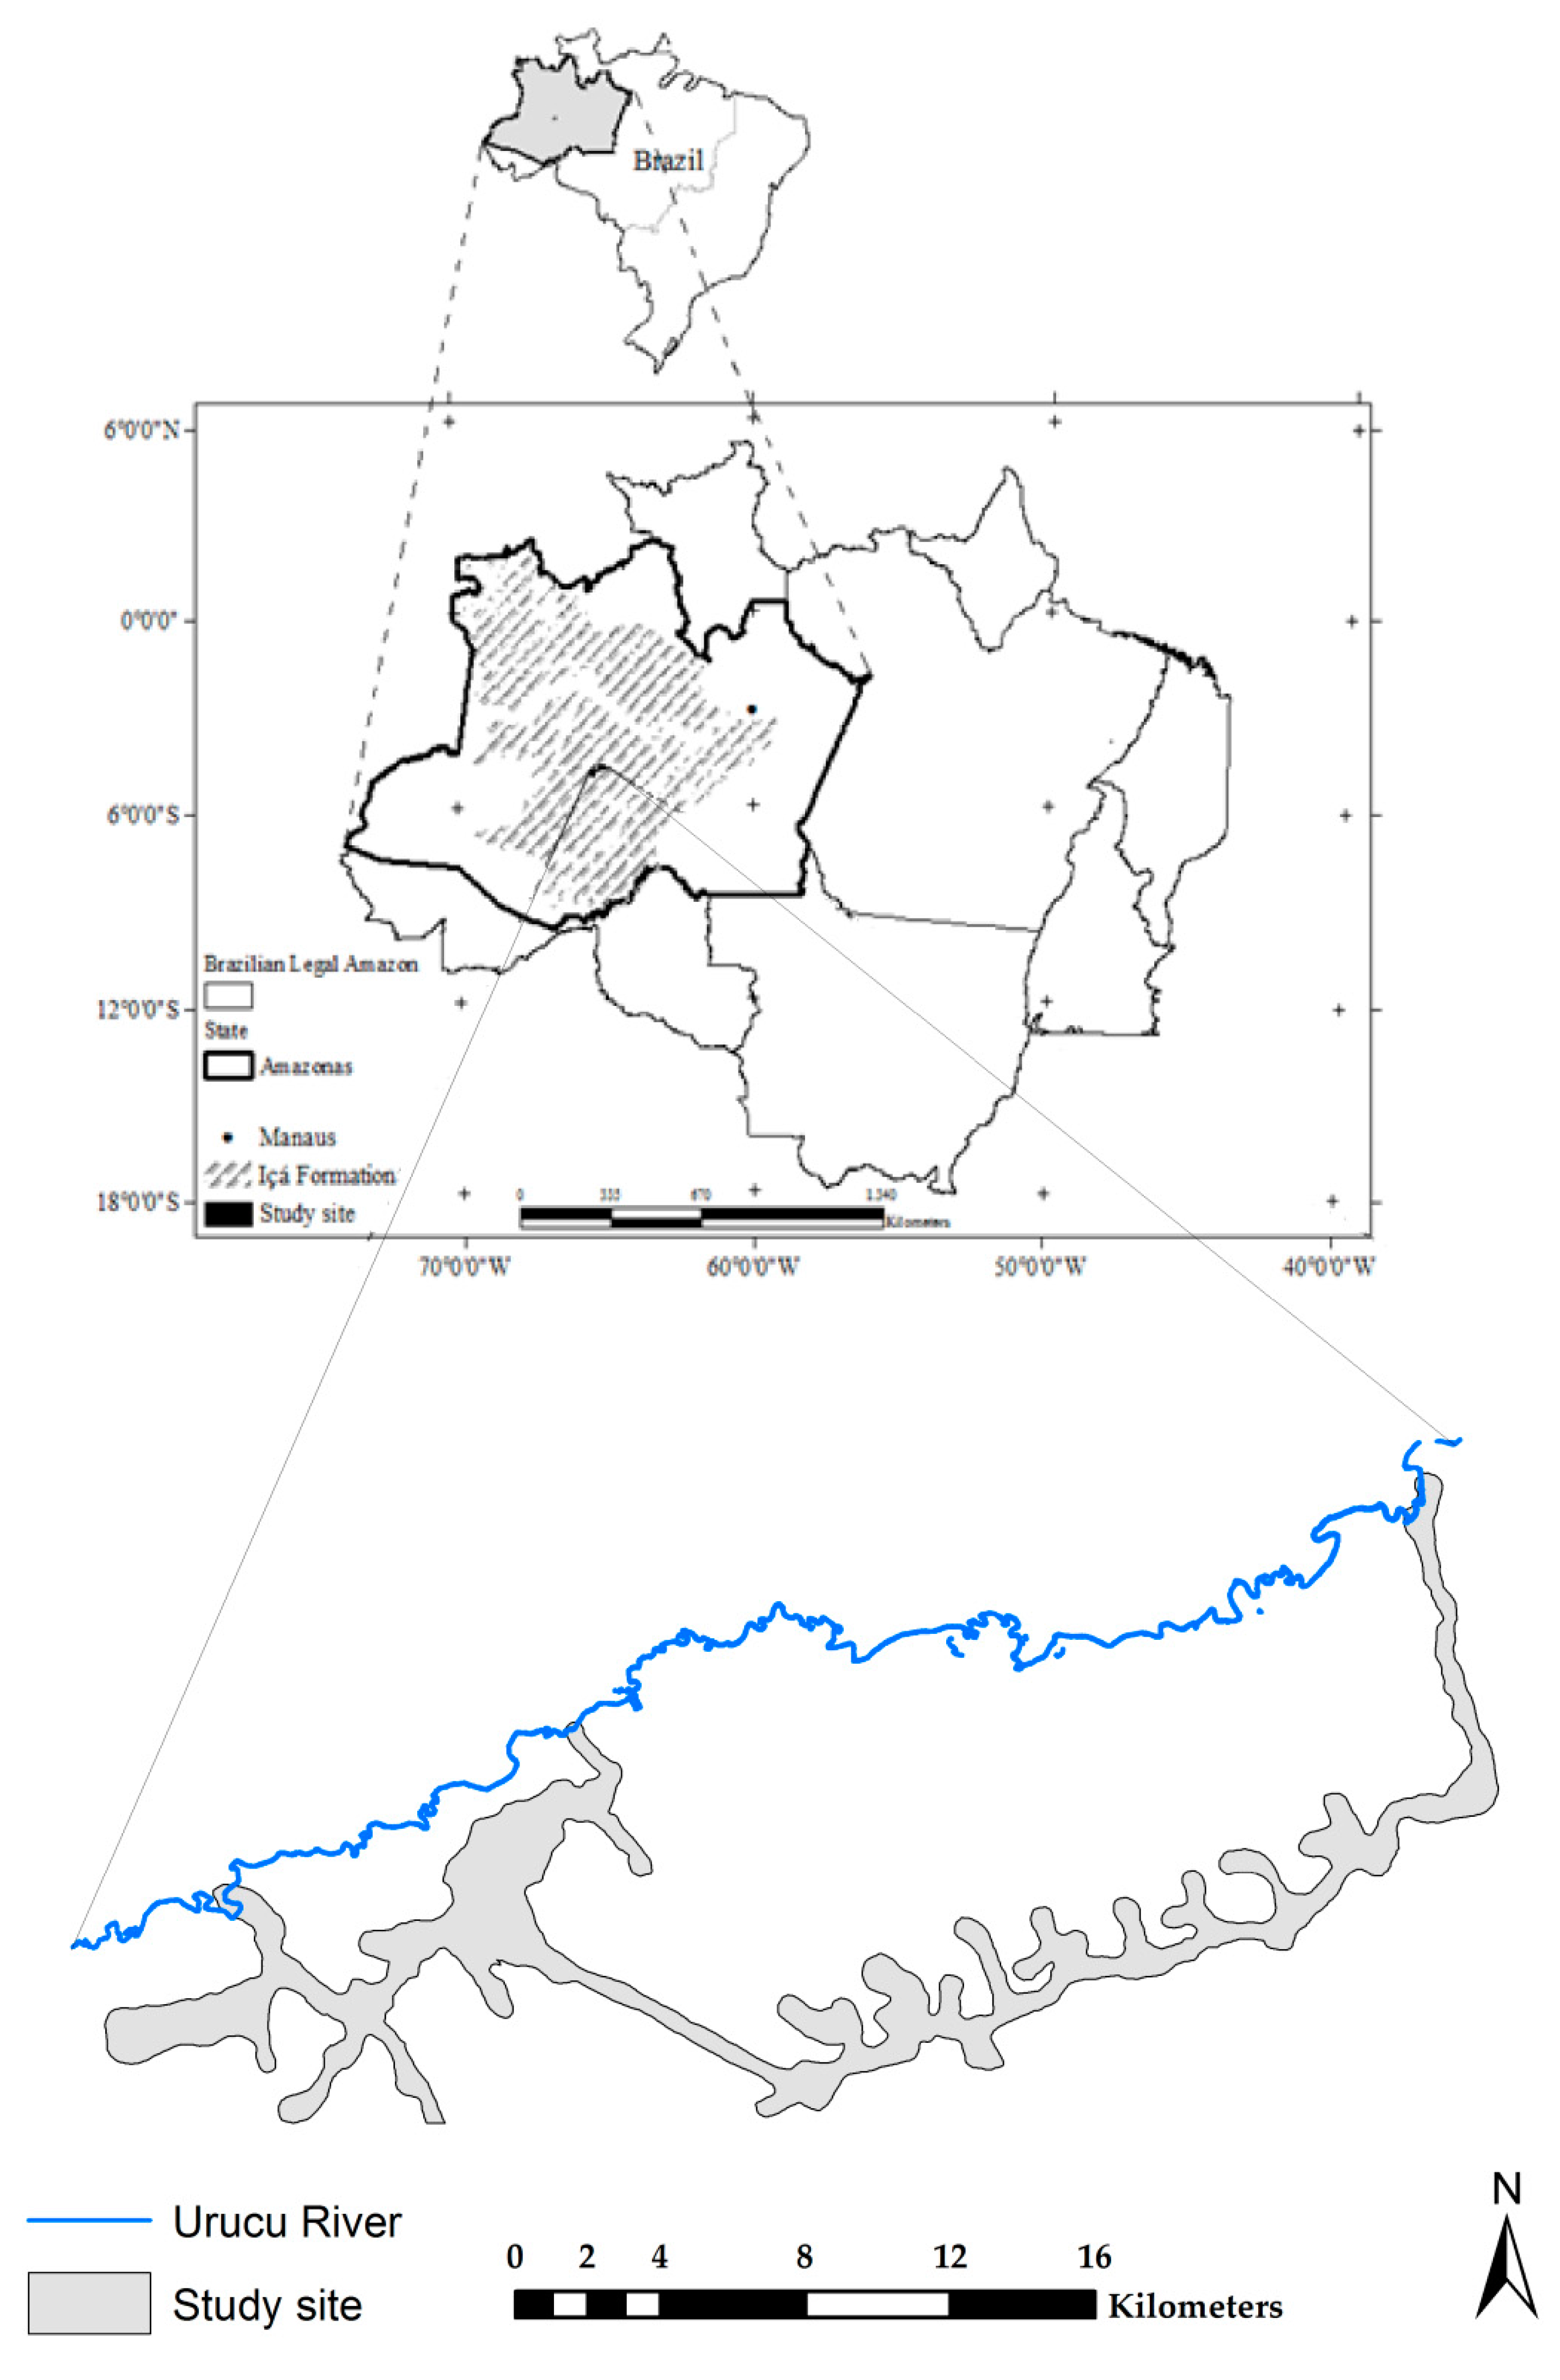
2.1. Study Area

The sample set consisted of 434 soil samples from the Central region of the Amazon state, Brazil (Figure 1). The study site is located in the Urucu municipality. The area is located within the Içá Geologic Formation and encompasses an area of 80 km2 [14]. The climate is equatorial (Af, according to Köppen climate classification), with the temperature of the coldest month greater than 20 °C, and mean annual precipitation of 2500 mm, with no pronounced dry period.
The Içá Geologic Formation is part of the Solimões Sedimentary Basin, which encompasses an area of about 450,000 km2. The basin contains rocks of Paleozoic age, covered by deep sedimentary rocks of Cretaceous to Quaternary origin [15]. In general, the lithology is composed of sandstones, siltstones and claystones deposited under high-energy hydrologic conditions and arid climate [16]. Soil orders in the area include: Argisols, Spodosols, Neosols, Planosols and Cambisols (Table 1). Parent material, relief and local climate are heterogeneous in the Amazon region, thus forming many types of soils with diverse properties, depths, drainage characteristics, and so on. Most soils have low chemical fertility, with low activity clays (1:1 phyllosilicates and Fe and Al oxy-hydroxides, predominantly), and high Al content.

2.2. Soil Sampling and Laboratory Analysis

Between the years of 2008 and 2009, a soil survey was conducted in the Geólogo Pedro de Moura Oil Province, close to the Urucu River, resulting in a detailed soil map (1:10,000) [17], which covers an area of 80 km2 (Figure 1; Table 1). Throughout the soil survey, 96 soil profiles (Table 1) were described and sampled by horizon, totaling 434 horizons/samples. Due to the access limitations imposed by the dense native vegetation, sampling sites were spread across, and restricted to, the region surrounding the access roads along a pipeline of the Brazilian Petroleum Corporation (Petrobras). The pipeline is about 120 km long and spans longitudinally across the Içá Geologic Formation, which is part of the Solimões Geologic Domain. The soils were classified according to the Brazilian Soil Classification System [18], and Soil Taxonomy [19], respectively, and comprised five soil orders according to the Brazilian system (Table 1).
The soil samples were air dried, milled and then passed through a 2-mm sieve. Chemical and physical analyses were performed according to [20]. Measured soil chemical properties included pH (in water, soil/solution ratio of 1:2.5), exchangeable cations (Ca, Mg, Al and H extracted using 1 N KCl and determined titulometrically; and K and Na extracted using diluted HCL and measured using a flame photometer), available phosphorus (P) determined using the colorimetric method [21], and organic carbon (SOC) determined by wet combustion [22]. The sum of bases (SB = Ca + Mg + Na + K), cation exchange capacity (CEC = SB + (H+Al)), percentage of base saturation (V = 100 × SB/CEC), and percentage of Al saturation (m = 100 × Al/[Al + SB]) were calculated from the chemical analytical results.
The pipette method was used for soil particle size analysis to measure the total (dispersed in 0.1 N NaOH) and natural clay (dispersed in water) contents [20]. The sand content was separated by sieving (0.53-mm sieve) and the silt fraction was calculated by difference from the total soil mass. The following indices were calculated: silt/clay ratio (S/C), and degree of flocculation (F = 100 × [total clay − natural clay]/total clay).

2.3. Laboratory Spectral Analysis and Pre-Processing

Laboratory-based VIS-NIR spectral measurements were obtained using a QualitySpec® Pro spectroradiometer (Analytical Spectral Devices Inc., Boulder, CO, USA) with a spectral resolution of 10 nm and sampling interval of 1 nm in the spectral range of 350–2500 nm. In preparation for scanning, the soil samples were thoroughly mixed and placed into 47-mm wide Petri dishes forming a 5-mm thick layer. The Petri dishes were placed in an oven at 45–50 °C for 24 h to equalize moisture, and then in a desiccator to cool down prior to analysis.
For each soil sample, four spectral measurements were obtained by rotating the Petri dish by 90° and then averaged in order to obtain a representative spectrum. Each spectral measurement was the average of 100 internal replicate scans made by the instrument. Soil samples were scanned in sets of ten. Prior to scanning each set, a white reference scan was acquired from white Spectralon® (LabSphere, North Sutton, NH, USA).
Forty-one pre-processing methods were compared to improve soil properties predictions. The pre-processing treatments were applied using the ‘signal’ and ‘pls’ R packages [23]. The treatments included multiplicative scatter correction (MSC), standard normal variate transformation (SNV), pseudo-absorbance transformation (log[1/reflectance]), and Savitzsky-Golay (SG) smoothers, 1st and 2nd derivatives using different polynomial degrees and window sizes, ranging from 3 to 11. Multiplicative scatter correction was applied after the dataset was split into calibration and validation sets. The details about these spectral transformations can be found in [23]. After the application of treatments, the dimensionality of the spectra was reduced by averaging over 10-nm bands. Finally, the spectral range included in the analysis was reduced slightly to exclude potential noise at the limits of the detectors. The ranges of 350–399, 986–1015, 1786–1815, and 2476–2500 nm were thus removed from the spectra.

2.4. Statistical Analysis

Descriptive statistics were derived to characterize the soil data set variability and evaluate outliers, as well as to assess data normality. In addition, linear correlation analysis was performed among transformed soil properties with 95% confidence level to understand their interrelationships. The normality of the data was evaluated by the skewness and kurtosis coefficients, and Kolmogorov-Smirnov test. For data without normal distribution, the Box-Cox transformation [24] was applied using the software Action Stat 2.4 [25] to approximate normal distribution, and its inverse function used to back-transform the predicted values before external validation. For non-negative values of the variable x,s the Box-Cox transformation is defined as (Equations (1) and (2)):
xT = (xβ − 1)/β, for β ≠ 0
xT = ln(x), for β = 0
where: xT is the transformed value of x, and β is the transformation parameter.
Prior to regression analysis using PLSR [26], the dataset (434 samples) was randomly split into calibration (70% of the samples, 304 samples) and validation (30%, 130 samples) sets. The calibration set was used to create the regression models and the validation set was used to independently validate the models. The performance of the models was evaluated by the coefficient of determination (R2), root mean squared error (RMSE), residual prediction deviation (RPD), ratio of performance to inter-quartile range (RPIQ), and bias (Equations (3)–(7)):
R 2 = i = 1 n ( y ^ i y ¯ ) 2 / i = 1 n ( y i y ¯ ) 2
R M S E = i = 1 n ( y ^ i y i ) 2 / n
R P D v a l = s d v a l / R M S E v a l
R P I Q v a l = Q 3 Q 1 / R M S E v a l
B i a s = y ¯ y ^ i
where: y ^ i is the predicted value of the ith observation, y ¯ is the mean observed value, y i is the observed value of the ith observation, n is the number of samples, s d v a l is the standard deviation of the validation set, R M S E v a l is the RMSE of validation, and Q 3 and Q 1 are 3rd and 1st quartiles of the validation set, respectively.
The six levels of interpretation of the RPD given by [27] was adopted, as follows: RPD < 1.0 indicates very poor predictions, unsuitable for analysis; 1.0 < RPD < 1.4 indicates poor predictions; 1.4 < RPD < 1.8 indicates fair predictions, suitable for assessment and correlation; 1.8 < RPD < 2.0 indicates good predictions, suitable for quantitative assessment; 2.0 < RPD < 2.5 indicates very good, quantitative predictions; and RPD > 2.5 indicates excellent predictions.
The PLSR models were derived using the ‘pls’ package in R. The maximum number of latent variables was set at 20 and the type of model used was the classical orthogonal scores algorithm [28]. Ten-fold cross-validation was used to determine the optimal number of latent variables to be included as predictors in the models based on the RMSE of calibration.

2.5. PLSR-VIP Method

In order to assess the influence of each VIS-NIR reflectance band (explanatory variable) on the model results, we calculated the VIP metric for each band, as described by [10] and implemented by [29] (Equations (8) and (9)). For each variable y, the VIP was calculated by:
V I P j = p k = 1 h ( S S ( b k t k ) ( w j k w k ) 2 ) / k = 1 h S S ( b k t k )
S S ( b k t k ) = b k 2 t k t k
where j is the index of the explanatory variables, p is the number of explanatory variables, h is the number of latent variables, SS is the sum of squares, bk is the y-scores for the k-th latent variable, t is the loading scores for the k-th latent variable, wjk is the k-th value for the j-th explanatory variable from the weight matrix, and wk is the weights for the k-th latent variable.
Essentially, the numerator contains the explained sum of squares of y by the PLSR model, and the denominator contains the total sum of squares of y. A spectral band is then considered important in the model if its VIP score is considerably large. In this study, we used the VIP threshold of 1 put forth by [10].

3. Results

3.1. Descriptive Statistics and Correlations among Soil Properties

The descriptive statistics of the soil chemical and physical properties are shown in Table 2. All variables showed a non-normal distribution according to the Kolmogorov Smirnov test, and the following variables were transformed to approximate normality: sand, silt, clay, F, pH, Al, H+Al, P, SB, and m. The β parameter values of the Box Cox transformations are also shown in Table 2.
Soil particle size contents showed a predominance of sand and silt fractions, reflecting the characteristics of the parent material (Table 2). The base saturation was low (mean: 19%), whereas the Al (mean: 4 cmolc·kg−1) and H+Al (mean: 8 cmolc·kg−1) contents were high, which are characteristic of these tropical acidic soils. This is the result of a combination of nutrient-poor parent materials, high rainfall in the tropical rainforest, and low nutrient retention capacity, since the properties affecting nutrient retention are also low [30]. This was confirmed by the low CEC (mean: 9.6 cmolc·kg−1), the dominance of Fe and Al oxides and kaolinite in the clay fraction, the low SOC (mean: 7.99 g·kg−1), and the low pH (mean: 4.5) of these soils (Table 2).
In terms of the linear correlations among soil properties, the SOC was significantly correlated (p < 0.05) to chemical properties, including H (correlation of 0.67), H+Al (0.51), pH (−0.53), and others (Table 3). Exchangeable Ca and Mg were strongly correlated to SB (0.86 and 0.70, respectively), V and m. As expected, exchangeable Al and H+Al were negatively correlated with V (−0.65 and −0.58, respectively), and Al was strongly correlated with m (0.79). The clay content, showed high correlations with chemical properties representing acidity, including Al (correlation of 0.70) and m (0.70), which confirms the dominance of Al in the cation exchange sites in these soils (the average Al saturation was 68% (Table 1). The clay content also showed a high negative correlation (−0.77) with S/C.

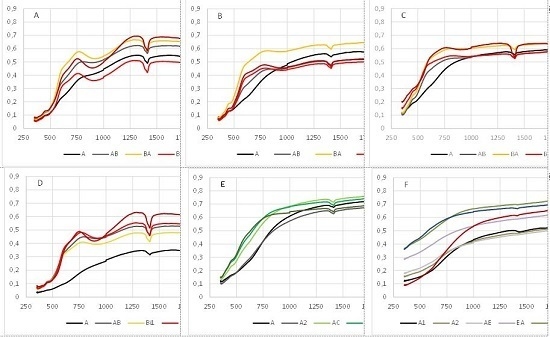
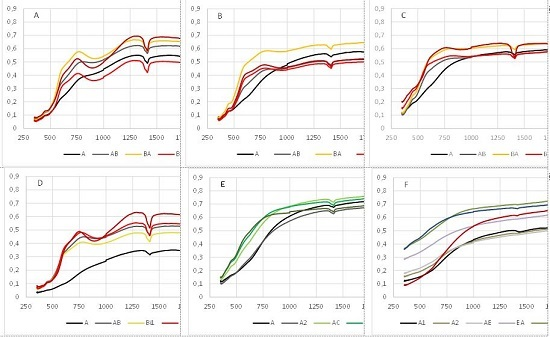
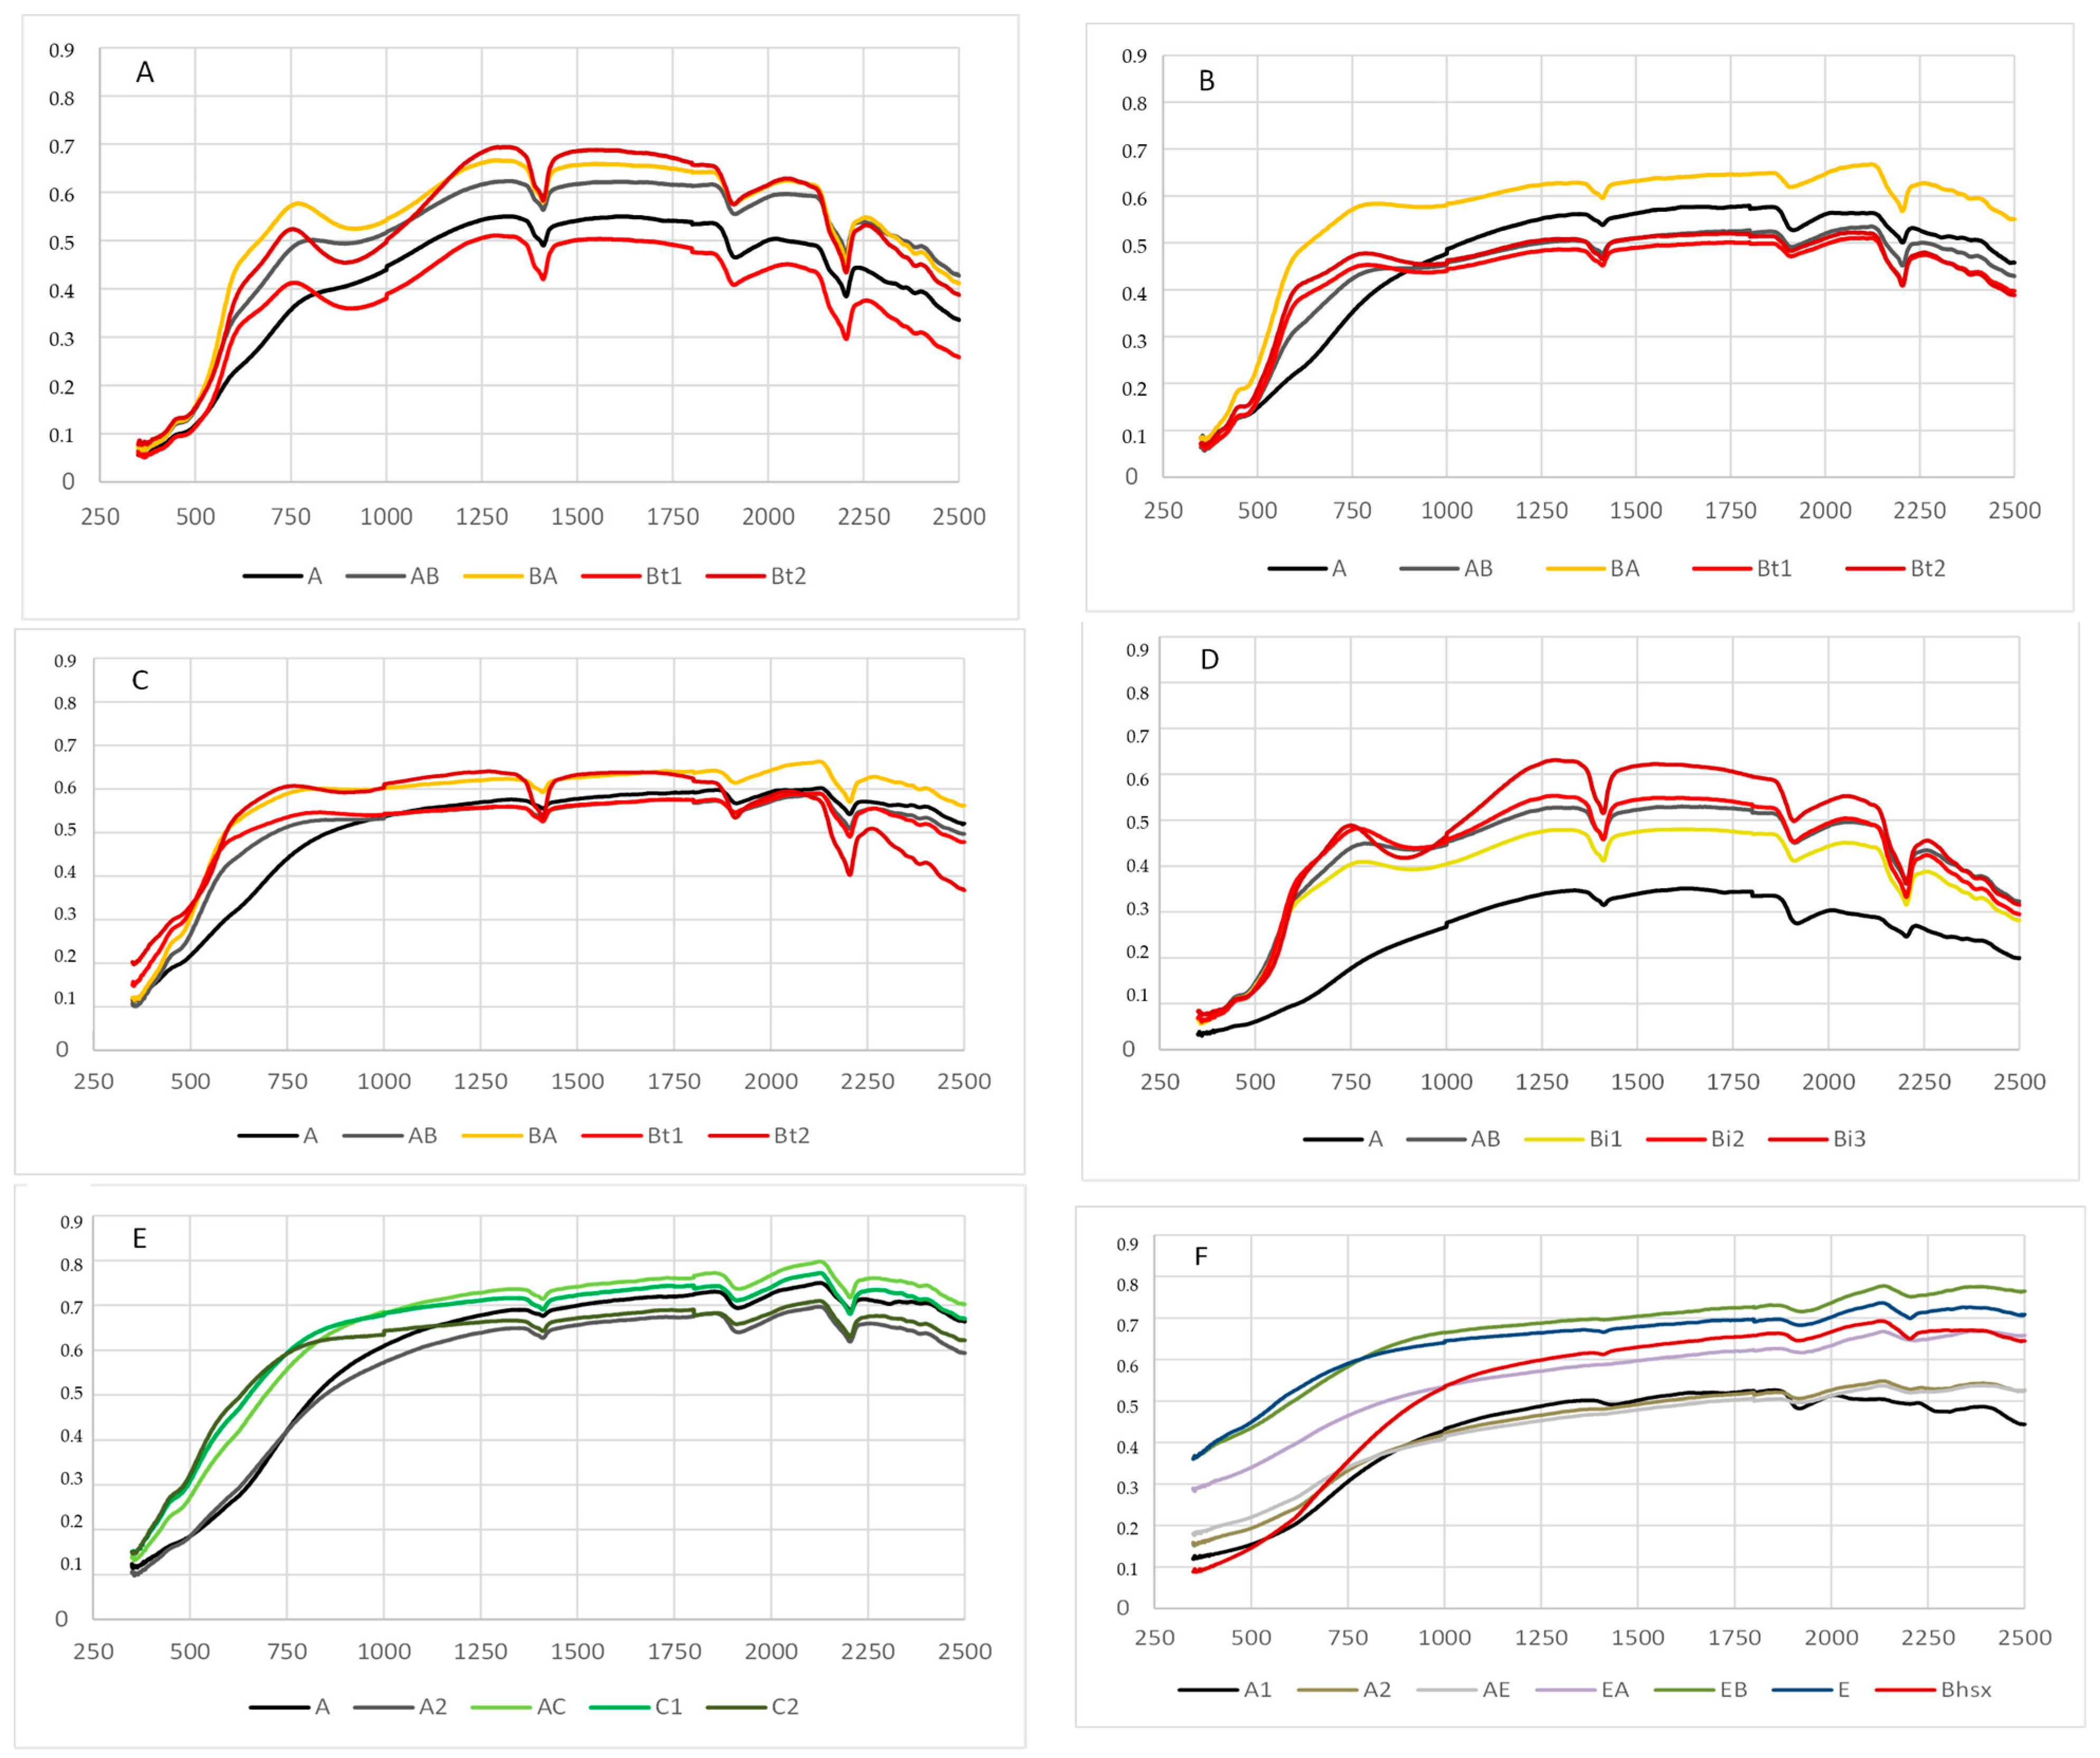
3.2. Qualitative Description of the Soil Spectra

The VIS-NIR spectral reflectance curves of the main soil orders in the study site are presented in Figure 2. In a soil survey, the properties of different soil horizons are important for soil characterization and classification, thus, the spectral reflectance of different soil horizons are presented. In general, the different soil orders showed similar spectral signatures in the VIS-NIR region, except for the Spodosols. In addition, in each soil class, the curve shape and reflectance intensity was similar across horizons (Figure 2). The soil spectra of all soil orders showed prominent absorption features at 1400, 1900 and 2200 nm, however for the Spodosols these absorption features were less evident.
Differences in the absorption peaks were observed between the soil horizons. For example, goethite shows strong absorption features near 480 and 900 nm (Figure 2). The 900-nm band was more evident in the Bt1 and Bt2-horizons of Argisols and Cambisols. A-horizons of all soil orders in the study site did not have prominent absorption features in these typical mineral-related VIS-NIR regions.
The number of selected wavelengths (bands) and its distribution varied strongly depending on the pre-processing method that was used (Table 4). Overall, the best pre-processing methods, based on the R2, RMSE, RPD and RPIQ, were Savitzky Golay smoothing and derivatives, which were chosen for ten out of the seventeen soil properties (Table 4).

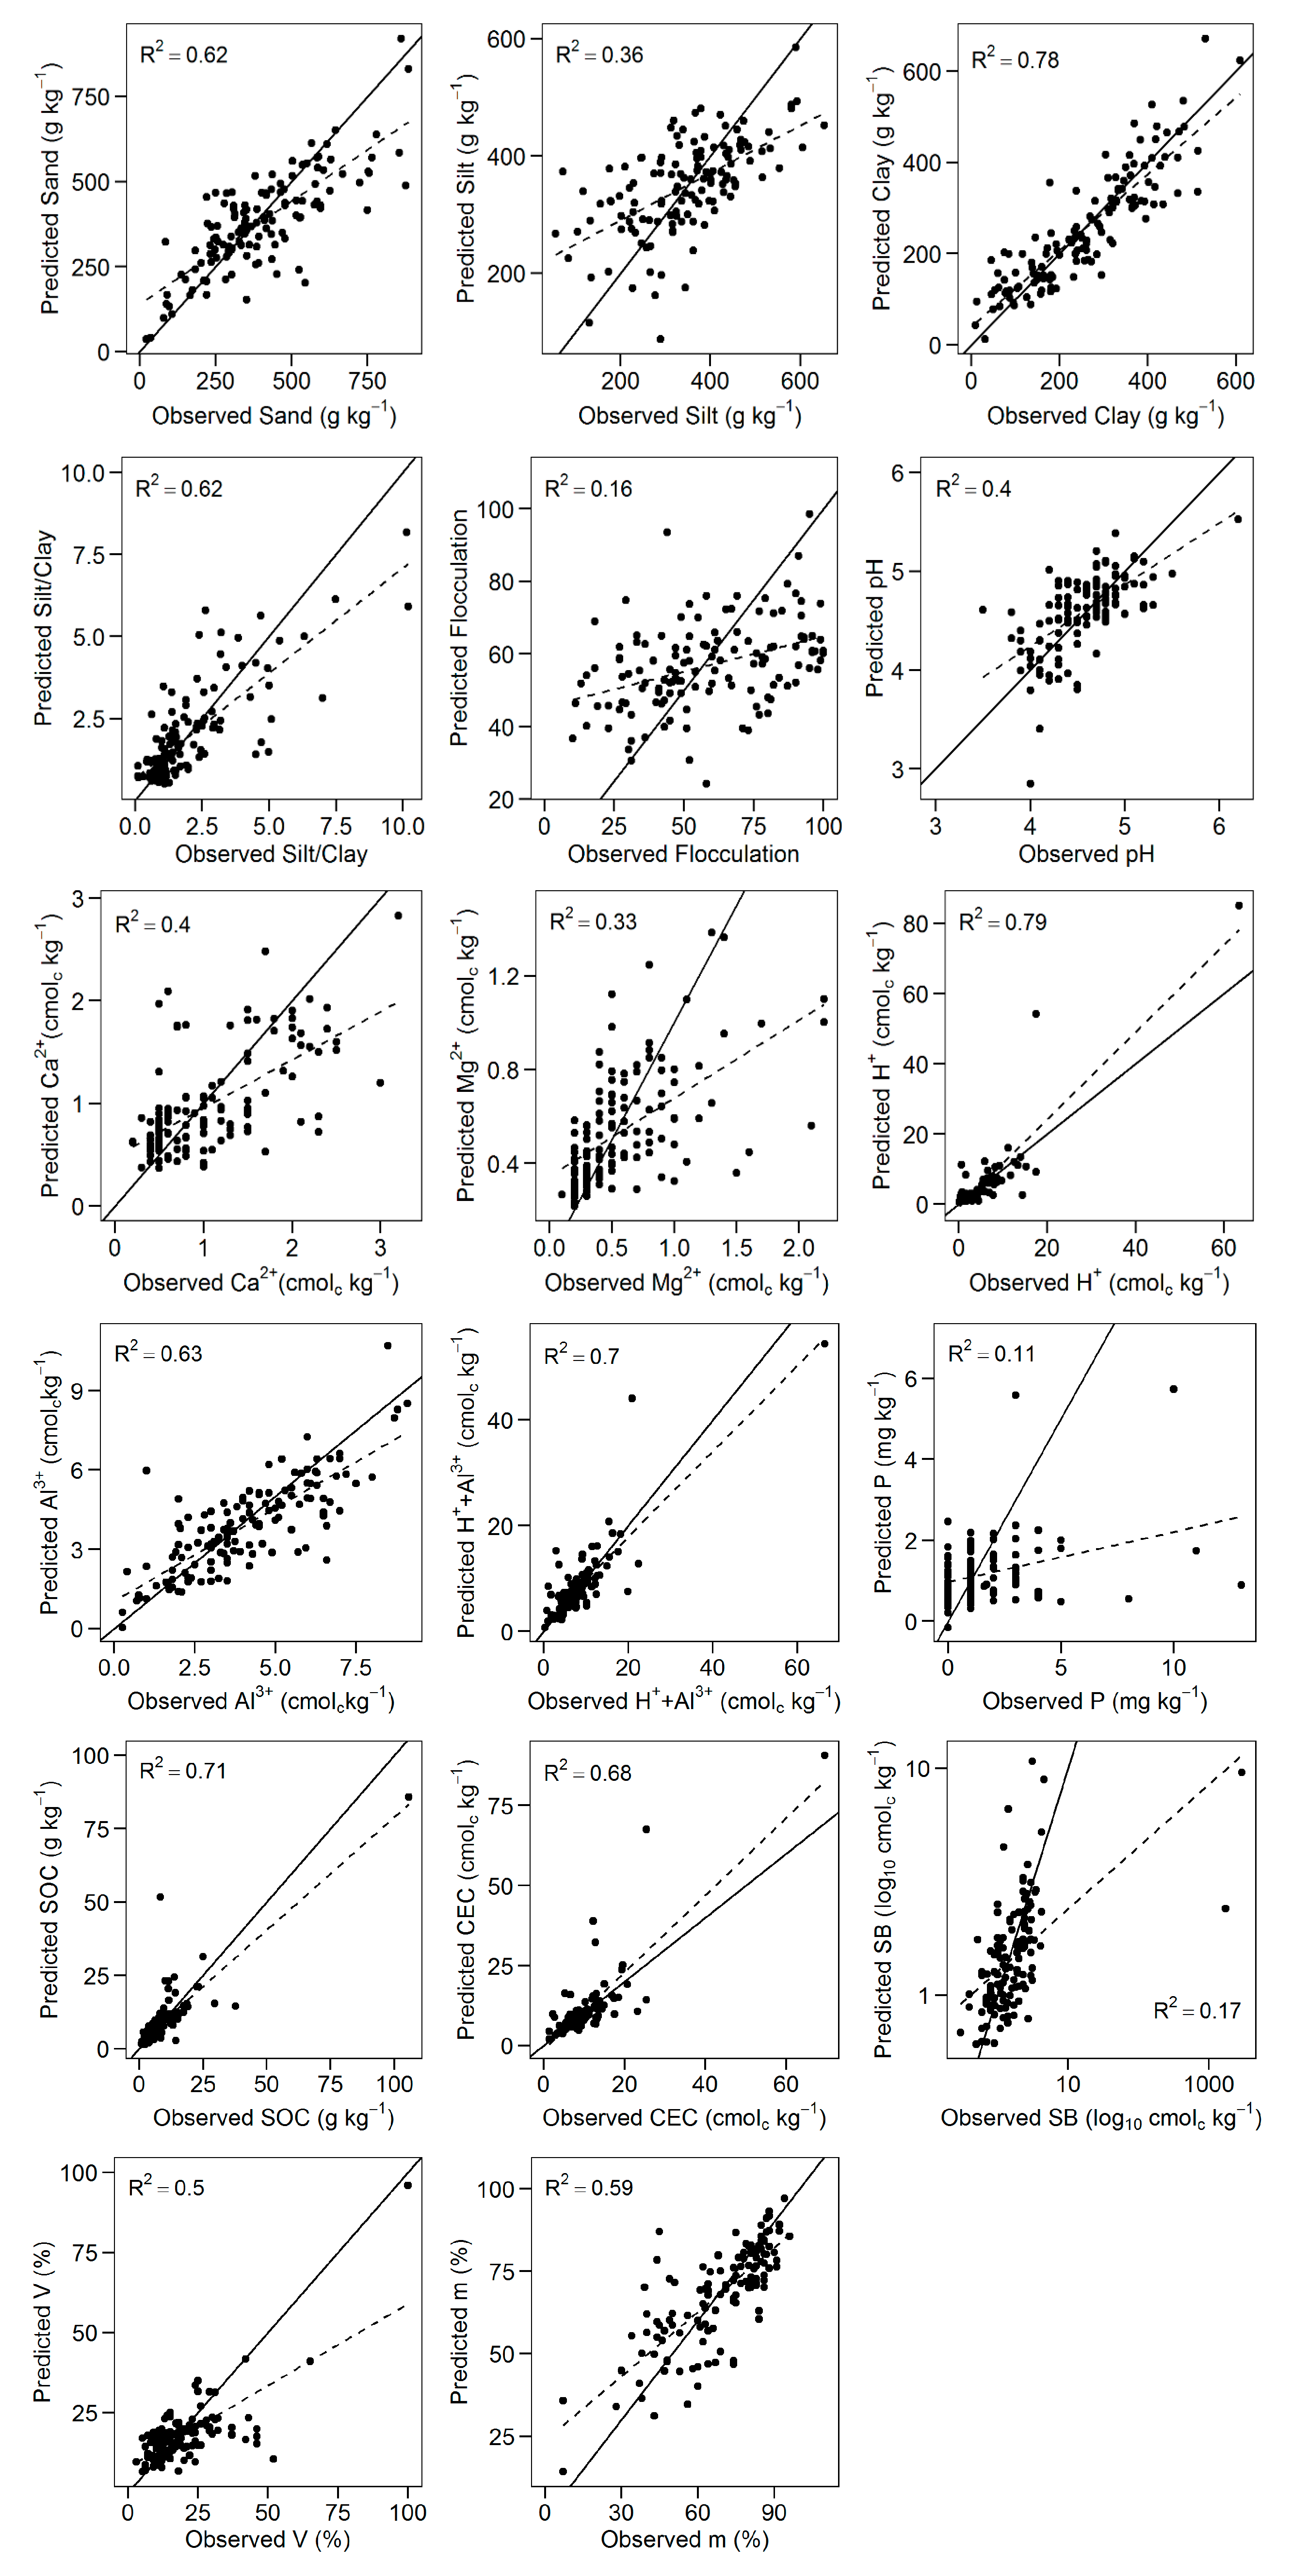
3.3. Predictions of Soil Chemical and Physical Properties

Clay content was predicted with the highest accuracy (R2: 0.78, RPD: 2.14), followed by soil organic carbon (R2: 0.71, RPD: 1.84) (Table 4). Sand, S/C, H, Al, H+Al, CEC, m and V predictions were moderately well predicted from VIS-NIR spectra. H, Al, H+Al and m had a R2 of 0.59–0.75 and RPD of 1.4–1.8. V value and CEC had a R2 of 0.50 and 0.68, RPD of 1.40 and 1.17, respectively. VIS-NIR also indicates limitations to predict specific soil properties, such as Ca, Mg, P, pH, SB, silt and F, with RPD between 1.0 and 1.4 (Table 4). The observed versus predicted values for soil chemical and physical properties are shown in Figure 3.

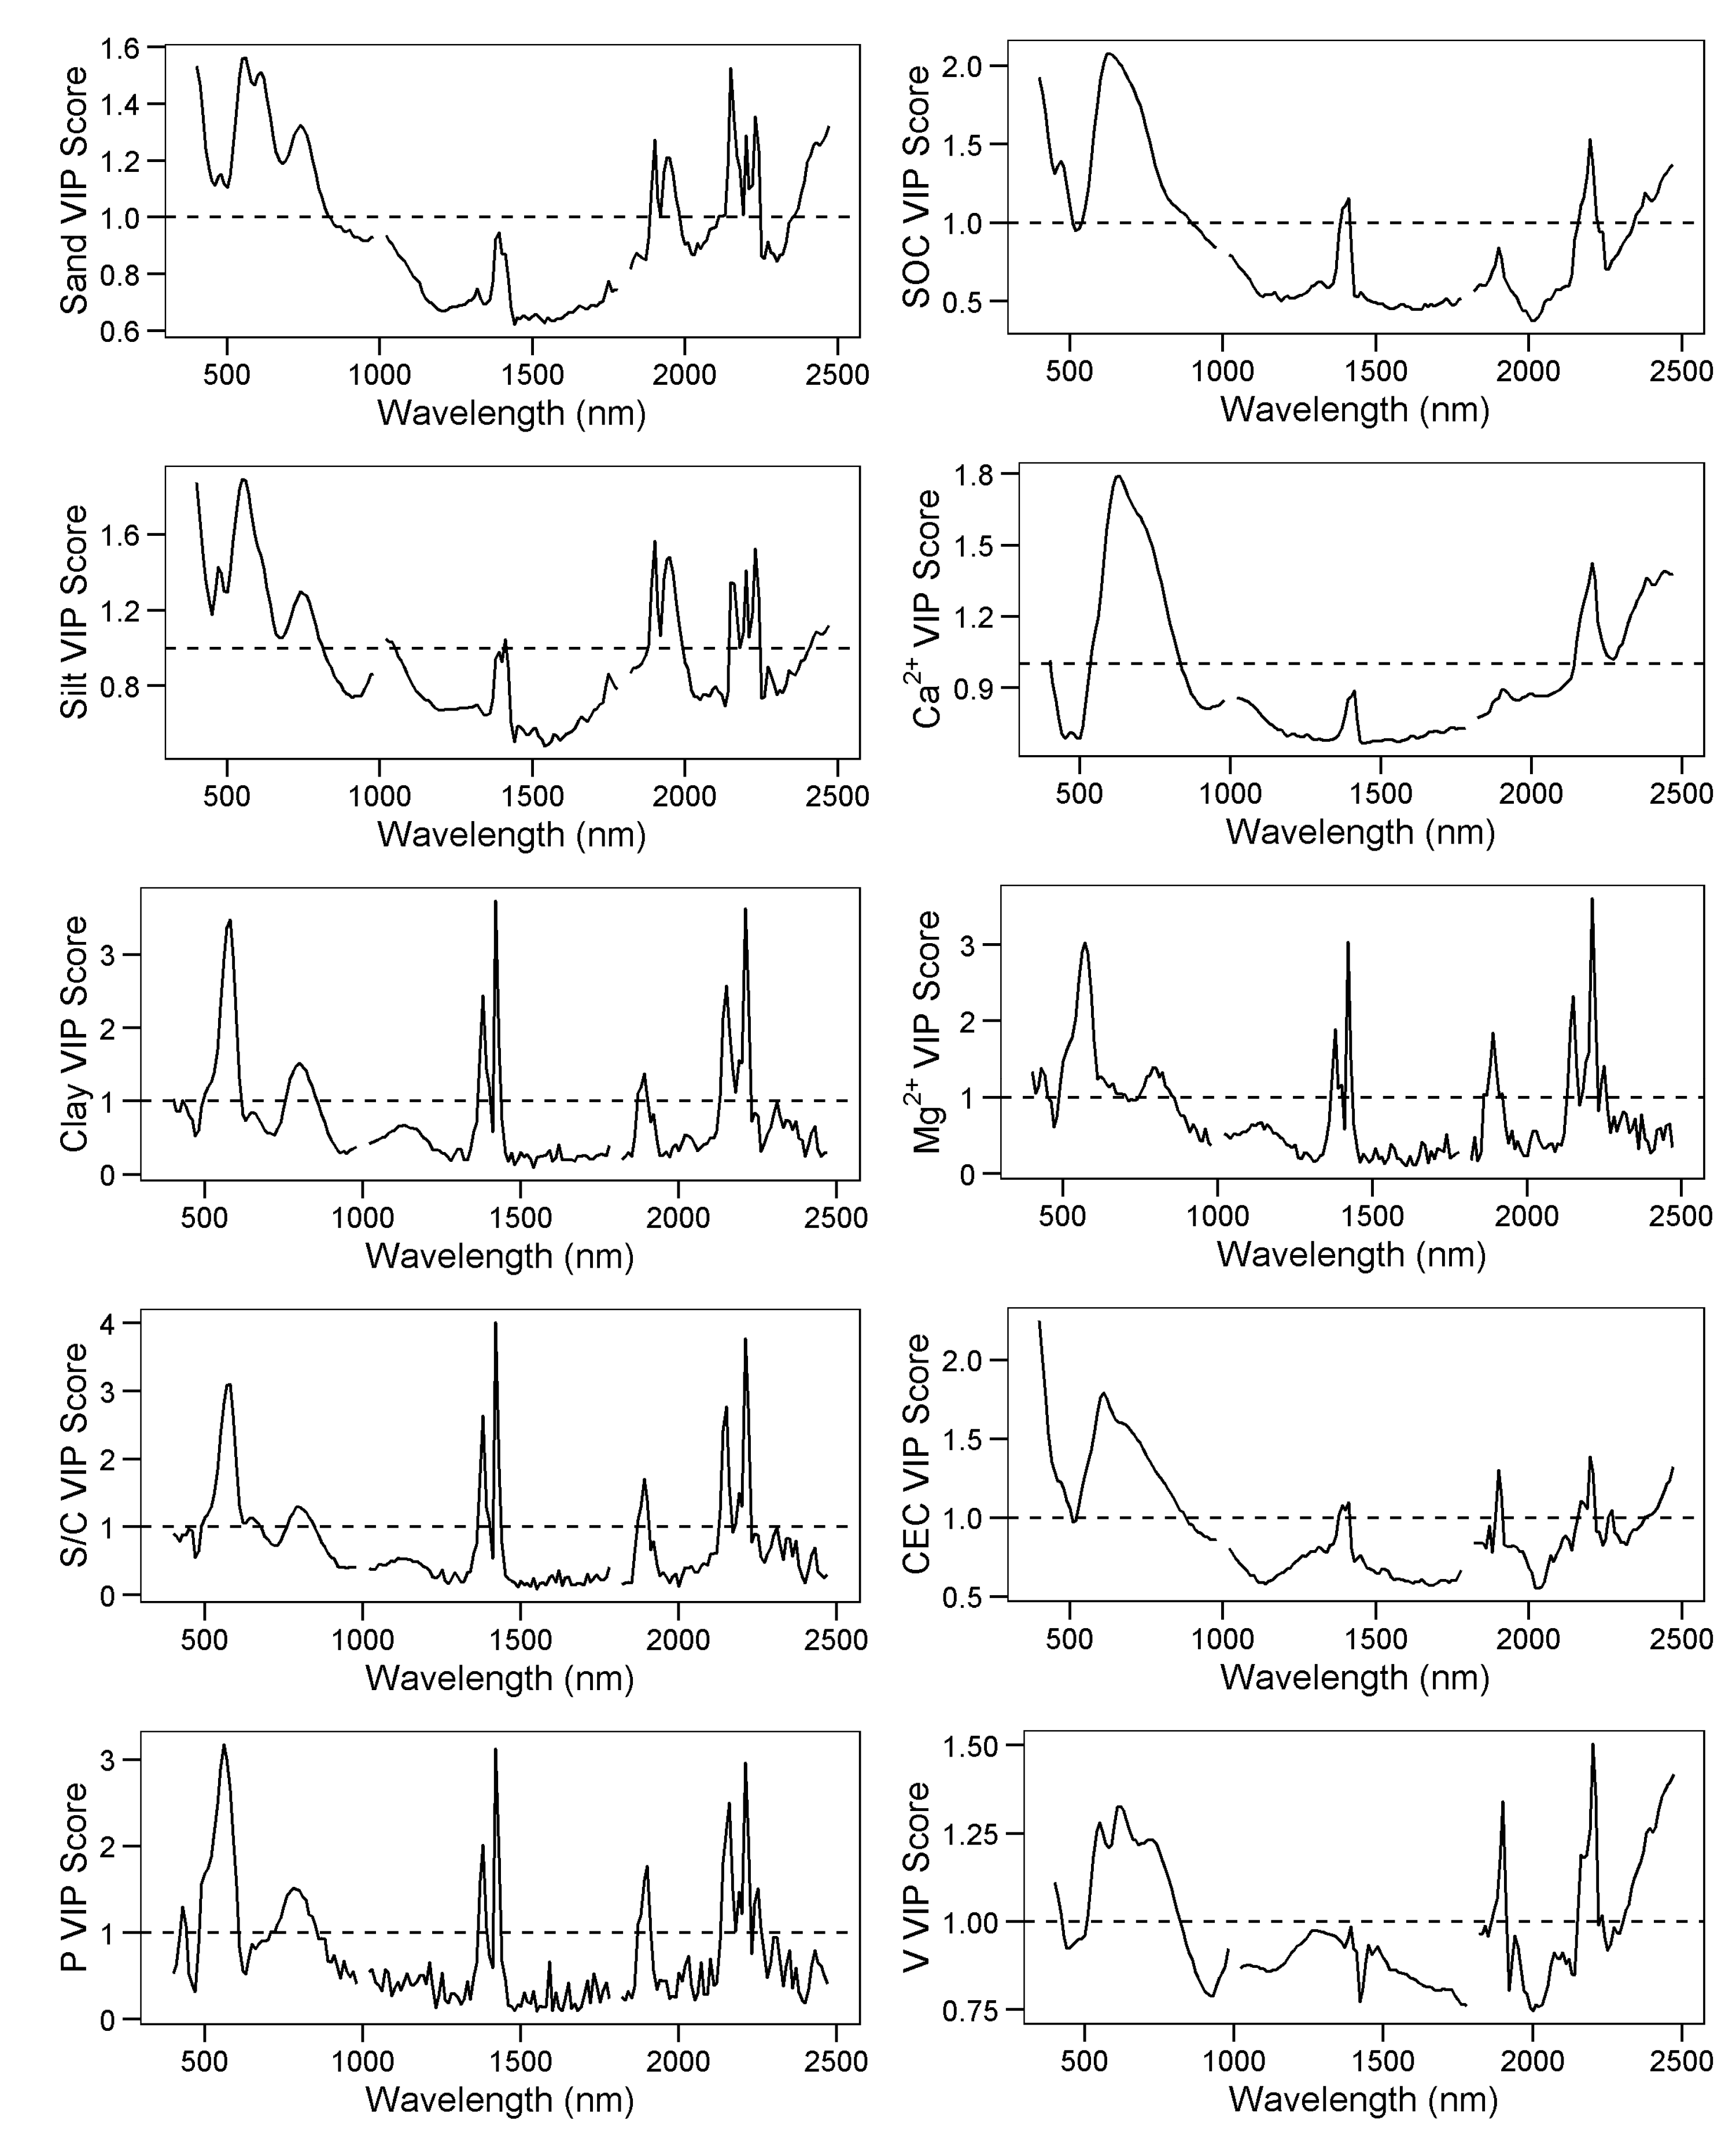
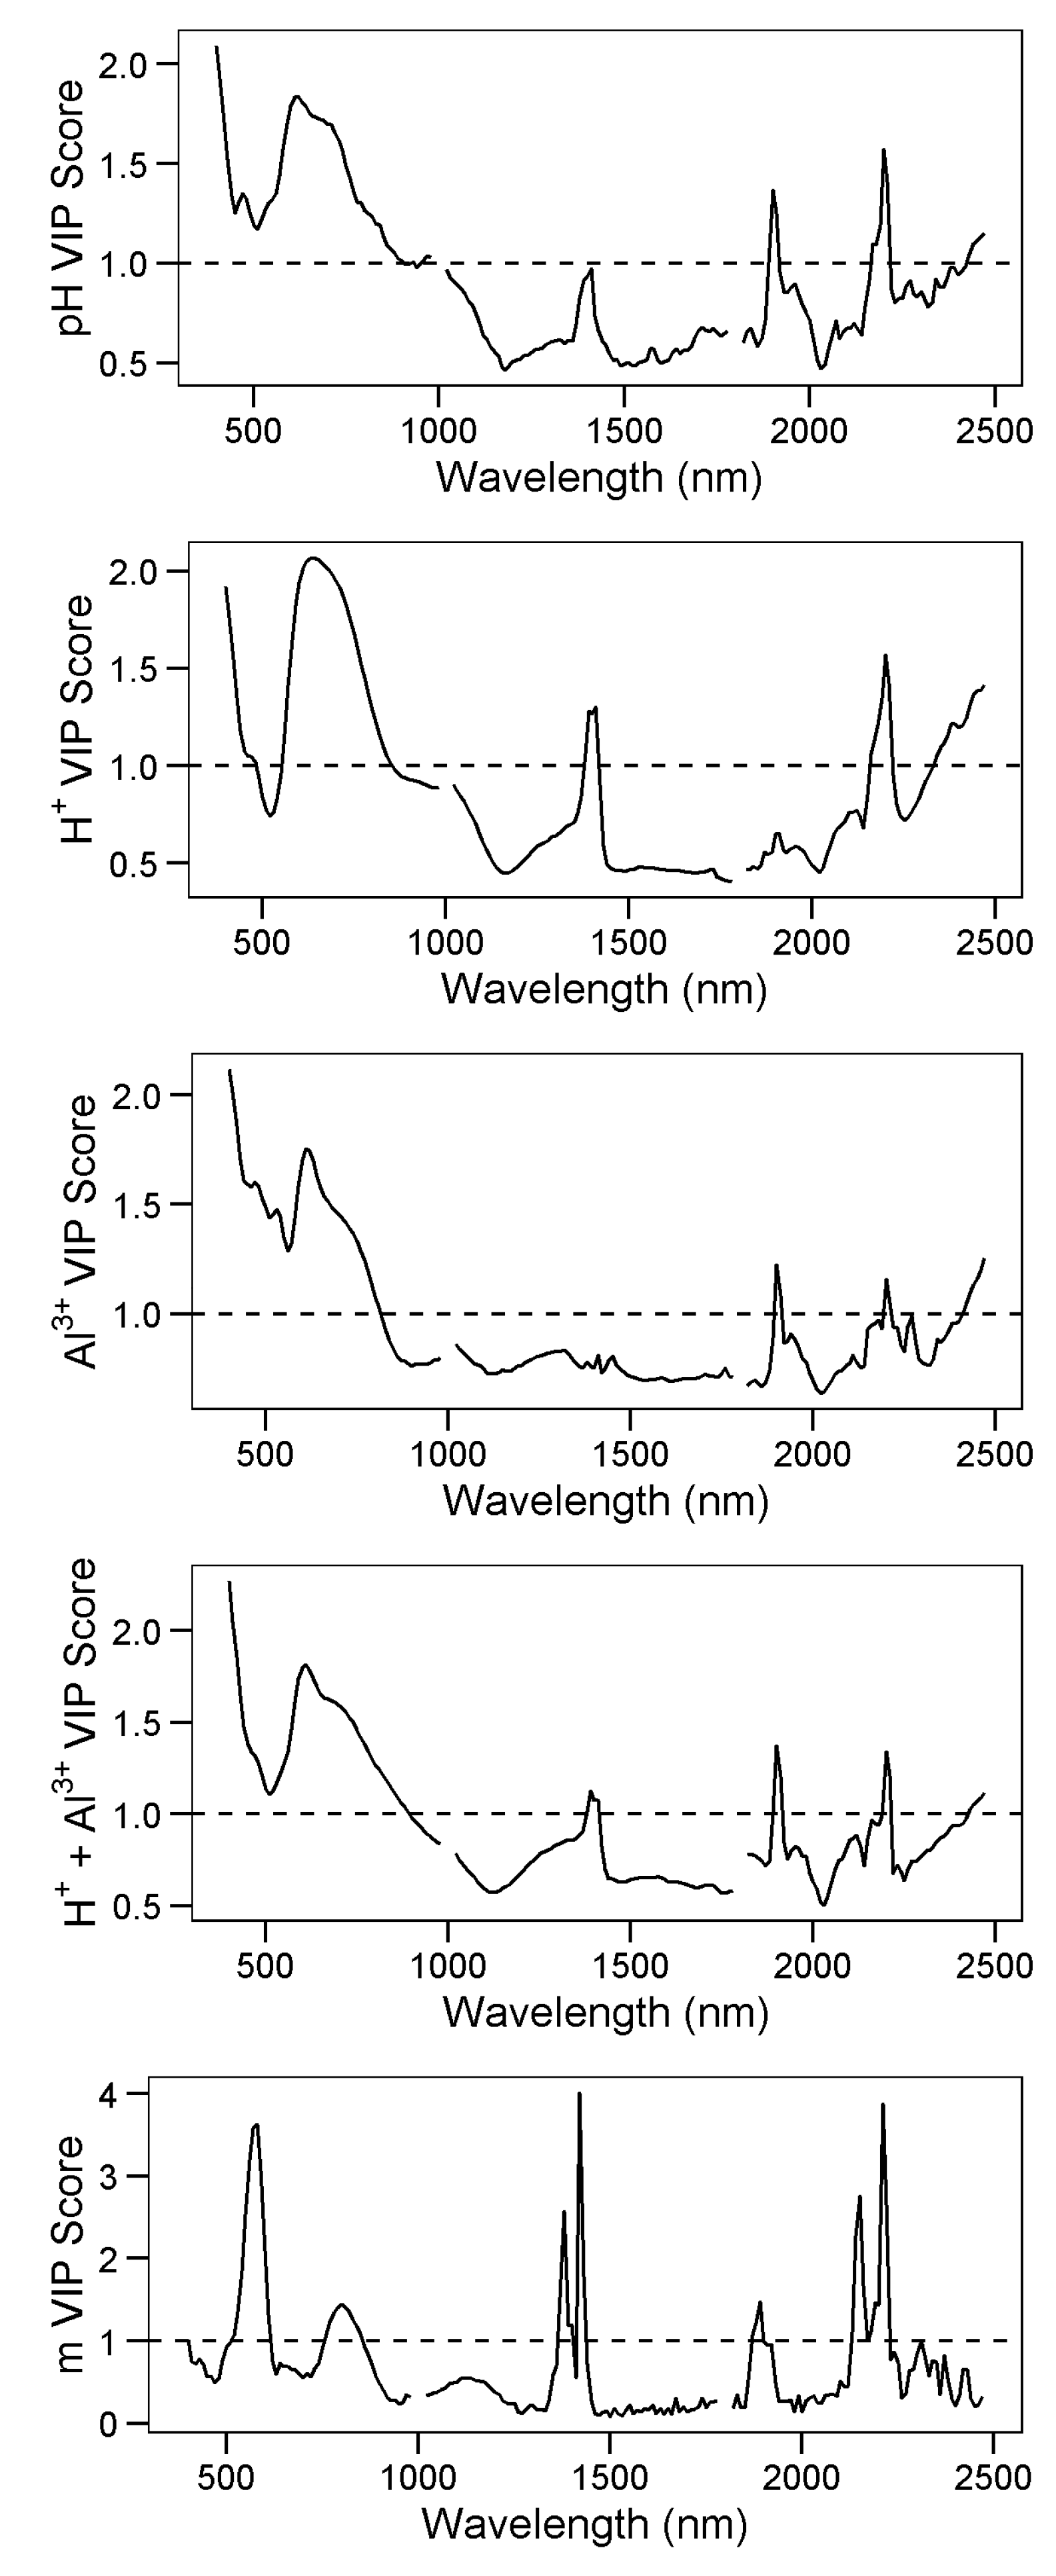
3.4. Explanatory Variable Importance

The VIP scores from the PLSR models for the 15 soil properties are presented in Figure 4. The sum of bases (SB) and degree of flocculation (F) were not included in the VIP analysis due to poor model performance. The VIP scores from the sand PLSR model are greater than one in the spectral regions 400–830, 1890–1980, 2110–2240 and 2330–2470 nm, with a peak at 740 nm, double peaks at 560/610 nm and 1900/1940 nm, and a triple peak at 2150/2200/2230 nm. The VIP scores for the clay model are greater than one in the spectral regions 500–610, 760–850, 1370–1400, 1420–1430, 1870–1900, and 2130–2220 nm. The VIP peak around 800 nm may be linked to hematite and/or goethite while the VIP peaks around 1380/1420 and 2150/2190/2210 nm are likely the influence of –OH and Al-OH groups, respectively, on the model from kaolinite and illite.
The silt VIP score graph has features of both the sand and clay VIP graphs. Moreover, the silt/clay VIP score graph highly resembles the clay VIP graph, indicating the importance of clay mineral features on its prediction.
For chemical predictions, the VIP graph for SOC shows scores greater than one in the spectral regions 400–500, 540–890, 1390–1410, 2170–2220, and 2350–2470 nm. The VIP scores for the remaining soil properties (V, pH, Al and combined exchangeable H and Al) contain features found in the sand, clay, and SOC VIP score plots, highlighting the complex relationships these properties have with soil mineralogy and chemistry. Other soil chemical properties do not exhibit spectral response features.

4. Discussion

4.1. Correlations between Soil Properties

The matrix of linear Pearson correlations (Table 3) showed that chemical properties suggesting soil acidity, such as H (R2: 0.67), H+Al (R2: 0.51), pH H2O (R2: −0.53) and m (R2: −0.42) had considerable correlation with SOC. CEC (0.52) and SB (0.51) also correlated with SOC suggesting the important role of organic content at the charge generation of tropical soils. It is well recognized that soil organic matter has a substantial contribution to the CEC of the whole soil and to the retention of exchangeable cations [30]. Humic substances (fulvic acids, humic acids and humin) are formed contributing to the soil acidity through their high amounts of acidic functional groups. These functional groups, such as the –COOH (carboxylic) and the –OH (phenolic groups), dissociate H+ (contributing to soil acidity) and thus exchangeable cations can be chemically bound [31].
Exchangeable H and H+Al were strongly correlated with CEC (R2: 0.80 and 0.96, respectively). It is common to have high Hand Al content in the Amazon Forest soils (Table 3). Al content had a positive correlation (R2: 0.70) with clay content and a negative correlation with SOC. Amazon soils are often highly weathered and therefore possess low plant-available nutrient contents [29]. 30 Basic cations such Ca, Mg, Na and K are easily leached by the usually high precipitation (2500 mm/year) contributing to the lower CEC (mean 9.6 cmolc·kg−1). Hand Al are preferably linked to the soil colloids due to its lower ionic ray and higher valence, respectively.
Phosphorous presented low correlation with spectrally detectable ones (clay content, soil organic carbon). Terra et al. [32] observed that the order of prediction modeling for other non-spectrally detectable soil properties is dependent on their correlation with the detectable ones.
According to Terra et al. [32] soil properties directly detectable by VIS-NIR spectroscopy such as clay, iron and aluminum oxides, hydroxide contents and SOC can be modeled by first-order predictions; however, the order of prediction modeling for other non-spectrally detectable soil properties will be dependent on their correlation with the detectable ones. For example, other properties indicating soil acidity, fertility and mineralogy can be modeled by second-order or even third-order predictions due to the significant correlation with clay and organic carbon content [33]. It is important to notice the role of soil organic matter in generating charges in tropical soils even with low content and under weathering conditions which have influence on the adsorption of ions and, consequently on their predictions. The matrix of linear Pearson correlations (Table 3) showed that SOC had considerable correlation with H (r: 0.67), H+Al (r: 0.51), pH H2O (r: −0.53), m (r: −0.42), CEC (r: 0.52) and SB (r: 0.51).

4.2. Predictions of Soil Chemical Properties

Soil organic carbon showed one of the best predictions among the soil properties in our study with a RPD of 1.84, RMSE of 5.69 g·kg−1, RPIQ of 1.05, and R2 of 0.71. In [34],a literature review showed that SOC predicted with PLSR had a RPD ranging from 0.23 to 5.75, bias from −0.45 to 1.6, and the highest RMSE was 9.0 g·kg−1. Additionally, when SOC was predicted using standard normal variate (SNV) pre-processing, the following results were observed: RMSE of 5.7–6.8, bias of 0.6–1.9 and RPD of 2.2–2.7 [34]. Viscarra Rossel et al. [27] reported average R2 for SOC prediction as 0.81 in the near infrared (NIR) region, 0.78 in the VIS region and 0.96 in the MIR region. Although MIR spectra generally produced more accurate results, especially for SOC, due to its stronger direct relation with MIR spectral data produced by fundamental vibrations, the technology is more complex and expensive than that used for VIS and NIR measurements [27]. Recently, Terra et al. [32] observed a R2 of 0.65 and a RMSE of 0.16 for SOC predictions in the VIS-NIR region, for four states in the Brazilian tropical soils.
In our study SOC varied from 0.1 to 105.6 g·kg−1 (Table 2), with lowest SOC observed in Neosols, Yellow Argisols and Greyish Argisols, and highest SOC observed in Red Argisols and Yellow Argisols. These results are in agreement with other findings in this region [2]. The highest SOC values were observed in the O and A-horizon, due to the high litter input by the forest. All the outliers, reducing SOC prediction, were observed in the O and A-horizon (Figure 3). The presence of non-degraded or partly degraded organic material in the topsoil can increase the prediction uncertainty [30,31,32,33,34,35]. The model was more efficient to predict in the subsurface horizons due to more humified (humic acids) organic matter that has absorption in the VIS-NIR region. Therefore, stratification of soil order and horizons can produce more a homogeneous group and may improve the model performance [2].
Soil properties suggesting acidity, such as m, H, Al and H+Al performed moderately well, with R2 of 0.59–0.75 and RPD of 1.4–1.8 (Table 4). According to the six level interpretations of RPD in [27], these models/predictions were classified as fair and may be used for assessment and correlation. Terra et al. [32] predicted physical, chemical and mineralogical soil properties using VIS-NIR and MIR spectroscopy, on 1259 soil samples from four Brazilian states. The authors observed fair predictions only for potential acidity(R2: 0.54, RPIQ: 2.01), while other predictions of acidity were unreliable in the VIS-NIR region.
Other chemical properties suggesting soil reactivity and fertility, such as Ca, Mg, P, pH, and SB could not be well predicted from the VIS-NIR spectra, with RPD between 1.0 and 1.4. On the other side, the V value could be predicted moderately well (R2: 0.50, RPD: 1.40) by VIS-NIR spectroscopy in our study (Table 4). Terra et al. [32] could not predict well Ca, Mg, P, K, pH, SB and V value in the VIS-NIR region for four States in the Brazilian soils. For instance, the P model in our study had an R2 of 0.11, comparable to that presented by Janik et al. [36] (R2 of 0.07) and Araújo et al. [37] (R2 of 0.05) using MIR spectra, whereas high R2 (0.81) was obtained by Daniel et al. [38] using VIS-NIR spectra.
The average R2 for CEC in our study was 0.68, a RPD of 1.17 and the RMSE was 5.86 (Table 4). According to the six levels of interpretations of RPD given by [27], 1.0 < RPD < 1.4 indicates poor predictions. Viscarra-Rossel [27] also observed a good R2 (0.73) for CEC prediction in the VIS-NIR and 0.82 in the MIR region in Australian soils. Terra et al. [32] also observed R2 values (0.72) very close to this study of and RMSE of 0.14 for CEC prediction in Brazilian tropical soils. The calibration models for P, K, and SOC did not provide good predictions for Amazon Dark Earths [37], showing very low R2 and RPD from both MIR and VIS-NIR spectra. The reason why certain soil properties were or not accurately predicted using VIS-NIR is that the fundamental molecular vibrations of soil components occur in the mid-IR, while only their overtones and combinations are detected in the NIR [27]. Hence, soil VIS-NIR spectra display fewer and much broader absorption features compared to MIR spectra.

4.3. Predictions of Soil Physical Properties

Clay content showed a good fit (R2 of 0.78), very good quantitative predictions (RPD of 2.14), low bias (−1.75 g·kg−1), and an RMSE of 61.70 g·kg−1. The modeling performance for clay and sand in our study are in agreement with the results found by [32,39,40,41] which ranged from 0.51 to 0.86 (R2) and 31 to 120 g·kg−1 (RMSE) for both soil fractions. However, all these studies used different soils, methodologies, prediction algorithms and soil properties were not back-transformed in some situations. The low performance of the silt content prediction can be explained by the error associated with the laboratory method. In this case, the silt content was computed after measuring the clay and sand content. It means that the most part of the analytical error is computed in the silt fraction. The silt/clay ratio was moderately well predicted in our study with an R2 of 0.62, RPD of 1.63 and RMSE of 1.09 (Table 4). Most of the S/C ratio outliers (62%) belong to moderate to an imperfectly drained soil (Figure 3). According to Bellon-Maurel and McBratney [34], high bias should be avoided as it cannot be removed by averaging the measurements. Chang et al., Shepherd and Walsh, Cozzolino and Moron [42,43,44] obtained good R2 (0.67, 0.78 and 0.86, respectively) for clay content models from VIS-NIR spectra using principal components regression (PCR) models. Terra et al. [32] found significantly higher performance for clay and sand content in the MIR region compared to the VIS-NIR region in Brazilian tropical soils. Greater predictive performance for particle size is usually observed in the MIR compared to the VIS-NIR region. It can be explained by the stronger interaction between mid-infrared reflection spectra and soil particles by fundamental vibration processes when compared to the VIS-NIR [27,39,40].

4.4. PLSR-VIP Method

The VIP scores from the PLSR model for 15 soil properties are presented in Figure 4. Sum of bases (SB) and flocculation level (F) were not included due to poor model performance but soil phosphorus was included to compare to other soil elements. Any spectral band with a VIP score greater than one is thought to contribute to the model prediction [29].
The VIP scores from the sand PLSR model in the first region (400–830 nm) correspond to electronic transition within the visible portion of the spectrum. Hematite has strong absorbance peaks at 400 and 855 nm and a reflectance peak at 750 nm, which gives its red color [40,45]. The high VIP score at 400 nm and the peak at 740 nm likely indicates that the presence of hematite is contributing to sand model performance. This would make sense since hematite would exist on sand particles as a coating agent. The double peak at 560/610 nm is likely due to overall soil color as this region does not correspond directly to mineralogical spectral features. The VIP score double peaks at 1890/1980 nm are related to structural water and the triple peak at 2150/2200/2230 is due to Al-OH groups [45]. This indicates that clay mineralogy also had an influence on the sand PLSR model. The incorporation of hematite and clay mineral spectral features may be one reason the sand model performed more poorly than the clay model (R2: 0.62 vs. 0.78). The other reason may be that quartz, the dominant mineral in the sand fraction, does not have spectral features in the 400–2500 nm region.
The silt VIP score graph has features of both the sand and clay VIP graphs, perhaps indicating the mixed mineralogy of this particle size fraction (combination of primary and secondary minerals) and the difficulty of the PLSR model to predict it (R2: 0.36). The silt/clay VIP score graph highly resembles the clay VIP graph, indicating the importance of clay mineral features on its prediction.
For SOC, the first two regions are broadly related to soil color, primarily to organic matter (humic acids), hematite, and goethite [45]. The VIP score peak at 1400 nm is due to water hydroxyl (–OH) groups that may be adsorbed to soil organic matter. It is possible that clay mineral features (–OH from kaolinite and illite) are acting as a proxy predictor for SOC as was observed by [45]. The VIP peak at 2200 nm appears to be related more to kaolinite/illite Al-OH groups rather than to organic functional groups whereas the spectral region 2350–2470 nm corresponds to spectral absorption features of several organic functional groups [45].
Other soil chemical properties like Ca, CEC, and H resemble the VIP scores for SOC potentially indicating that SOC is an importance factor for these properties. CEC in highly weathered soils typically results from organic matter, where carboxyl and alcohol groups deprotonate and contribute to the CEC, rather than from clay minerals because Fe and Al oxides and, to a lesser extent, kaolinite tend to become protonated and contribute more to the anion exchange capacity due to positive surface charge. Ca would remain in soils with SOC, where the CEC would prevent it from being leached from the soil. Exchangeable H also seems to be associated with SOC where it can protonate carboxyl and alcohol sites.
However, the VIP scores for available soil P, exchangeable Mg and percentage of Al saturation (m) resemble the VIP scores for clay suggesting that the clay fraction of the soil is influencing the models for these soil properties. Soil P would exist as the phosphate anion (PO43−) in soils that can adsorb to anion exchange sites on Fe and Al oxides and kaolinite. Despite the poor performance, the PLSR model was still able to extract the relationship between soil P and clay from the spectra. In contrast, it would be expected that exchangeable Mg would follow the same pattern as Ca since they have similar behavior in soil.
The reason why the clay fraction, namely the clay mineralogy, would influence the PLSR model is not clear but exchangeable Mg does have a stronger negative relationship with clay than exchangeable Ca (Table 3). It would also be expected that the percentage of Al saturation follows the pattern of SOC, where most of CEC lies, but the clay-sized fraction and its mineralogy seems to be the main factor in the PLSR model. From the linear correlation matrix, it is noted that m has a stronger relationship with clay (0.70) than SOC (0.09) and the PLSR model may be taking advantage of that relationship.
The pH of soil is a result of the organic and inorganic components and this relationship has been demonstrated via spectral modeling before [45]. The VIP graph for base saturation is complex, perhaps showing the influence of sand, clay, and SOC on the model. The graphs for H+Al and Al show a smaller influence from clay mineralogy with the visible region of the spectrum contributing most to the model, likely due to the factors influencing soil color such as SOC and iron oxides.

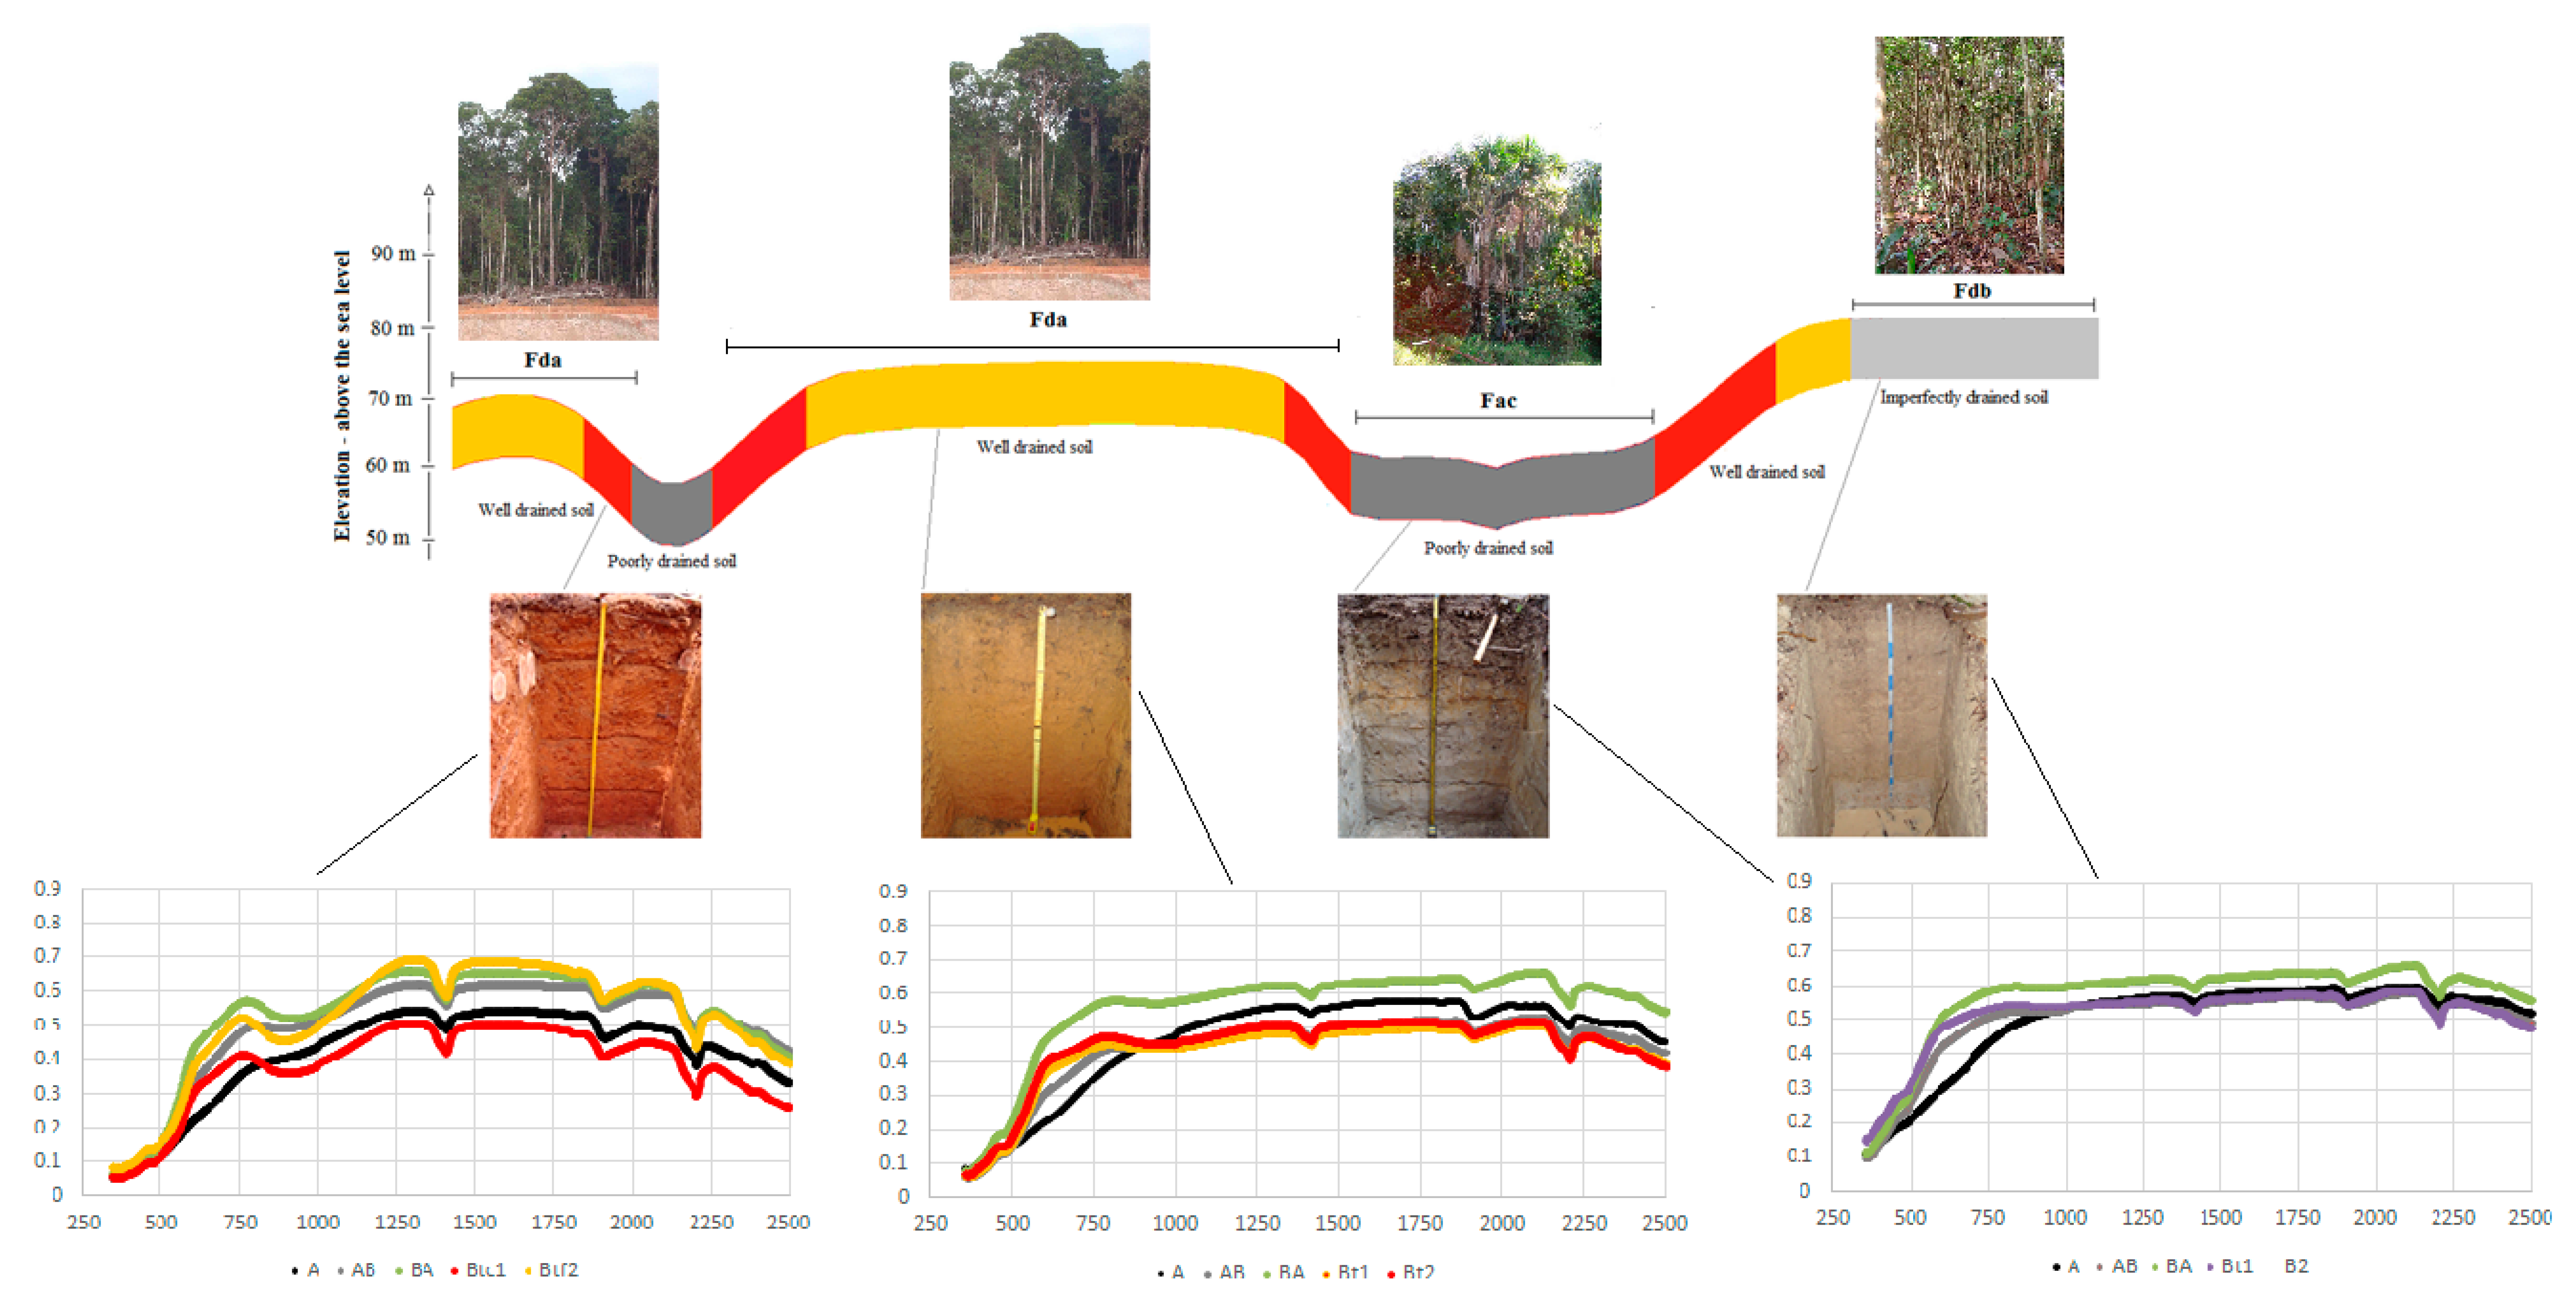
4.5. Relationships between Spectral Reflectance and Soil Type

In general, the reflectance intensity increased from the surface to the deeper soil horizons in all soil orders in the study site (Figure 2). Topsoil horizons have more soil organic matter, which absorbs energy and promotes lower reflectance intensity throughout the entire spectrum [46,47,48]. The absorption features produced by the organic compounds occurred at 2316 and 2382 nm [47,48,49].
Spectral reflectance curves for Red Argisols presented the same shapes in all horizons, although with different intensities, except for the 900 nm region. The curve concavity at 900 nm was sharp only for the subsurface horizons (BA, Bt1 and Bt2), which may be attributed to the iron content in the B horizons, as soil organic matter is masking the effect of the iron in the surface horizon [50,51,52]. According to Viscarra Rossel et al. [27], peaks near 900 nm may represent absorption caused by electronic transitions in goethite. Red Argisols (soil color 5YR) was located on the highest position of the toposequence, followed by Yellow Argisols (soil color 10YR) located on the Tabular interfluves, and then Greyish Argisols (low chrome) located on the footslopes (Figure 5). From Red Argisols to Greyish Argisols there was a gradual reduction in the curve concavity at 900 nm in the subsurface horizons. Again, this can be attributed to the different contents and forms of iron, which distinctly affect the concavity in this region; crystalline iron forms present concavity, whereas amorphous iron forms do not [46]. In fact, Greyish Argisols presented no concavity shape at 850–900 nm, since its iron is in the reduced form (Fe2+). Absorptions due to electronic transition are primarily associated with minerals that contain iron (e.g., hematite) and their fundamentals may be found in the VIS-NIR region [27].
A-horizons in Red Argisols showed lower reflectance intensity compared to A-horizons of Yellow and Greyish Argisols (Figure 4). The flooded lowland open tropical rainforest and upland open tropical rainforest are the main vegetation types on Greyish Argisols, since their species are more adapted to soil aeration restrictions, mainly at the surface. According to Ceddia et al. [14], the carbon stocks are lower in Greyish Argisols, especially in the lower horizons, because the input of carbon from leaves, trees, trunks and roots is lower, and is concentrated at the surface layers (Figure 4). For Cambisols, the reflectance intensity increased (Figure 2d) from the surface (A-horizon) to the deeper soil horizons (Bi3) because of the lower organic matter content in subsurface layers. The characteristic curve concavity at 900 nm present in Argisols did not appear in any of the Cambisol horizons because of their low iron contents.
All suborders in the study site showed a pronounced shoulder at 2200 nm, except for the Spodosols. This shoulder is associated with the di-octahedral layers of the kaolinite mineral structure [52] and is more pronounced in subsurface horizons, indicating greater proportions of 1:1 minerals. The Spodosol spectra showed weak absorption peaks (Figure 2f). The AE, EA, E and EB horizons have high sand contents with predominantly quartz in the sand fraction, which in turn do not have prominent absorption features in the UV-VIS-NIR region [27]. Their intense fundamental vibrations occur in the mid infrared around (10,000 nm) [53]. It is likely that sand particles (mostly quartz) act like a blank template, diluting other components that control the reflectance of the soil [52].
In general, considering all soil properties studied, there was a consistent pattern for a given soil property and a particular landscape position, soil order and depth in the model performance. For pH value, silt content and S/C ratio, the model performed better in well-drained soils. The Spodosol and Greyish Argisol order were considered outlier in the pH model, whereas for silt content and S/C ratio, the Argisol was the outlier (Figure 3).
For soil chemical properties, exchangeable Ca and Mg and SOC content, the Argisol and Cambisol classes were the outliers in the model performance (Figure 3). For SOC content, 60% of the outliers belongs to well-drained sites (Yellow and Red-Yellow Argisol). These soil classes are also contributing with higher SOC content. By the other side, for Ca and Mg content, the model performed worst in moderate and poorly drained soils.
There was also a consistent pattern for a given soil property and a particular soil depth. Most of the outliers (84%) were observed in the superficial depth (O and A-horizon), especially for T value and SOC content. This is due to the presence of non-degraded or partly degraded organic material in the topsoil, which increases the prediction uncertainty [34]. For phosphorous content, V value, S/C ratio, pH and Al content, the B-horizon was the outlier. Therefore, stratification of soil order and horizons could produce more homogeneous group and may improve the model performance [2].
We believe that this VIS-NIR soil study provides the first step towards spectral mapping in the larger tropical Amazon region. The spectral fingerprinting of the highly weathered, hydric soils in the Central Amazon allows discernment of soil properties that can be predicted from VIS-NIR and those that still require traditional soil mapping using classical analytical lab-based methods in the future. Understanding of the implicit relationships between VIS-NIR hyperspectral data and specific soil properties will also support future remote sensing studies in this region as new sensor technologies, filtering algorithms and noise removal (e.g., removal of canopy interference to map the soil surface) emerge.

5. Conclusions

Diffuse reflectance spectroscopy is an effective technique with high applicability in quantitative analysis of tropical Central Amazon soils, especially for prediction of properties useful in soil survey, classification, fertility management, climate change monitoring and soil security. Soil properties directly detectable by reflectance spectroscopy, such as clay and SOC content were predicted with the highest accuracy. Sand, S/C ratio, H, Al, H+Al, CEC and m were moderately well predicted from VIS-NIR spectra. VIS-NIR also indicates limitations to predict specific soil properties, such as Ca, Mg, P, pH, SB, silt and F.
The very good performance of clay and the moderately performing of sand models using VIS-NIR spectral data suggests that at least soil particle sizes can be efficiently replaced by DRS VIS-NIR. In the same manner, SOC was also very well predicted by VIS-NIR spectroscopy with significance in soil carbon assessments, global carbon cycling, global climate change and ecosystem service assessment. This is profoundly important for the rapid and urgent demand for SOC stocks predictions in the Amazon Forest that have not been reliably assessed at this point in time.
There was a consistent pattern for a given soil property and a particular landscape position, soil order and soil depth in the model performance. For silt content, pH value and S/C ratio, the model performed better in well-drained soils whereas for SOC content, the model performed better in poorly-drained soils. Most of the outliers (84%) were observed in the superficial depth (O and A-horizon), especially for T value and SOC content. Therefore, stratification of soil order and horizons could produce more homogeneous group and may improve the model performance.
Finally, VIS-NIR and the methodology we tested is a powerful tool to be used for rapid and cost-efficient assessment of soil properties in the Central Amazon and for generating datasets of soil properties. Specifically, associating VIS-NIR spectral data to landforms, vegetation classes, and soil types hold much promise for soil characterization, because above-ground landscape features can be more readily mapped using remote sensing. We recommend the calibration and validation of these soils spectral models to other landscapes that englobe the complexity of the Amazon biome.

Acknowledgments

The authors acknowledge Petróleo Brasileiro S.A. for the technical and financial support (Petrobrás/UFRRJ/FAPUR Contract No. 0050.0036944.07.2). We also thank the Conselho Nacional de Desenvolvimento Científico e Tecnológico (CNPq Project No. 249594/2013-7) and the Coordenação de Aperfeiçoamento de Pessoal de Nível Superior (CAPES Project No. 1574-14-0) for the Post-Doctoral Scholarships granted to Pinheiro and Ceddia. Moreover, they also appreciated all the support of the Pedometrics, Landscape Analysis and GIS Laboratory, supervised by Sabine Grunwald, as well, Soil and Water Science Department, in University of Florida.

Author Contributions

Érika Pinheiro analyzed soil samples by visible and near-infrared diffuse reflectance spectroscopy and wrote the article. Marcos Bacis Ceddia was the project supervisor and participated in all stages of the article. He also described the soils profiles and collected soils samples in the Brazilian Amazon Forest. Christopher M. Clingensmith was responsible for modeling algorithm coding, as well all data pre-processing and statistical analysis. Sabine Grunwald contributed writing the article and with materials and analysis tools. Gustavo M. Vasques contributed to the writing of the article and also in analyzing the spectral results and their interpretation.

Conflicts of interest

The authors declare no conflict of interest.

References

  1. Grunwald, S.; Vasques, G.M. Fusion of soil and remote sensing data to model soil properties. In Advances in Agronomy; Sparks, D.L., Ed.; Advances in Agronomy: Amsterdam, The Netherland, 2015; Volume 131, pp. 1–109. [Google Scholar]
  2. Vasques, G.M.; Grunwald, S.; Sickman, J.O. Visible/near-infrared spectroscopy modeling of dynamic soil carbon fractions. Soil Sci. Soc. Am. J. 2009, 73, 176–184. [Google Scholar] [CrossRef]
  3. Stevens, A.; Udelhoven, T.; Denis, A.; Tychon, B.; Lioy, R.; Hoffmann, L.; Wesemael, B.V. Measuring soil organic carbon in croplands at regional scale using airborne imaging spectroscopy. Geoderma 2010, 158, 32–45. [Google Scholar] [CrossRef]
  4. Gomez, C.; Viscarra Rossel, R.A.; McBrantney, A.B. Comparing predictions of soil organic carbon by field Vis-NIR Spectroscopy and hyper spectral remote sensing. Geophys. Res. Abstr. 2008, 10, 1–2. [Google Scholar]
  5. Viscarra Rossel, R.A.; McGlynn, R.N.; McBratney, A.B. Determining the composition of mineral-organic mixes using UV-vis-NIR diffuse reflectance spectroscopy. Geoderma 2006, 137, 70–82. [Google Scholar] [CrossRef]
  6. Reeves, J.; McCarty, G.; Mimmo, T. The potential of diffuse reflectance spectroscopy for the determination of carbon inventories in soils. Environ. Pollut. 2002, 116, 277–284. [Google Scholar] [CrossRef]
  7. Reeves, J.B. Near- versus mid-infrared diffuse reflectance spectroscopy for soil analysis emphasizing carbon and laboratory versus on-site analysis: Where are we and what needs to be done? Geoderma 2010, 158, 3–14. [Google Scholar] [CrossRef]
  8. Reeves, J.B.; Follett, R.F.; McCarthy, G.W.; Kimble, J.M. Can near- or mid-infrared diffuse reflectance spectroscopy be used to determine soil carbon pools? Commun. Soil Sci. Plant Anal. 2006, 37, 2307–2325. [Google Scholar] [CrossRef]
  9. Sorensen, I.K.; Dalsgaard, S. Determination of clay and other soil properties by near infrared spectroscopy. Soil Sci. Soc. Am. J. 2005, 69, 159–167. [Google Scholar] [CrossRef]
  10. Chong, I.G.; Jun, C.H. Performance of some variable selection methods when multicollinearity is present. Chemom. Intell. Lab. Syst. 2005, 78, 103–112. [Google Scholar] [CrossRef]
  11. Nanni, M.R.; Demattê, J.A.M. Spectral reflectance methodology in comparison to soil analysis. Soil Sci. Soc. Am. J. 2006, 70, 393–407. [Google Scholar] [CrossRef]
  12. Viscarra Rossel, R.A.; Behrens, T.; Ben-Dor, E.; Brownd, D.J.; Demattêe, J.A.M.; Shepherdf, K.D.; Shig, Z.; Stenbergh, B.; Stevensi, A.; Adamchuk, V.; et al. Global spectral library to characterize the world’s soil. Earth Sci. Rev. 2016, 155, 198–230. [Google Scholar] [CrossRef]
  13. Xiong, X.; Grunwald, S.; Myers, D.B.; Kim, J.; Harries, W.G.; Comerford, N.B. Holistic environmental soil landscape modeling of soil organic carbon. Environ. Model. Softw. J. 2014, 57, 202–215. [Google Scholar] [CrossRef]
  14. Ceddia, M.B.; Villela, A.L.O.; Pinheiro, E.F.M.; Wendroth, O. Spatial variability of soil carbon stock in the Urucu river basin, Central Amazon-Brazil. Sci. Total Environ. 2015, 526, 58–69. [Google Scholar] [CrossRef] [PubMed]
  15. Reis, N.J.; Almeida, M.E.; Rikes, S.L.; Ferreira, A.L. Geologia e Recursos Minerais do Estado do Amazonas; Serviço Geológico do Brasil: Manaus, Brazil, 2006. [Google Scholar]
  16. Maia, R.G.N.; Godoy, H.K.; Yamaguti, H.S.; Moura, P.A.; Costa, F.S.F.; Holanda, M.A.; Costa, J.A. Projeto Carvão no Alto Solimões; Serviço Geológico do Brasil: Manaus, Brazil, 1977. [Google Scholar]
  17. Villela, A.L.O. Mapeamento Digital de Solos da Formação Solimões Sob Floresta Tropical Amazônica. Ph.D. Thesis, Agronomia-Ciência do Solo, Universidade Federal Rural do Rio de Janeiro, Rio de Janeiro, Brazil, 2013. [Google Scholar]
  18. Embrapa. Sistema Brasileiro de Classificação de Solos, 3rd ed.; Brasília: Distrito Federal, Brazil, 2013. [Google Scholar]
  19. United States Department of Agriculture. Soil Taxonomy. A Basic System of Soil Classification for Making and Interpreting Soil Surveys; Natural Resources Conservation Service No. 436; United States Department of Agriculture: Washington, DC, USA, 1999.
  20. Embrapa. Manual de Métodos de Análise de Solo, 2nd ed.; Centro Nacional de Pesquisa de Solos: Rio de Janeiro, Brazil, 1997. [Google Scholar]
  21. Mehlich, A. Determination of P, Ca, Mg, K, Na, and NH4; North Carolina Soil Test Division: Raleigh, NC, USA, 1953. [Google Scholar]
  22. Walkley, A.; Black, I.A. An examination of the Degtjareff method for determining soil organic matter and a proposed modification of the chromic acid titration method. Soil Sci. 1934, 37, 29–38. [Google Scholar] [CrossRef]
  23. Rinnan, A.; Berg, F.V.; Engelsen, S.B. Review of the most common pre-processing techniques for near-infrared spectra. Trends Anal. Chem. 2009, 28, 1201–1222. [Google Scholar] [CrossRef]
  24. Box, G.E.P.; Cox, D.R. An Analysis of Transformations. J. R. Stat. Soc. 1964, 26, 211–252. [Google Scholar]
  25. Estatcamp®. Portal Action: Software Action. Available online: http://www.portalaction.com.br/content/sobre-o-action (accessed on 13 December 2013).
  26. Johnson, R.A.; Wichern, D.W. Applied Multivariate Statistical Analysis, 6th ed.; Pearson Education Inc.: New Jersey, NJ, USA, 2007; p. 700. [Google Scholar]
  27. Viscarra Rossel, R.A.; Walvoort, D.J.J.; McBratney, A.B.; Janik, L.J.; Skjemstad, J.O. Visible, near infrared, mid infrared or combined diffuse reflectance spectroscopy for simultaneous assessment of various soil properties. Geoderma 2006, 131, 59–75. [Google Scholar] [CrossRef]
  28. Vasques, G.M.; Grunwald, S.; Sickman, J.O. Comparison of multivariate methods for inferential modeling of soil carbon using visible/near-infrared spectra. Geoderma 2008, 146, 14–25. [Google Scholar] [CrossRef]
  29. Mevik, B.-H. VIP.R: Implementation of VIP (Variable Importance in Projection) for the ‘pls’ Package. Available online: http://mevik.net/work/software/VIP.R (accessed on 26 October 2016).
  30. Van Wambeke, A. Soils of the Tropics—Properties and Appraisal; McGraw-Hill: New York, NY, USA, 1992. [Google Scholar]
  31. Stevenson, F.J. Humus Chemistry: Genesis, Composition, Reaction; Wiley: New York, NY, USA, 1994; p. 496. [Google Scholar]
  32. Terra, F.S.; Demattê, J.A.M.; Viscarra-Rossel, R.A. Spectral libraries for quantitative analysis of tropical Brazillian soils: Comparing VIS-NIR and MIR reflecytance data. Geoderma 2015, 255–256, 81–93. [Google Scholar] [CrossRef]
  33. Lee, K.S.; Lee, D.H.; Sudduth, K.A.; Chung, S.O.; Kitchen, N.R.; Drummond, S.T. Wavelength identification and diffuse reflectance estimation for surface and profile soil properties. Trans. ASABE 2009, 52, 683–695. [Google Scholar] [CrossRef]
  34. Bellon-Maurel, V.; McBratney, A. Near-infrared (NIR) and mid-infrared (MIR) spectroscopic techniques for assessing the amount of carbon stocks in soils—Critical review and research perspectives. Soil Biol. Biochem. 2011, 43, 1398–1410. [Google Scholar] [CrossRef]
  35. Morgan, C.L.S.; Waiser, T.H.; Brown, D.J.; Hallmark, C.T. Simulated in situ characterization of soil organic and inorganic carbon with visible near-infrared diffuse reflectance spectroscopy. Geoderma 2009, 151, 249–256. [Google Scholar] [CrossRef]
  36. Janik, L.J.; Merry, R.H.; Skjemstad, J.O. Can mid infra-red diffuse reflectance analysis replace soil extractions? Aust. J. Exp. Agric. 1998, 38, 681–696. [Google Scholar] [CrossRef]
  37. Araújo, S.R.; Söderström, M.; Eriksson, J.; Isendahl, C.; Stenborg, P.; Demattê, J.M. Determining soil properties in Amazonian Dark Earths by reflectance spectroscopy. Geoderma 2015, 237–238. [Google Scholar] [CrossRef]
  38. Daniel, K.W.; Tripathi, N.K.; Honda, K. Artificial neural network analysis of laboratory and in situ spectra for the estimation of macronutrients in soils of Lop Buri (Thailand). Aust. J. Soil Res. 2003, 41, 47–59. [Google Scholar] [CrossRef]
  39. Pirie, A.; Singh, B.; Islam, K. Ultra-violet, visible, near-infra-red, and mid-infra-red diffuse reflectance spectroscopic techniques to predict several soil properties. Aust. J. Soil Res. 2005, 43, 713–721. [Google Scholar] [CrossRef]
  40. Viscarra Rossel, R.A.; Lark, R.M. Improved analysis and modeling of soil diffuse reflectance spectra using wavelets. Eur. J. Soil Sci. 2009, 60, 453–464. [Google Scholar] [CrossRef]
  41. Viscarra Rossel, R.A.; Behrens, T. Using data mining to model and interpret soil diffuse reflectance spectra. Geoderma 2010, 158, 46–54. [Google Scholar] [CrossRef]
  42. Chang, C.-W.; Laird, D.A.; Mausbach, M.J.; Hurburgh, C.R., Jr. Near-infrared reflectance spectroscopy-principal components regression analysis of soil properties. Soil Sci. Soc. Am. J. 2001, 65, 480–490. [Google Scholar] [CrossRef]
  43. Shepherd, K.D.; Walsh, M.G. Development of reflectance spectral libraries for characterization of soil properties. Soil Sci. Soc. Am. J. 2002, 66, 988–998. [Google Scholar] [CrossRef]
  44. Cozzolino, D.; Moron, A. The potential of near-infrared reflectance spectroscopy to analyse soil chemical and physical characteristics. J. Agric. Sci. 2003, 140, 65–71. [Google Scholar] [CrossRef]
  45. Clark, R.N.; King, T.V.V.; Klejwa, M.; Swayze, G.; Vergo, N. High spectral resolution reflectance spectroscopy of minerals. J. Geophys. Res. 1990, 95, 12653–12680. [Google Scholar] [CrossRef]
  46. Hunt, G.R. Spectral signatures of particulate minerals in the visible and near infrared. Geophysics 1977, 42, 501–513. [Google Scholar] [CrossRef] [Green Version]
  47. Henderson, T.L.; Baumgardner, M.F.; Franzmeier, D.P.; Stott, D.E.; Coster, D.C. High dimensional reflectance analysis of soil organic matter. Soil Sci. Soc. Am. J. 1992, 56, 865–872. [Google Scholar] [CrossRef]
  48. Stevens, A.; Wesemael, B.V.; Bartholomeus, H.; Rosillon, D.; Tychon, B.; Bem-Dor, E. Laboratory, field, and airbone spectroscopy for monitoring organic carbon content in agricultural soils. Geoderma 2008, 144, 395–404. [Google Scholar] [CrossRef]
  49. Vasques, G.M.; Sabine Grunwald, S.; Harris, W. Spectroscopic models of soil organic carbon in Florida, USA. J. Environ. Qual. 2010, 39, 923–934. [Google Scholar] [CrossRef] [PubMed]
  50. Demattê, J.A.M.; Garcia, G.J. Alteration of soil properties through a weathering sequence as evaluated by spectral reflectance. Soil Sci. Soc. Am. J. 1999, 63, 327–342. [Google Scholar] [CrossRef]
  51. Demattê, J.A.M.; Campos, R.C.; Alves, M.C.; Fiorio, P.R.; Nanni, M.R. Visible-NIR reflectance: A new approach on soil evaluation. Geoderma 2004, 121, 95–112. [Google Scholar] [CrossRef]
  52. Hunt, G.R.; Salisbury, J.W. Visible and infrared spectra of minerals and rocks: II. Carbonate. Mod. Geol. 1970, 2, 23–30. [Google Scholar]
  53. Nguyen, T.T.; Janik, L.J.; Raupach, M. Diffuse Reflectance Infrared Fourier Transform (DRIFT) Spectroscopy in soil studies. Aust. J. Soil Res. 1991, 29, 49–67. [Google Scholar] [CrossRef]
Figure 1. Location and shape of the study area in the Central Amazon, Brazil.
Remotesensing 09 00293 g001
Figure 2. VIS-NIR spectral curves of the horizons of a Red Argisol (A), Yellow Argisol (B), Greyish Argisol (C), Red Cambisol (D), Neosol (E), and Spodosol (F).
Remotesensing 09 00293 g002
Figure 3. Validation results for observed vs. predicted values for soil chemical and physical properties including: sand content (g·kg−1); silt content (g·kg−1); clay content (g·kg−1); S/C (silt/clay ratio); F (flocculation degree); pH; Ca content (cmolc·kg−1); Mg content (cmolc·kg−1); H content (cmolc·kg−1); Al content (cmolc·kg−1); H+Al content (cmolc·kg−1); P content (cmolc·kg−1); SOC; CEC (cmolc·kg−1); SB (cmolc·kg−1); V (%); m (%). The solid line is the line of regression and the dotted lines is the 1:1 line.
Remotesensing 09 00293 g003
Figure 4. VIP scores from PLSR model for soil chemical and physical properties in the Central Amazon.
Remotesensing 09 00293 g004aRemotesensing 09 00293 g004b
Figure 5. Schematic representation of the soil, relief and vegetation classes and the respective soils spectral data in the study site.
Remotesensing 09 00293 g005
Table 1. Number of soil profiles (n), and frequency of soil suborders, according to the Brazilian Soil Classification System (SiBCS) and Soil Taxomony.
SiBCSSoil TaxonomynFrequency (%)
Yellow ArgisolsOxyaquic Hapludults2728
Red ArgisolsTypic Hapludults22
Red-Yellow ArgisolsTypic Hapludults2122
Greyish ArgisolsTypic Endoaquults33
Haplic CambisolsTypic Dystrudepts3941
SpodosolsHumods11
Quartzarenic NeosolsQuartzipsamments22
Haplic PlanosolsAquults11
Total96100
Table 2. Descriptive statistics of the soil properties.
Soil PropertyMin.MeanMax.MedianSDVarianceSkewnessKurtosisβ
Sand (g·kg−1)22397884385177.531,512.30.42−0.270.58
Silt (g·kg−1)50344660341.5118.814,122.80.04−0.020.93
Clay (g·kg−1)10257640251.5133.117,720.20.24−0.680.68
F (%)2581005625.8666.9−0.02−1.090.83
S/C (unitless)0.12.013.21.41.93.652.588.27-
pH (unitless)3.24.56.54.70.40.200.040.630.93
Ca (cmolc·kg−1)0.21.03.20.80.60.390.77−0.44-
Mg (cmolc·kg−1)0.10.562.20.50.40.151.592.85-
H (cmolc·kg−1)0.14.063.52.55.025.265.3948.93-
Al (cmolc·kg−1)0.14.0123.81.93.800.380.160.73
H+Al (cmolc·kg−1)0.358.066.57.45.227.324.4539.050.33
P (mg·kg−1)01.371311.73.002.489.132.50
SOC (g·kg−1)0.17.99105.66.28.165.95.4551.74-
CEC (cmolc·kg−1)19.669.68.85.631.564.0432.76-
SB (cmolc·kg−1)0.330.629241.4251.263,126.48.9682.54−0.48
V (%)3191001711.7138.12.6612.18-
m (%)768967218.2332.2−0.990.702.04
Min., minimum; Max., maximum; SD, standard deviation; β, Box-Cox transformation parameter; F, degree of flocculation; S/C, silt/clay ratio; SOC, soil organic carbon content; CEC, cation exchange capacity; SB, sum of bases; V, percentage of base saturation; m, percentage of Al saturation.
Table 3. Linear correlation coefficients among soil properties, with significant correlations (p < 0.05) highlighted in bold.
PropertiesSandSiltClayFS/CpHCaMgSBAlHH+AlCECVmPSOC
Sand (g·kg−1)1.00
Silt (g·kg−1)−0.641.00
Clay (g·kg−1)−0.740.021.00
F (%)−0.070.090.021.00
S/C (unitless)0.280.43−0.770.031.00
pH (unitless)−0.14−0.080.19−0.23−0.111.00
Ca (cmolc·kg−1)0.240.01−0.30−0.030.24−0.371.00
Mg (cmolc·kg−1)0.200.11−0.350.090.32−0.320.521.00
SB (cmolc·kg−1)0.190.07−0.290.000.26−0.380.860.701.00
Al (cmolc·kg−1)−0.640.160.700.11−0.50−0.09−0.13−0.21−0.171.00
H (cmolc·kg−1)0.160.10−0.260.130.19−0.500.430.420.430.001.00
H+Al (cmolc·kg−1)−0.170.160.100.21−0.07−0.500.310.270.290.510.791.00
CEC (cmolc·kg−1)−0.150.170.060.19−0.02−0.510.470.410.450.470.800.961.00
V (%)0.39−0.08−0.44−0.160.350.060.490.430.54−0.65−0.26−0.58−0.441.00
m (%)−0.560.060.700.07−0.550.17−0.61−0.62−0.650.79−0.260.170.06−0.791.00
P (mg·kg−1)0.31−0.13−0.27−0.030.14−0.180.090.060.07−0.200.260.150.12−0.01−0.201.00
SOC (g·kg−1)0.260.10−0.390.140.32−0.530.500.470.51−0.130.670.510.520.09−0.420.331.00
F, degree of flocculation; S/C, silt/clay ratio; SB, sum of bases; CEC, cation exchange capacity; V, percentage of base saturation; m, percentage of Al saturation; SOC, soil organic carbon content.
Table 4. Validation results of the best partial least squares regression models according to the best fitted pre-processing method.
Soil PropertyPre-ProcessingR2RMSERPDRPIQBias
Sand (g·kg−1)SG.Q.3.00.62114.741.612.05−17.37
Silt (g·kg−1)SNV0.3695.151.251.683.20
Clay (g·kg−1)SG.L.3.10.7861.702.143.35−1.75
S/C (unitless)SG.Q.9.10.621.091.631.42−0.03
F (%)SG.C.5.10.1622.831.081.73−1.61
pH (unitless)SNV0.400.341.181.490.03
Ca (cmolc·kg−1)SG.C.5.00.400.521.261.92−0.08
Mg (cmolc·kg−1)SG.L.3.10.330.341.211.46−0.05
H (cmolc·kg−1)MSC0.794.401.450.700.32
Al (cmolc·kg−1)LOG0.631.221.622.36−0.18
H+Al (cmolc·kg−1)SNV0.703.611.801.080.15
P (mg·kg−1)SG.L.9.10.111.981.051.01−0.32
SOC (g·kg−1)SNV0.715.691.841.050.07
CEC (cmolc·kg−1)SNV0.685.861.170.820.75
SB (cmolc·kg−1)SG.L.11.20.17296.391.000.00−35.55
V (%)SG.L.3.00.509.131.401.31−1.51
m (%)SG.C.7.10.5911.651.572.10−0.38
R2, coefficient of determination; RMSE, root mean square error; RPD, residual prediction deviation; RPIQ, ratio of performance to inter-quartile range; S/C, silt/clay ratio; F, degree of flocculation; SOC, soil organic carbon content; CEC, cation exchange capacity; SB, sum of bases; V, percentage of base saturation; m, percentage of Al saturation; SG.Q.3.0, Savitzky Golay, quadratic, window: 3, derivative: 0; SNV, standard normal variate; SG.L.3.1, Savitzky Golay, linear, window: 3, derivative: 1; SG.Q.9.1, Savitzky Golay, quadratic, window: 9, derivative: 1; SG.C.5.1, Savitzk Golay, cubic, window: 5, derivative: 1; SG.C.5.0, Savitzky Golay, cubic, window: 5, derivative: 0; SG.L.3.1, Savitzky Golay, linear, window: 3, derivative: 1; MSC, multiplicative scatter correction; LOG, log(1/reflectance); SG.L.9.1, Savitzky Golay, linear, window: 9, derivative: 1; SG.L.11.2, Savitzky Golay, linear, window: 11, derivative: 2; SG.L.3.0, Savitzky Golay, linear, window: 3, derivative: 0; SG.C.7.1, Savitzky Golay, cubic, window: 7, derivative: 1.

