
Application of Bivariate and Multivariate Statistical Techniques in Landslide Susceptibility Modeling in Chittagong City Corporation, Bangladesh


1
UCL Institute for Risk and Disaster Reduction, Department of Earth Sciences, University College London (UCL), Gower Street, London WC1E 6BT, UK
2
Department of Disaster Science and Management, Faculty of Earth and Environmental Sciences, University of Dhaka, Dhaka 1000, Bangladesh
3
Department of Spatial Sciences, Faculty of Science and Engineering, Curtin University, Perth 6102, Australia
*
Author to whom correspondence should be addressed.
Remote Sens. 2017, 9(4), 304; https://doi.org/10.3390/rs9040304
Submission received: 12 January 2017
/
Revised: 9 March 2017
/
Accepted: 15 March 2017
/
Published: 23 March 2017
(This article belongs to the Special Issue Remote Sensing of Landslides)
Abstract
:The communities living on the dangerous hillslopes in Chittagong City Corporation (CCC) in Bangladesh recurrently experience landslide hazards during the monsoon season. The frequency and intensity of landslides are increasing over time because of heavy rainfall occurring over a few days. Furthermore, rapid urbanization through hill-cutting is another factor, which is believed to have a significant impact on the occurrence of landslides. This study aims to develop landslide susceptibility maps (LSMs) through the use of Dempster-Shafer weights of evidence (WoE) and the multiple regression (MR) method. Three different combinations with principal component analysis (PCA) and fuzzy membership techniques were used and tested. Twelve factor maps (i.e., slope, hill-cutting, geology, geomorphology, NDVI, soil moisture, precipitation and distance from existing buildings, stream, road and drainage network, and faults-lineaments) were prepared based on their association with historical landslide events. A landslide inventory map was prepared through field surveys for model simulation and validation purposes. The performance of the predicted LSMs was validated using the area under the relative operating characteristic (ROC) curve method. The overall success rates were 87.3%, 90.9%, 91.3%, and 93.9%, respectively for the WoE, MR with all the layers, MR with PCA layers, and MR with fuzzy probability layers.

1. Introduction
Landslides are recognized as the third type of natural hazard in terms of its worldwide importance [1]. According to the World Disasters Report 2014, about 173 landslide disasters were reported globally between 2004 and 2013, killing 8739 persons and affecting 3.2 million people [2]. Globally, 2620 fatal landslides were recorded worldwide from 2004 to 2010, leading to 32,322 fatalities [3]. Notably in recent times, the July 2016 flash flood and landslides in Nepal killed at least 120 people, whilst 18 went missing, 151 were injured, and 2100 homes were damaged [4]. A total of over 4300 landslides were recorded in Nepal after the 25 April 2015 M7.8 Gorkha earthquake and its aftershock [5]. On 2 May 2014, more than 2000 people were killed by landslides in Ab Barak village in north-eastern Afghanistan triggered by heavy rainfall [6].
Although landslide disasters were infrequent in densely populated Bangladesh in the past, increasing human activities such as hill-cutting for residential development has resulted in many landslides lately [7,8]. This is particularly evident in the Chittagong City Corporation (CCC) area, putting people and properties at risk. In recent years, devastating landslides have repeatedly hit CCC and caused casualties, damages and loss. For example, on 11 June 2007, about 128 people died and approximately 100 were injured in the vicinity of various hills because of landslides triggered by heavy rainfall (610 mm) for eight consecutive days. On 26 June 2012, another eight days of continuous rainfall (889 mm) triggered landslides that killed 90 people and injured 150 persons [8]. Six people were killed in landslides in the Lalkhan Bazaar area on 19 July 2015 (Figure 1). Landslides in the hilly areas pose a serious threat as frequency and damage from landslides are increasing over time [7]. The major landslides in CCC were associated with intense rainfall over a few days [9,10]. Increased population pressure, rapid urban growth, improper land use, weak governance, hill cutting, indiscriminate deforestation and agricultural practices are further aggravating the situation [11,12]. The changing global climate is also posing a serious threat in the region, and the likelihood of increased precipitation could worsen landslide hazards in Bangladesh [13]. CCC is also located in a high-risk earthquake [14,15] and cyclones/wind storms [16] zone, which could trigger more landslide events.
A landslide is the movement of a mass of soil or earth, down to a slope, when shear stress exceeds the strength of the material [17]. Landslide susceptibility assessment is the quantitative or qualitative classification, volume or area, and their spatial distributions that exist or potentially can occur in an area [18]. Various techniques are employed in mapping landslide susceptibility with the major objective being to develop landslide hazard zoning maps [19,20]. LSM methods can broadly be divided [1] into quantitative (data driven, probabilistic, deterministic) and qualitative ones (landslide inventory, and knowledge driven methods). To begin with, landslide inventory analysis is the most straightforward landslide hazard zonation technique that can be prepared using aerial photo interpretation, field surveying, and/or historical landslide data. In qualitative techniques, an expert assigns weights to a series of landslide causative factors based on knowledge driven or heuristic methods (e.g., Boolean overlay, fuzzy logic, spatial multi-criteria evaluation). Examples of other multi-criteria decision analysis methods are — the artificial hierarchy process [20,21], weighted linear combination, and ordered weighted average [22]. On the other hand, quantitative deterministic methods are built on modeling the process of landslides using physically-based slope stability models that are commonly used in the subsequent hazard analysis. The deterministic methods [1] can be static (infinite slope based) and dynamic (landslide initiation and runout models).
The statistical LSM techniques combine previous landslide occurrence together with its causative factors. The method quantitatively predicts landslide susceptible areas with an assumption that conditions that led to landslides in the past would do so in the future [1]. Binomial logistic regression [23], multiple linear regression [24,25], artificial neural network [26], support vector machine [27], and Kohonen’s self-organizing neural network technique [28] are notable statistical techniques [29]. There are two main approaches of statistical LSM-bivariate and multivariate. In the bivariate method, each landslide factor map is combined with a landslide distribution map to calculate the weights for each parameter. There are a number of techniques used with the bivariate method such as weights of evidence, frequency ratio, information value, and the Dempster-Shafer method etc. In the multivariate method, the relationship between a dependent (landslide occurrence) and a series of independent variables (landslide controlling factors) is tested. All of the relevant factors are sampled, and for each of the sampling units, the presence and/or absence of landslides are estimated through a matrix. The resulting matrix is then analysed with logistic regression, multiple regression or discriminant analysis [1]. Principal component analysis (PCA), another multivariate approach, is also frequently employed to reduce the number of factors [30,31].
In recent times, the application of a geographic information system (GIS), remote sensing (RS) and spatial statistical techniques and tools are frequently applied in LSM studies [32,33,34,35,36,37]. For example, Cullen et al., (2016) incorporated space-borne advanced space-borne thermal emission and reflection radiometer (ASTER), MODIS and TRRM rainfall images for developing a landslide hazard index [38]. Plank et al., (2016) used Landsat-8, TanDEM-X and TerraSAR-X satellite imagery for landslide mapping in vegetated areas [39]. ASTER GDEM and ADS40 system images were used for calculating landslide volumes [40]. Satellite and ground-based radar interferometry techniques were also integrated for the zonation of landslide intensity [41]. In this study, a Dempster-Shafer bivariate technique and a (multivariate) multiple linear regression method (with three different combinations) are employed. These techniques are expected to be highly suitable for preparing a LSM for CCC.
Landslides in CCC are a complex and multi-faced problem, combining physical (building materials and housing patterns) and social features (community vulnerability). Despite a high degree of landslide hazard and vulnerability in CCC, only a few studies have been carried out to date [7,8]. Furthermore, official landslide hazard maps are still lacking in Bangladesh. This study aims to develop landslide susceptibility maps (LSMs) for CCC by using publicly available data through geospatial approaches.
2. Methodology
2.1. Study Area
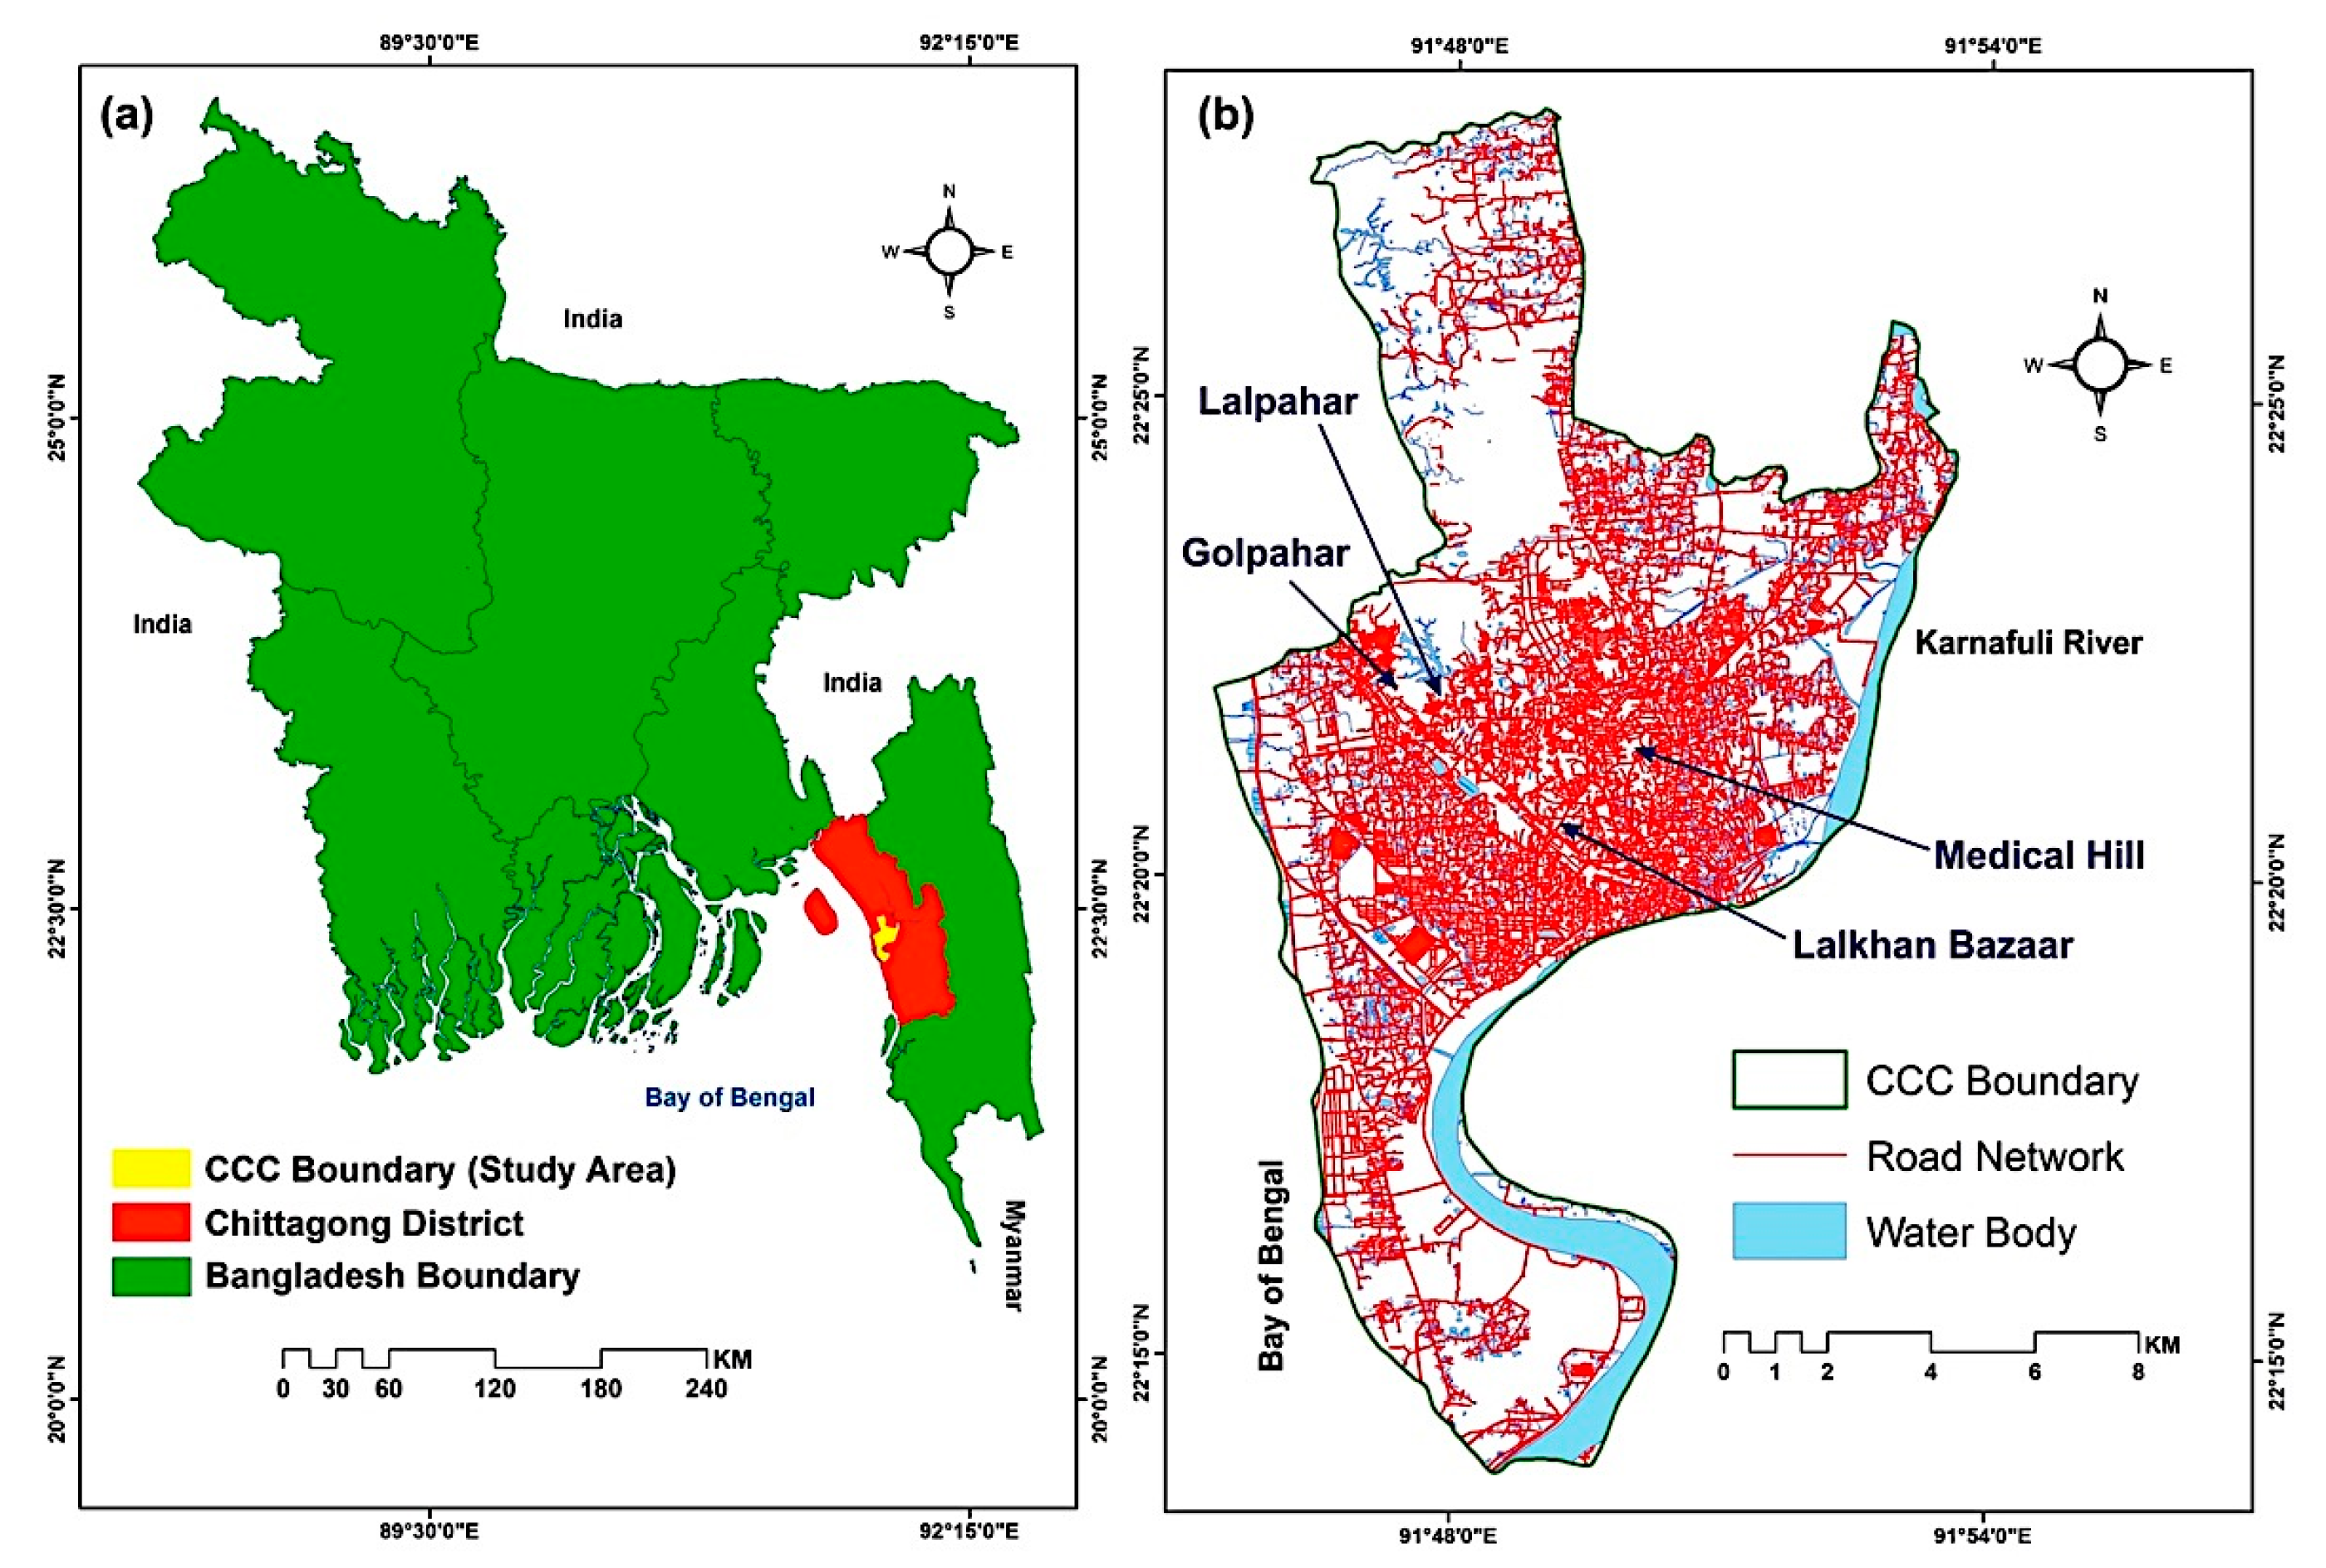
Chittagong City Corporation (CCC) is located in Chittagong district, Bangladesh (Figure 2a). The geographical location of CCC is between 22.13° and 22.28° N latitude and between 91.45° and 91.54° E longitude. It is bounded by the Bay of Bengal in the west and Karnafuli River in the east (Figure 2b). The total area of CCC is about 170.41 km2. The urban population of Chittagong district was only 0.90 million in 1974 which increased to. 3.15 million in 2011, representing an increase of the urban population by 583% in the last 37 years. The current population density in Chittagong district is 6992 persons/km2. Previously it was 2695 persons/km2 in 2001 [42].
2.1.1. Relief, Geology, and Tectonic Framework
The hilly areas are mainly underlain by consolidated (solid rock made from materials that have been metamorphosed or cemented together) and unconsolidated sediments (loose materials, ranging from clay to sand to gravel). They are mainly comprised of alternating beds of sandstone, siltstone and shale, which are sometimes closely inter-bedded [43]. The elevation of the hills ranges from <100 m to <300 m. An elevation map of CCC is shown in Figure 3a. The relief varies between very steeply dissected, linear hill ranges and gently rolling, non-linear landforms in different areas. The low range hills occupy the synclines between the high hill ranges and the tops of some lower anticlines. Most areas are strongly dissected, with short, steep slopes, but some low hills have rolling to nearly level relief [43].
The hilly deposits in CCC consist of Dihing, Dupi Tila, Tipam and Boka Bil formations of the Tertiary period (Figure 3b). Dihing formation or Pliocene (13-1 my), unconformably overlies Dupi Tila Formation, is the youngest among the tertiary sediments and is dominantly comprised of very loose sandstone alternating with siltstone and shale. The Dupi Tila formation or Mio-Pliocene (15-5 my) is well exposed in the mapped area, having a thickness of 220 m and is constituted of massive sandstone, sandy clay and siltstone [44]. The Tipam group or Mid Miocene (25-13 my) consists of Tipam sandstone (thickness 800 m) and Girujan clay (thickness 200 m, and consists of shale and silty-shale with calcareous bands) formations. The formation is divisible into three members, i.e., Upper Tipam, Middle Tipam and Lower Tipam sandstone. The upper portion of this formation consists of inter-bedded sandstone and interlaminated silty sandstone with occasional thinly laminated siltstone and shale. The middle Tipam sandstone mostly consists of silty shale and shale. The lower Tipam sandstone beds are well exposed around CCC areas dominantly characterized by sandstone with occasional shales. Boka Bil formation or Early Miocene (34-25 my) unconformably underlies Tipam formation and constitutes silty shale, siltstone, sandstone and alternating siltstone and shale [44,45].
The quaternary deposits in CCC are classified as fluvio-tidal, tidal, and slope and valley deposits (Figure 3b). Fluvio-tidal deposits are formed by river and tidal activities and its major deposits are natural levee-ridge like linear feature developed along the rivers formed due to river shifting. Fluvio-tidal deposit mostly comprises silty clay underlain by sandy silt lithology. Tidal deposits are formed near the coast due to tidal actions and are dominated by sand/or silt and clay alternating sequences. Slope and valley deposits are formed due to erosional activities near the hilly region. The sediments/deposits in the alluvial fan are deposited along the slope of the hilly area, spreading conically towards the fluvio-tidal plain and tidal flat and are recognized and mapped as alluvial fan deposits. The deposits are poorly sorted silty clay alternated with clayey sand, sandy clay and sand in association with the fragments of sandstone, siltstone, and shale (rock fragments). Piedmont deposits are found in the toes of hills and are mostly a mixture of hill-derived sediment (i.e., poorly sorted medium to fine sand underlain by clayey sand in association with the fragments of sandstone, siltstone, and shale with rock fragments). Valley deposits include deep valley fill, gully fill and isolated valley fill. Sand, sandy clay, and silty clay underlain by clay having a considerable thickness, are the characteristics of deep valley fill deposits. The constituents are the same in gully fill deposits however the thickness is less. In both cases, the deposits are a mixture of sediments and rock fragments derived from adjacent hills. Isolated valley fill deposits are eroded material from surrounding hills and are mainly composed of sandy deposits [44,46].
The geosynclinal basin in the southeast (occupies CCC) is characterised by the huge thickness (maximum of about 20 km near the basin centre) of clastic sedimentary rocks, mostly sandstone and shale of Tertiary age. The huge thickness of sediments in the basin is a result of tectonic mobility or instability of the areas causing rapid subsidence and sedimentation in a relatively short span of geological time. The Sitakunda fold, covering the Chittagong district, is an elongated, asymmetrical, box-type doubly plunging anticline. The axis of the fold runs in a NNW-SSE direction, parallel to the general trend of the regional strike. Both the flanks of the anticline merge into the alluvial plain of the Karnafuli River in the south, due to its doubly plunging nature. The structure has a gently dipping eastern flank and steeper western flank, which is suddenly truncated by the alluvial plain. This truncation is a result of a major faulting that runs parallel to the general strike of the anticline [14,47,48].
2.1.2. Natural Drainage
The hill slopes are excessively well drained (highly permeable), but there is sometimes a narrow strip near the bottom which is poorly drained. Alluvial terraces are moderately well drained; floodplain and piedmont plains (landform created at the foot of a hill) are poorly drained and subject to flash floods [43,49].
2.1.3. Vegetation
The hills were formerly under a closed Dipterocarp rainforest, but much of this has been degraded by logging and shifting (Jhum) cultivation. Extensive areas are now under secondary forest or shrub regrowth, or under bamboos and coarse grasses which are subject to burning during the dry season [43,49].
2.1.4. Soils
Most hill soils are easily erodible; they are so steep that the forests are the only feasible type of land use, they are however low or very low in fertility because these soils have a low content of weatherable minerals and long-continued leaching with heavy rainfall [50]. Heavy rainfall has induced landslides and soil erosion is dominant on the hills. The possible impact of an earthquake occurring within or adjacent to the region [8,15] can trigger more landslides, especially for earthquakes occurring during the monsoon season when hill soils are saturated and liable to landslides. Soil samples from four different landslide vulnerable hills in CCC (Figure 2b) were collected in September 2014. The results of the Atterberg limits test are shown in Table 1. In summary, most hilly soils are mainly brown, strongly acidic; and are composed of silty sands, sand and silt mixtures or silty or clayey fine sands with rapid permeability and low moisture holding capacity. Manufactured and semi-manufactured houses that dominate the hill-communities in CCC [11] pose a serious threat of landslides during the monsoon season (Figure 1).
2.1.5. Landslide Mechanism in CCC
Field surveys, together with historical information from newspapers and interviews with locals, helped to reconstruct a list of landslides (Table A1). The table outlines the precise location of landslide events in Chittagong district. It must be remarked that each of the listed landslide events does not always occur in a single event, but in many cases the landslides were successive in style with different small landslides (even dozens sometimes), occurring at the same location, quite close to each other. Figure 4 shows the categories of landslides in CCC according to the landslide classification system as developed by Cruden and Varnes (1996) [17], and Cruden and Vandine (2013) [52]. An extensive field survey was carried out from June–August 2014 to understand the landslide mechanism in CCC. In CCC, the mode of landslide movement was found to be dominated by the ‘slide’ type (46%) followed by fall (28%). In most cases (72%), the state of landslide activity was found to be active or moving. The distribution of activity was mainly (68%) advancing. The landslide style of activity was primarily (59%) single followed by (30%) successive. The moisture content was mostly moist or wet. The type of material was soil with earth (80% or more of the particles smaller than 2 mm). The rate of movement was extremely rapid (5 m/s) to very rapid (3 m/min).
Based on literature and fieldwork, it can be concluded that hill cutting represents an important controlling factor for the occurrence of landslides in the study area. In fact, hills are often, and largely, cut just at their foot, to construct roads, for extractive purposes, or simply to gain new space for constructing new and non-manufactured huts (made of wood and poor waste materials). In this way, the natural steepness of slopes is further increased, with obvious negative consequences for the slope stability. This type of practice exposes people and their property and puts them at risk of landslides. Other causes of landslides can be listed as weak and weathered materials, adversely-oriented structural discontinuity, contrast in permeability, vegetation removal, intense rainfall, excavation of the slope or its toe, deforestation and irrigation.
2.2. Description of Landslide Causative Factors
For the purpose of this study, initially, a total of 14 landslide causative factor maps and a landslide inventory map were prepared. All the images were projected in the Universal Transverse Mercator (UTM) Zone 46. Each image resolution was set to a cell size of 30 meters.
2.2.1. Rainfall Pattern of Chittagong
The daily precipitation data from 1950–2013 was collected from the Bangladesh Meteorological Department (BMD). The ‘RClimDex’ software was used to analyze the trends of the precipitation indices [53]. Based on the analysis, the following rainfall characteristics are noted [11]:
- The north-east and south-east hilly districts of Bangladesh experience heavy rainfall during the monsoon season;
- The Chittagong district is located in a high rainfall zone. About 96% of rainfall occurs only in the monsoon season (June to September);
- Most rainfall occurs in June (about 23%) and July (about 26%) in the Chittagong district;
- The trend of a monthly maximum 1-day precipitation is increasing (approx. 33%), meaning that the wet periods are increasing in CCC;
- The number of monthly maximum consecutive five-day precipitation is decreasing (approx. 3%);
- The simple daily intensity index (precipitation ≥ 1) is almost unchanged over time;
- The number of heavy and very heavy precipitation days has increased (approx. 5%);
- The number of days with >50 mm rainfall is stable;
- The number of consecutive dry days (rainfall < 1 mm) has increased by approx. 4.5%;
- The number of consecutive wet days (rainfall ≥ 1 mm) has decreased by approx. 2.5%.
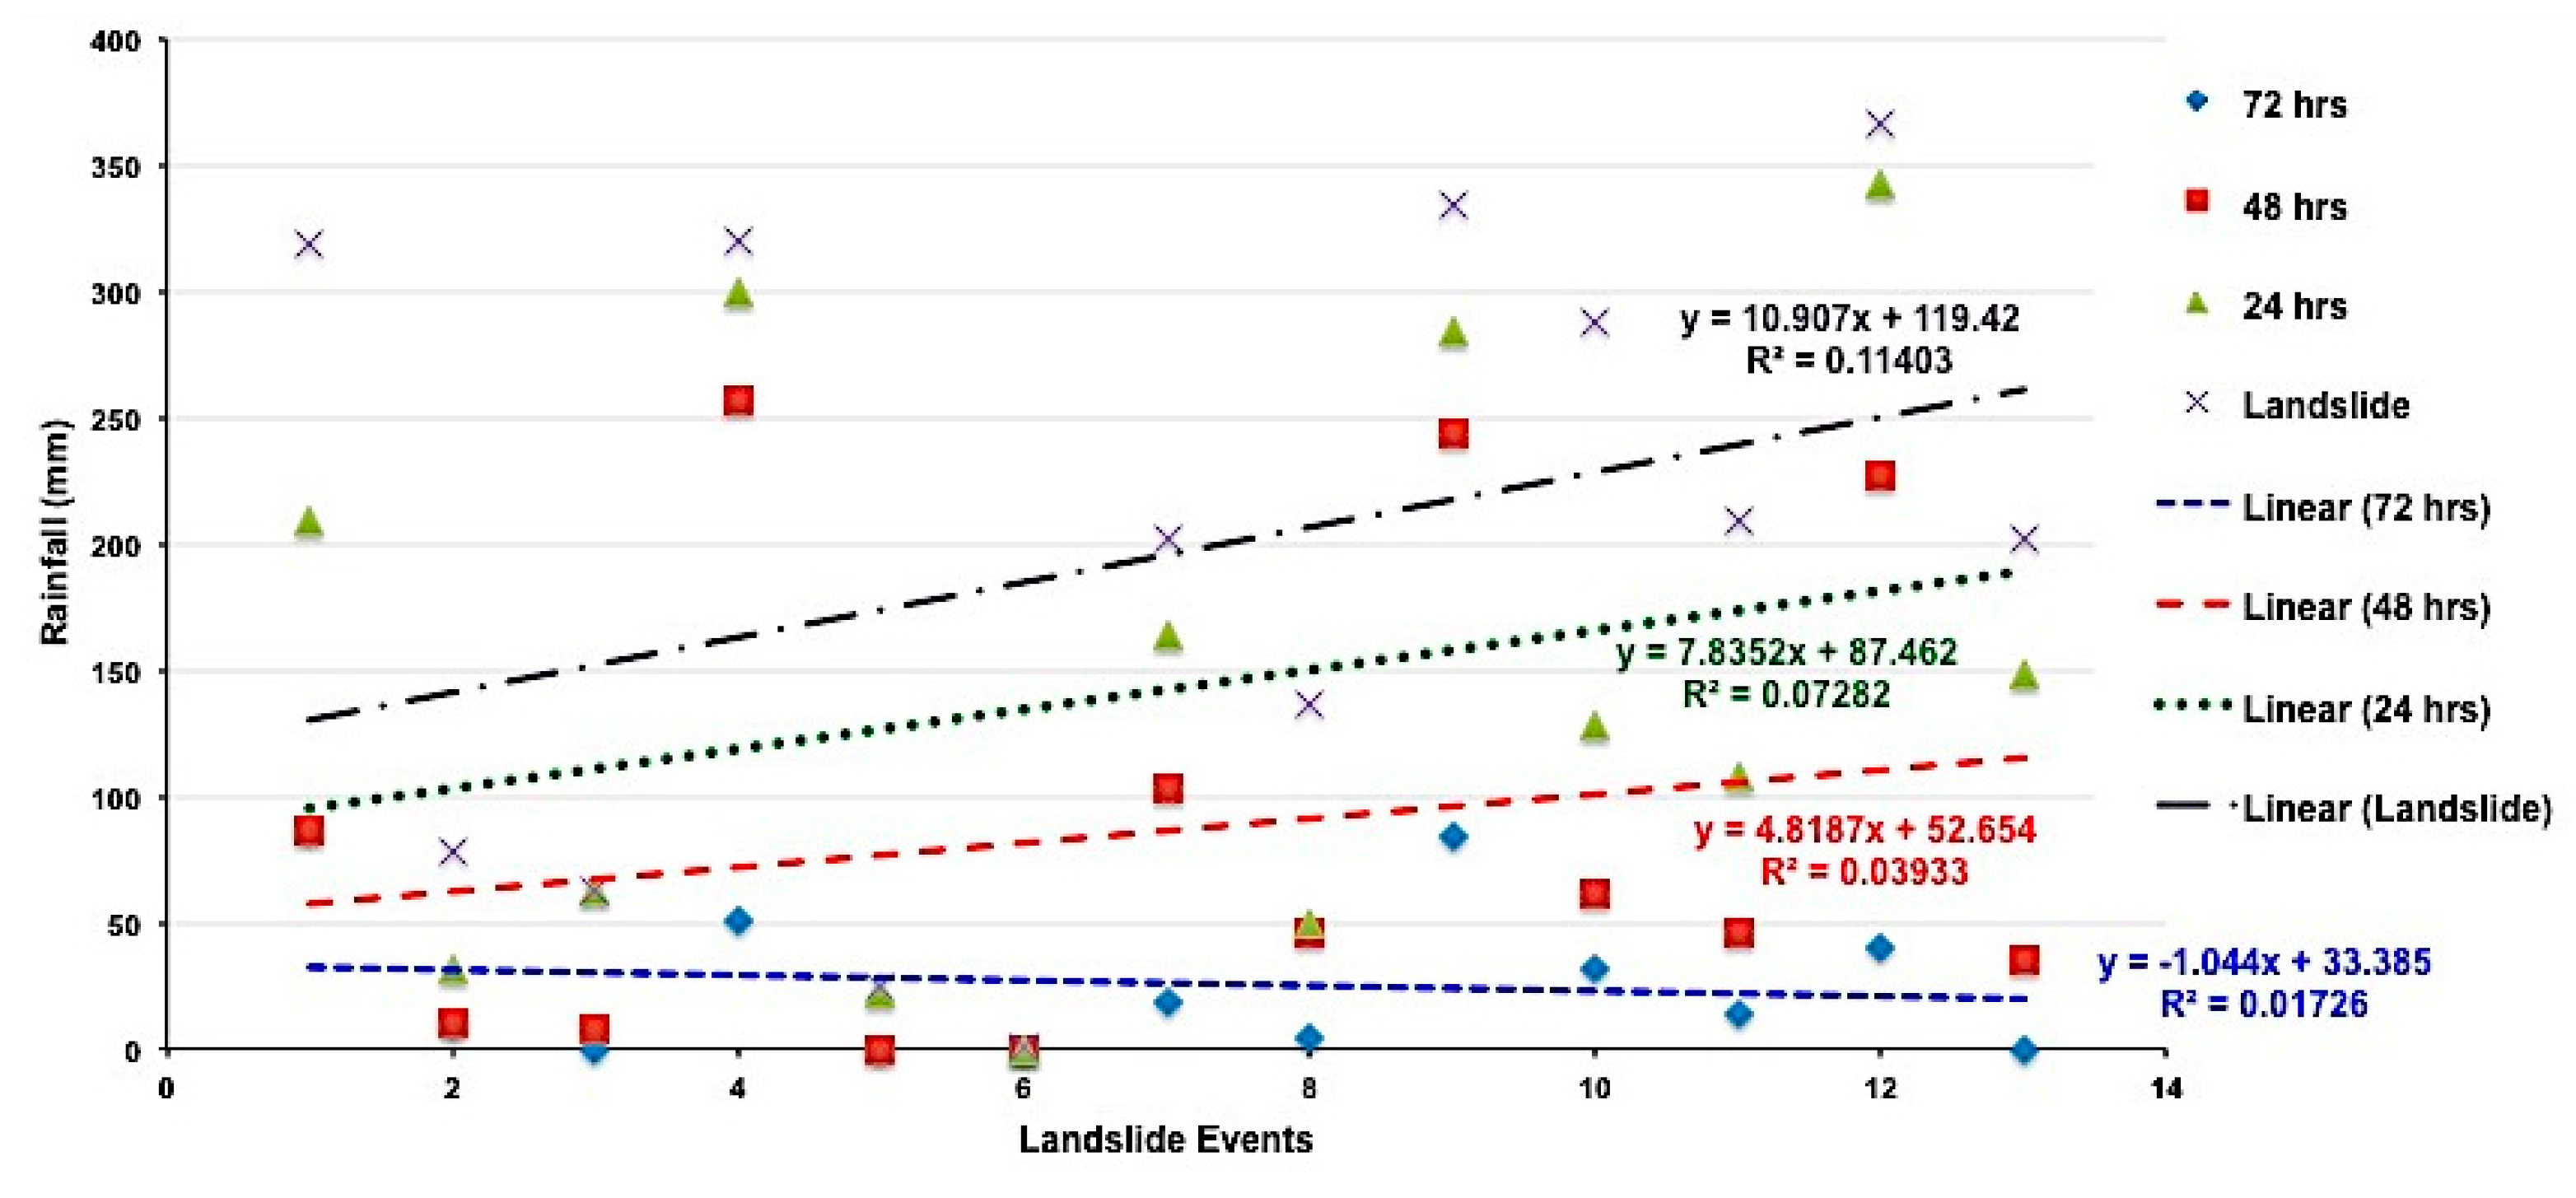
The average annual rainfall of the Chittagong district is approx. 2917 mm. On average, it rains ≥ 50 mm for 18 days, ≥20 mm for 41 days, ≥10 mm for 61 days, and it is likely to rain for 15 consecutive days during the monsoon season in Chittagong [11]. Based on the rainfall pattern analysis, it can be concluded that CCC is located in a high-risk zone for extreme precipitation related events that are conducive to landslides and flash floods. To understand the rainfall threshold values for triggering landslides in CCC, the historical landslide events in Chittagong (Table A1) were examined and the daily precipitation data from the BMD (i.e., seven days prior to and two days after a landslide event) were analysed (Table B1). Linear regression equations were generated (Table B2) to estimate the rainfall thresholds for a specific day. The results suggested that around 140–260 mm rainfall during 72–96 h could trigger landslides in CCC (Figure 5).
Despite being located in a high precipitation zone, the landslide disasters in CCC are primarily associated with community vulnerability such as hill-cutting for residential purposes, city pull factors (i.e., job opportunities), lack of cultural knowledge to deal with the hilly environment, and socio-economic issues [8]. It is obvious that the fragile soil characteristics and higher amount of rainfall along with other factors (i.e., slope, vegetation, geology etc.) can cause landslides; but the landslide disasters are typically a combination of natural phenomena and social processes in CCC. This study considered the landslide disaster-hit locations to prepare the landslide inventory map (Figure 3a). Until now, all the landslides in CCC were rainfall-induced (Table A1), indicating a clear relationship between precipitation and landslide occurrence. It is not possible to calculate a best-fit linear regression (R2 ≅ 1) for rainfall threshold estimation, because the landslide disasters are predominantly determined by factors associated with vulnerability.
2.2.2. Changes in Land Cover
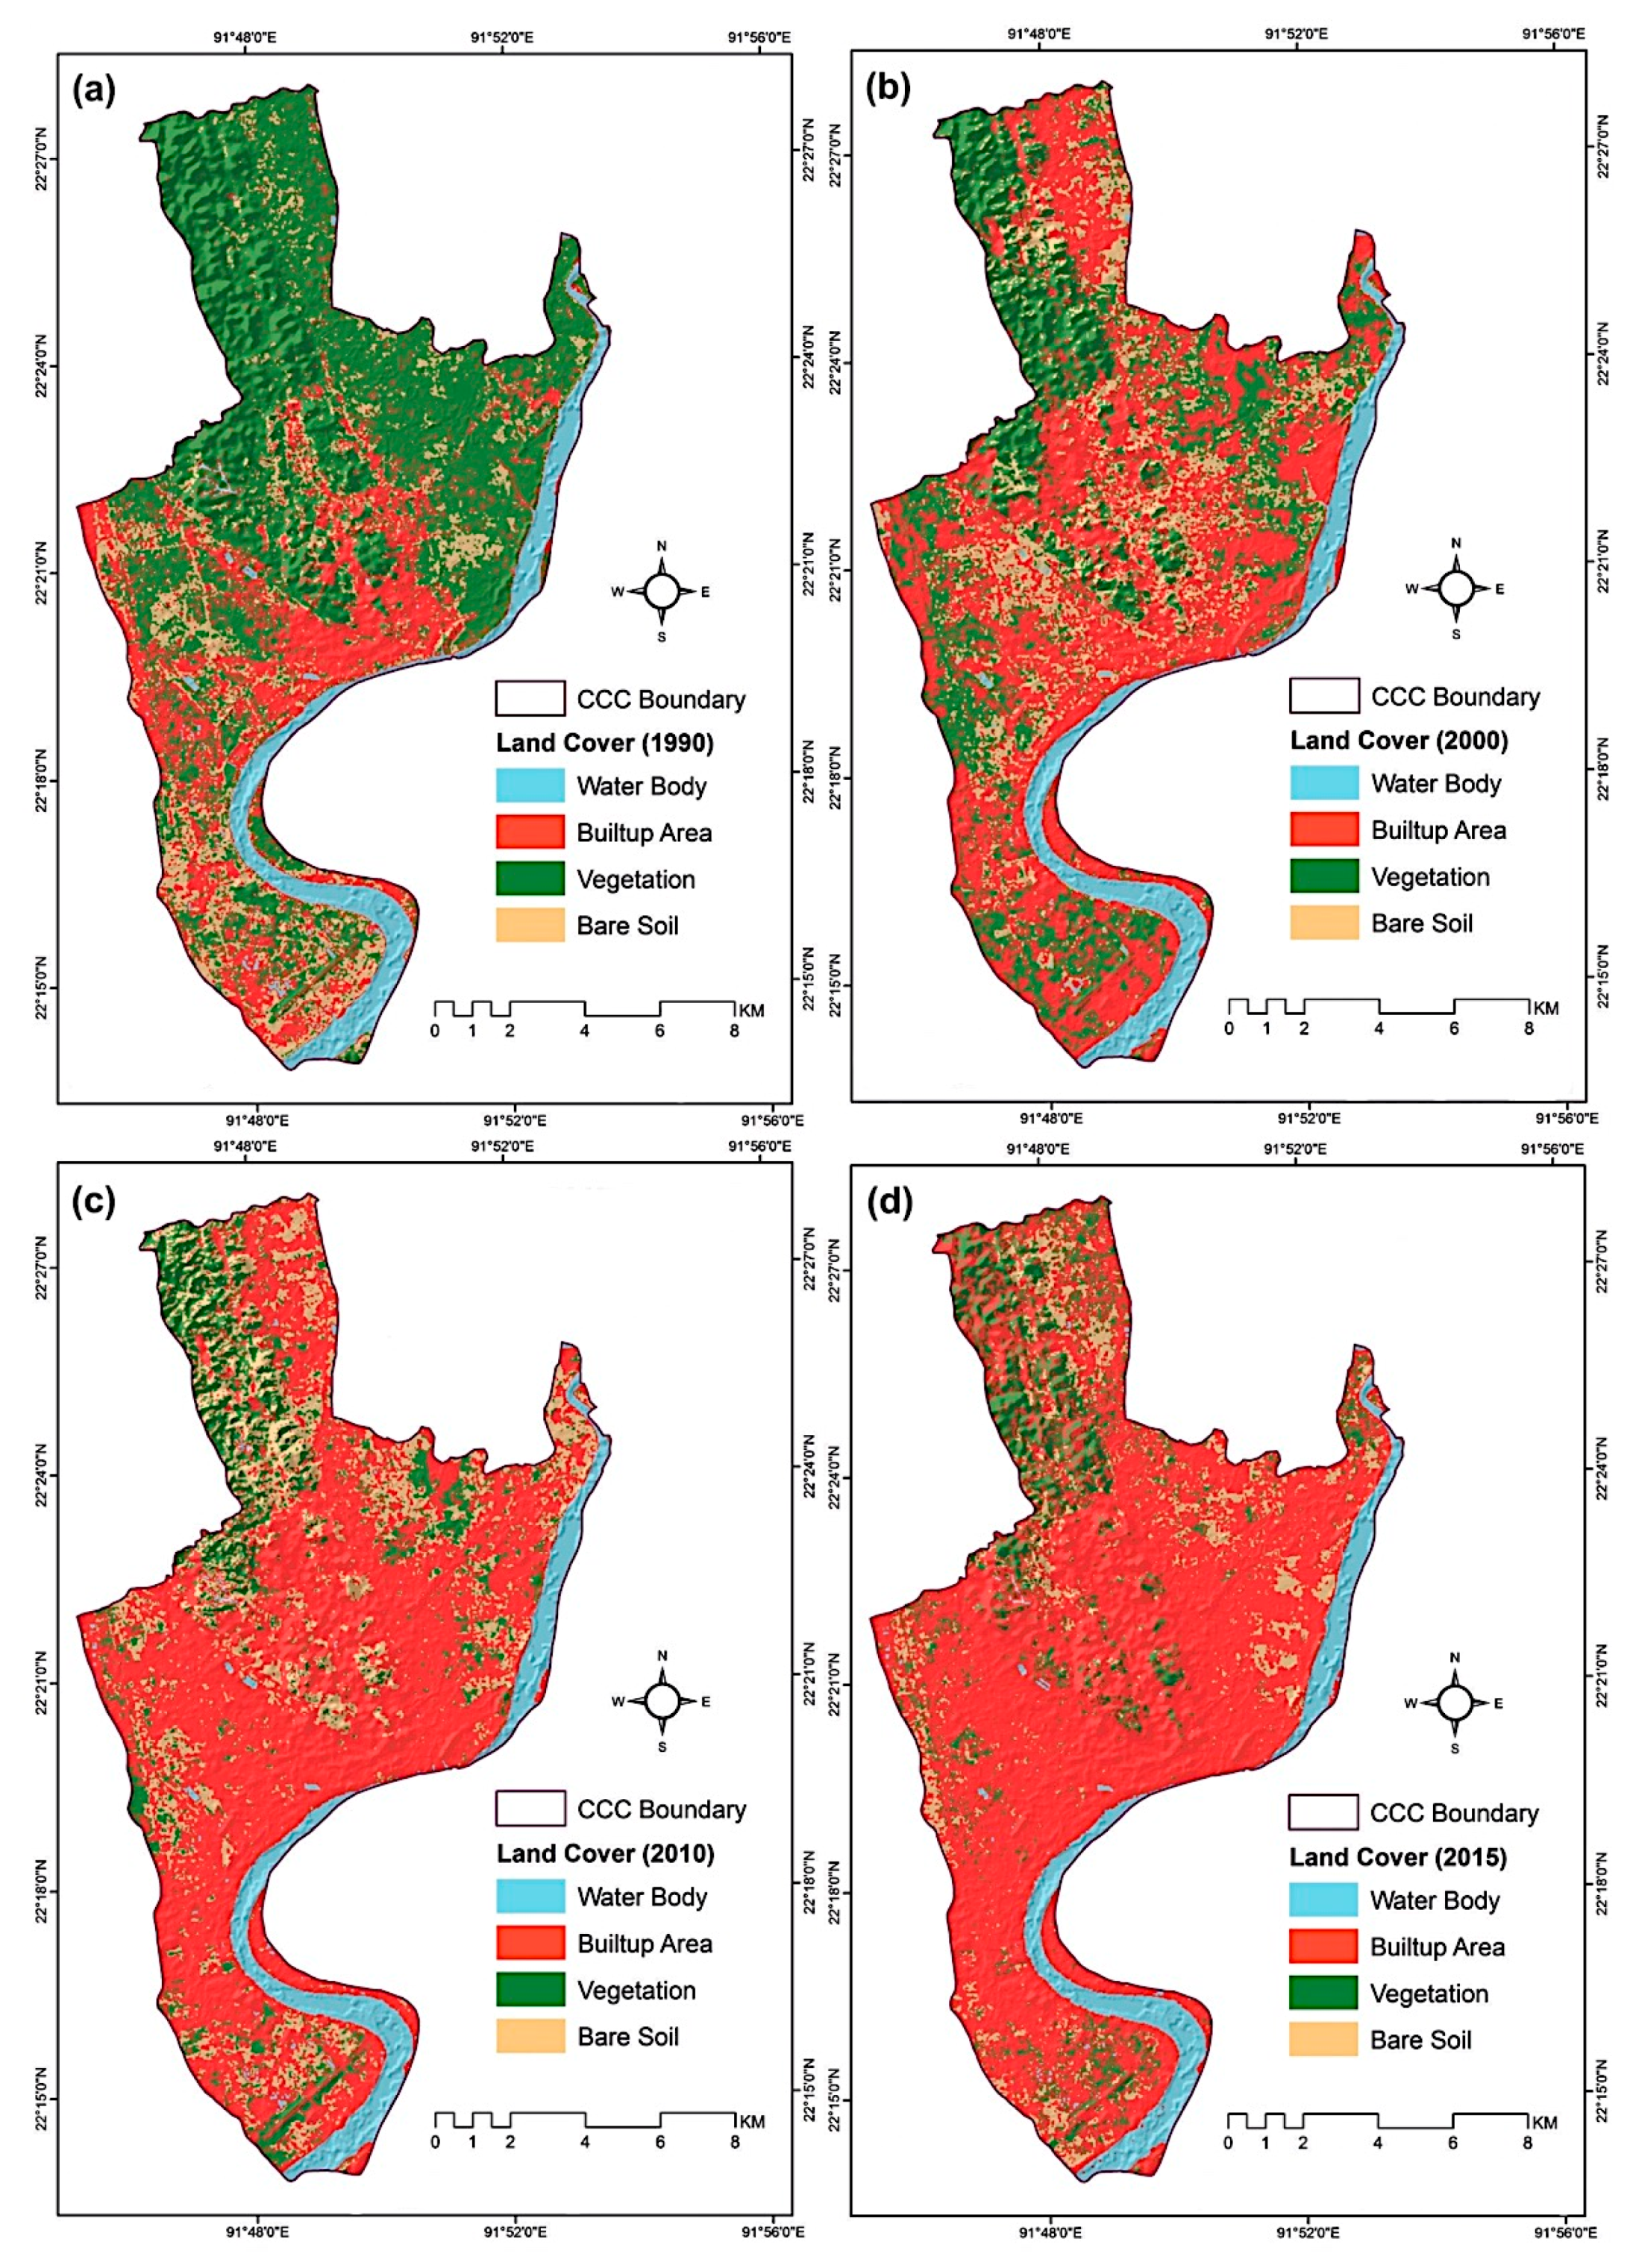
Four land cover maps (Figure 6) were classified using the Landsat TM and OLI images (19 November 1991, 21 December 2000, 5 February 2009, and 24 April 2014). Four broad land cover types, i.e., built-up area (urban and rural settlements, and transportation infrastructure), vegetation (covering shrub-land, rain-fed cultivation herbaceous crops, irrigated herbaceous crops, hilly areas, and forest in hills), bare soil (sand, sea beach, fallow land, earth and sand fillings, open space, and exposed soils), and water bodies (river, reservoir/ponds, lake, canal, and other seasonal low lands), were mapped. A maximum likelihood supervised classification method was applied. The land cover maps were validated using Chittagong city guide maps and Google Earth images. The landslide disasters in Chittagong were predominantly observed from the 1990s (Table A1); hence, analyzing the land cover pattern changes from 1990–2015 is justified. The overall accuracy is found to be >86%, which is suitable for further analysis such as conversion of land cover categories over time [54,55].
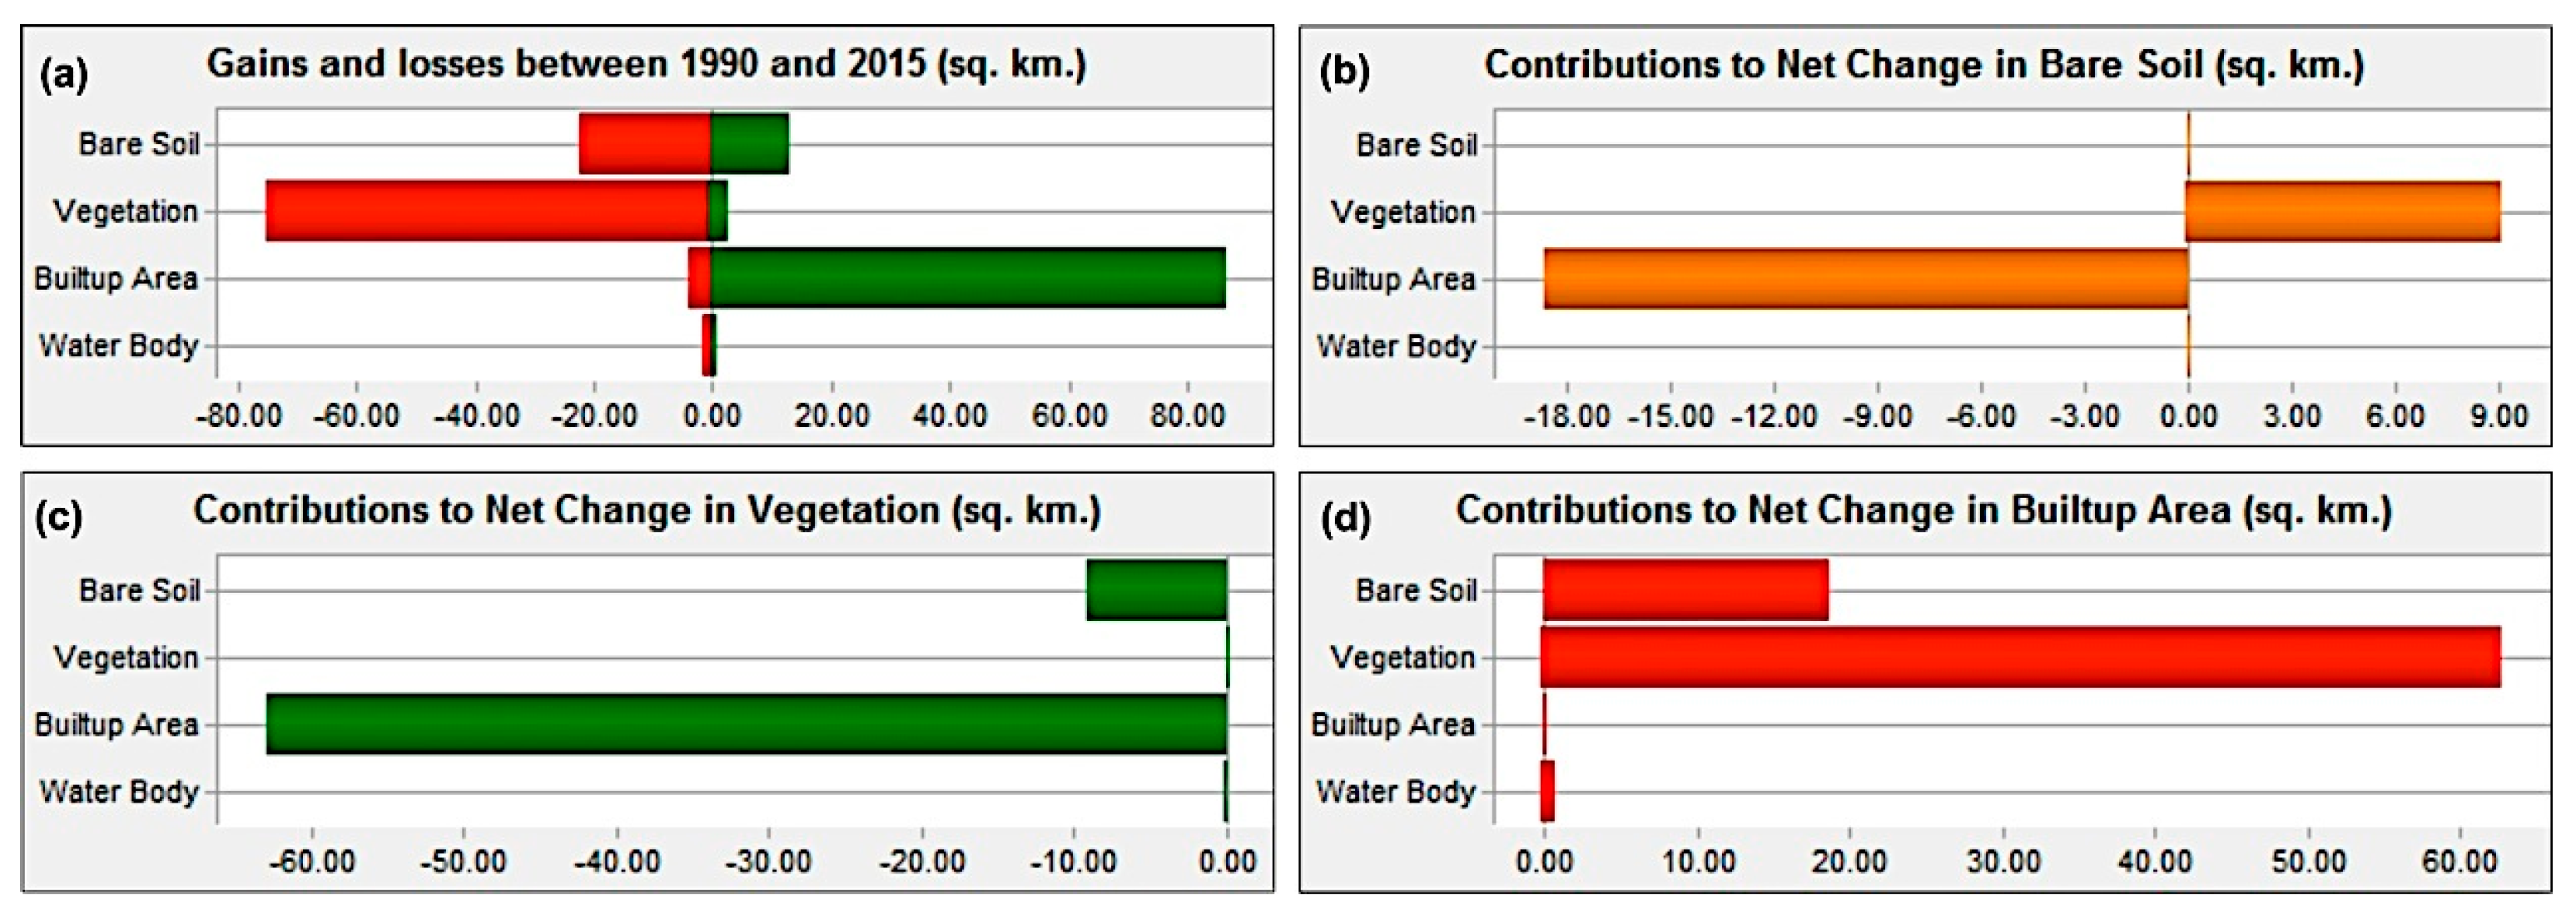
The built-up areas have increased to about 337% (36 km2 to 118 km2) from 1990–2015 (Figure 6). The changes in vegetation to the built-up area, vegetation to bare soil, and bare soil to the built-up area were prominent in CCC from 1990–2015 (Figure 7a). The urban core or central business district was found to be persistence over the decades; however other parts of CCC experienced rapid urban growth. Subsequently, landslides were apparent in the newly developed urban areas on the hills (Figure 7b).
Over the last 25 years, the built-up area gained by approximately 85 km2, and vegetation and bare soil were reduced by about 20 km2 and 76 km2, respectively (Figure 8a). Substantial land cover changes were: around 19 km2 of bare soil changed to built-up areas (Figure 8b), 65 km2 of vegetation (mainly hills and hill forests) converted to built-up areas and 8 km2 of vegetation converted to bare soil (Figure 8c). Consequently, the net land cover change was dominated by an increase in the built-up category (Figure 8d) although the major contribution was from vegetation (64 km2) and bare soil (17 km2). The hills and hill forests/vegetation types were subject to conversion to built-up areas, and in some instances vegetation cover was first transformed to bare soil and then to a builtup category (Figure 8). Land cover change analysis confirms a hill-cutting context for developing residential settlements/urbanization in CCC.
2.2.3. Other Factor Maps
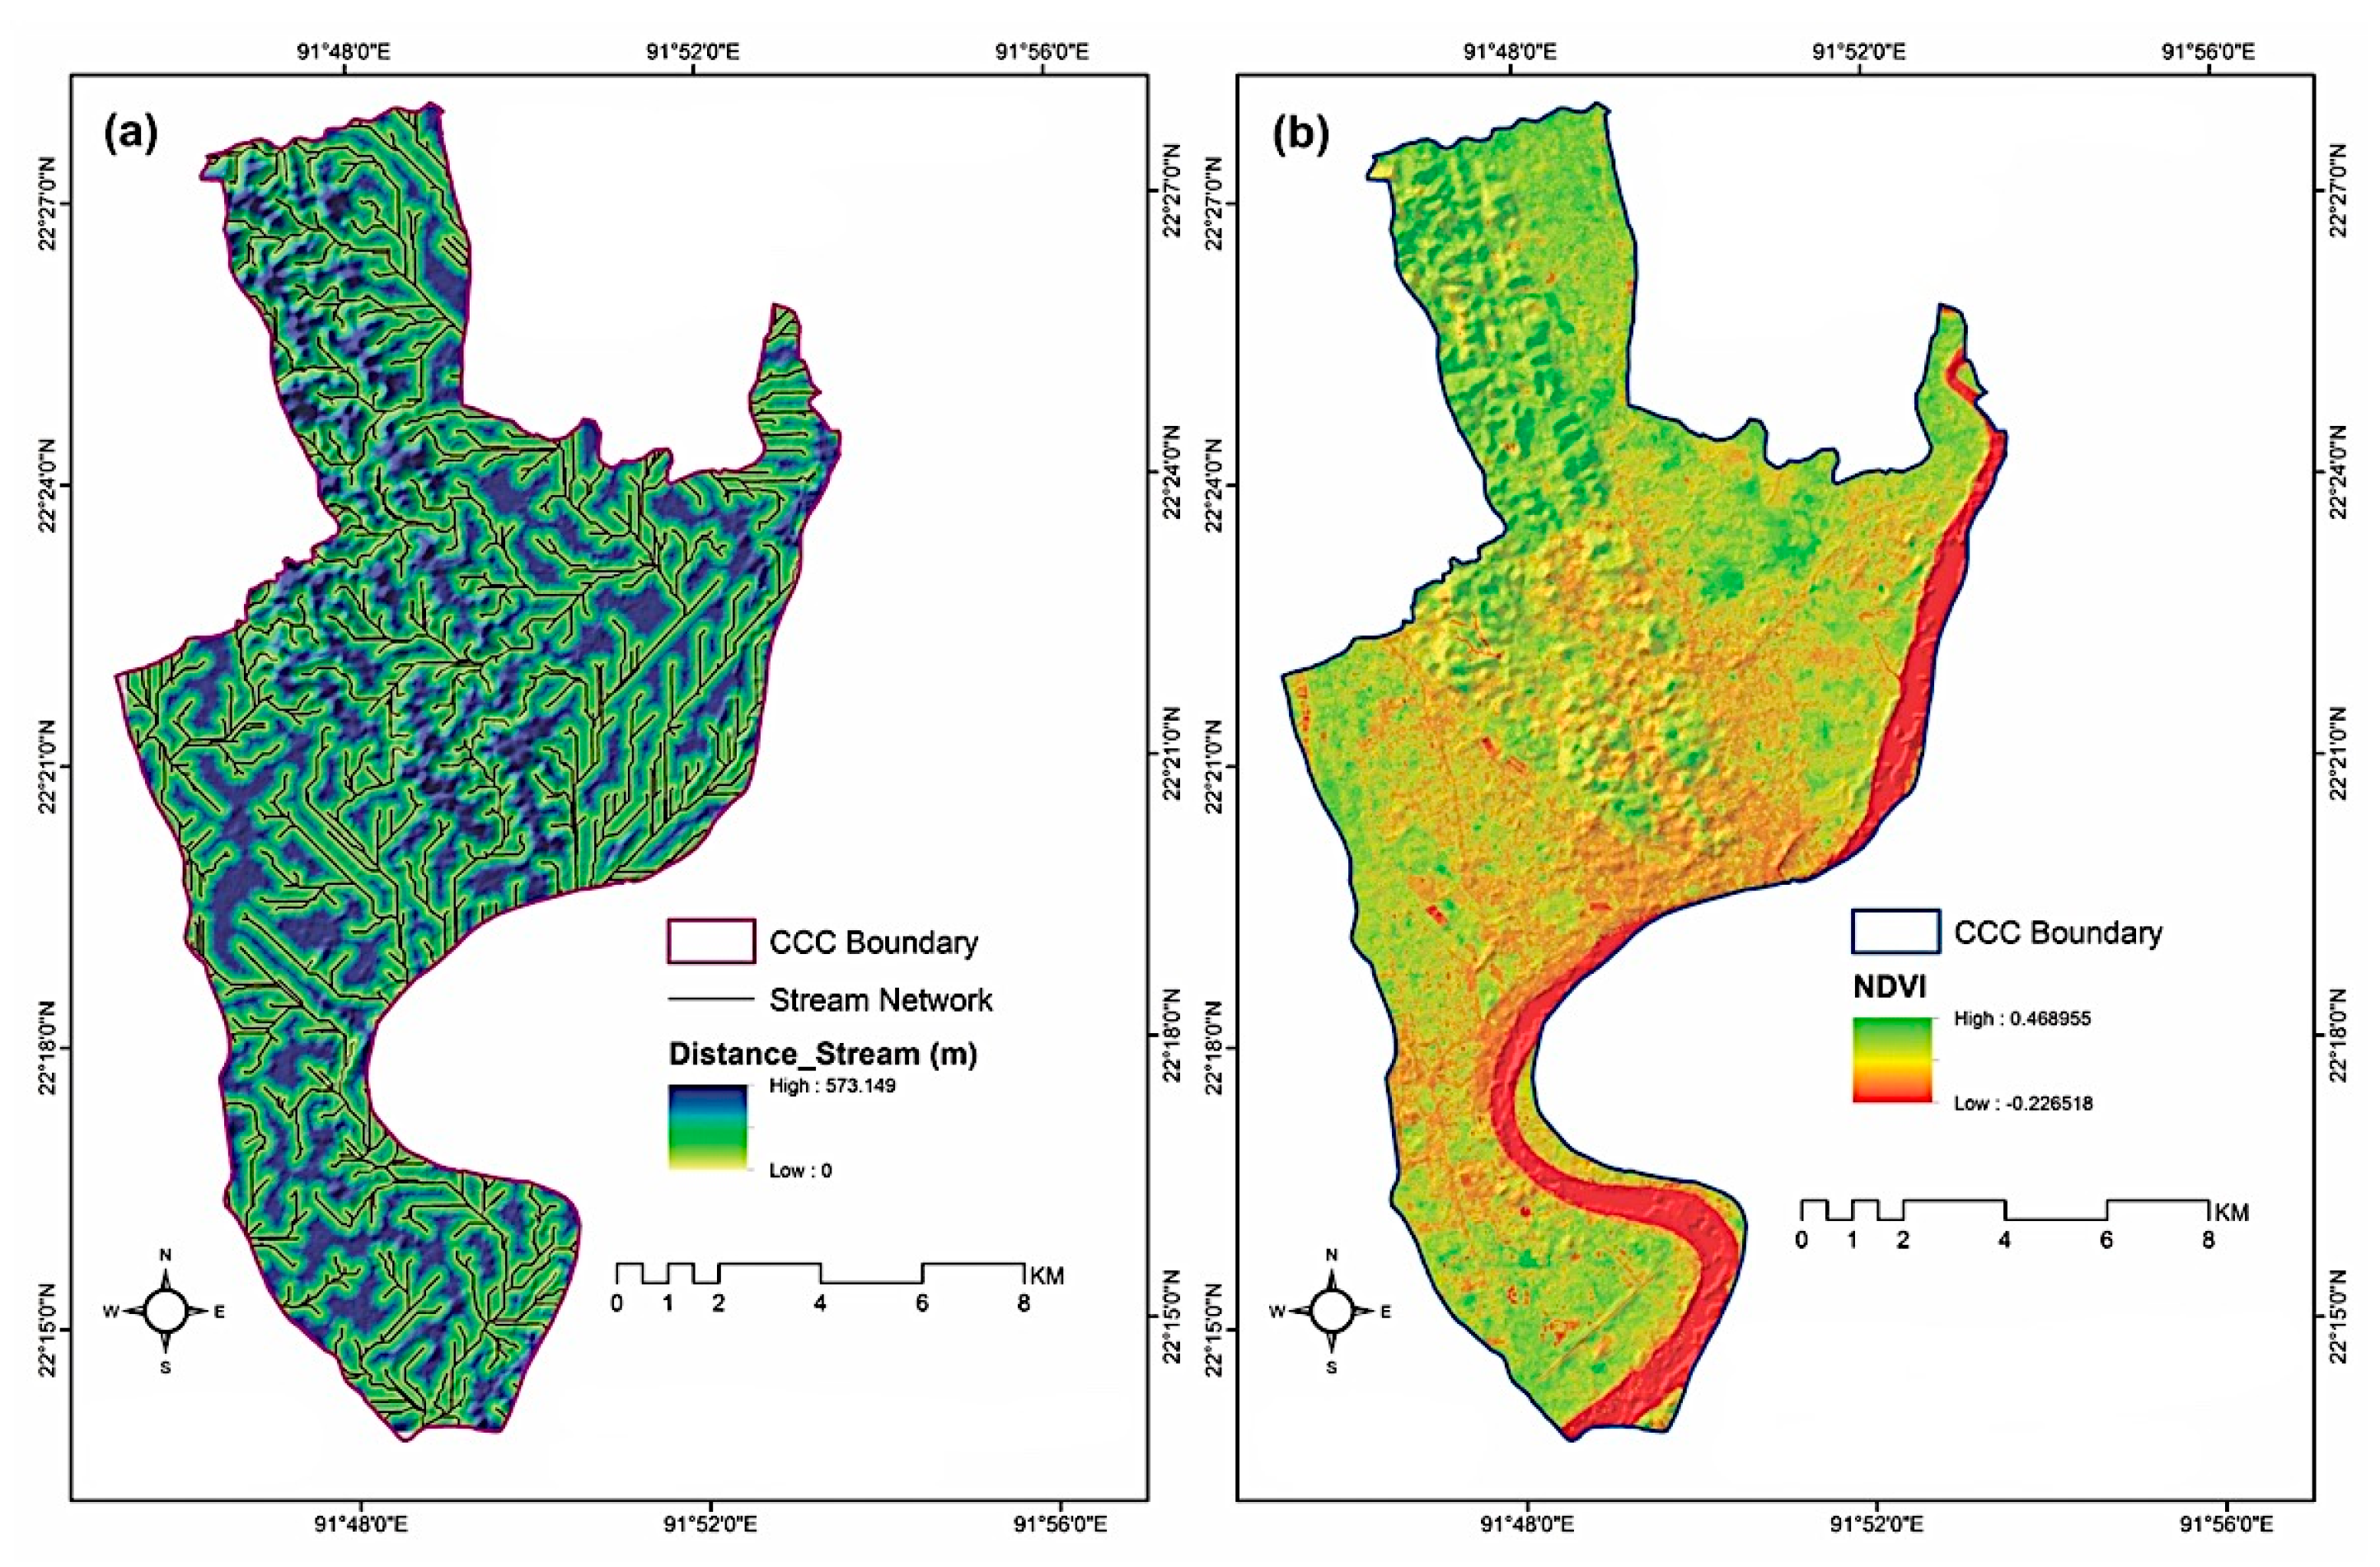
To prepare a landslide inventory map (Figure 9a), extensive fieldwork was carried out in CCC from July to October 2014. A total of 53 landslides locations were identified [56] through a handheld global positioning system (GPS). A hill-cut map is prepared by considering the changes in ‘vegetation to a built-up area’ land cover type from 1990–2015 (Figure 9b). A digital elevation model (DEM) was acquired from ASTER GDEM and was used for generating slope (Figure 10a), aspect (Figure 10b), and stream network (Figure 11a) data. A Landsat 8 OLI image (dated 24 April 2014) was used for generating a normalized difference vegetation index (NDVI) (Figure 11b). A precipitation map (Figure 12a) was prepared using the daily precipitation data noted above. A road (Figure 12b) and drainage network (Figure 12c), and existing building structure layers (Figure 12d) were acquired from CCC. The geological (Figure 13a), geomorphological (Figure 13b), fault–lineaments (Figure 13c), and soil moisture (Figure 13d) layers were collected from the Geological Survey of Bangladesh. The Euclidean distance technique was applied to generate the distance images.
2.3. Statistical Methods
In this study, a Dempster-Shafer weight of evidence (WoE) and multiple regression (MR) techniques were applied to develop LSM. These methods are selected as they could produce landslide susceptibility maps reasonably and with high accuracy [24]. In the modeling and validation stages, 25% samples were analysed by applying a stratified random sampling method. The landslide locations were divided into training (considered a dependent variable) and testing samples (considered for model validation), and the factor maps were considered independent variables.
2.3.1. Dempster-Shafer Weight of Evidence Method
Dempster-Shafer theory [57,58], a variant of Bayesian probability theory, explicitly recognizes the existence of ignorance due to incomplete information. It is used to combine separate pieces of information (evidence) to calculate the probability of an event (i.e., landslide occurrence). The degree to which evidence provides concrete support for a hypothesis (in this case, the existence of landslides) is known as belief. Belief provides the opportunity to explicitly evaluate what is known and what is unknown, and it does so by illuminating the relative strength of knowledge that exists across an entire decision space [24,59,60].
2.3.2. Multiple Regression Method
Multiple regression (MR) is a least-square approach. In MR, a linear relationship is assumed between dependent and independent variables. For example, in the case of three independent variables, the form of MR equation can be [24]:
where, Y is the dependent variable; x1, x2, and x3 are the independent variables; a is the intercept, and b1, b2, and b3 are the coefficients of the independent variables of x1, x2, and x3 respectively. The intercept represents the value of Y when the values of the independent variables approach zero, and the parameter coefficients indicate the change in Y for a one-unit increase in the corresponding independent variable. F-test (for the overall regression) and t-test (for single variable and intercept) tables were consulted for estimating the significance level [24].
Y = a + (b1 × x1) + (b2 × x2) + (b3 × x3)
For the multiple regression (MR) analysis, three different combinations are chosen to understand the importance of various factors in LSM development. The first MR combination is named MR_All and contained all 12 factor maps (Figure 9b, Figure 10a, and Figure 11, Figure 12 and Figure 13). Note that the aspect factor is omitted from the analysis, as no specific pattern or landslide association is found. The land cover map is not considered, and has been supplemented by NDVI, and the factors of distance from existing buildings, drain and road networks. The second MR combination was MR_PCA that included principal components analysis (PCA). One application of PCA is data reduction—by retaining only the first few components and keeping most of the information while discarding a large proportion of data [24]. PCA is used to transform a set of variables such that the new images (called components) are uncorrelated with one another and are ordered in terms of the amount of variances in the datasets. The components are thus a statistical abstraction of the variability inherent in the original datasets. Since each of the components produced by PCA is uncorrelated with one another, each of the PCs carries new information. Also, because they are ordered in terms of the amount of information that they carry, the first few components will tend to have most of the information from the original data while subsequent components will contain only minor variations.
3. Results
3.1. Results of Dempster-Shafer WoE Method
To begin with, the association of landslides with different factors was established. For example, a step-by-step processing of two factor maps– distance to existing buildings (12d) and distance to slope (10a), are explained in this section. The two factor maps were classified by applying the natural breaks method with five classes. A cross-tabulation analysis was performed to identify the classes with landslide dominance. Most landslides occurred in class 1 (0 - 129.7998478 m) for the ‘distance to existing building’ factor (Table 2) and class 3 for the slope factor (Table 3). In the next step, a fuzzy membership technique was applied to each factor. A fuzzy set is characterized by a fuzzy membership grade (also called a possibility) that ranges from 0 to 1, indicating a continuous increase from non-membership to complete-membership.
For the distance from building factor, class 1 was assigned to a fuzzy membership grade of 1, which exists in most landslides (45). Then a sigmoid membership function with a monotonically decreasing membership function shape was applied to class 1. Figure 14a contains the probabilities for the hypothesis (landslide occurrence). This map shows that when the distance from existing building structure is 129.7998478 m, the probability of a landslide incident increases (from 0) following a sigmoid shaped curve, until at 0 m when the probability reaches 1 (Figure 14a).
For the slope factor map, class 3 (3.096963996–5.663019876°) is assigned to a membership grade of 1, which exists in many landslide occurrences (16). In fact, landslides are distributed among all of the slope classes, however classes 2 and 4 were associated with high landslide occurrences (Table 3). Upon analyzing the relative association of landslides with factor classes, a user defined fuzzy set membership grade of 0.25, 0.70, 0.85, and 0.70 was assigned to class 1, 2, 4, and 5, respectively (Table 3). The fuzzy membership image of the slope is shown in Figure 14b.
However, there is a drawback to this probability assessment. When probability reaches 1 for the hypothesis (in this case landslide occurrences), it does not leave any room for ignorance about other class types or any unexpected situations. To incorporate this uncertainty, it is necessary to scale down the probability [24]. The maximum fuzzy membership is reduced from 1 to 0.65 and 0.90 for the distance to the building (Figure C1a) and slope (Figure C3b) factors, respectively. The other factors maps are processed accordingly. The final fuzzy membership/probability maps are illustrated in Figure C1, Figure C2 and Figure C3.
For preparing the final fuzzy probability maps (Figure C1, Figure C2 and Figure C3) by considering uncertainties- distance to road class 1 (0–131.4839456 m), fault and lineaments class 1 (0–848.9262408 m), drainage class 1 (0–416.2050494 m) and stream classes 1 and 2 (covering 0–152.8397786 m); rainfall classes 3-5 (covering 2781.40267–2901.788086 mm/year), hill cut areas, geology (estuarine/riverine tidal flat deposits and upper Tipam formation), geomorphology (rounded top highly dissected hill and sharp crest slightly dissected hill), and soil moisture (mixed type 100–200 and 200–300 mm) classes are selected based on their degree of association with landslide events in CCC.
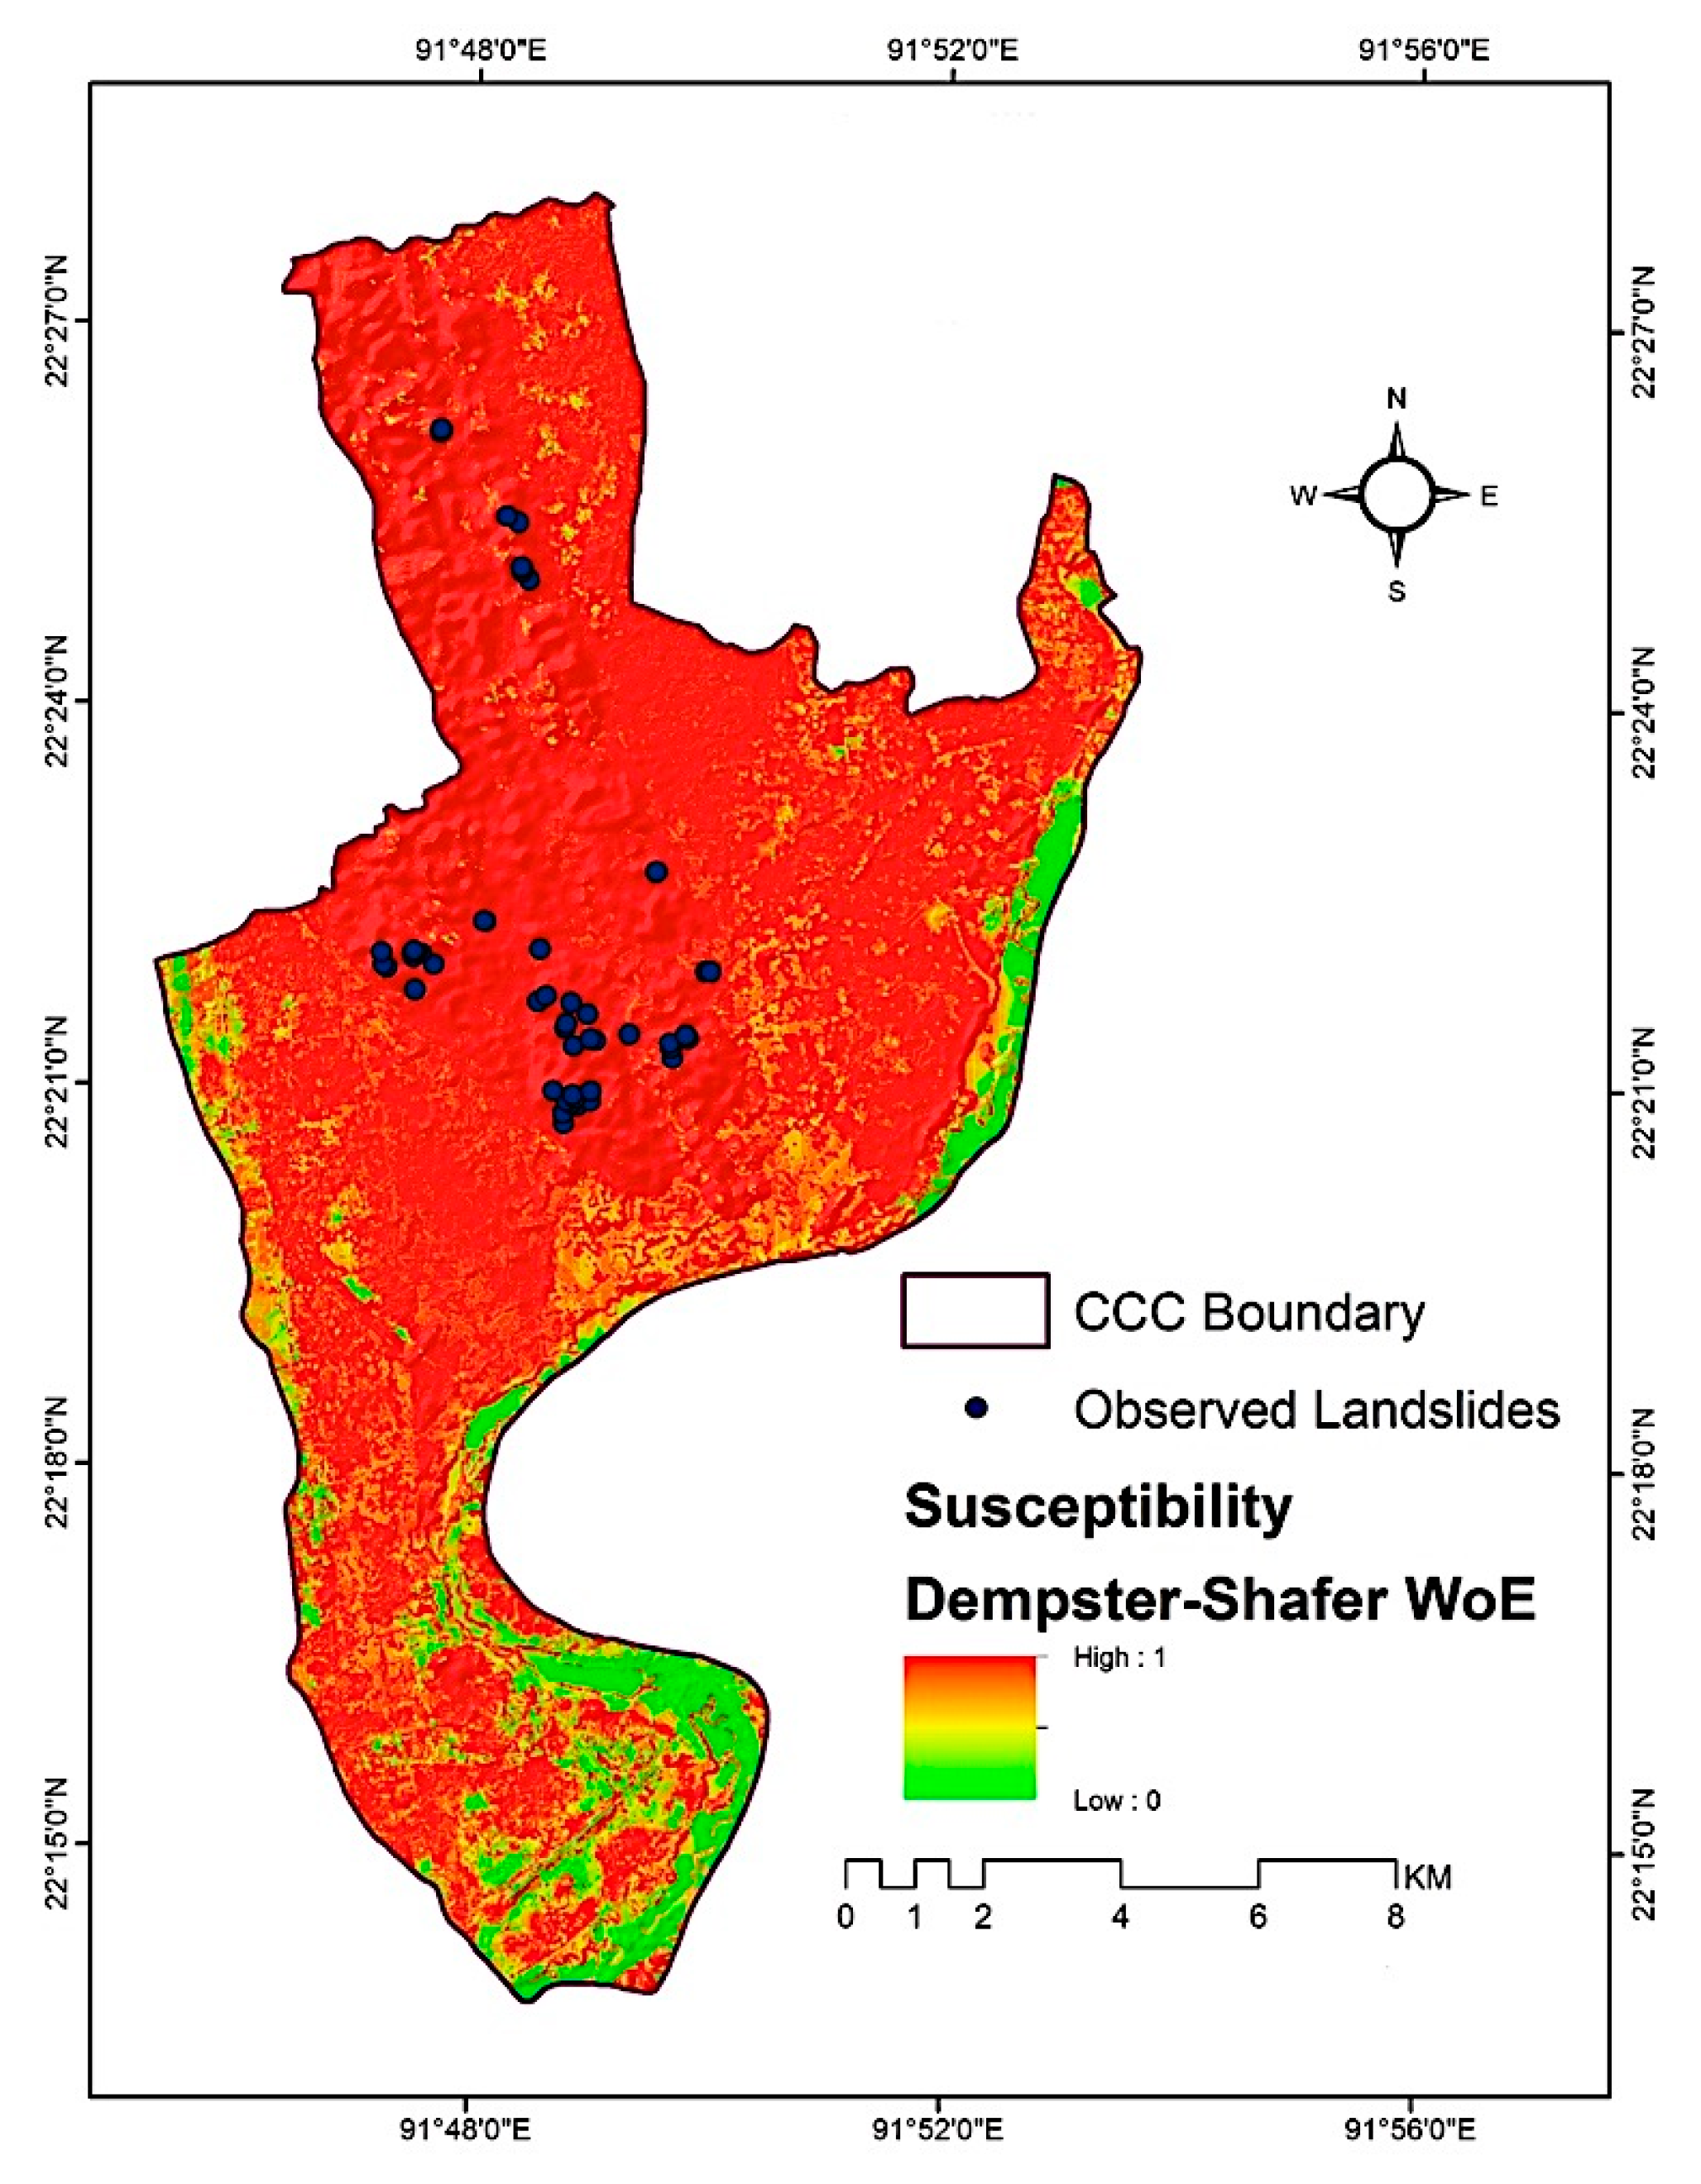
The remaining evidence (1- probability image) produces the probabilities that do not support the hypothesis. This is known as ignorance, and the Belief module in IDRISI software calculates it automatically. The program combines all of the evidence and creates the resulting basic probability assignments to test the hypothesis [24]. The Dempster-Shafer WoE method applied to LSM (Figure 15) contains the aggregated probability of landslides from known locations and factor maps. The probabilistic values are higher around the points where there is evidence of landslide incidence in the past.
3.2. Multiple Regression Results
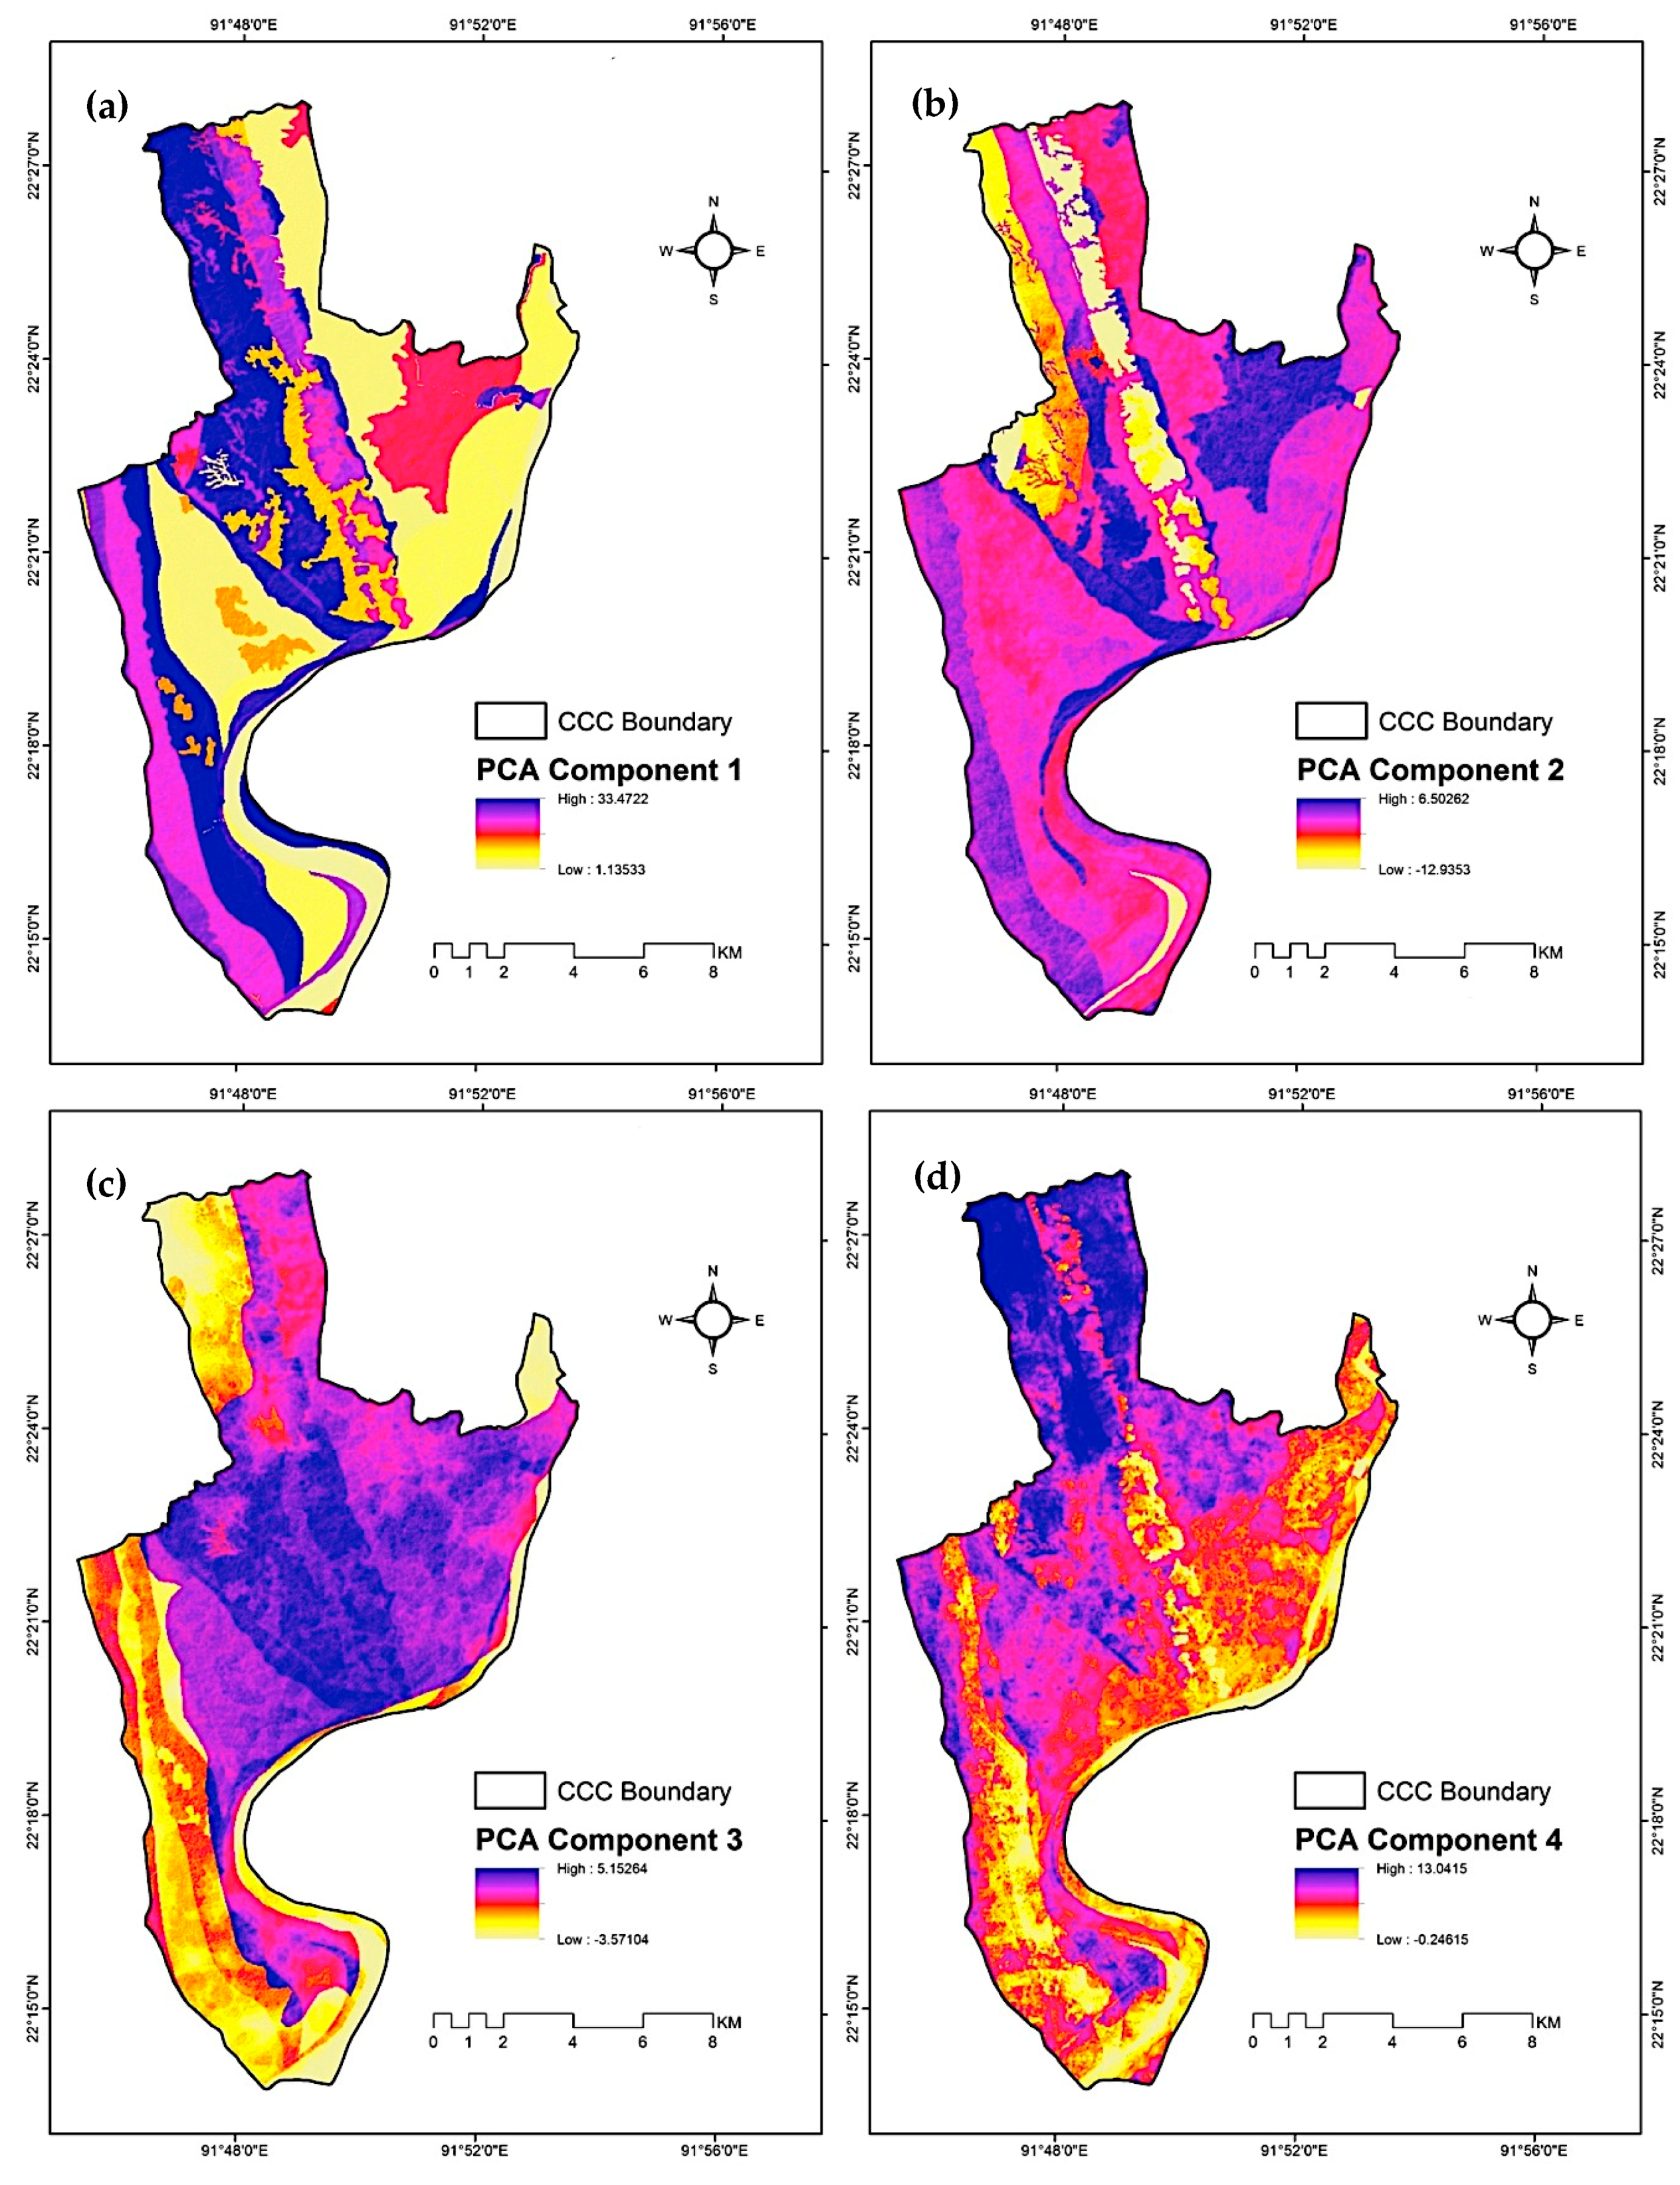
A forward t-mode (with an unstandardized covariance matrix) PCA technique is applied to the 12 factor maps (Figure 9b, Figure 10a, and Figure 11, Figure 12 and Figure 13) to reduce the number of variables and redundant information. The PCA analysis has reduced 12 factors to four components (C1–C4) comprising about 95% of information of the original datasets (Table 4). It means that virtually all the variation in 12 factors is contained in the first four components (Figure D1). Component 1 which produced the highest variance (86%) is highly correlated (Table 4) with geomorphology (0.98) and geology (0.97). It indicates that the first component (C1) is similar to these factor maps (Figure C1a). The correlation efficient is very low (<0.5) between component two (C2) and the factor maps/variables. C2 appears to contain random noise elements. Similarly, component three (C3) is highly correlated with soil moisture, and component four (C4) is correlated with NDVI and rainfall factors (Table 4).
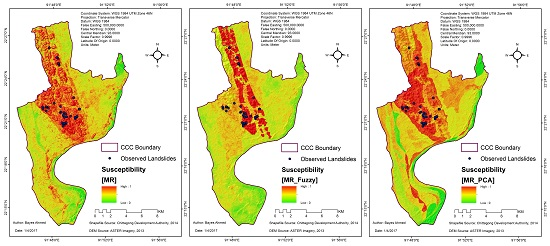
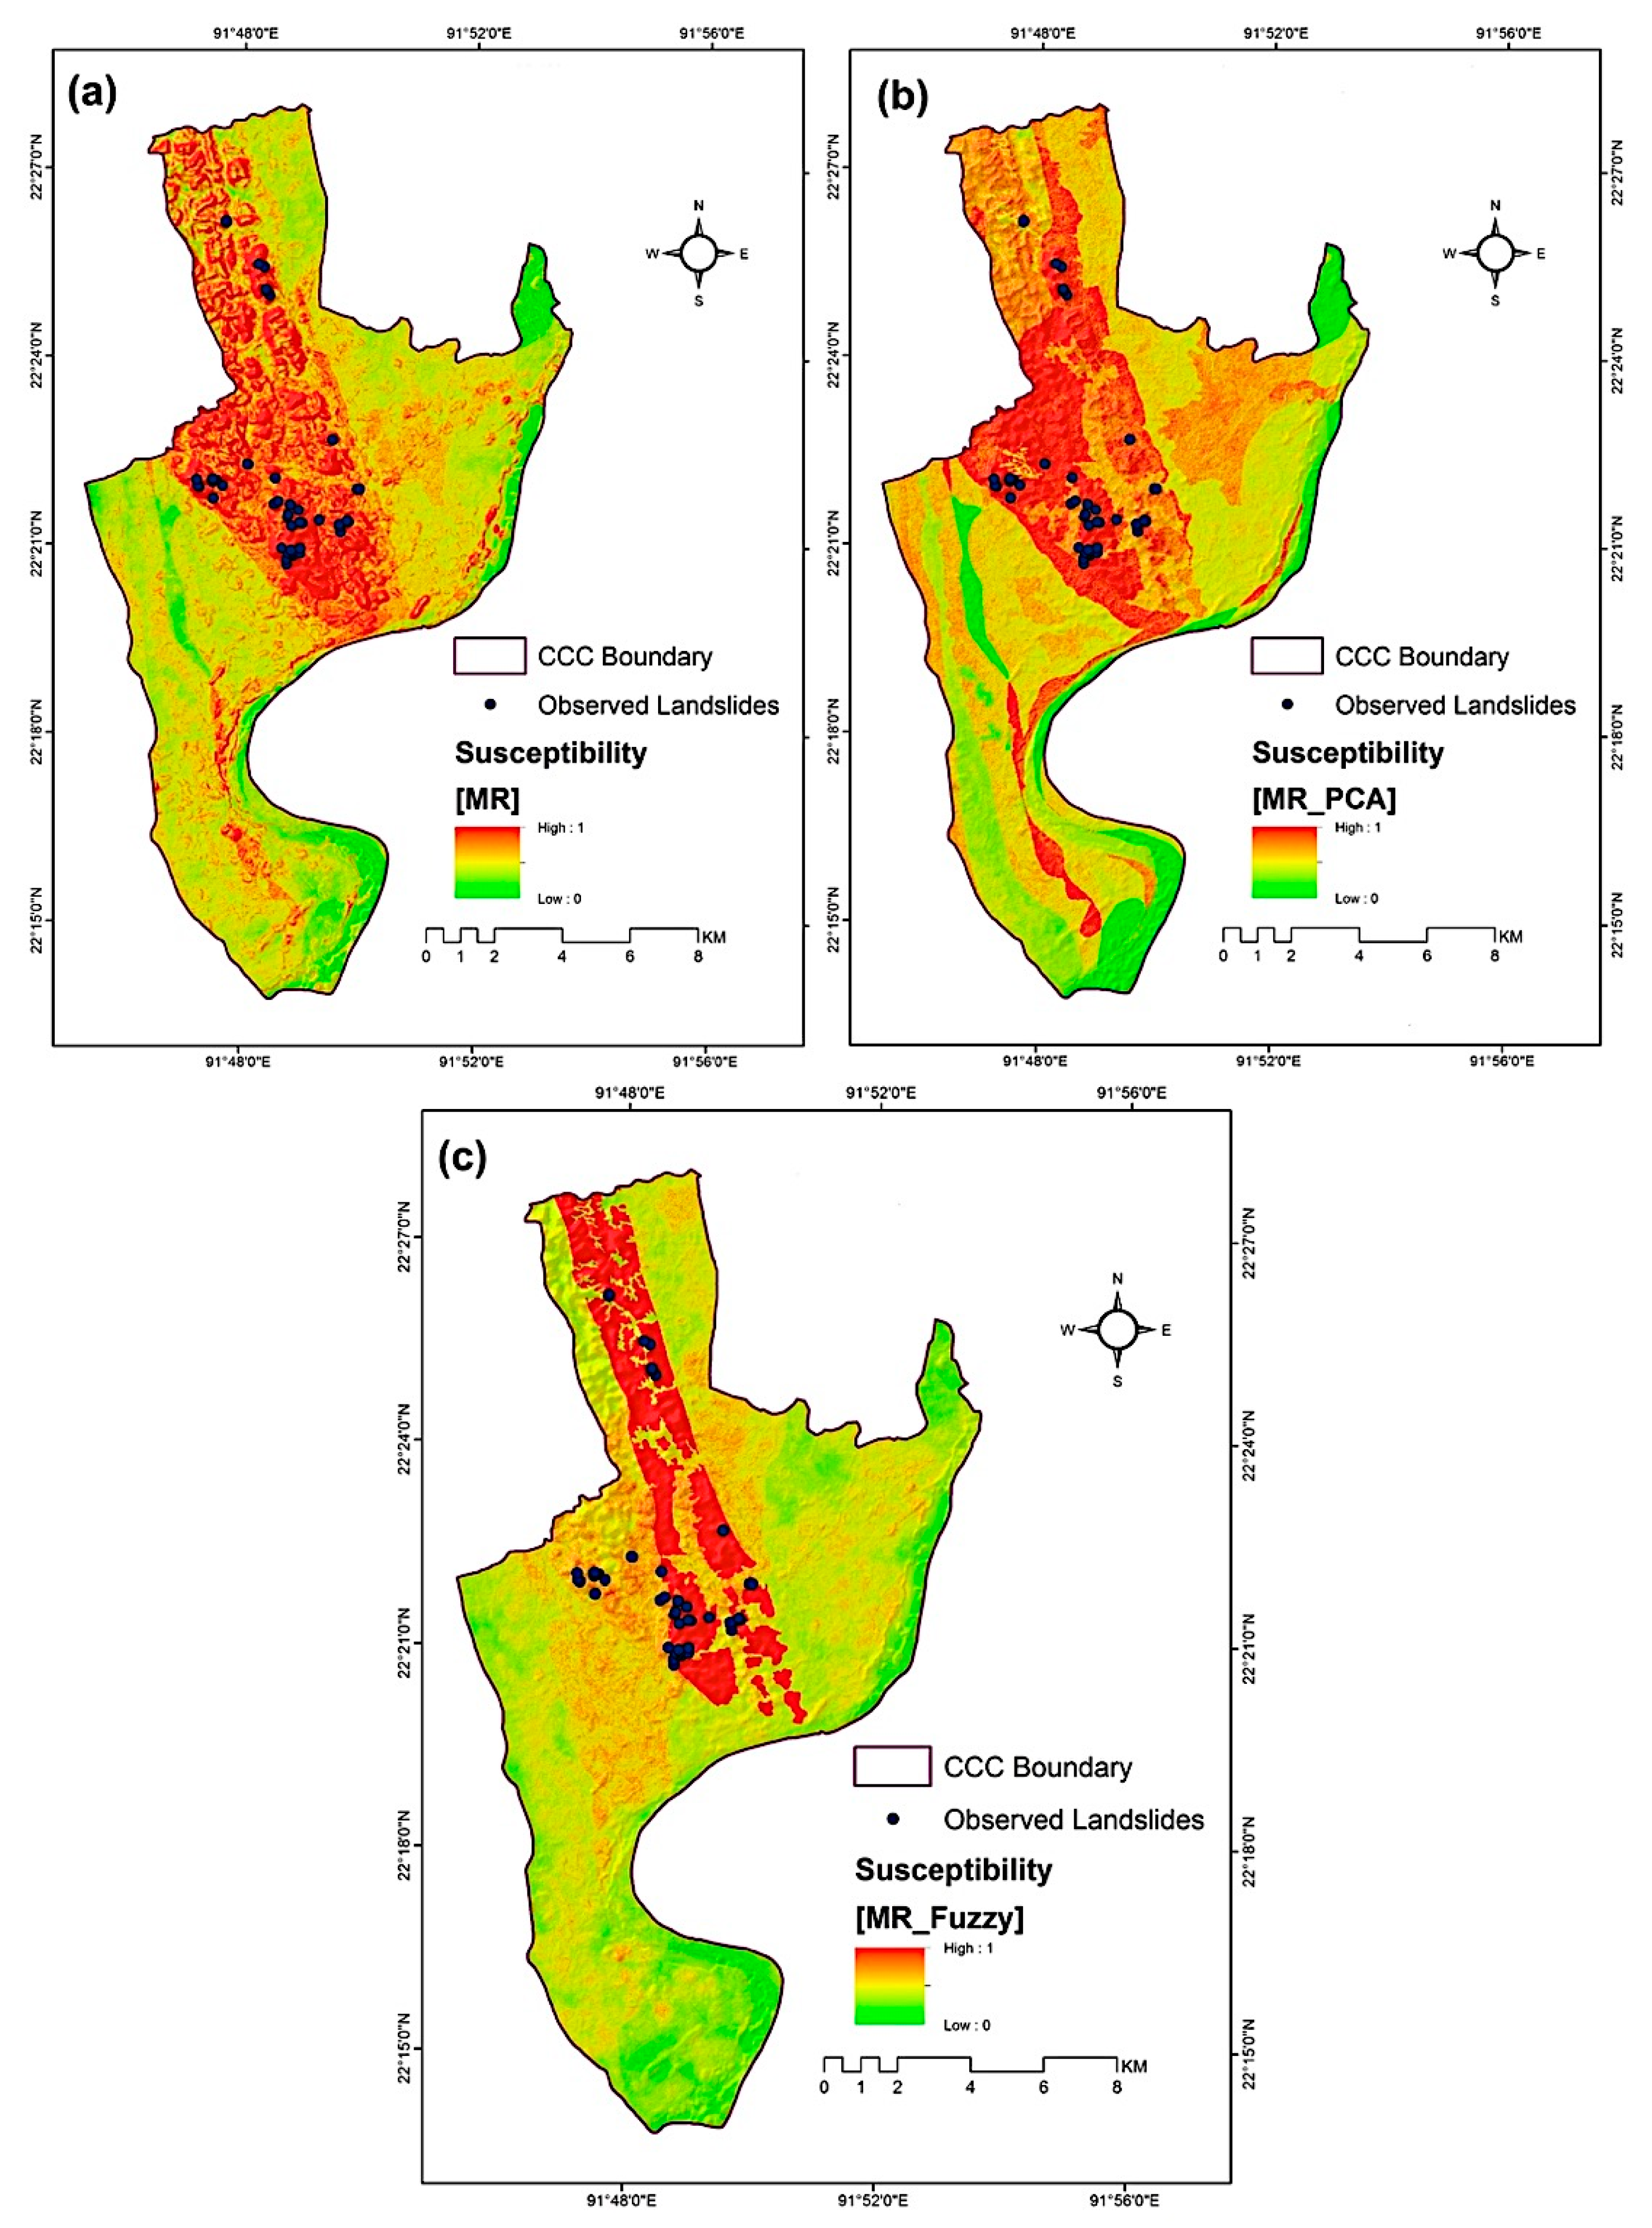
The MR method is then applied to correlate the four PCA components to past landslide locations (training phase) in order to derive the projected LSM (e.g., MR_PCA). The third MR combination is named MR_Fuzzy and incorporates the 12 fuzzy membership (considering uncertainties) probability maps (Figure C1, Figure C2 and Figure C3). The LSMs, as generated from the MR_All, MR_PCA, and MR_Fuzzy methods are illustrated in Figure 16a–c, respectively.
Combining t-statistic and the F-statistic is the most common in estimating the relative success of the model and for adding and deleting independent variables from a regression model [24]. To estimate the overall significance of the MR models (i.e., whether or not the independent variables, taken jointly, contribute significantly to the prediction of the dependent variable; e.g., landslides), the F-test was performed. The F-test regression statistics are calculated as follows:
F (12, 189336) = 7.372194 for MR_All
F (4, 189344) = 12.402010 for MR_PCA
F (12, 189336) = 10.245449 for MR_Fuzzy
In all the cases of F-test, the p-value is found significant (<0.00001). The result was found highly significant at p < 0.05, which considers the hypothesis (landslide occurrences) testing with 5% significance level (α = 0.05). The p-value is the probability of obtaining the observed value of the test statistics. A p-value < 0.01 represents very strong evidence and a p-value > 0.01 means there is strong evidence against the null hypothesis [61]. If the F-values are not significant, then reconsideration of the selection of the independent variables will be required [24].
For each landslide causative factor, p-values for the MR models are calculated from t-test (Table 5, Table 6 and Table 7). The intercept can be thought of as the value of the dependent variable when each of the independent variables takes a value of zero. The coefficients express the individual contribution of each independent variable to the dependent variable. The significance of the coefficient is expressed in the form of a t-statistic [24]. The slope is found as the most dominating factor (p-value < 0.01) for triggering landslides in CCC followed by soil moisture, and distance from fault-lineaments (p-value < 0.05) in the MR_All method (Table 5). In the case of the MR_PCA method, principal components of C1, C3, and C4 are highly significant (Table 6); and for the MR_Fuzzy model, soil moisture was found highly significant followed by geomorphology (Table 7). The MR methods suggest that geomorphology, geology, soil moisture, slope, NDVI, and rainfall are the most important predictors that are statistically significant and highly associated with the occurrence of landslides in CCC.
3.3. Model Validation
The receiver operating characteristic (ROC) curve was applied to validate the LSMs. It is a plot of the true positive rate (i.e., the cumulative percentage of observed landslide occurrences) against the false positive rate (the cumulative percentage of decreasing susceptibility index) to obtain the success rate or ROC curve [25]. The area under the ROC curve (AUC) is used in order to determine which of the models predicts the best. The AUC value 0.5 means predictions are no better than random (i.e., no improvement), whereas AUC with a value ≥0.9 represents the ideal situation [24,61]. Evaluating ROC curves and AUC values in validating and comparing different models in LSM are a common practice [22,62]. The complete landslide inventory map is used for the WoE and the landslide testing dataset is used for the MR model validations. The ROC analysis indicated that the first 25% of the area contains about 97% and 88% of the observed landslides for, respectively, the MR_Fuzzy and MR_PCA, and MR_All and WoE models. The AUC values for the Dempster-Shafer WoE, MR_All, MR_PCA, and MR_Fuzzy models are calculated as 0.873, 0.909, 0.913, and 0.939, respectively (Figure 17).
4. Discussion
To produce the Dempster-Shafer WoE-based bivariate LSM model, the factor classes that have a higher association with landslides were separated, and then the fuzzy membership functions were applied to produce the final probability images by calculating the uncertainties. All the fuzzy class membership images were combined to generate the probabilistic WoE based LSM. To assess the relative weights for the factor classes and to estimate the degrees of uncertainties, it is essential to understand the local context, and expert opinion which was obtained via fieldwork. In contrast, the MR methods combine all the independent layers or causative factor maps, and thus reveal the relations between landslides and the environmental factors. The LSMs do not predict the causes of landslides; rather they indicate the association of landslides with the independent variables. If there is availability of resources for incorporating expert knowledge and conduct extensive field survey, then it is recommended that WoE-based bivariate methods should be applied. In the case of an absence of understanding of the local context, multivariate statistical methods are highly recommended.
Landslide susceptibility mapping is generally considered the first step in dealing with landslide disaster risk reduction (DRR). This kind of analysis can be extended to identify the risk zones and develop a landslide early warning system for a particular area/context. It can also help in identifying the influential factors that trigger landslides. Geomorphology, slope, soil moisture, geology, NDVI, rainfall pattern, and distance from existing buildings were identified as the most dominating factors for landslides in CCC. A wide variety of methods are available to produce LSMs. The selection of a method depends on the availability of datasets and the local context. In this study, RS and GIS datasets and tools were used for LSM and the accuracy of the susceptibility maps was validated using the landslide inventory map prepared through a field survey. It proves that the available geoinformation tools and publicly available datasets can be easily integrated with statistical techniques to produce scientifically valid landslide susceptibility maps.
In this study, both bivariate and multivariate statistical methods were implemented to produce LSMs. Out of the four landslide susceptibility maps; the Dempster-Shafer WoE LSM should be ignored for further processing, as it inconsistent in predicting landslides (AUC < 0.9). The remaining three MR LSMs are found to be ideal for subsequent landslide risk assessment. The three MR LSMs were found useful (AUC > 0.9); nonetheless the practical implementation of a specific LSM depends on resource availability of concerned authority, cultural status of the society and their risk perception [63,64,65,66]. For preparing a landslide risk map, a landslide hazard assessment should be conducted together with a detailed community level vulnerability assessment. It can be concluded that the use of high-resolution satellite images and DEM, and a more detailed field survey for landslide inventory mapping, could improve the quality of the LSMs produced in this study. Future research should address these constraints. Nevertheless, this study has demonstrated that the results from the MR_Fuzzy method could be used with a high degree of confidence.
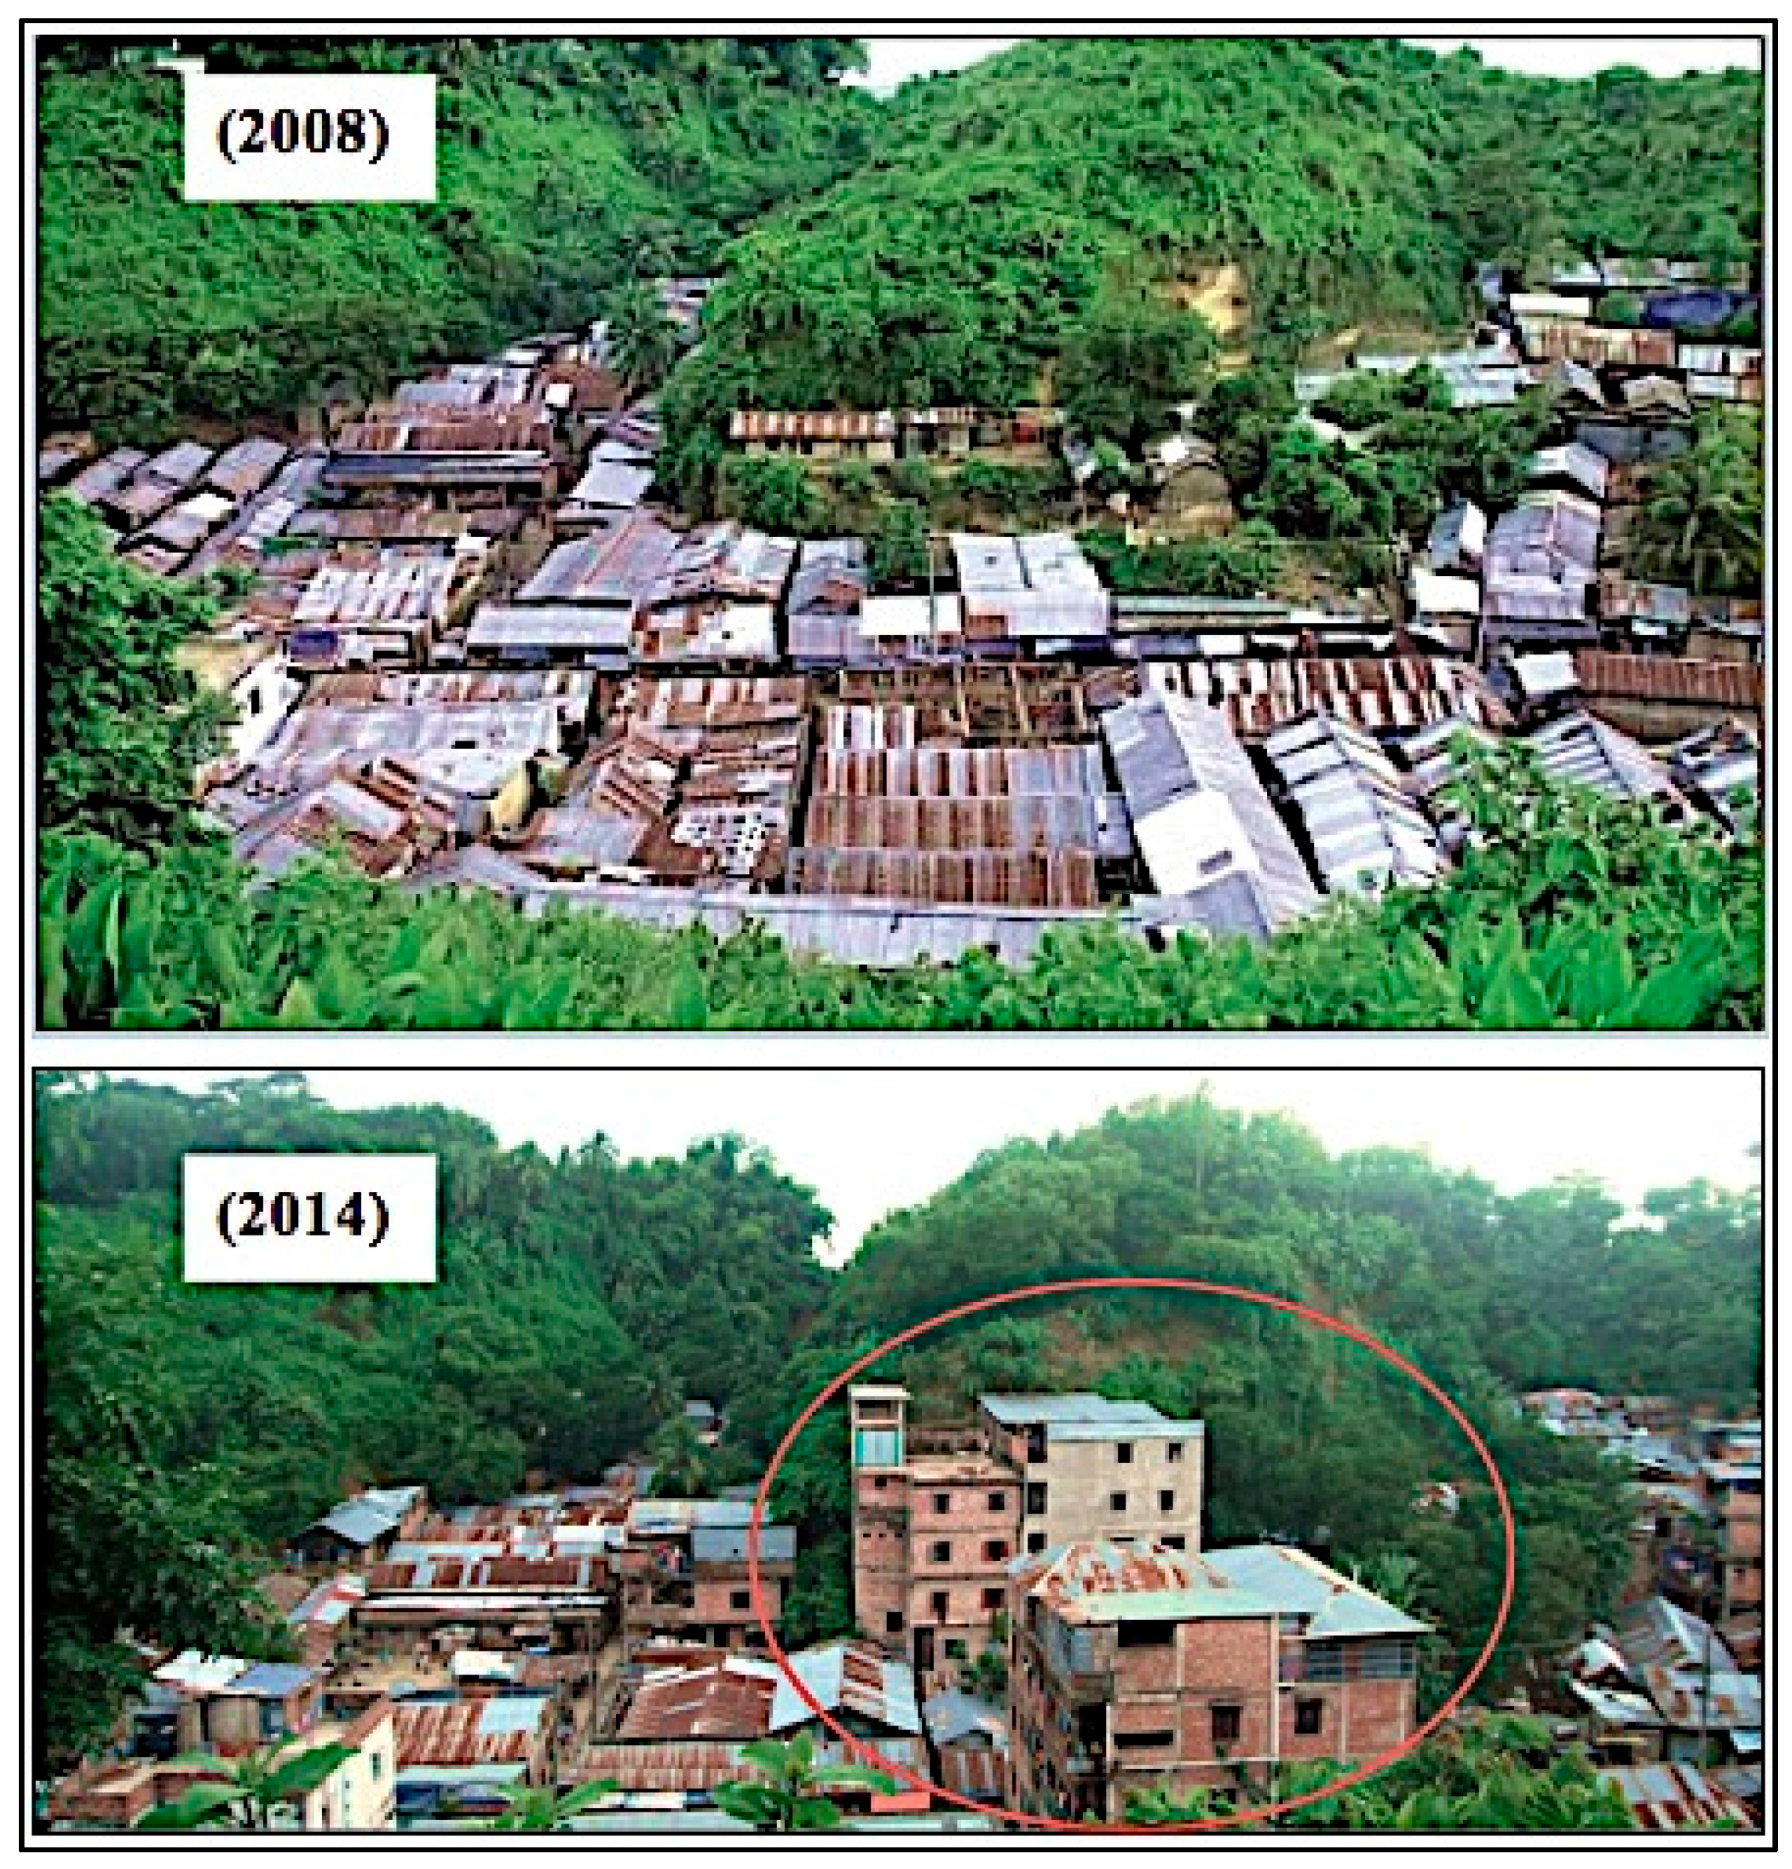
There is no strict hill management system in the urbanized hill districts. This has encouraged many informal settlements to live on the landslide-prone hill slopes in CCC. These settlements are considered as illegal by the formal authorities, while the settlers claim themselves to be legal occupants or owners of the hills. An acute land tenure conflict has been on going among the public agencies, settlers, powerful elites and the local community representatives over the past few decades. This kind of contradiction has undermined the institutional arrangement for reducing landslide risk in the urbanized hilly areas. In 2008, there was not a single high-rise building in the Lalkhan Bazaar area, then within the next six years (in 2014), two five-story buildings were constructed by cutting the hills (Figure 18). It clearly depicts how institutional weaknesses are making people and communities more vulnerable to landslides.
People living in landslide-prone areas around urbanized hills mostly belong to marginalized communities, who are quite new in dealing with the hilly environment. Their monthly income is much less than the national average; many of them come from disaster-hit areas, and have been displaced due to minority attacks and/or political violence. Yet, the government has no plan to provide them with accommodation and thus they have been forced to live on the slopes of the hills. They are neither capable of building landslide-resistant houses, nor are they able to integrate indigenous/local knowledge in order to develop a safer house on the hills. They are also culturally less aware of using the surrounding hills and forests in a sustainable way. It makes them socio-economically and culturally vulnerable to landslides. The authorities are ignorant of community-level vulnerability; rather they are more decisive regarding the geological and engineering solutions to landslide disasters.
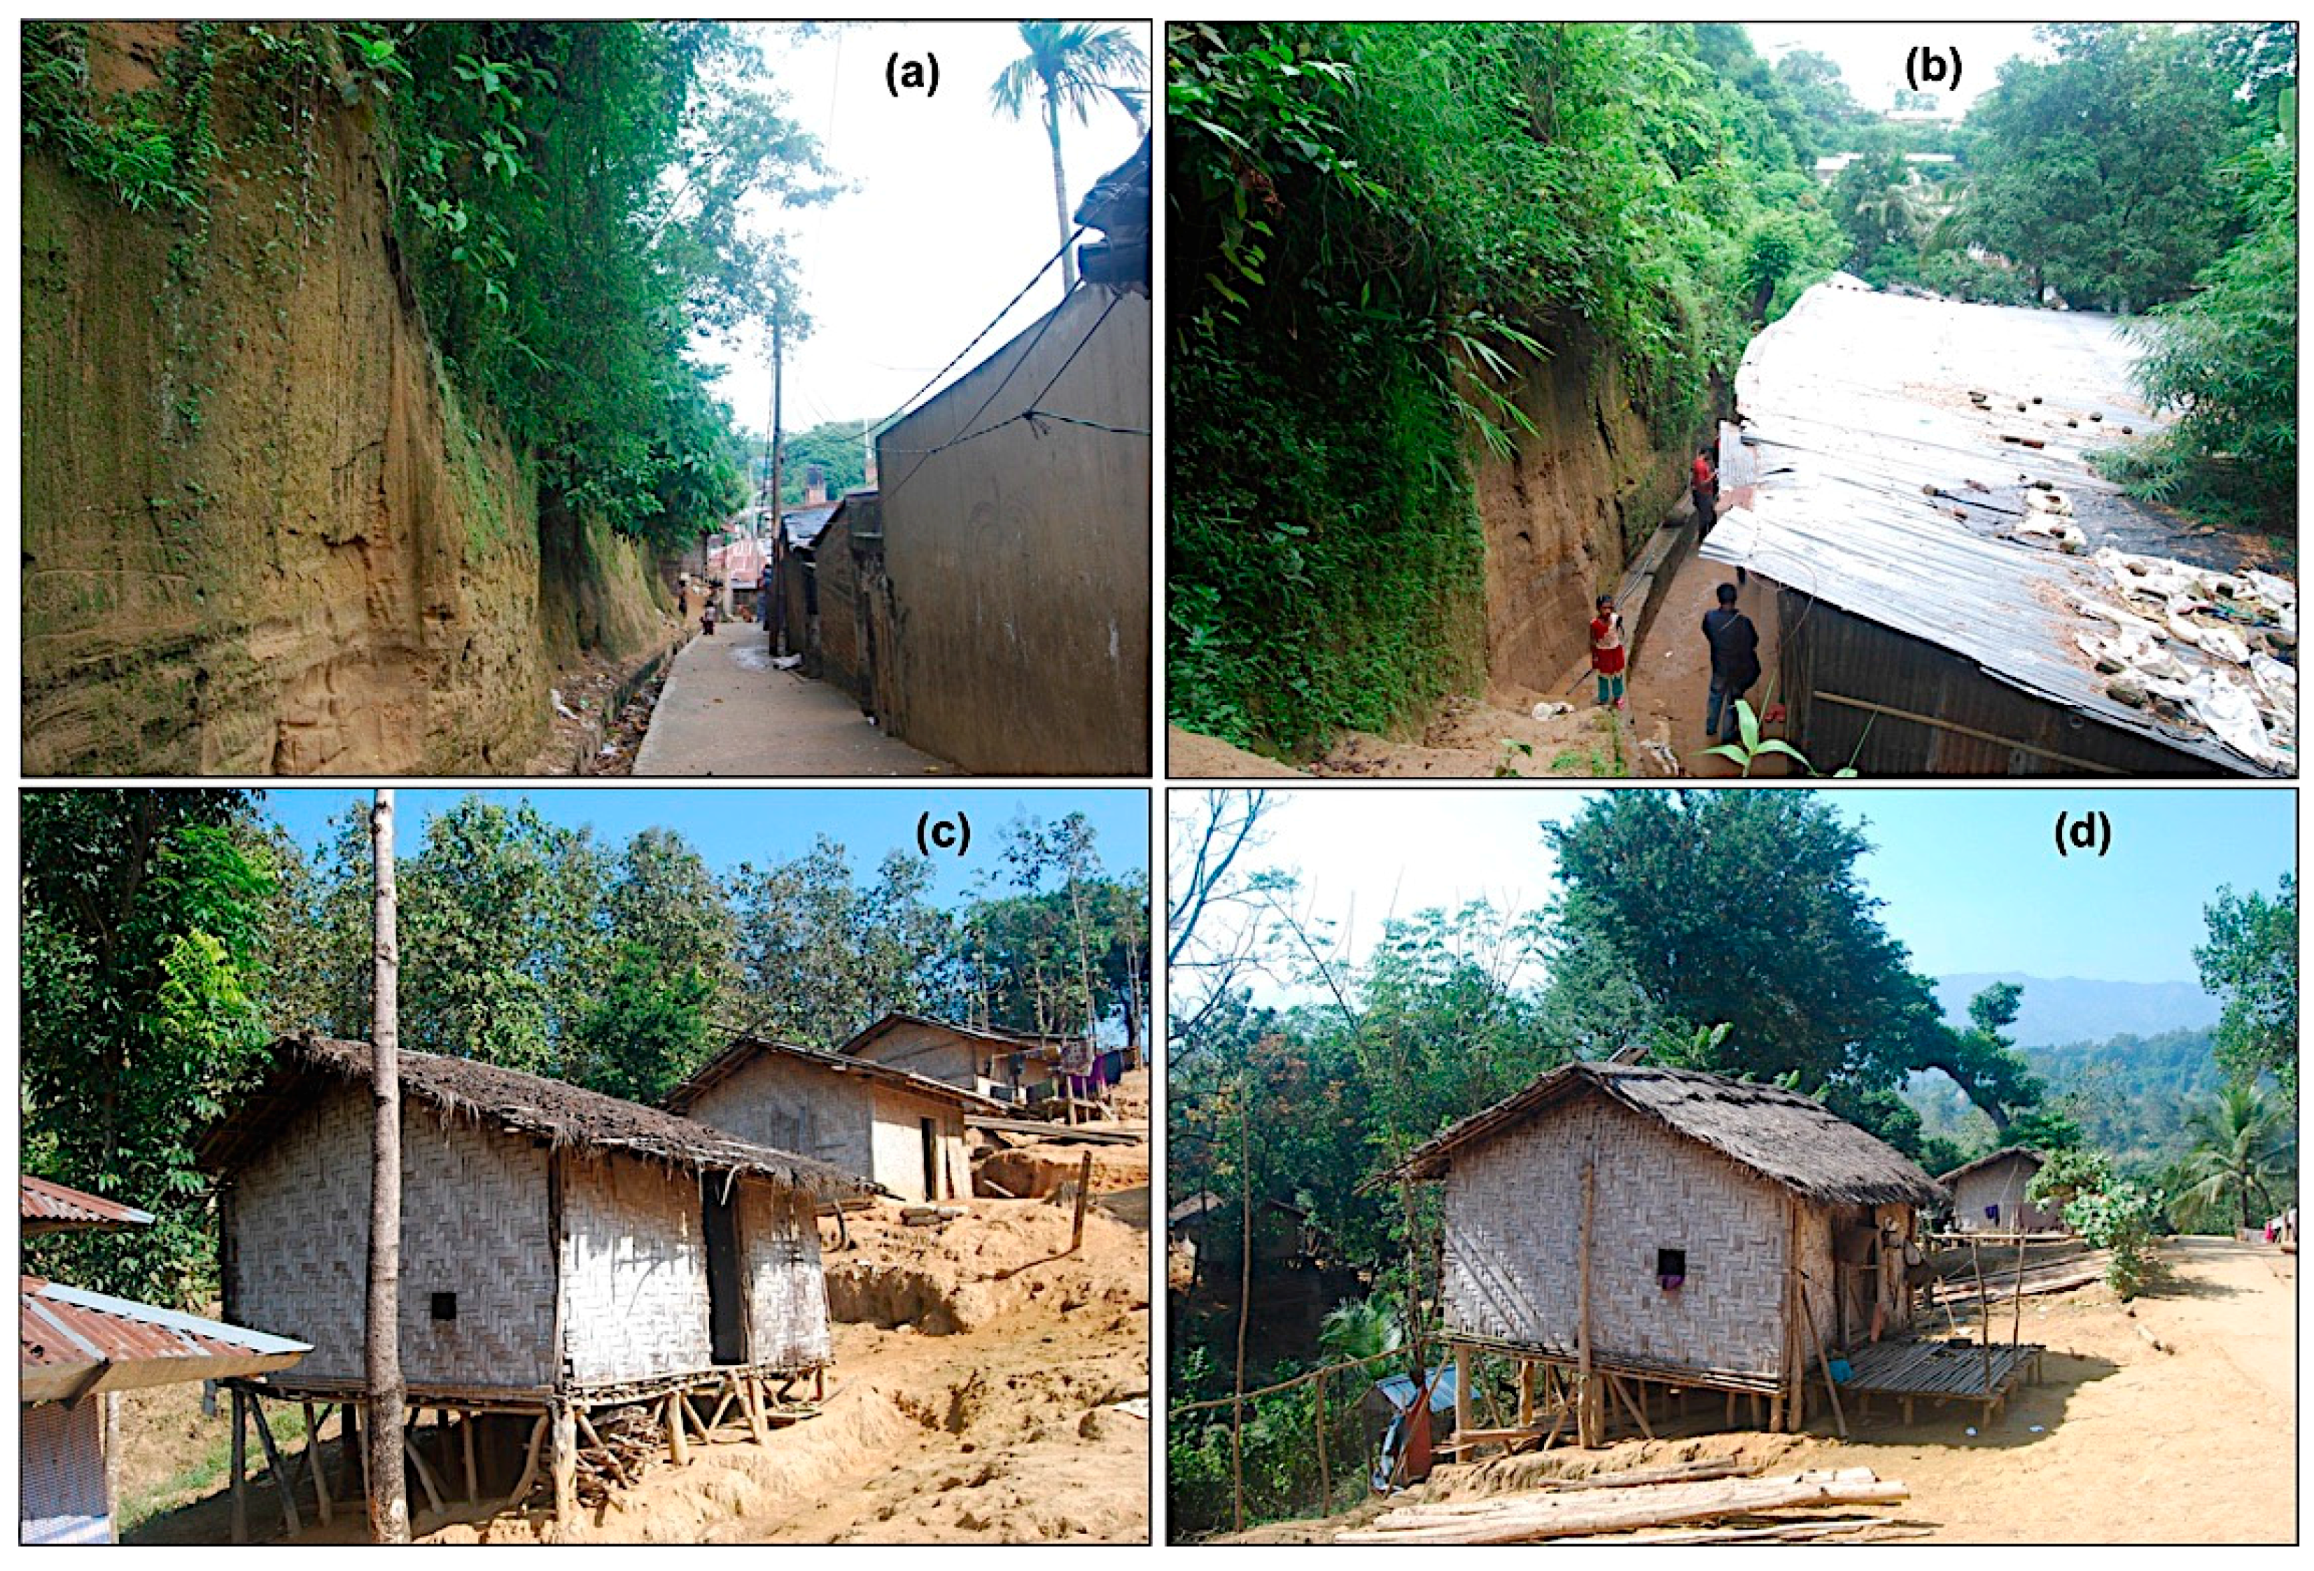
Incorporation of indigenous knowledge and cultural perceptions in reducing landslide risks can be an emergent tool. For example, in highly urbanized hilly areas in Chittagong district, local people cut the hills at 90° angles and develop residential houses using manufactured building materials including masonry (Figure 19a,b). On the other hand, the indigenous tribal communities, who have lived in the remote hills of Bangladesh for centuries, have their own style of building houses using local and non-manufactured materials such as wood, bamboo and sun grass. These houses have the provision to drain storm-water and tend to be physically more resilient to landsides (Figure 19c,d).
Based on empirical evidence and analyses conducted here, a conceptual framework for landslide disaster initiation has been developed (Figure 20). Tribal communities seem to be more resilient to landslides because they have the advantage of applying indigenous knowledge, despite being economically more vulnerable. Additionally, they have resided at their location for a long time, so they are aware of dangerous places which are not suitable for building, compared to new migrants who might not know about landslide dangers or who might be forced to live in dangerous locations. As noted above, the provision of services and the presence of institutions can give migrants a false sense of security in terms of assuming that the community would be safe to reside in, but they are instead being encouraged to settle in landslide-prone locations. This is a useful dimension of understanding vulnerability considering that amenable living conditions and supportive institutional arrangements are often helpful in reducing vulnerability to environmental hazards. The framework (Figure 20) suggests that incorporating indigenous knowledge and tackling external factors need to be pursued for reducing disaster risk.
In a nutshell, the influx of urban migrants, hill cutting for developing settlements, lack of cultural knowledge in dealing with hilly environments, socio-economic vulnerability and in some cases institutional detachment, are making the landslide hazard scenario worse in CCC. In this context, an effort should be made to focus on community level vulnerability assessment. Future research should focus on how the participatory rural appraisal maps (such as social and resource mapping, mobility and dream mapping, and transect map etc.) could be incorporated with the statistical LSMs for addressing landslide DRR in CCC and elsewhere.
5. Conclusions
In Bangladesh landslides are not yet considered a matter of serious concern, because flooding, cyclones and storm surges overshadow this hazard. The rate of urbanization is alarming in CCC due to extreme population density, rural-urban migration and scarcity of land for shelters. To meet growing needs, people are now cutting hills illegally for developing residential areas. Considering the threat of global warming, rapid urbanization, an increase in extreme precipitation events and population pressure, landslides are literally going to create catastrophic devastation in the upcoming years, particularly in the urban agglomerations. It is necessary to produce a scientifically valid landslide susceptibility map for CCC, a city of major socioeconomic significance in Bangladesh.
This study adopted the Dempster-Shafer WoE and multiple regression models for the construction of LSMs in CCC. Twelve environmental factors (i.e., slope, hill cut, geology, geomorphology, NDVI, soil moisture, rainfall pattern, and distance to buildings; stream, road and drainage network, and faults and lineaments) were selected based on their association with landslide occurrences. An inventory map with 53 historical landslide locations was prepared for model simulation and validation purposes. The performance of the models was validated using the ROC curves with AUC values. The overall success rates were found to be 87.3%, 90.9%, 91.3%, and 93.9% for the WoE, MR_All, MR_PCA, and MR_Fuzzy method, respectively. The LSM produced through the MR_Fuzzy method exhibited a statistically significant outcome. This study can support informed decision making by relevant entities for formulating policies related to landslide disaster risk reduction in Bangladesh.
Acknowledgments
Bayes Ahmed is a Commonwealth Scholar funded by the UK govt. The fieldwork in Chittagong City Corporation (CCC) was partially funded by the Institute for Risk and Disaster Reduction, University College London (UCL), UK. Special thanks go to Professor David Alexander, Ilan Kelman, Md. Ashraful Islam (DU Geology), research assistants from the Department of Urban and Regional Planning at Chittagong University of Engineering and Technology (CUET) and Bangladesh University of Engineering and Technology (BUET); the Bangladesh Meteorological Department, Department of Environment, Geological Survey of Bangladesh, Chittagong City Corporation and Chittagong Development Authority (CDA) officials; and particularly to the local people for their continuous support. The authors would like to thank the three anonymous reviewers and the editors of Remote Sensing journal for their constructive comments that facilitated to improve the quality of this manuscript.
Author Contributions
Bayes Ahmed has conducted the field surveying in Chittagong City Corporation, Bangladesh; collected necessary data; prepared the data layers, tables and figures; performed the analyses, formulated the results, and written the first draft of the manuscript. Ashraf Dewan has edited the manuscript, and contributed to the model development and verification.
Conflicts of Interest
The authors declare no conflict of interest.
Appendix A

Table A1.
Major landslide events in Chittagong district, Bangladesh.
| Date | Location | Rainfall Sequence | Consequences |
|---|---|---|---|
| 11 and 13 August 1999 | Different locations in Bandarban and Chittagong districts | 435 mm-12 days 2–13 August 1999 | 17 casualties, 350 houses damaged |
| 24 June 2000 | Chittagong University Campus, Chittagong | 108 mm-8 days 17–24 June 2000 | 13 casualties and 20 injuries |
| 5 May 2003 | Akhaura, Chittagong | 63 mm-2 days 3–4 May 2003 | 31 fatalities and many injuries |
| 29 June 2003 | Patiya, Chittagong | 658 mm-10 days 20–29 June 2003 | 4 human casualties |
| 3 August 2005 | Nizam Road Housing Society, Chittagong | 25 mm-2 days 2–3 August 2005 | 2 casualties and several injured |
| 31 October 2005 | Bayezid Bostami, Chittagong | 48 mm-5 days 21–25 October 2005 | 3 casualties and several injuries |
| 10 July 2006 | Satkania, Chittagong | 231 mm-6 days 4–9 July 2006 | 2 human casualties |
| 11 June 2007 | Different locations in Chittagong city | 610 mm-8 days 4–11 June 2007 | 128 casualties and 100 injured |
| 10 September 2007 | Nabi Nagar, Chittagong | 452 mm-7 days 4–10 September 2007 | 2 casualties |
| 18 August 2008 | Motijharna, Chittagong | 454 mm-11 days 8–18 August 2008 | 11 casualties and 25 injured |
| 1 July 2011 | Batali Hill, Chittagong | 200 mm-6 days 25–30 June 2011 | 19 casualties and many injured |
| 26 June 2012 | Lebubagan and Foy’s lake surroundings, Chittagong | 889 mm-8 days 19–26 June 2012 | 90 casualties and 150 injured |
| 28 July 2013 | Lalkhan Bazaar, Chittagong | 148 mm-2 days 26–27 July 2013 | 2 fatalities |
| 3 February 2014 | Shantinagar, Chittagong | No rainfall, landslide occurred because of hill cutting | 1 dead |
| 21 June 2014 | Pachlaish, Chittagong | 2 days continuous heavy rainfall | 1 dead and 2 injured |
| 23 June 2015 | DT Road Rail Gate, Chittagong | Wall collapse due to 2 days heavy rainfall | 2 dead |
| 19 July 2015 | Motijharna and Tankir Pahar, Chittagong | 205 mm-5 days 15–19 July 2015 | 6 dead |
Appendix B
Table B1.
Rainfall data for landslide occurrence in Chittagong district, Bangladesh.
| Date of the Landslide Event | Number of Days Prior to Landslides * | |||||||||
|---|---|---|---|---|---|---|---|---|---|---|
| −7 | −6 | −5 | −4 | −3 | −2 | −1 | 0 | +1 | +2 | |
| Daily Rainfall (mm) | ||||||||||
| 13/08/1999 | 29 | 5 | 9 | 28 | 86 | 0 | 123 | 110 | 206 | 57 |
| 24/06/2000 | 3 | 13 | 3 | 11 | 9 | 1 | 22 | 46 | 188 | 1 |
| 05/05/2003 | 0 | 17 | 0 | 0 | 0 | 8 | 55 | 0 | 1 | 0 |
| 29/06/2003 | 175 | 63 | 1 | 2 | 51 | 206 | 43 | 20 | 103 | 10 |
| 03/08/2005 | 7 | 1 | 0 | 5 | 0 | 0 | 22 | 3 | 12 | 33 |
| 31/10/2005 | 25 | 1 | 0 | 0 | 0 | 0 | 0 | 1 | 1 | 18 |
| 10/07/2006 | 0 | 30 | 30 | 7 | 19 | 84 | 61 | 38 | 24 | 21 |
| 11/06/2007 | 0 | 3 | 23 | 22 | 4 | 42 | 3 | 88 | 425 | 48 |
| 10/09/2007 | 0 | 0 | 7 | 35 | 84 | 160 | 40 | 50 | 76 | 0 |
| 18/08/2008 | 106 | 7 | 8 | 0 | 32 | 29 | 67 | 160 | 30 | 3 |
| 01/07/2011 | 0 | 24 | 17 | 50 | 14 | 32 | 62 | 101 | 101 | 67 |
| 26/06/2012 | 0 | 25 | 23 | 11 | 40 | 187 | 116 | 24 | 463 | 1 |
| 28/07/2013 | 3 | 0 | 0 | 0 | 0 | 35 | 113 | 54 | 47 | 2 |
Rainfall data source: Bangladesh Meteorological Department (BMD), 2014. * 0 refers to the day of the landslide event, +2 means two days after and −7 refers to seven days before the landslide event.
Table B2.
Rainfall threshold analysis for triggering landslides in Chittagong district, Bangladesh.
| Landslide Day * | Linear Regression Equation | R2 | Rainfall Threshold (mm) | Cumulative Rainfall (mm) |
|---|---|---|---|---|
| −7 | y = −2.91x + 42.80 | 0.028 | 42.80 | 42.80 |
| −6 | y = −0.604x + 18.76 | 0.017 | 18.76 | 61.56 |
| −5 | y = 0.945x + 2.629 | 0.122 | 2.629 | 64.19 |
| −4 | y = 0.593x + 9.00 | 0.020 | 9.00 | 73.19 |
| −3 | y = −1.044x + 33.38 | 0.017 | 33.38 | 106.57 |
| −2 | y = 5.862x + 19.26 | 0.092 | 19.26 | 125.83 |
| −1 | y = 3.016x + 34.80 | 0.082 | 34.80 | 160.63 |
| 0 | y = 3.071x + 31.96 | 0.060 | 31.96 | 192.59 |
| +1 | y = 6.340x + 84.61 | 0.025 | 84.61 | 277.2 |
| +2 | y = −0.653x + 24.65 | 0.011 | 24.65 | 301.85 |
* 0 represents the day of the landslide event, +2 means two days after and −7 refers to seven days before the landslide event.
Appendix C
Figure C1.
Fuzzy probability map of distance from (a) building; (b) drainage; and (c) fault and lineaments; and (d) geology by considering uncertainty.
Figure C1.
Fuzzy probability map of distance from (a) building; (b) drainage; and (c) fault and lineaments; and (d) geology by considering uncertainty.
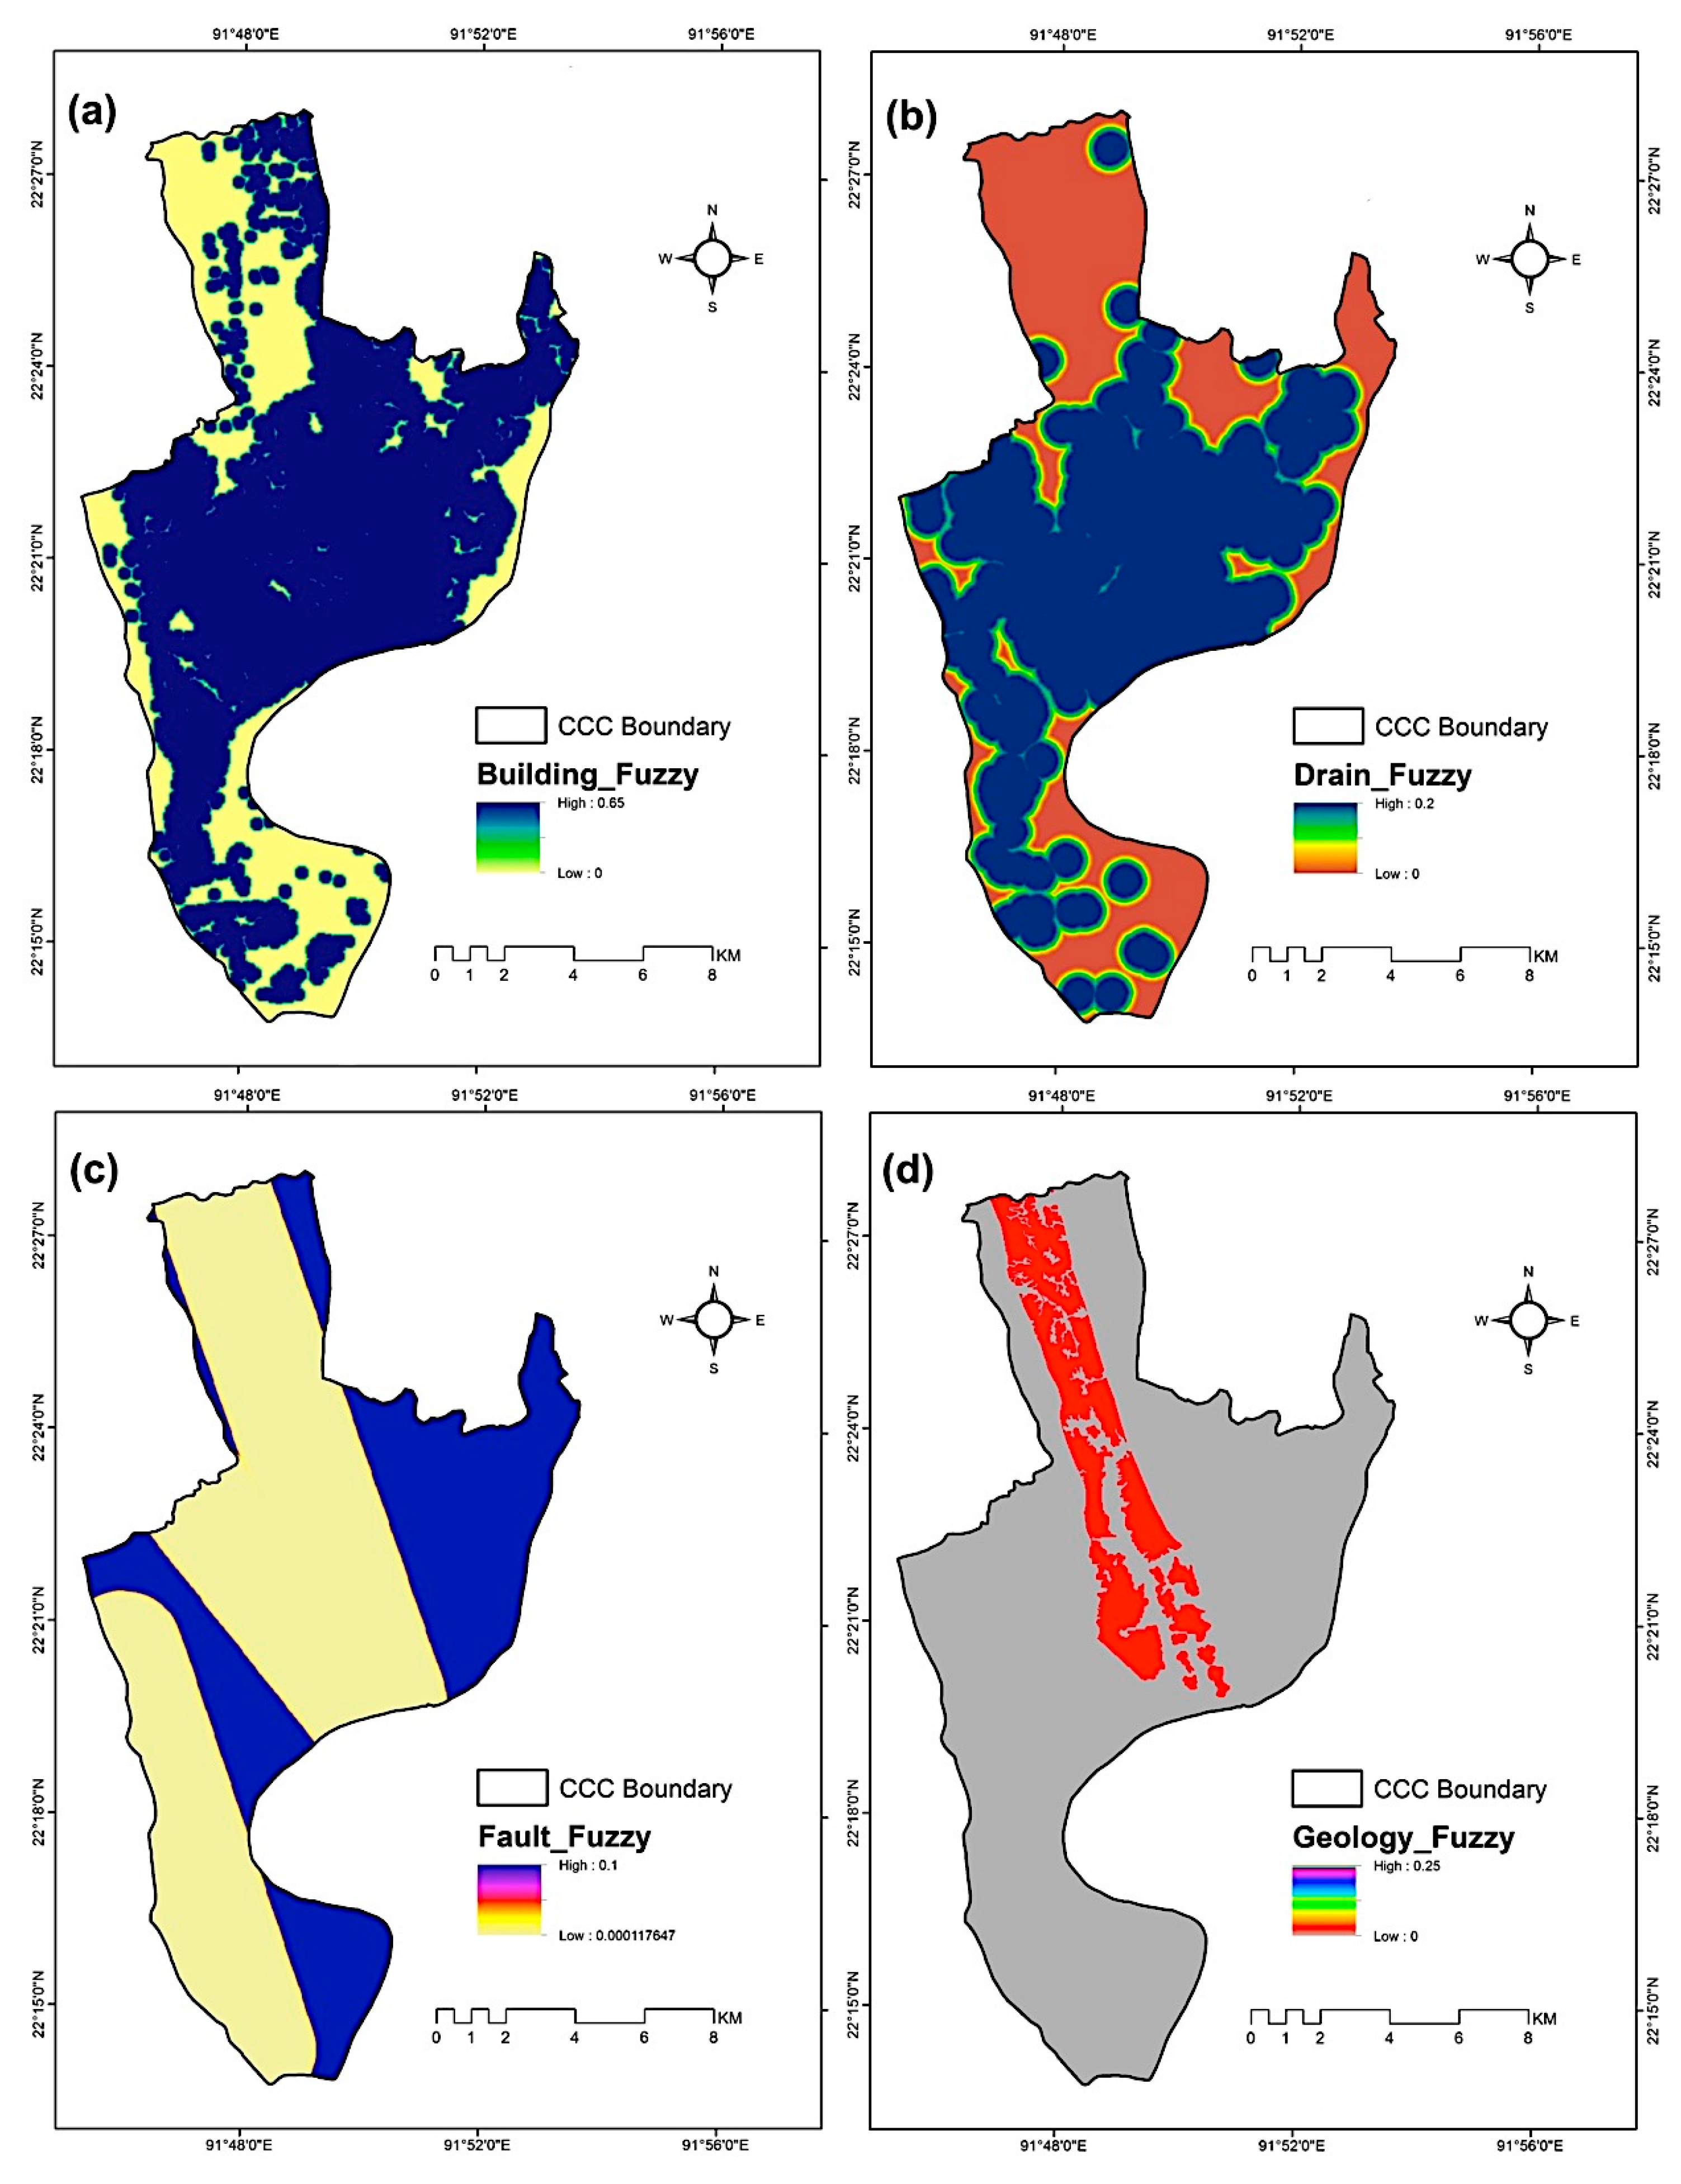
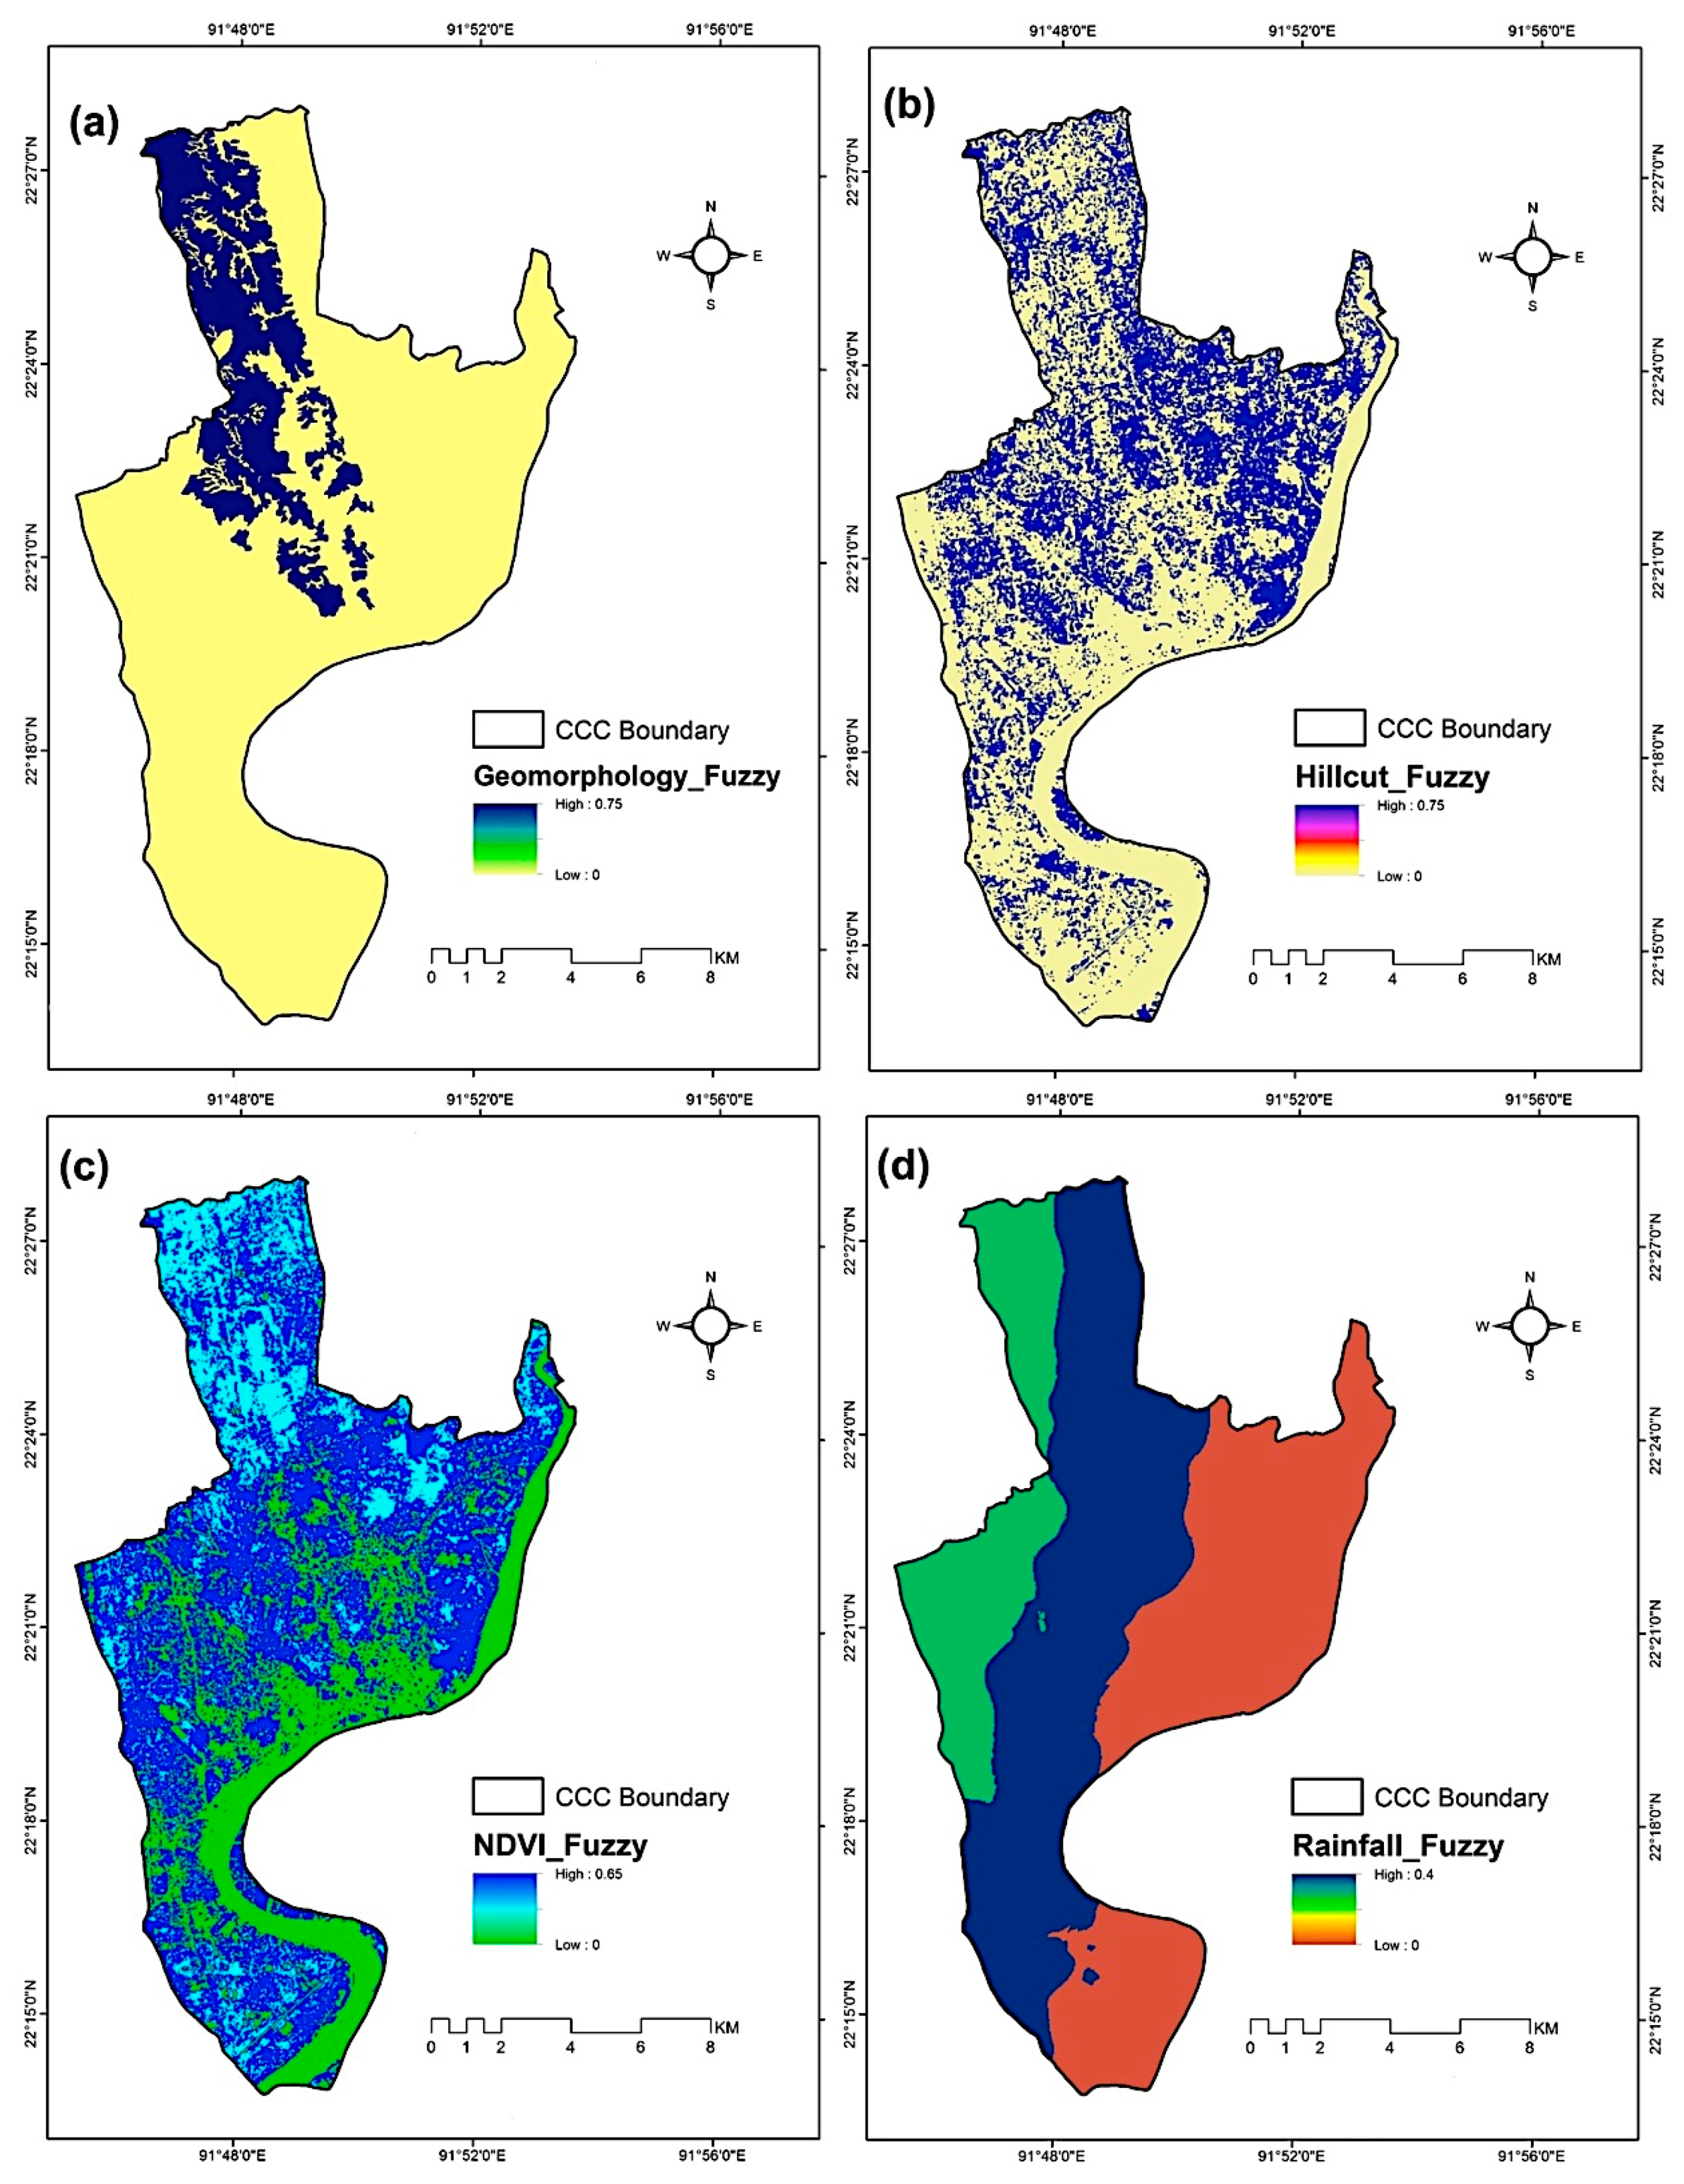
Figure C2.
Fuzzy probability map of distance from (a) geomorphology; (b) hill-cut; (c) NDVI; and (d) rainfall by considering uncertainty.
Figure C2.
Fuzzy probability map of distance from (a) geomorphology; (b) hill-cut; (c) NDVI; and (d) rainfall by considering uncertainty.

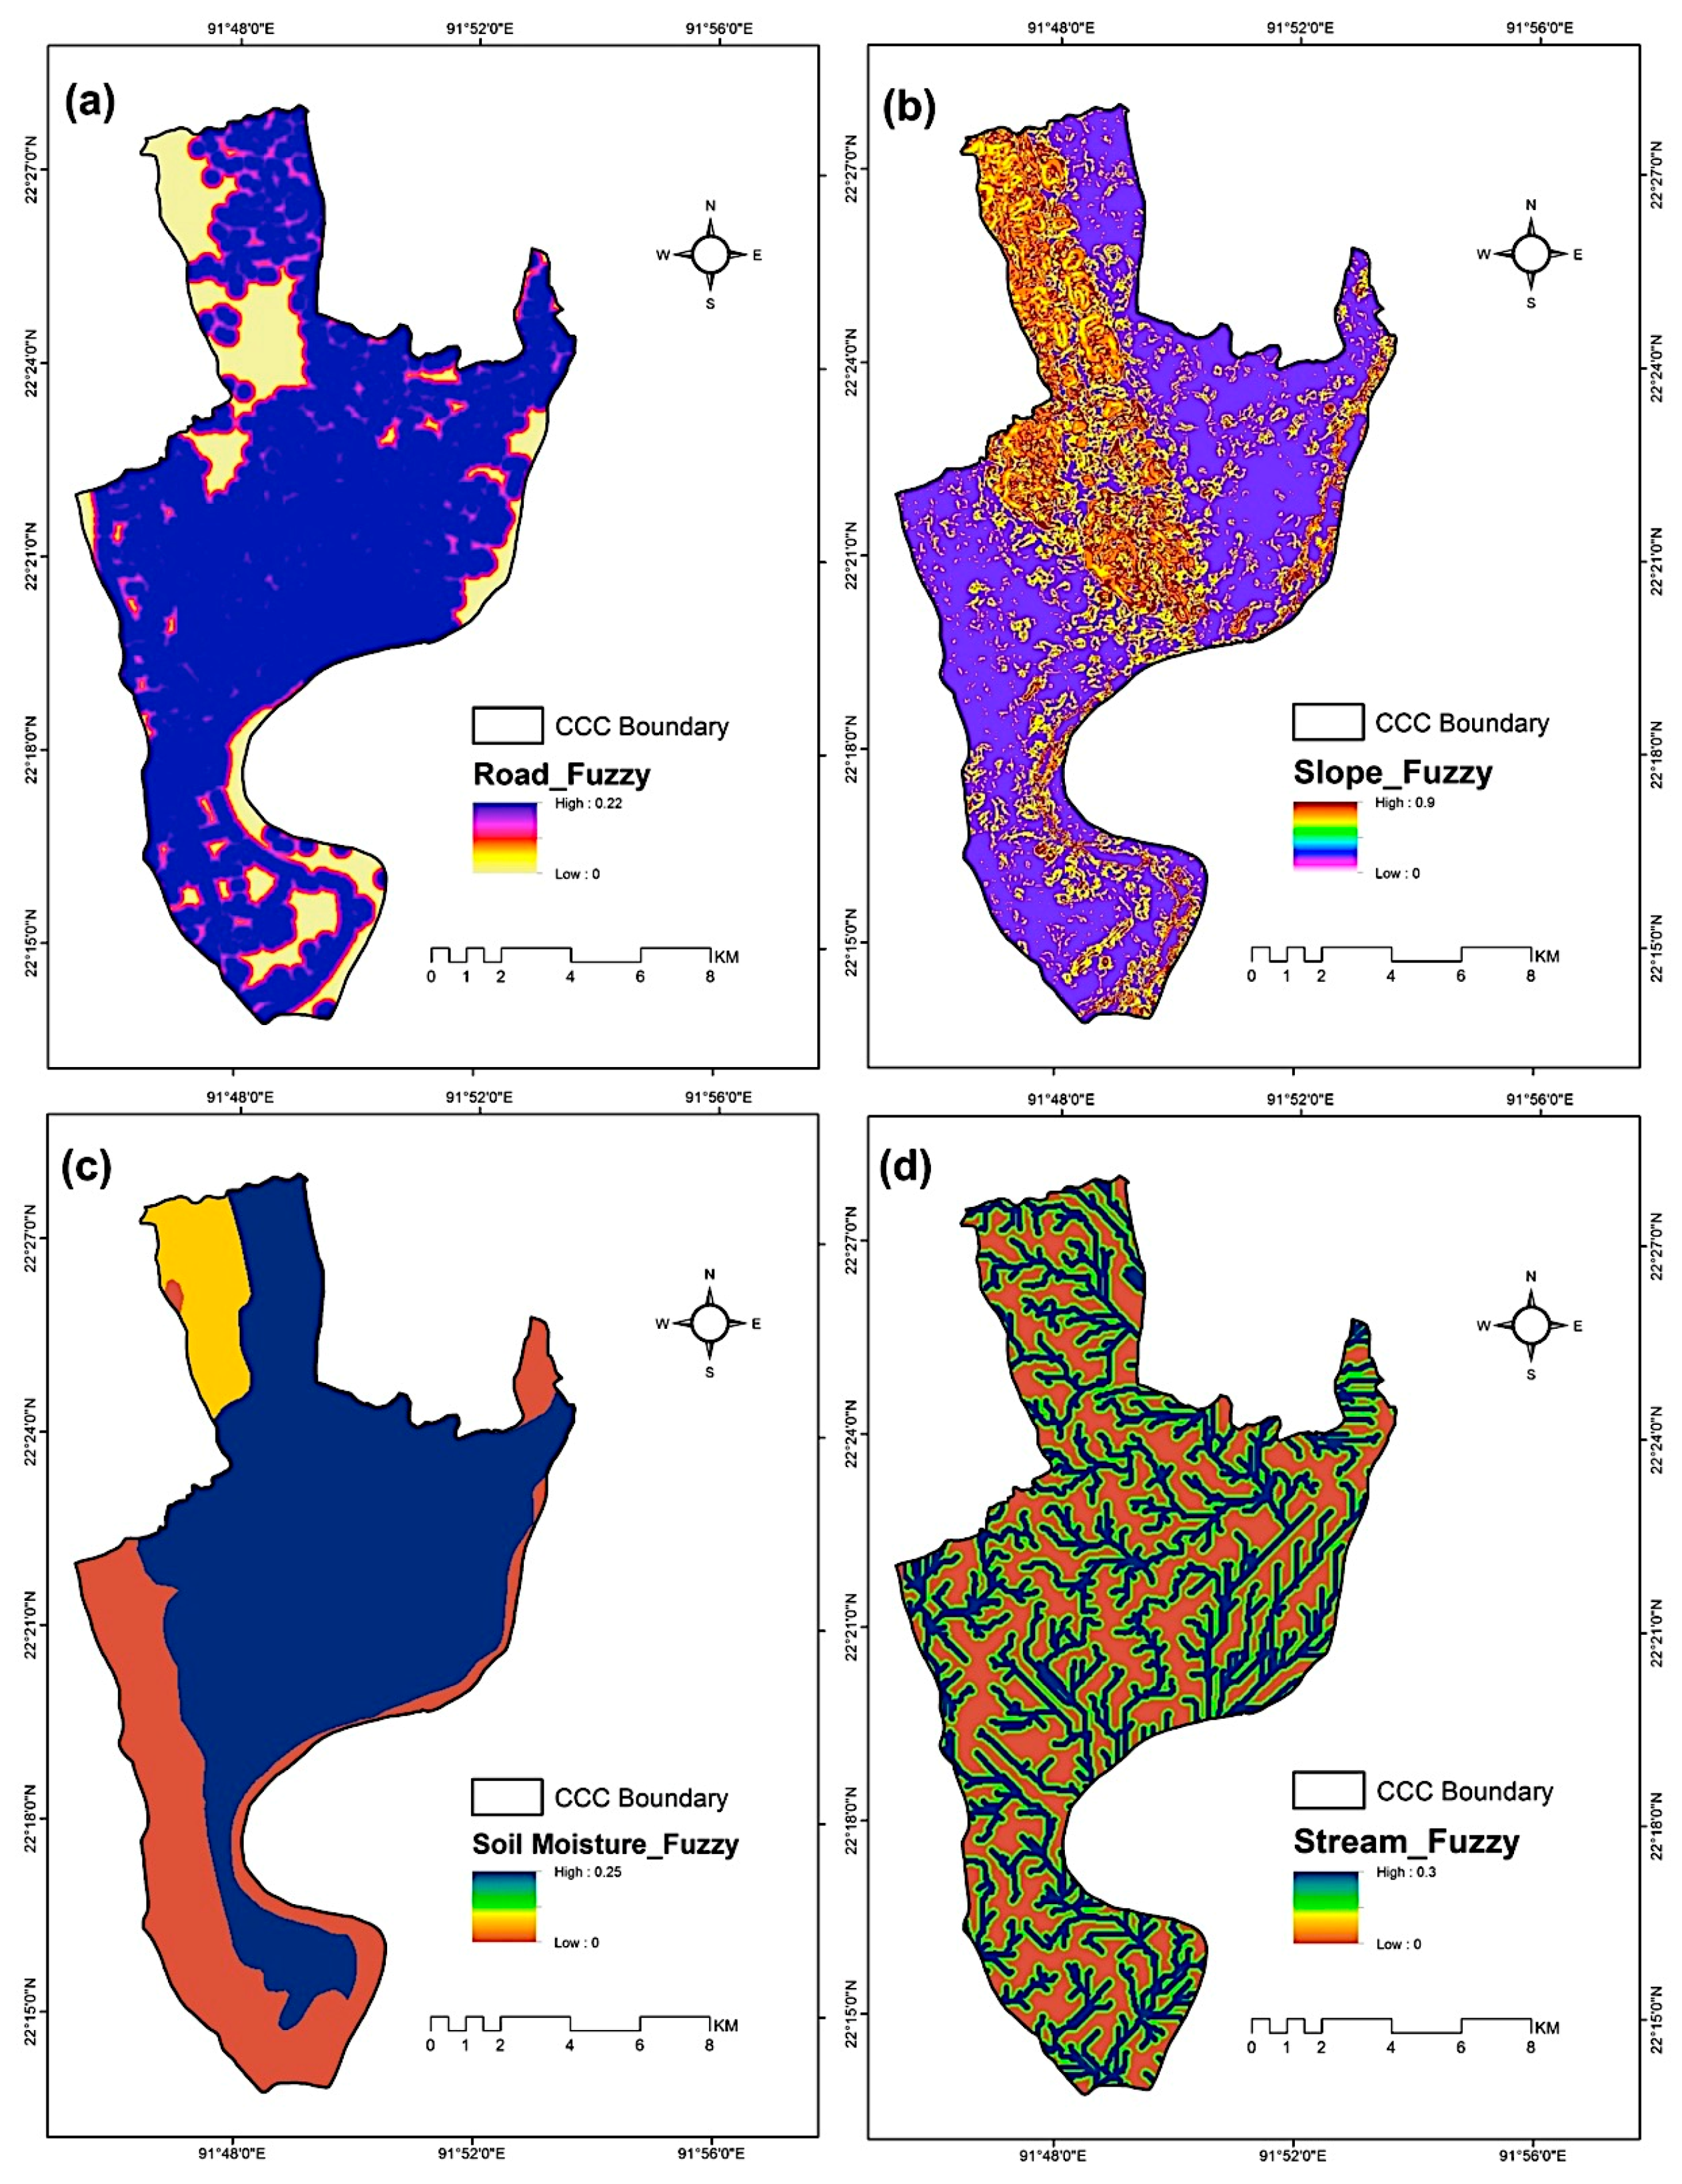
Figure C3.
Fuzzy probability map of distance from (a) roads; (b) slope; (c) soil moisture; and (d) distance to stream by considering uncertainty.
Figure C3.
Fuzzy probability map of distance from (a) roads; (b) slope; (c) soil moisture; and (d) distance to stream by considering uncertainty.
Appendix D
Figure D1.
The four principal components (a–d) derived from the landslide factor maps.

References
- Van Westen, C.J.; Alkema, D.; Damen, M.C.J.; Kerle, N.; Kingma, N.C. Multi-Hazard Risk Assessment: Distance Education Course, Guide Book; United Nations University—ITC School on Disaster Geo-Information Management: Enschede, The Netherlands, 2011. [Google Scholar]
- The International Federation of Red Cross and Red Crescent Societies (IFRC). World Disasters Report: Focus on Culture and Risk; IFRC: Geneva, Switzerland, 2014. [Google Scholar]
- Petley, D. Global patterns of loss of life from landslides. Geology 2012, 40, 927–930. [Google Scholar]
- ReliefWeb. Nepal: Floods and Landslides—July 2016. Available online: reliefweb.int/disaster/fl-2016-000068-npl (accessed on 19 November 2016).
- Lageson, D.R.; Fort, M.; Bhattarai, R.R.; Hubbard, M. Damage from the April–May 2015 Gorkha Earthquake Sequence in the Solukhumbu District (Everest Region), Nepal; GSA Annual Meeting: Denver, CO, USA, 2016. [Google Scholar]
- Witze, A. Afghan landslide was ‘An accident waiting to happen’. Nature 2014. [Google Scholar] [CrossRef]
- Ahmed, B. Landslide susceptibility mapping using multi-criteria evaluation techniques in Chittagong Metropolitan Area, Bangladesh. Landslides 2015, 12, 1077–1095. [Google Scholar] [CrossRef]
- Ahmed, B.; Rubel, Y.A. Understanding the Issues Involved in Urban Landslide Vulnerability in Chittagong Metropolitan Area, Bangladesh; Association of American Geographers (AAG): Washington, DC, USA, 2013. [Google Scholar]
- Comprehensive Disaster Management Programme-II. Landslide Inventory and Land-Use Mapping, DEM Preparation, Precipitation Threshold Value and Establishment of Early Warning Devices; Ministry of Food and Disaster Management, Disaster Management and Relief Division, Government of the People’s Republic of Bangladesh: Dhaka, Bangladesh, 2012.
- Khan, Y.A.; Lateh, H.; Baten, M.A.; Kamil, A.A. Critical antecedent rainfall conditions for shallow landslides in Chittagong City of Bangladesh. Environ. Earth Sci. 2012, 67, 97–106. [Google Scholar] [CrossRef]
- BUET-Japan Institute of Disaster Prevention and Urban Safety (BUET-JIDPUS). Developing a Dynamic Web-GIS based Early Warning System for the Communities Living with Landslide Risks in Chittagong Metropolitan Area, Bangladesh; Bangladesh University of Engineering and Technology (BUET): Dhaka, Bangladesh, 2015. [Google Scholar]
- Sarker, A.A.; Rashid, A.K.M.M. Landslide and Flashflood in Bangladesh. In Disaster Risk Reduction Approaches in Bangladesh; Shaw, R., Mallick, F., Islam, A., Eds.; Springer: Berlin/Heidelberg, Germany, 2013; pp. 165–189. [Google Scholar]
- Intergovernmental Panel on Climate Change. Climate Change 2014: Synthesis Report; Contribution of Working Groups I, II and III to the Fifth Assessment Report of the Intergovernmental Panel on Climate Change (IPCC); Intergovernmental Panel on Climate Change: Geneva, Switzerland, 2014. [Google Scholar]
- Steckler, M.S.; Mondal, D.R.; Akhter, S.H.; Seeber, L.; Feng, L.; Gale, J.; Hill, E.M.; Howe, M. Locked and loading megathrust linked to active subduction beneath the Indo-Burman Ranges. Nat. Geosci. 2016, 9, 615–618. [Google Scholar] [CrossRef]
- Cummins, P.R. The potential for giant tsunamigenic earthquakes in the northern Bay of Bengal. Nature 2007, 449, 75–78. [Google Scholar] [CrossRef] [PubMed]
- Islam, T.; Peterson, R.E. Climatology of landfalling tropical cyclones in Bangladesh 1877–2003. Nat. Hazards 2009, 48, 115–135. [Google Scholar] [CrossRef]
- Cruden, D.M.; Varnes, D.J. Landslide types and processes. In Landslides, Investigation and Mitigation, 1st ed.; Turner, A.K., Schuster, R.L., Eds.; Transportation Research Board: Washington, DC, USA, 1996; pp. 36–75. [Google Scholar]
- Couture, R. Landslide Terminology: National Technical Guidelines and Best Practices on Landslides; Geological Survey of Canada, Open File 6824; Natural Resources Canada: Ottawa, ON, Canada, 2011. [Google Scholar]
- Highland, L.M.; Bobrowsky, P. The Landslide Handbook—A Guide to Understanding Landslides; U.S. Geological Survey: Reston, VA, USA, 2008.
- Bathrellos, G.D.; Gaki-Papanastassiou, K.; Skilodimou, H.D.; Papanastassiou, D.; Chousianitis, K.G. Potential suitability for urban planning and industry development using natural hazard maps and geological–geomorphological parameters. Environ. Earth Sci. 2012, 66, 537–548. [Google Scholar] [CrossRef]
- Rozos, D.; Bathrellos, G.D.; Skillodimou, H.D. Comparison of the implementation of rock engineering system and analytic hierarchy process methods, upon landslide susceptibility mapping, using GIS: A case study from the Eastern Achaia County of Peloponnesus, Greece. Environ. Earth Sci. 2011, 63, 49–63. [Google Scholar] [CrossRef]
- Kavzoglu, T.; Sahin, E.K.; Colkesen, I. Landslide susceptibility mapping using GIS-based multi-criteria decision analysis, support vector machines, and logistic regression. Landslides 2014, 11, 425–439. [Google Scholar] [CrossRef]
- Papadopoulou-Vrynioti, K.; Bathrellos, G.D.; Skilodimou, H.D.; Kaviris, G.; Makropoulos, K. Karst collapse susceptibility mapping considering peak ground acceleration in a rapidly growing urban area. Eng. Geol. 2013, 158, 77–88. [Google Scholar] [CrossRef]
- Eastman, J.R. IDRISI Selva Tutorial; Clark University: Worcester, MA, USA, 2012. [Google Scholar]
- Kayastha, P.; Dhital, M.R.; de Smedt, F. Evaluation of the consistency of landslide susceptibility mapping: A case study from the Kankai watershed in east Nepal. Landslides 2013, 10, 785–799. [Google Scholar]
- Chauhan, S.; Sharma, M.; Arora, M.K.; Gupta, N.K. Landslide Susceptibility Zonation through ratings derived from Artificial Neural Network. Int. J. Appl. Earth Obs. Geoinf. 2010, 12, 340–350. [Google Scholar] [CrossRef]
- San, B.T. An evaluation of SVM using polygon-based random sampling in landslide susceptibility mapping: The Candir catchment area (western Antalya, Turkey). Int. J. Appl. Earth Obs. Geoinf. 2014, 26, 399–412. [Google Scholar] [CrossRef]
- Ahmed, B.; Forte, R. Landslide Risk Zoning Applying Kohonen’s Self-Organizing Map Neural Network Technique. In Proceedings of the 1st Bangladesh Planning Research Conference (BPRC), Dhaka, Bangladesh, 5–6 February 2016. [Google Scholar]
- Park, S.; Choi, C.; Kim, B.; Kim, J. Landslide susceptibility mapping using frequency ratio, analytic hierarchy process, logistic regression, and artificial neural network methods at the Inje area, Korea. Environ. Earth Sci. 2013, 68, 1443–1464. [Google Scholar] [CrossRef]
- Sabokbar, H.F.; Roodposhti, M.S.; Tazik, E. Landslide susceptibility mapping using geographically-weighted principal component analysis. Geomorphology 2014, 226, 15–24. [Google Scholar] [CrossRef]
- Pawluszek, K.; Borkowski, A. Impact of DEM-derived factors and analytical hierarchy process on landslide susceptibility mapping in the region of Rożnów Lake, Poland. Nat. Hazards 2017, 86, 919–952. [Google Scholar] [CrossRef]
- Carrara, A.; Guzzetti, F.; Cardinali, M.; Reichenbach, P. Use of GIS technology in the prediction and monitoring of landslide hazard. Nat. Hazards 1999, 20, 117–135. [Google Scholar] [CrossRef]
- Guzzetti, F.; Carrara, A.; Cardinali, M.; Reichenbach, P. Landslide hazard evaluation: A review of current techniques and their application in a multi-scale study, Central Italy. Geomorphology 1999, 3, 181–216. [Google Scholar] [CrossRef]
- Qiao, G.; Lu, P.; Scaioni, M.; Xu, S.; Tong, X.; Feng, T.; Wu, H.; Chen, W.; Tian, Y.; Wang, W.; et al. Landslide Investigation with Remote Sensing and Sensor Network: From Susceptibility Mapping and Scaled-down Simulation towards in situ Sensor Network Design. Remote Sens. 2013, 5, 4319–4346. [Google Scholar] [CrossRef]
- Scaioni, M.; Longoni, L.; Melillo, V.; Papini, M. Remote sensing for landslide investigations: An overview of recent achievements and perspectives. Remote Sens. 2014, 6, 9600–9652. [Google Scholar] [CrossRef]
- Bathrellos, G.D.; Skilodimou, H.D.; Chousianitis, K.; Youssef, A.M.; Pradhan, B. Suitability estimation for urban development using multi-hazard assessment map. Sci. Total Environ. 2017, 575, 119–134. [Google Scholar] [CrossRef] [PubMed]
- Chousianitis, K.; del Gaudio, V.; Sabatakakis, N.; Kavoura, K.; Drakatos, G.; Bathrellos, G.D.; Skilodimou, H.D. Assessment of earthquake-induced landslide hazard in Greece: From Arias intensity to spatial distribution of slope resistance demand. Bull. Seismol. Soc. Am. 2016, 106, 174–188. [Google Scholar] [CrossRef]
- Avalon Cullen, C.; Al-Suhili, R.; Khanbilvardi, R. Guidance index for shallow landslide hazard analysis. Remote Sens. 2016, 8, 866. [Google Scholar] [CrossRef]
- Plank, S.; Twele, A.; Martinis, S. Landslide mapping in vegetated areas using change detection based on Optical and Polarimetric SAR data. Remote Sens. 2016, 8, 307. [Google Scholar] [CrossRef]
- Chen, Z.; Zhang, B.; Han, Y.; Zuo, Z.; Zhang, X. Modeling accumulated volume of landslides using remote sensing and DTM data. Remote Sens. 2014, 6, 1514–1537. [Google Scholar] [CrossRef]
- Tofani, V.; del Ventisette, C.; Moretti, S.; Casagli, N. Integration of remote sensing techniques for intensity zonation within a landslide area: A case study in the Northern Apennines, Italy. Remote Sens. 2014, 6, 907–924. [Google Scholar] [CrossRef]
- Bangladesh Bureau of Statistics (BBS). Bangladesh Population and Housing Census 2011; National Report, Volume 3, Urban Area Report; Statistics and Informatics Division, Ministry of Planning, Government of the People’s Republic of Bangladesh: Dhaka, Bangladesh, 2014.
- Brammer, H. The Physical Geography of Bangladesh, 1st ed.; The University Press Limited: Dhaka, Bangladesh, 2012. [Google Scholar]
- Muminullah, M. Geology of the Northern Part of Chittagong District, Bangladesh; Government of the People’s Republic of Bangladesh, Geological Survey of Bangladesh: Dhaka, Bangladesh, 1978; Volume 2.
- Karim, M.F.; Kamal, A.S.M.M.; Hassan, M.Q.; Khadiza, U.; Serajee, F.; Rahman, M.Z.; Siddiqua, S. Geological engineering evaluation of landslides in the Southeastern Bangladesh. In Proceedings of the 2015 GSA Annual Meeting, Baltimore, MD, USA, 1–4 November 2015. [Google Scholar]
- Comprehensive Disaster Management Programme (CDMP). Engineering Geological Mapping of Dhaka, Chittagong and Sylhet City Corporation Area of Bangladesh; Ministry of Food and Disaster Management, Government of the People’s Republic of Bangladesh: Dhaka, Bangladesh, 2009.
- Baqul, M.A. Geological Structure; Banglapedia—The National Encyclopedia of Bangladesh; The Asiatic Society of Bangladesh: Dhaka, Bangladesh, 2015. [Google Scholar]
- Guha, D.K. Tectonic Framework; Banglapedia—The National Encyclopedia of Bangladesh; The Asiatic Society of Bangladesh: Dhaka, Bangladesh, 2015. [Google Scholar]
- Chowdhury, S.Q. Chittagong Hill Tracts; Banglapedia—The National Encyclopedia of Bangladesh; The Asiatic Society of Bangladesh: Dhaka, Bangladesh, 2015. [Google Scholar]
- Brammer, H. Reconnaissance Soil and Land Use Survey: Chittagong Hill Tracts (1964–1965); Soil Resources Development Institute, Ministry of Agriculture, Government of the People’s Republic of Bangladesh: Dhaka, Bangladesh, 1986.
- Food and Agriculture Organization (FAO). Soil: Soil Consistency (Chapter 8). Simple Methods for Aquaculture. Manuals Form the FAO Training Series. 2003. Available online: ftp://ftp.fao.org/fi/cdrom/fao_training/FAO_Training/General/x6706e/x6706e08.htm#top (accessed on 14 February 2017).
- Cruden, D.; VanDine, D.F. Classification, Description, Causes and Indirect Effects—Canadian Technical Guidelines and Best Practices Related to Landslides: A National Initiative for Loss Reduction; Geological Survey of Canada, Open File 7359; Natural Resources Canada: Ottawa, ON, Canada, 2013. [Google Scholar]
- Zhang, X.; Yang, F. RClimDex (1.0): User Manual; Climate Research Branch, Environment Canada: Ottawa, ON, Canada, 2004. [Google Scholar]
- Ahmed, B.; Ahmed, R. Modeling urban land cover growth dynamics using multi-temporal satellite images: A case study of Dhaka, Bangladesh. ISPRS Int. J. Geo-Inf. 2012, 1, 3–31. [Google Scholar] [CrossRef]
- Ahmed, B.; Ahmed, R.; Zhu, X. Evaluation of model validation techniques in land cover dynamics. ISPRS Int. J. Geo-Inf. 2013, 2, 577–597. [Google Scholar] [CrossRef]
- Rahman, M.S.; Ahmed, B.; Huq, F.F.; Rahman, S.; Al-Hussaini, T.M. Landslide inventory in an urban setting in the context of Chittagong Metropolitan Area, Bangladesh. In Proceedings of the 3rd International Conference on Advances in Civil Engineering 2016 (ICACE 2016), Cox’s Bazar, Bangladesh, 21–23 December 2016. [Google Scholar]
- Dempster, A.P. A generalization of Bayesian inference. J. R. Stat. Soc. 1967, 30, 205–247. [Google Scholar]
- Shafer, G. A Mathematical Theory of Evidence; Princeton University Press: Princeton, NJ, USA, 1976. [Google Scholar]
- Mohammady, M.; Pourghasemi, H.R.; Pradhan, B. Landslide susceptibility mapping at Golestan Province, Iran: A comparison between frequency ratio, Dempster–Shafer, and weights-of-evidence models. J. Asian Earth Sci. 2012, 61, 221–236. [Google Scholar] [CrossRef]
- Tangestani, M.H. A comparative study of Dempster–Shafer and fuzzy models for landslide susceptibility mapping using a GIS: An experience from Zagros Mountains, SW Iran. J. Asian Earth Sci. 2009, 35, 66–73. [Google Scholar] [CrossRef]
- Agresti, A. An Introduction to Categorical Data Analysis, 2nd ed.; John Wiley & Sons: Hoboken, NJ, USA, 2007. [Google Scholar]
- Van Westen, C.J.; Rengers, N.; Soeters, R. Use of geomorphological information in indirect landslide susceptibility assessment. Nat. Hazards 2003, 30, 399–419. [Google Scholar] [CrossRef]
- Wisner, B.; Blaikie, P.; Cannon, T.; Davis, I. At Risk: Natural Hazards, People's Vulnerability and Disasters, 2nd ed.; Routledge: Oxon, UK, 2004. [Google Scholar]
- Lewis, J. Development in Disaster-Prone Places: Studies in Vulnerability, 1st ed.; IT Publications: London, UK, 1999. [Google Scholar]
- O’Keefe, P.; Westgate, K.; Wisner, B. Taking naturalness out of natural disasters. Nature 1976, 260, 566–567. [Google Scholar] [CrossRef]
- Alexander, D.E. A brief survey of GIS in mass-movement studies, with reflections on theory and methods. Geomorphology 2008, 94, 261–267. [Google Scholar] [CrossRef]
Figure 1.
Landslides in the Lalkhan Bazaar area, Chittagong City Corporation (CCC), Bangladesh. (a) Location of vulnerable houses; (b) landslide scar; (c) landslide deposit; and (d) destroyed houses. Source: Fieldwork, July 2015.
Figure 1.
Landslides in the Lalkhan Bazaar area, Chittagong City Corporation (CCC), Bangladesh. (a) Location of vulnerable houses; (b) landslide scar; (c) landslide deposit; and (d) destroyed houses. Source: Fieldwork, July 2015.
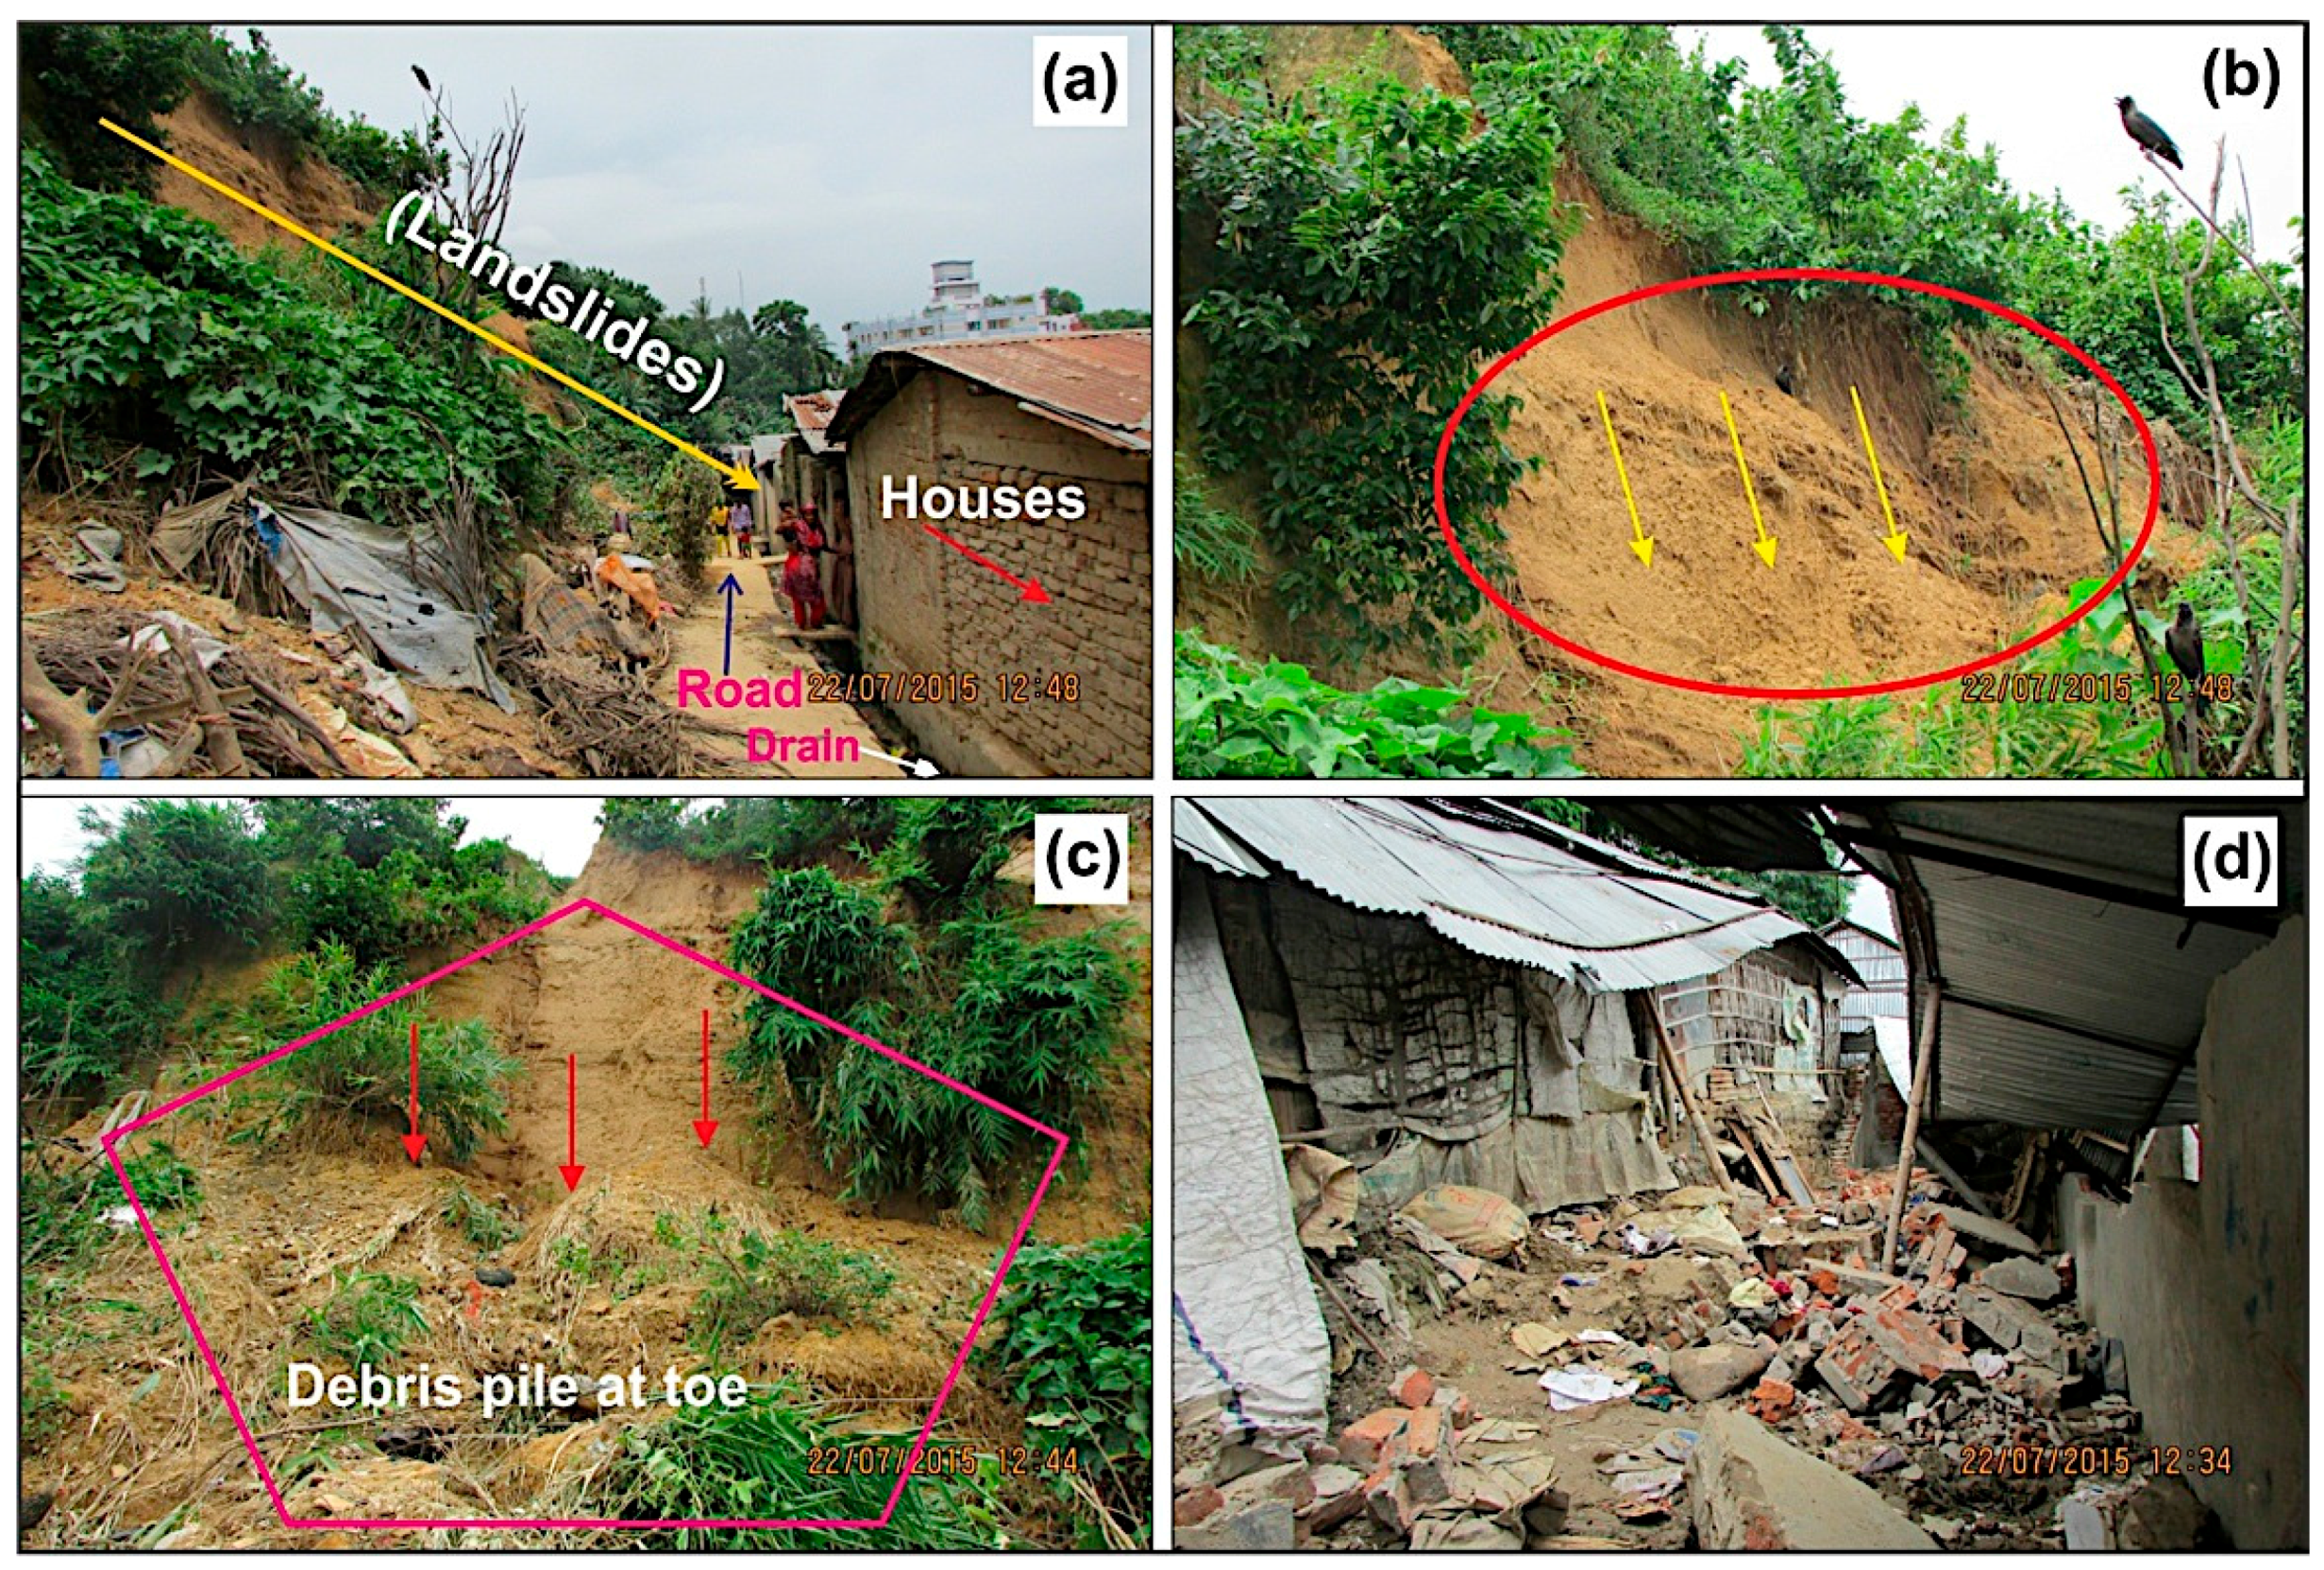
Figure 2.
Location of (a) Chittagong district and CCC with respect to Bangladesh; and (b) location of Chittagong City Corporation (CCC).
Figure 2.
Location of (a) Chittagong district and CCC with respect to Bangladesh; and (b) location of Chittagong City Corporation (CCC).

Figure 3.
(a) Elevation; and (b) geological map of CCC.
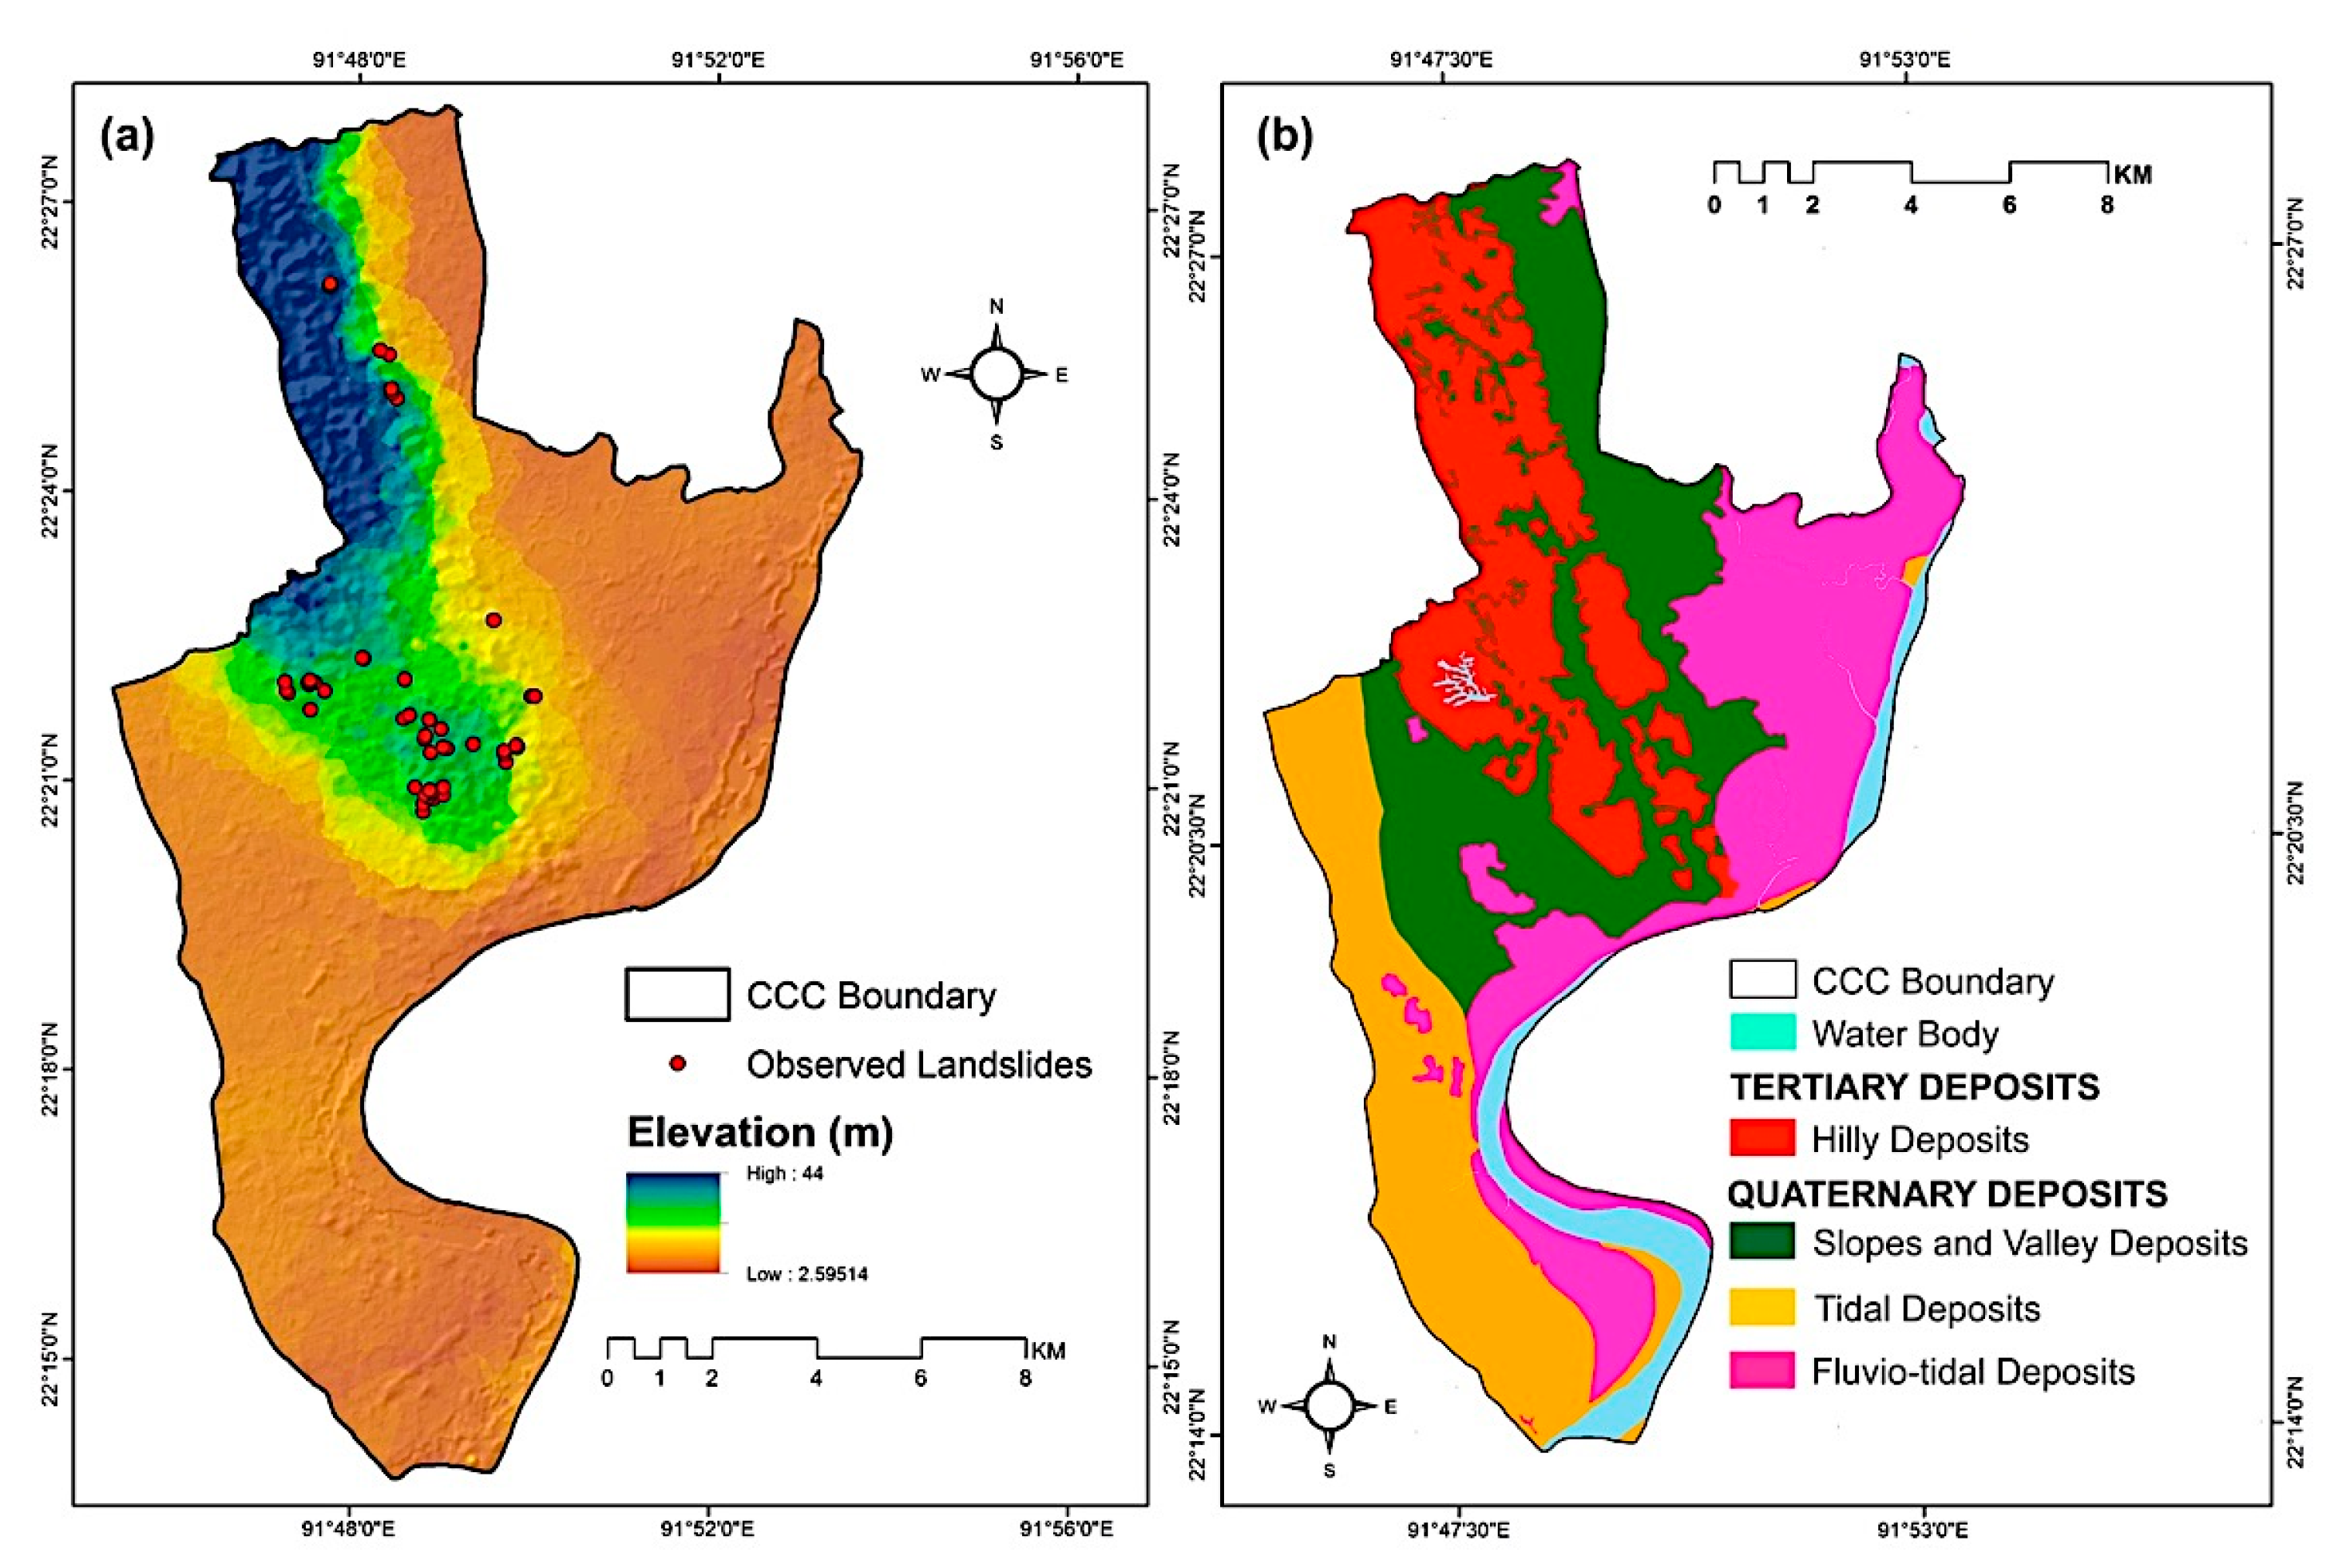
Figure 4.
(a) Mode of landslide movement; (b) different states of activity; (c) distributions of activity; and (d) styles of activity in CCC. Source: Fieldwork, July–August 2014 [11,17].
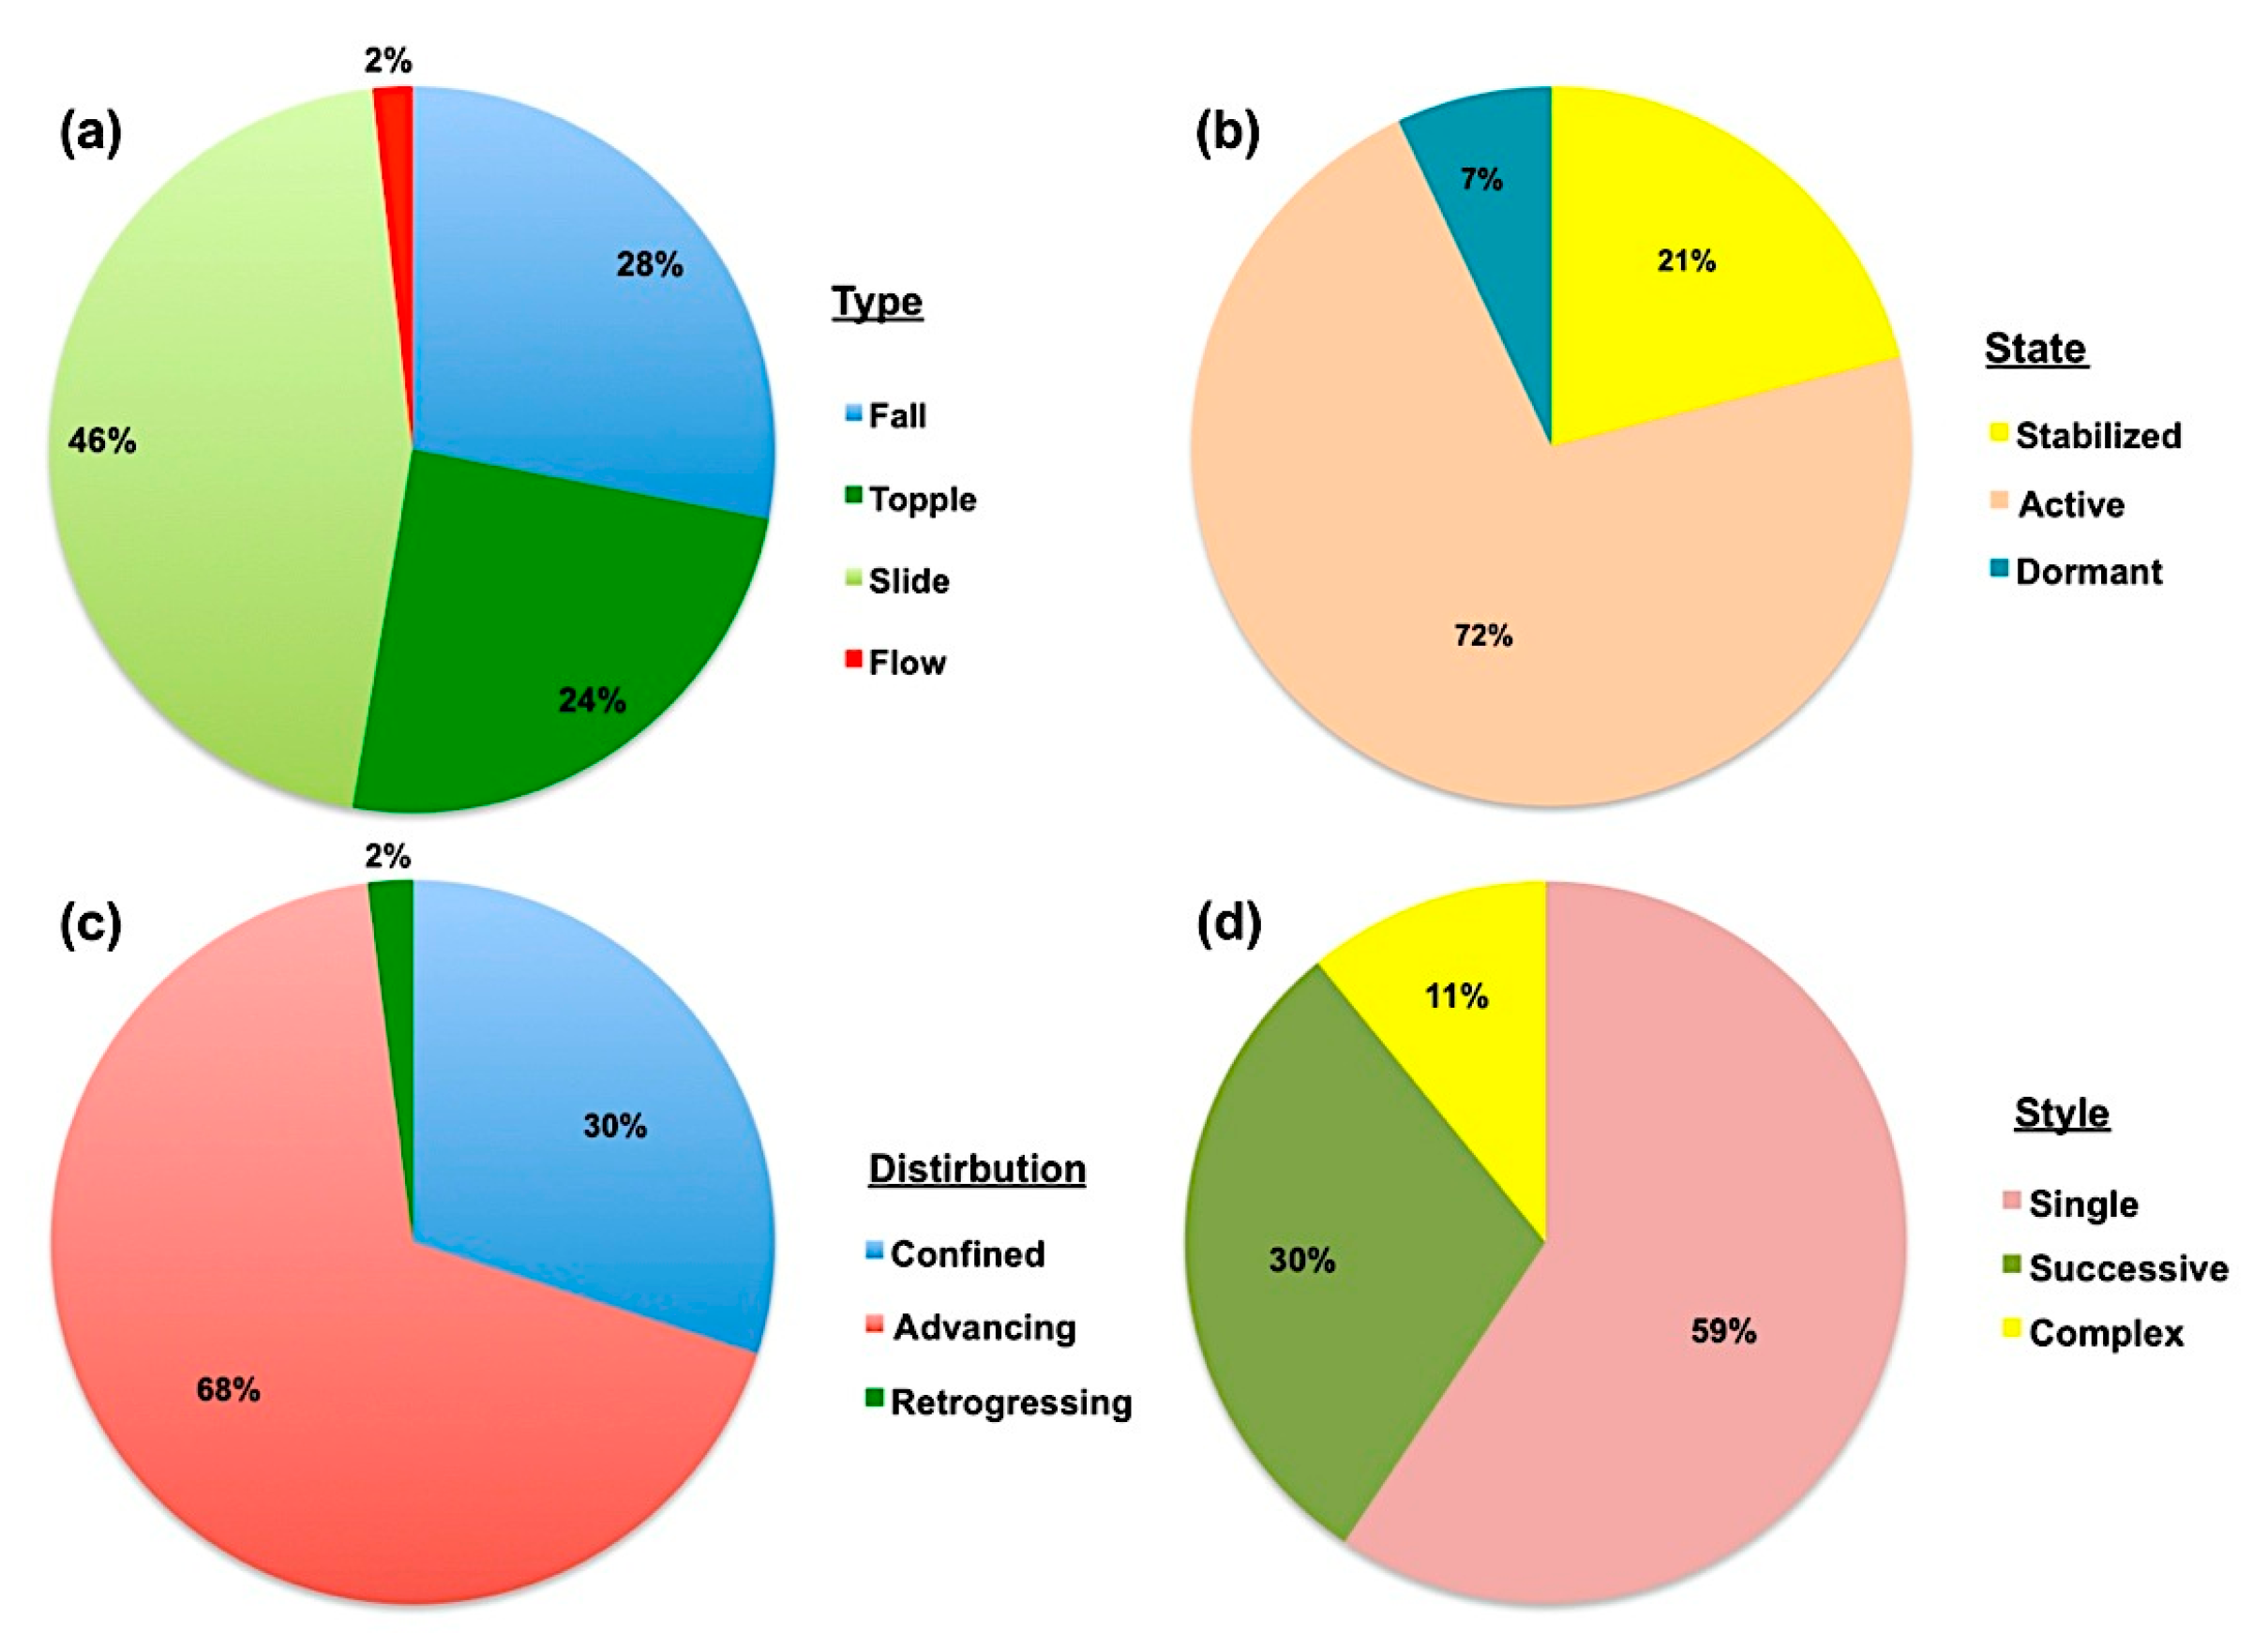
Figure 5.
Rainfall threshold determination for landslide occurrences in CCC.

Figure 6.
Land cover map of CCC in (a) 1990; (b) 2000; (c) 2010; and in (d) 2015.

Figure 7.
(a) Major land cover; and (b) built-up area changes in CCC (1990–2015).
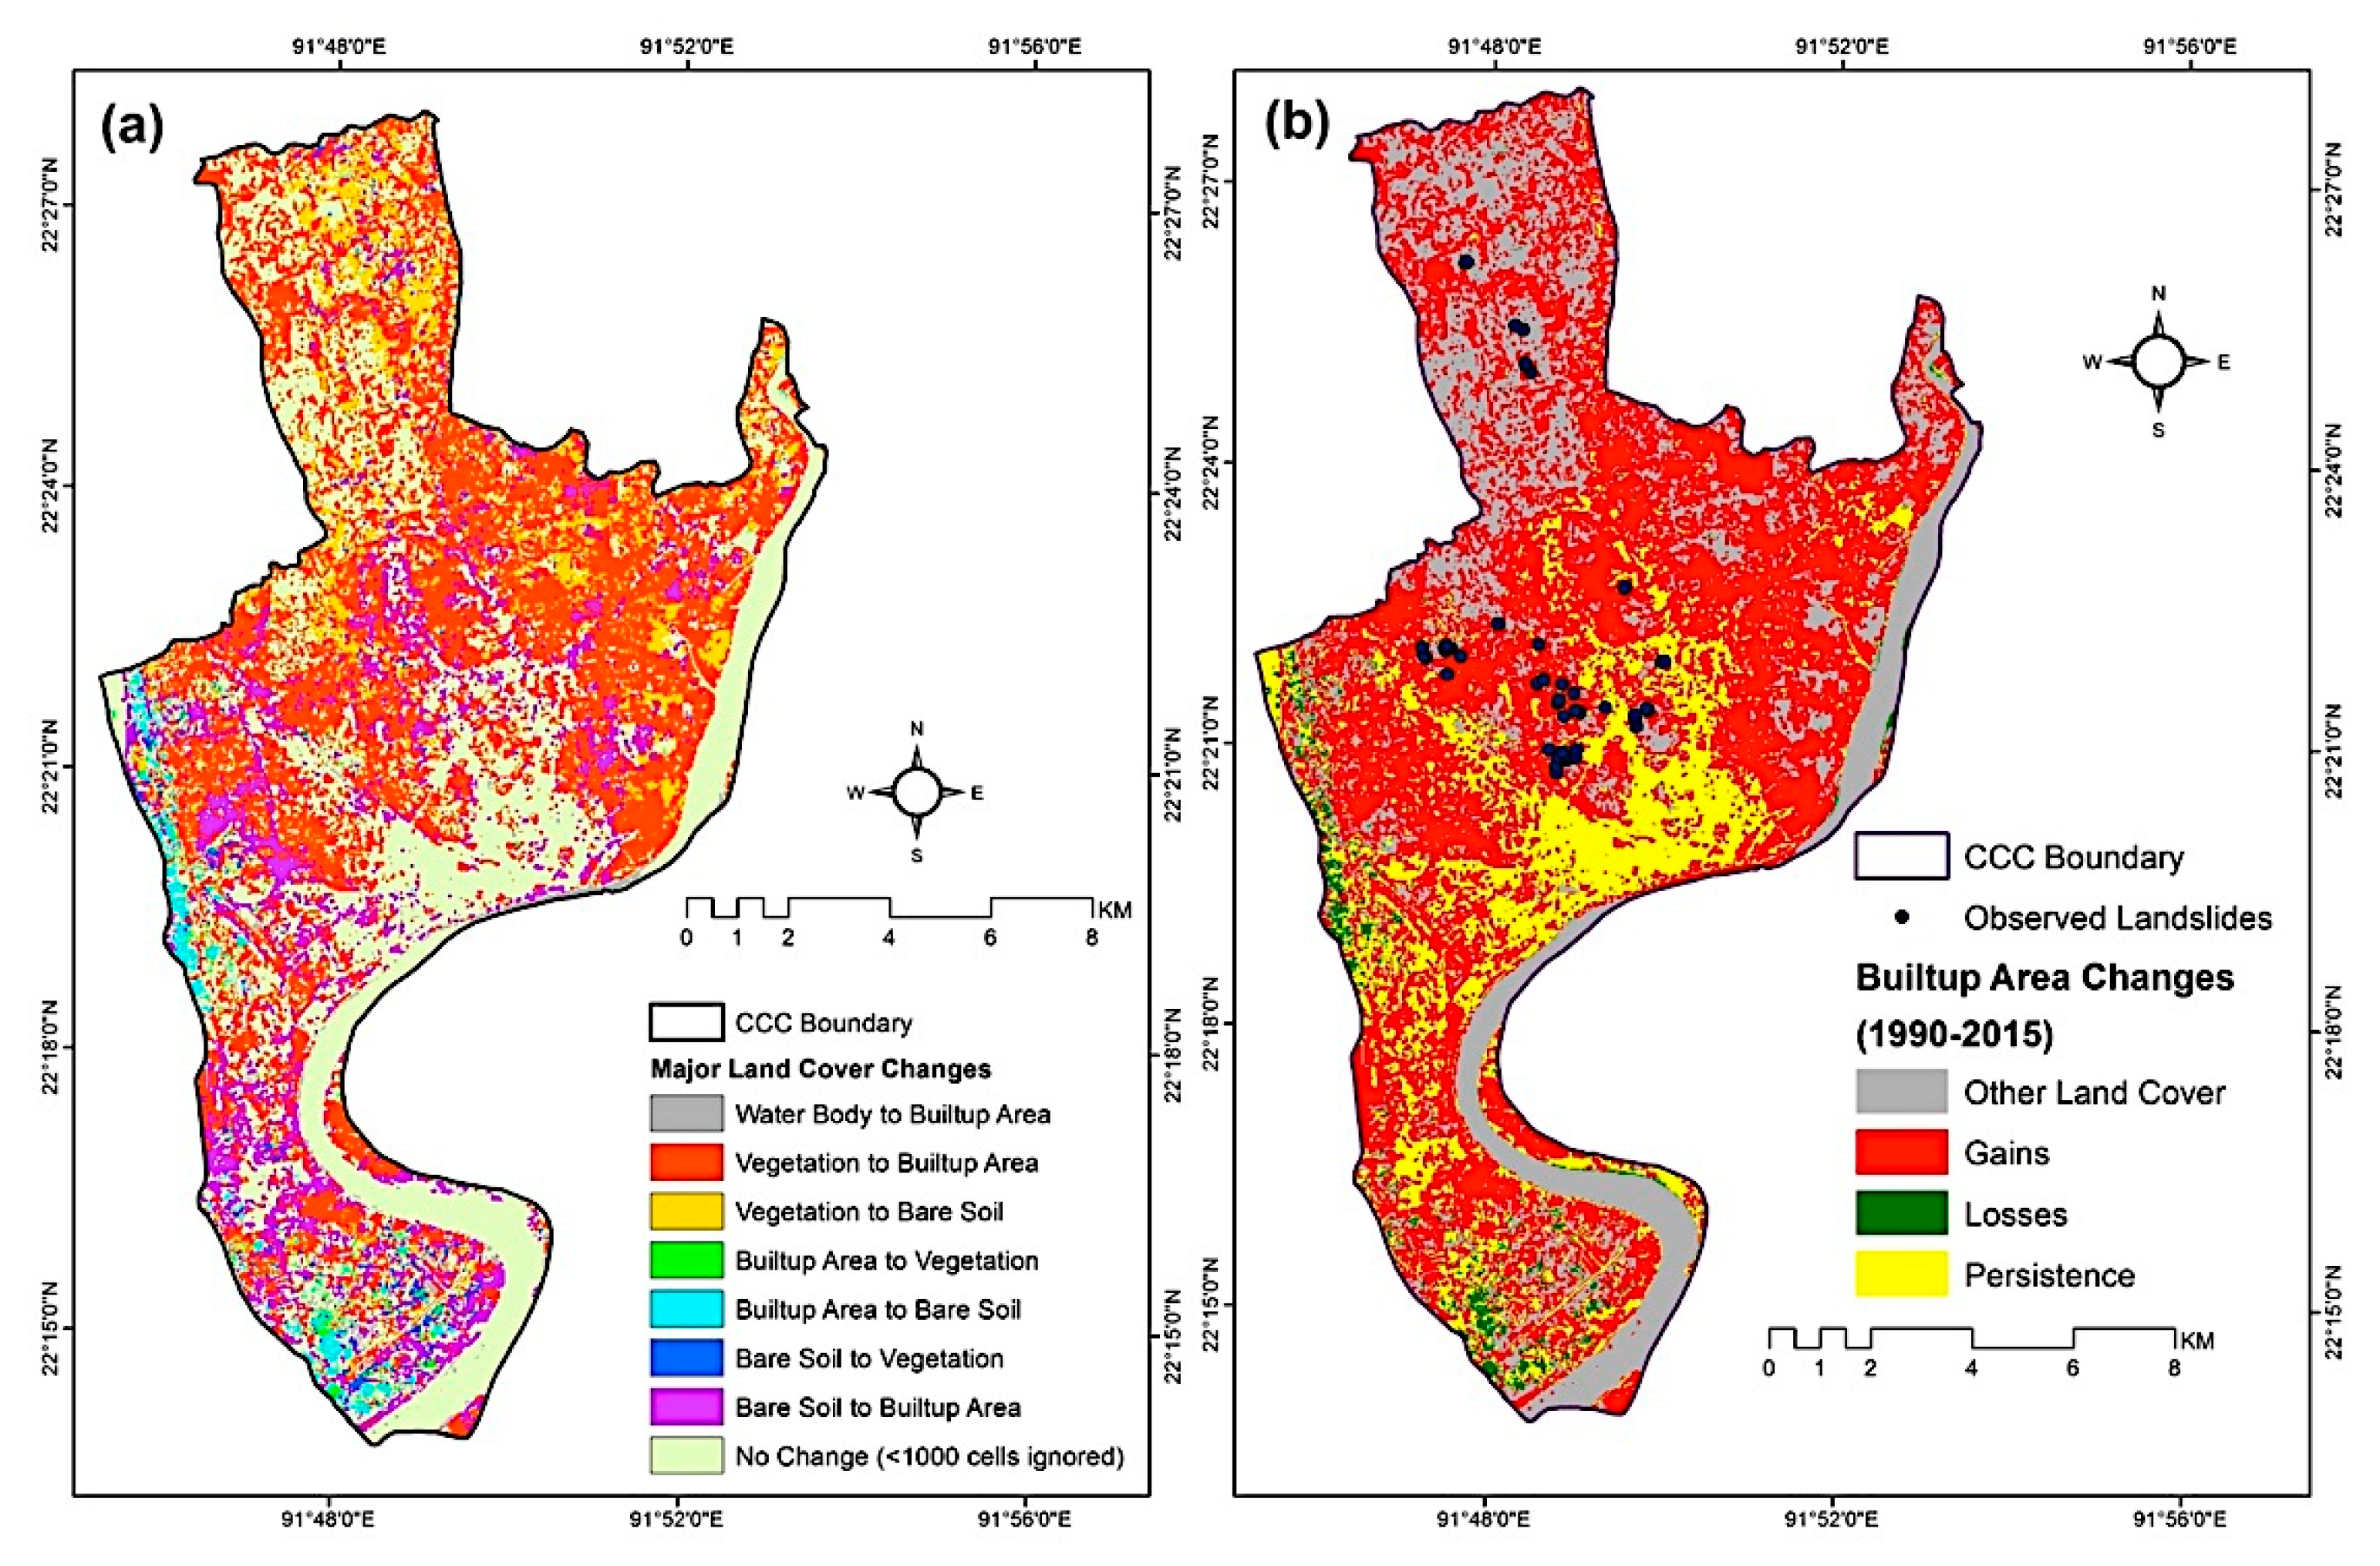
Figure 8.
(a) Gains and losses by land cover types, and contributions to net change in (b) bare soil; (c) vegetation; and (d) built-up area (km2) in CCC from 1990–2015.
Figure 8.
(a) Gains and losses by land cover types, and contributions to net change in (b) bare soil; (c) vegetation; and (d) built-up area (km2) in CCC from 1990–2015.

Figure 9.
(a) Landslide inventory map (zoomed); and (b) hill-cutting map of CCC.
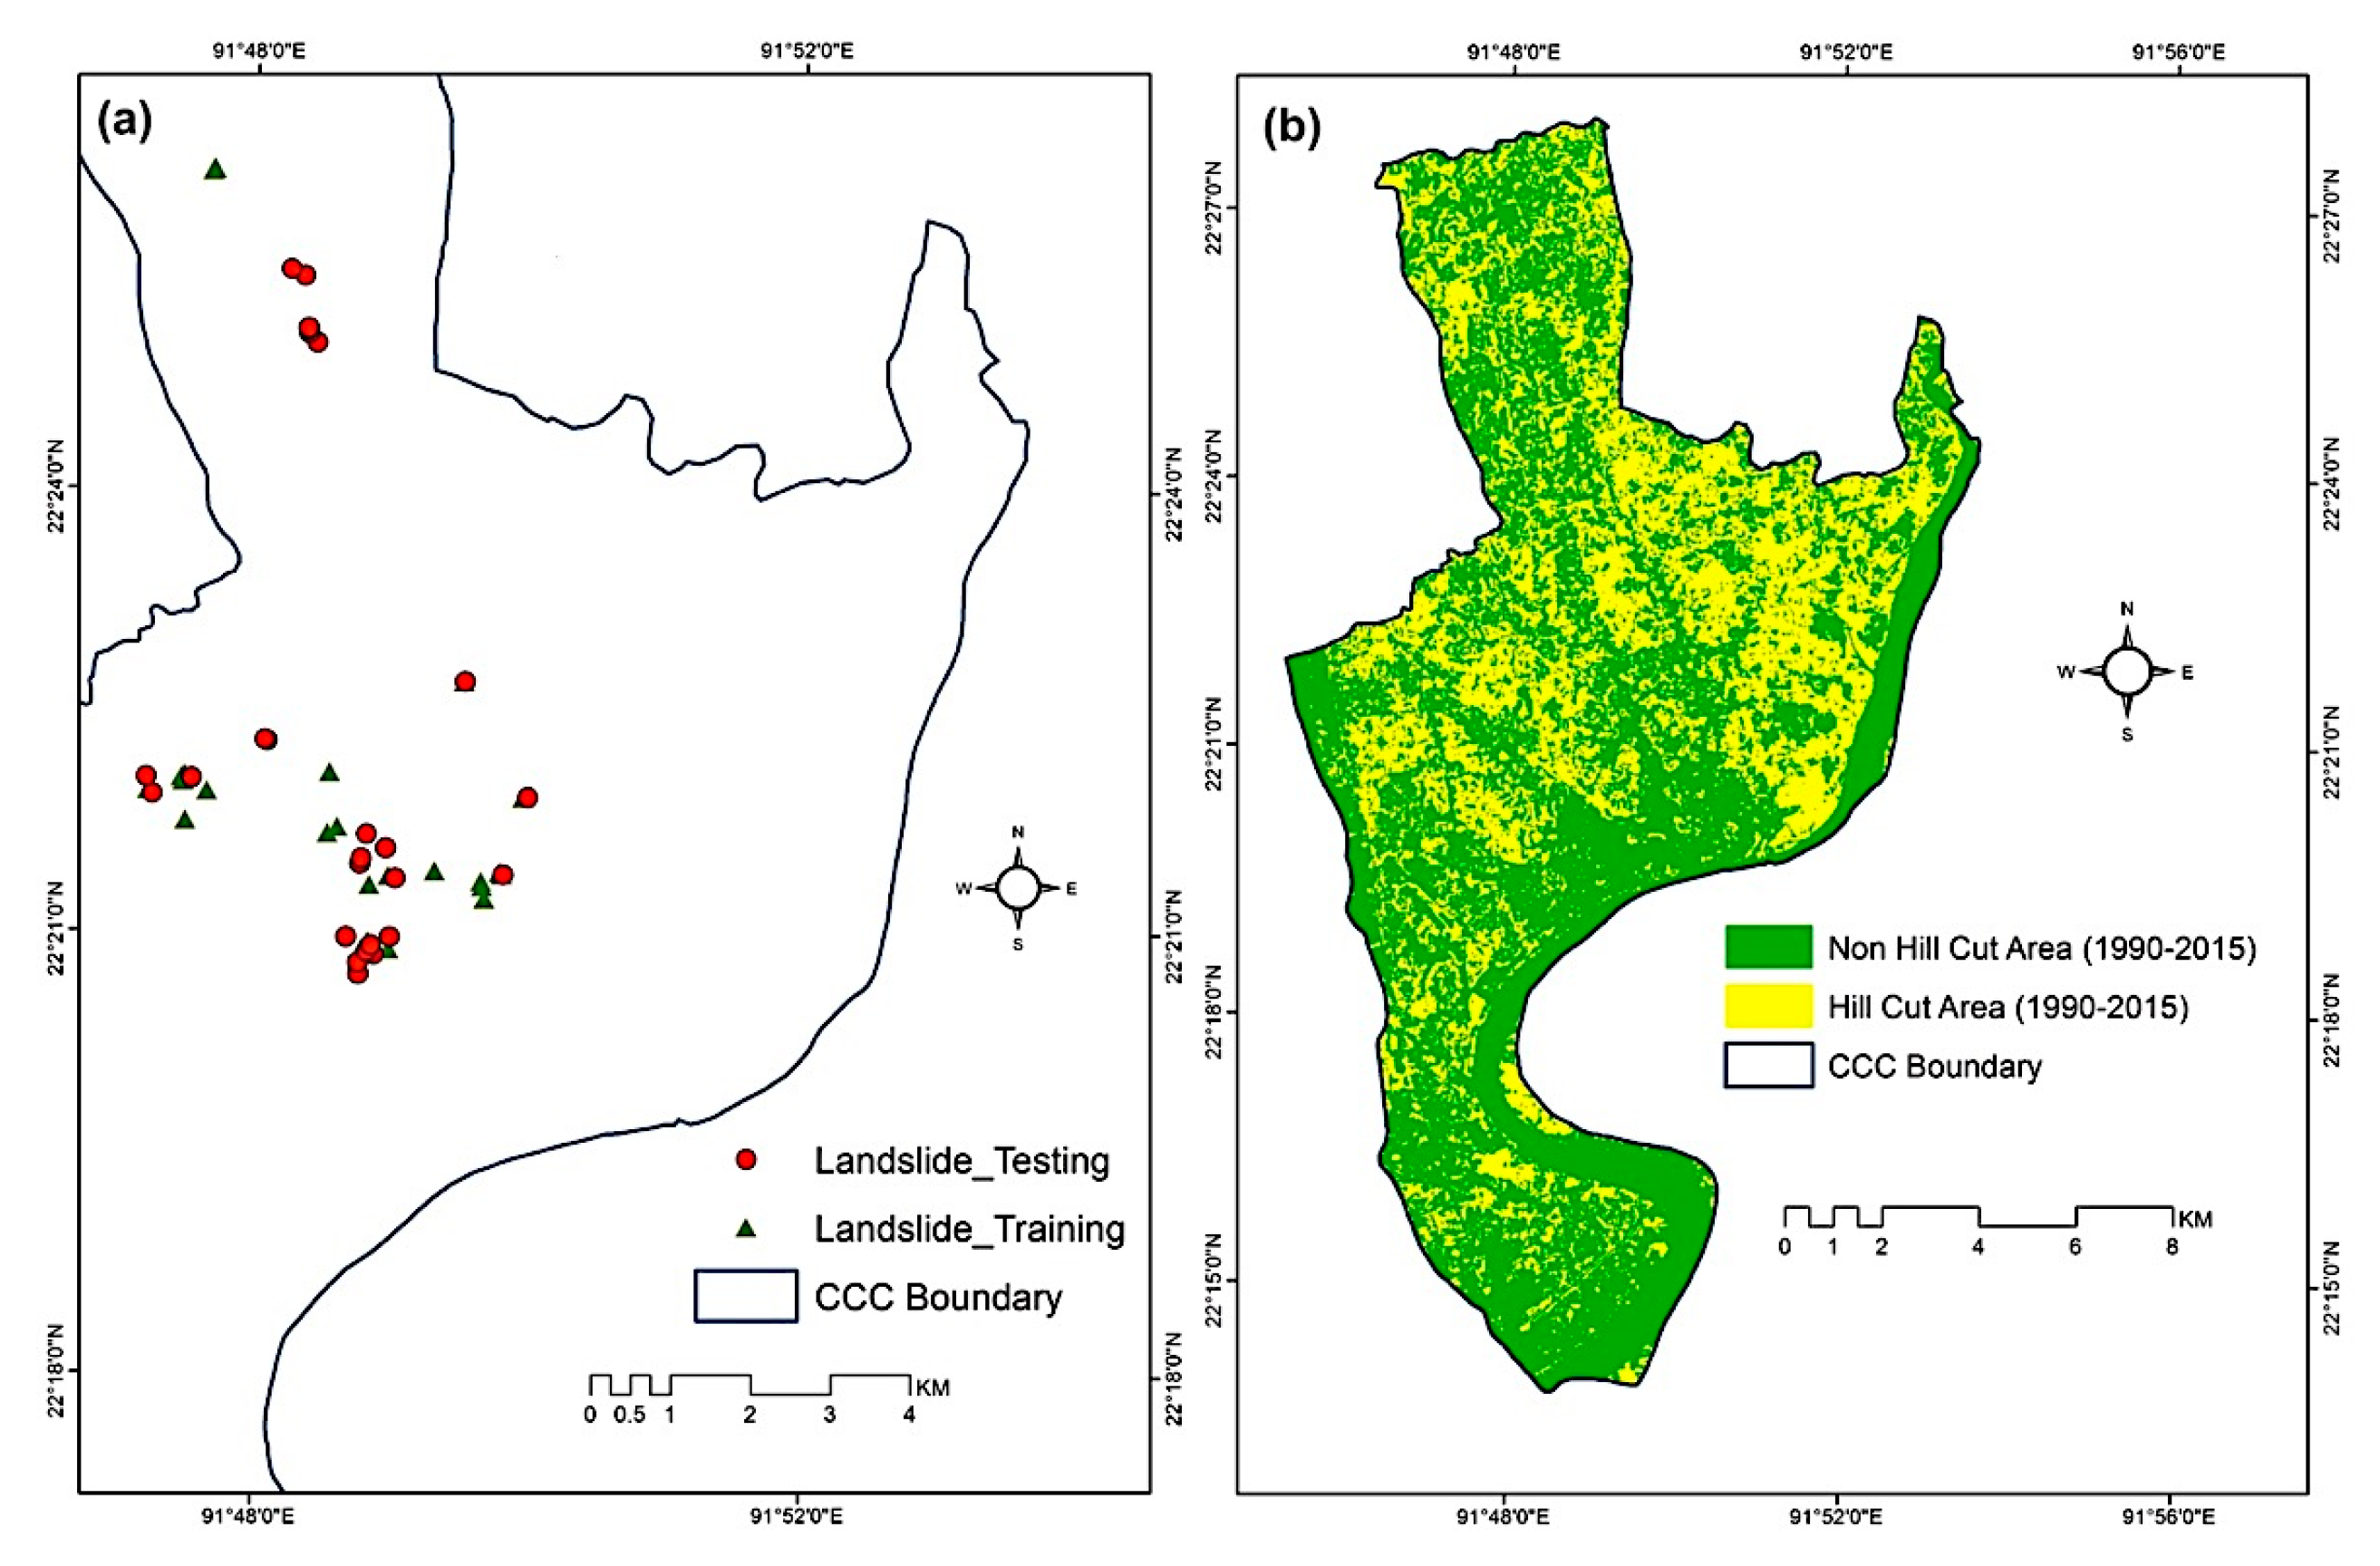
Figure 10.
(a) Slope; and (b) aspect map of CCC.
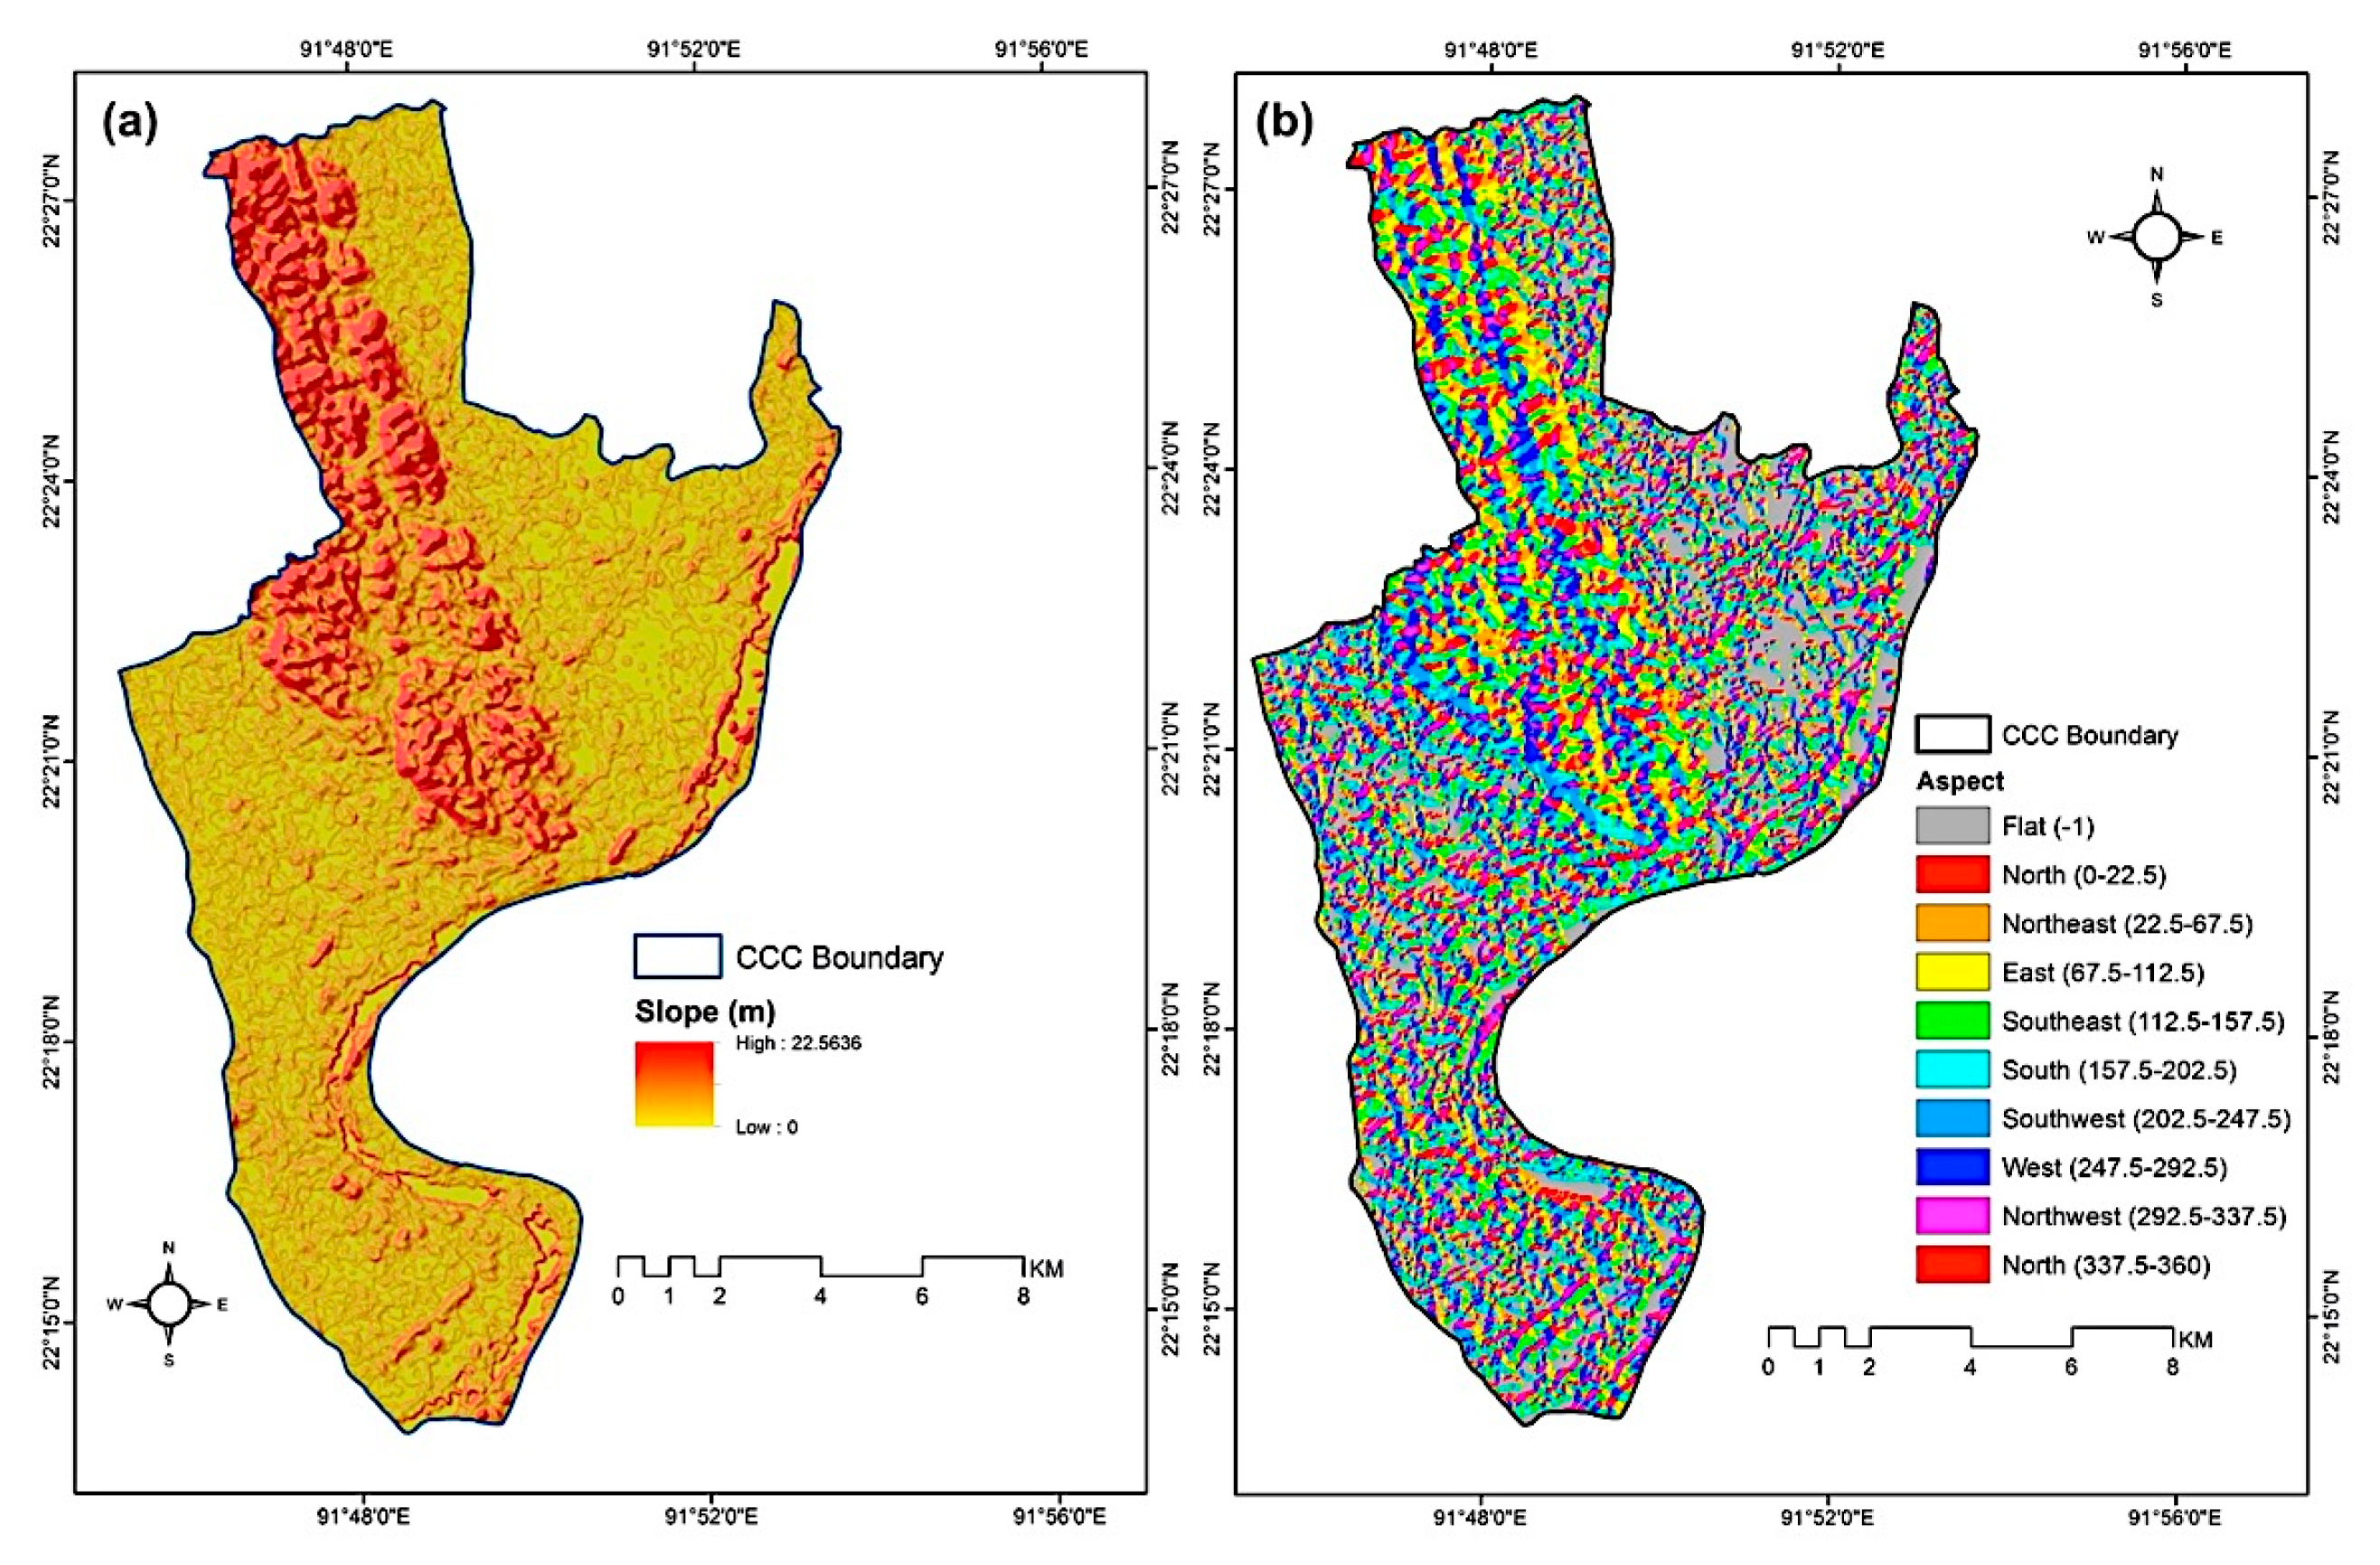
Figure 11.
(a) Distance to stream network; and (b) NDVI of CCC.

Figure 12.
(a) Rainfall pattern map; and distance from (b) road network; (c) drainage network; and (d) existing building structure map of CCC.
Figure 12.
(a) Rainfall pattern map; and distance from (b) road network; (c) drainage network; and (d) existing building structure map of CCC.
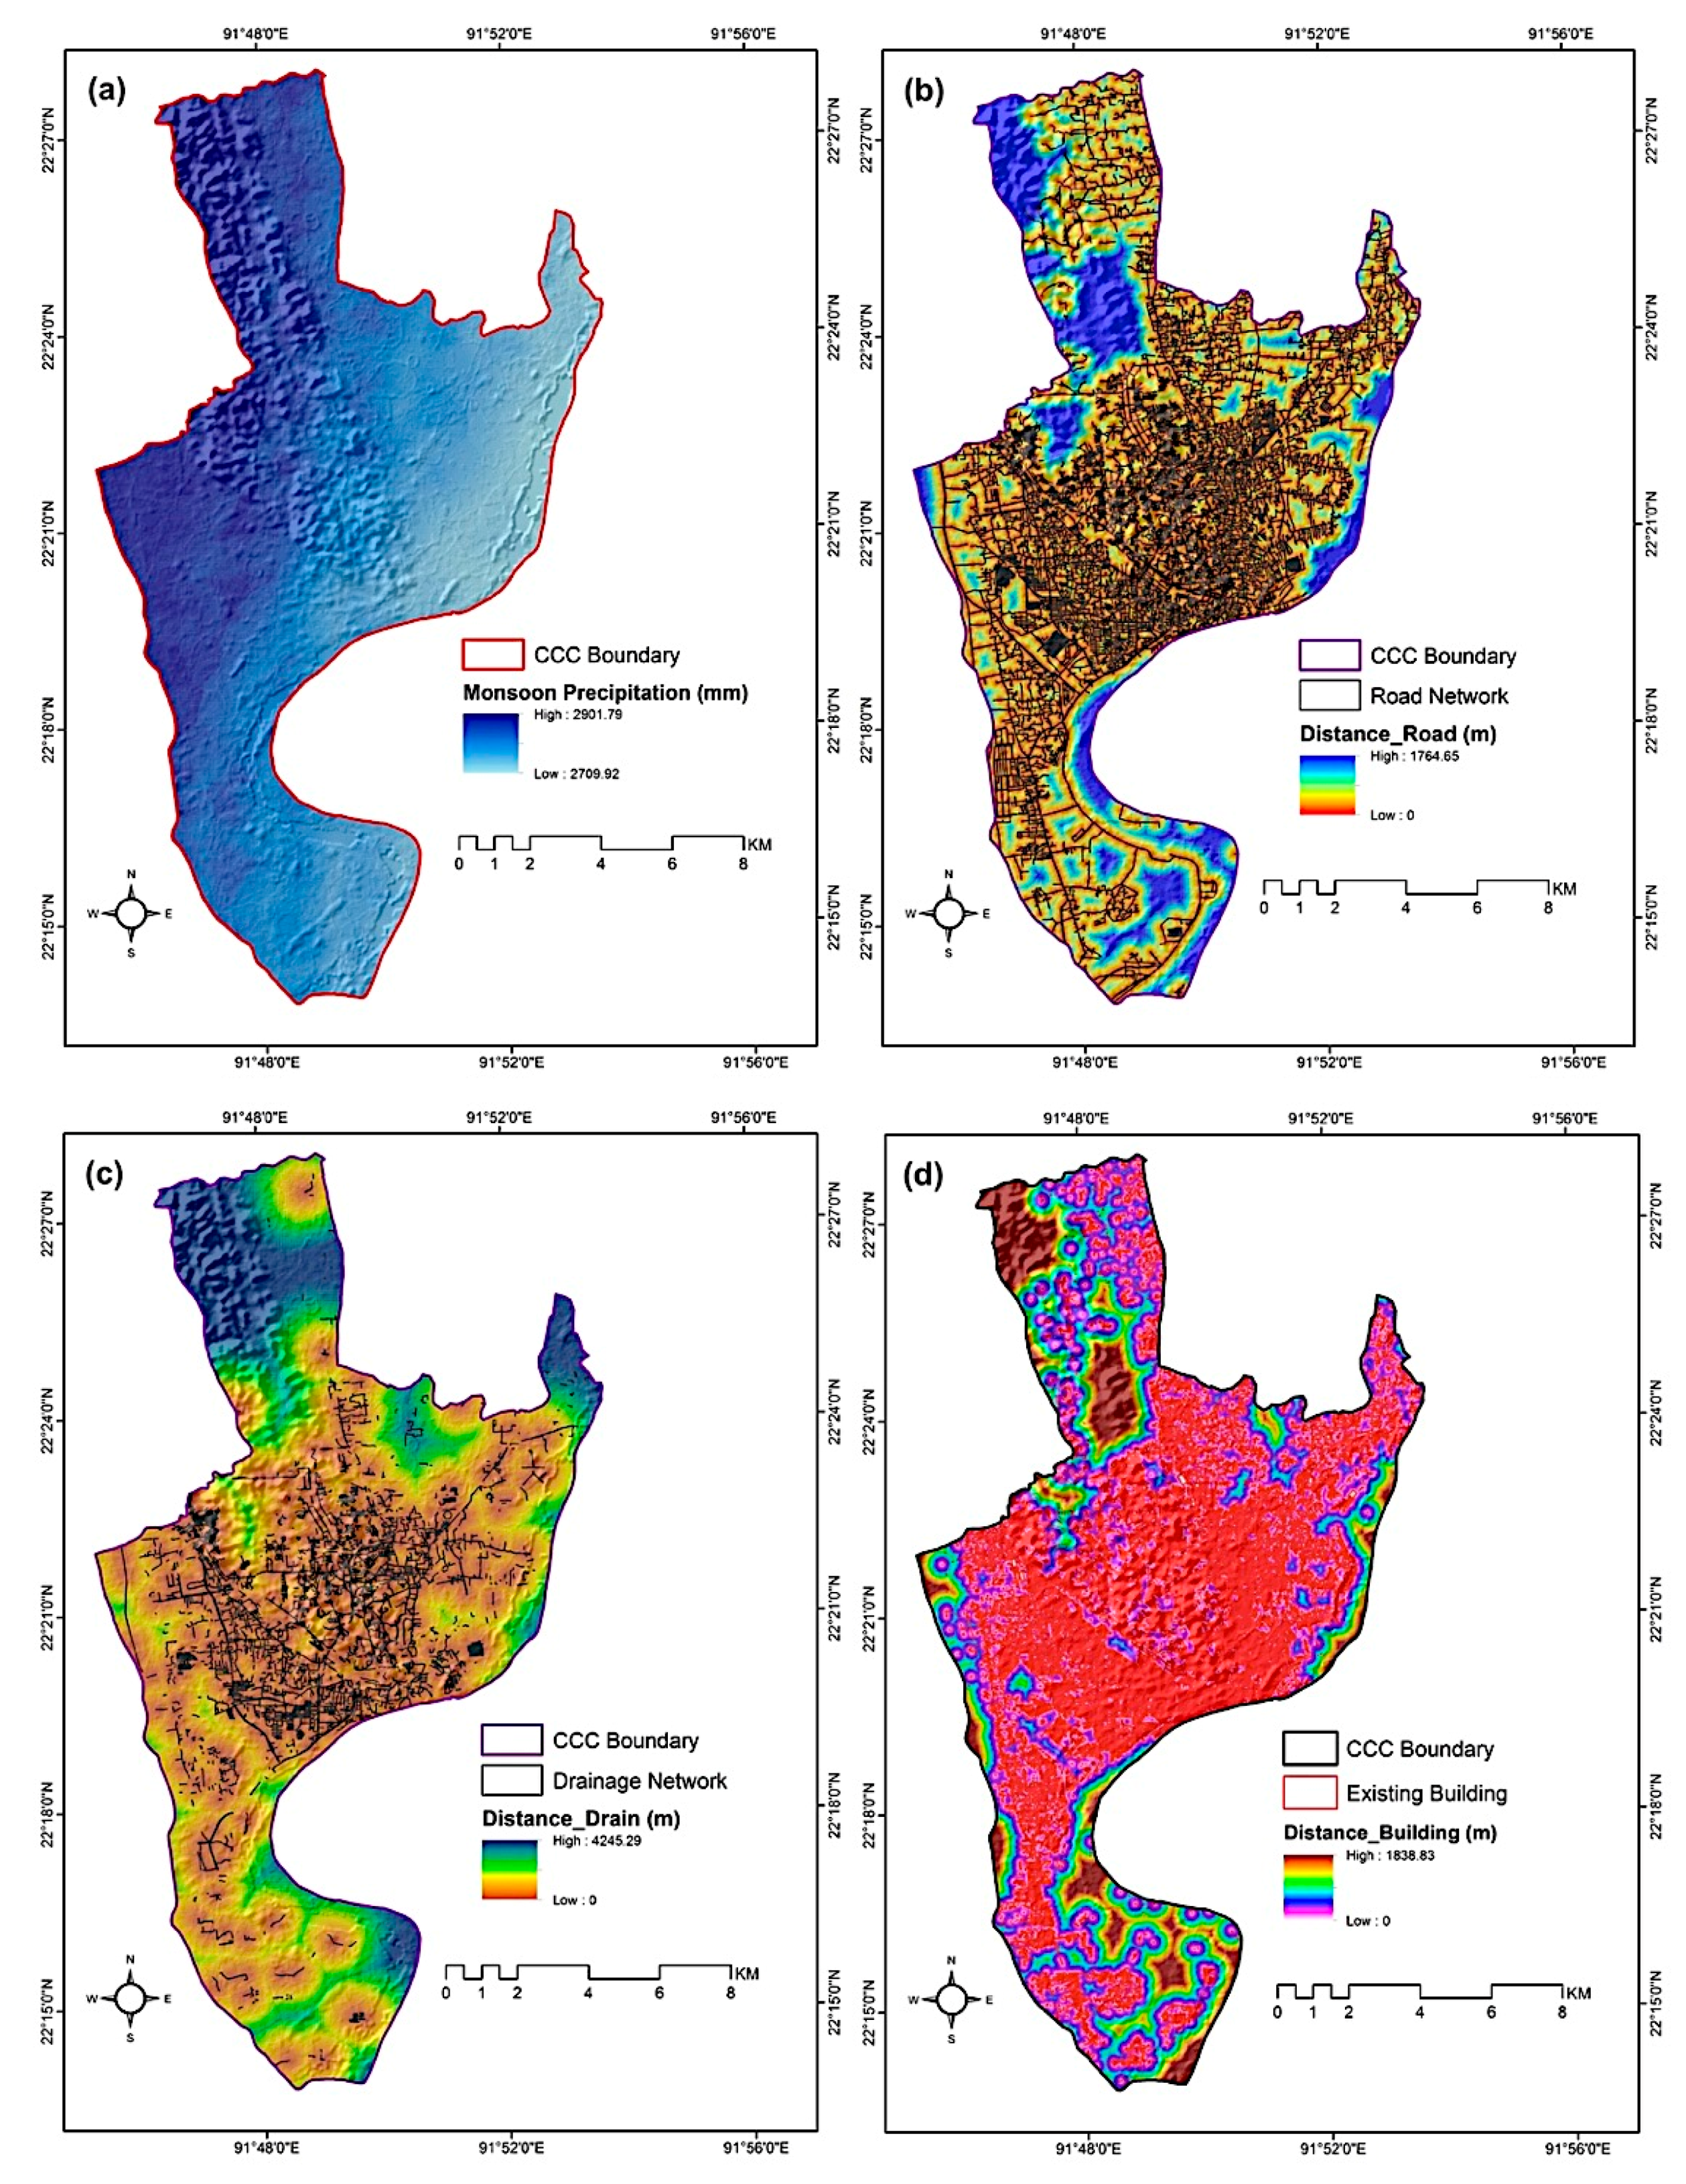
Figure 13.
(a) Geological; (b) geomorphological; (c) distance from faults and lineaments; and (d) soil moisture map of CCC.
Figure 13.
(a) Geological; (b) geomorphological; (c) distance from faults and lineaments; and (d) soil moisture map of CCC.
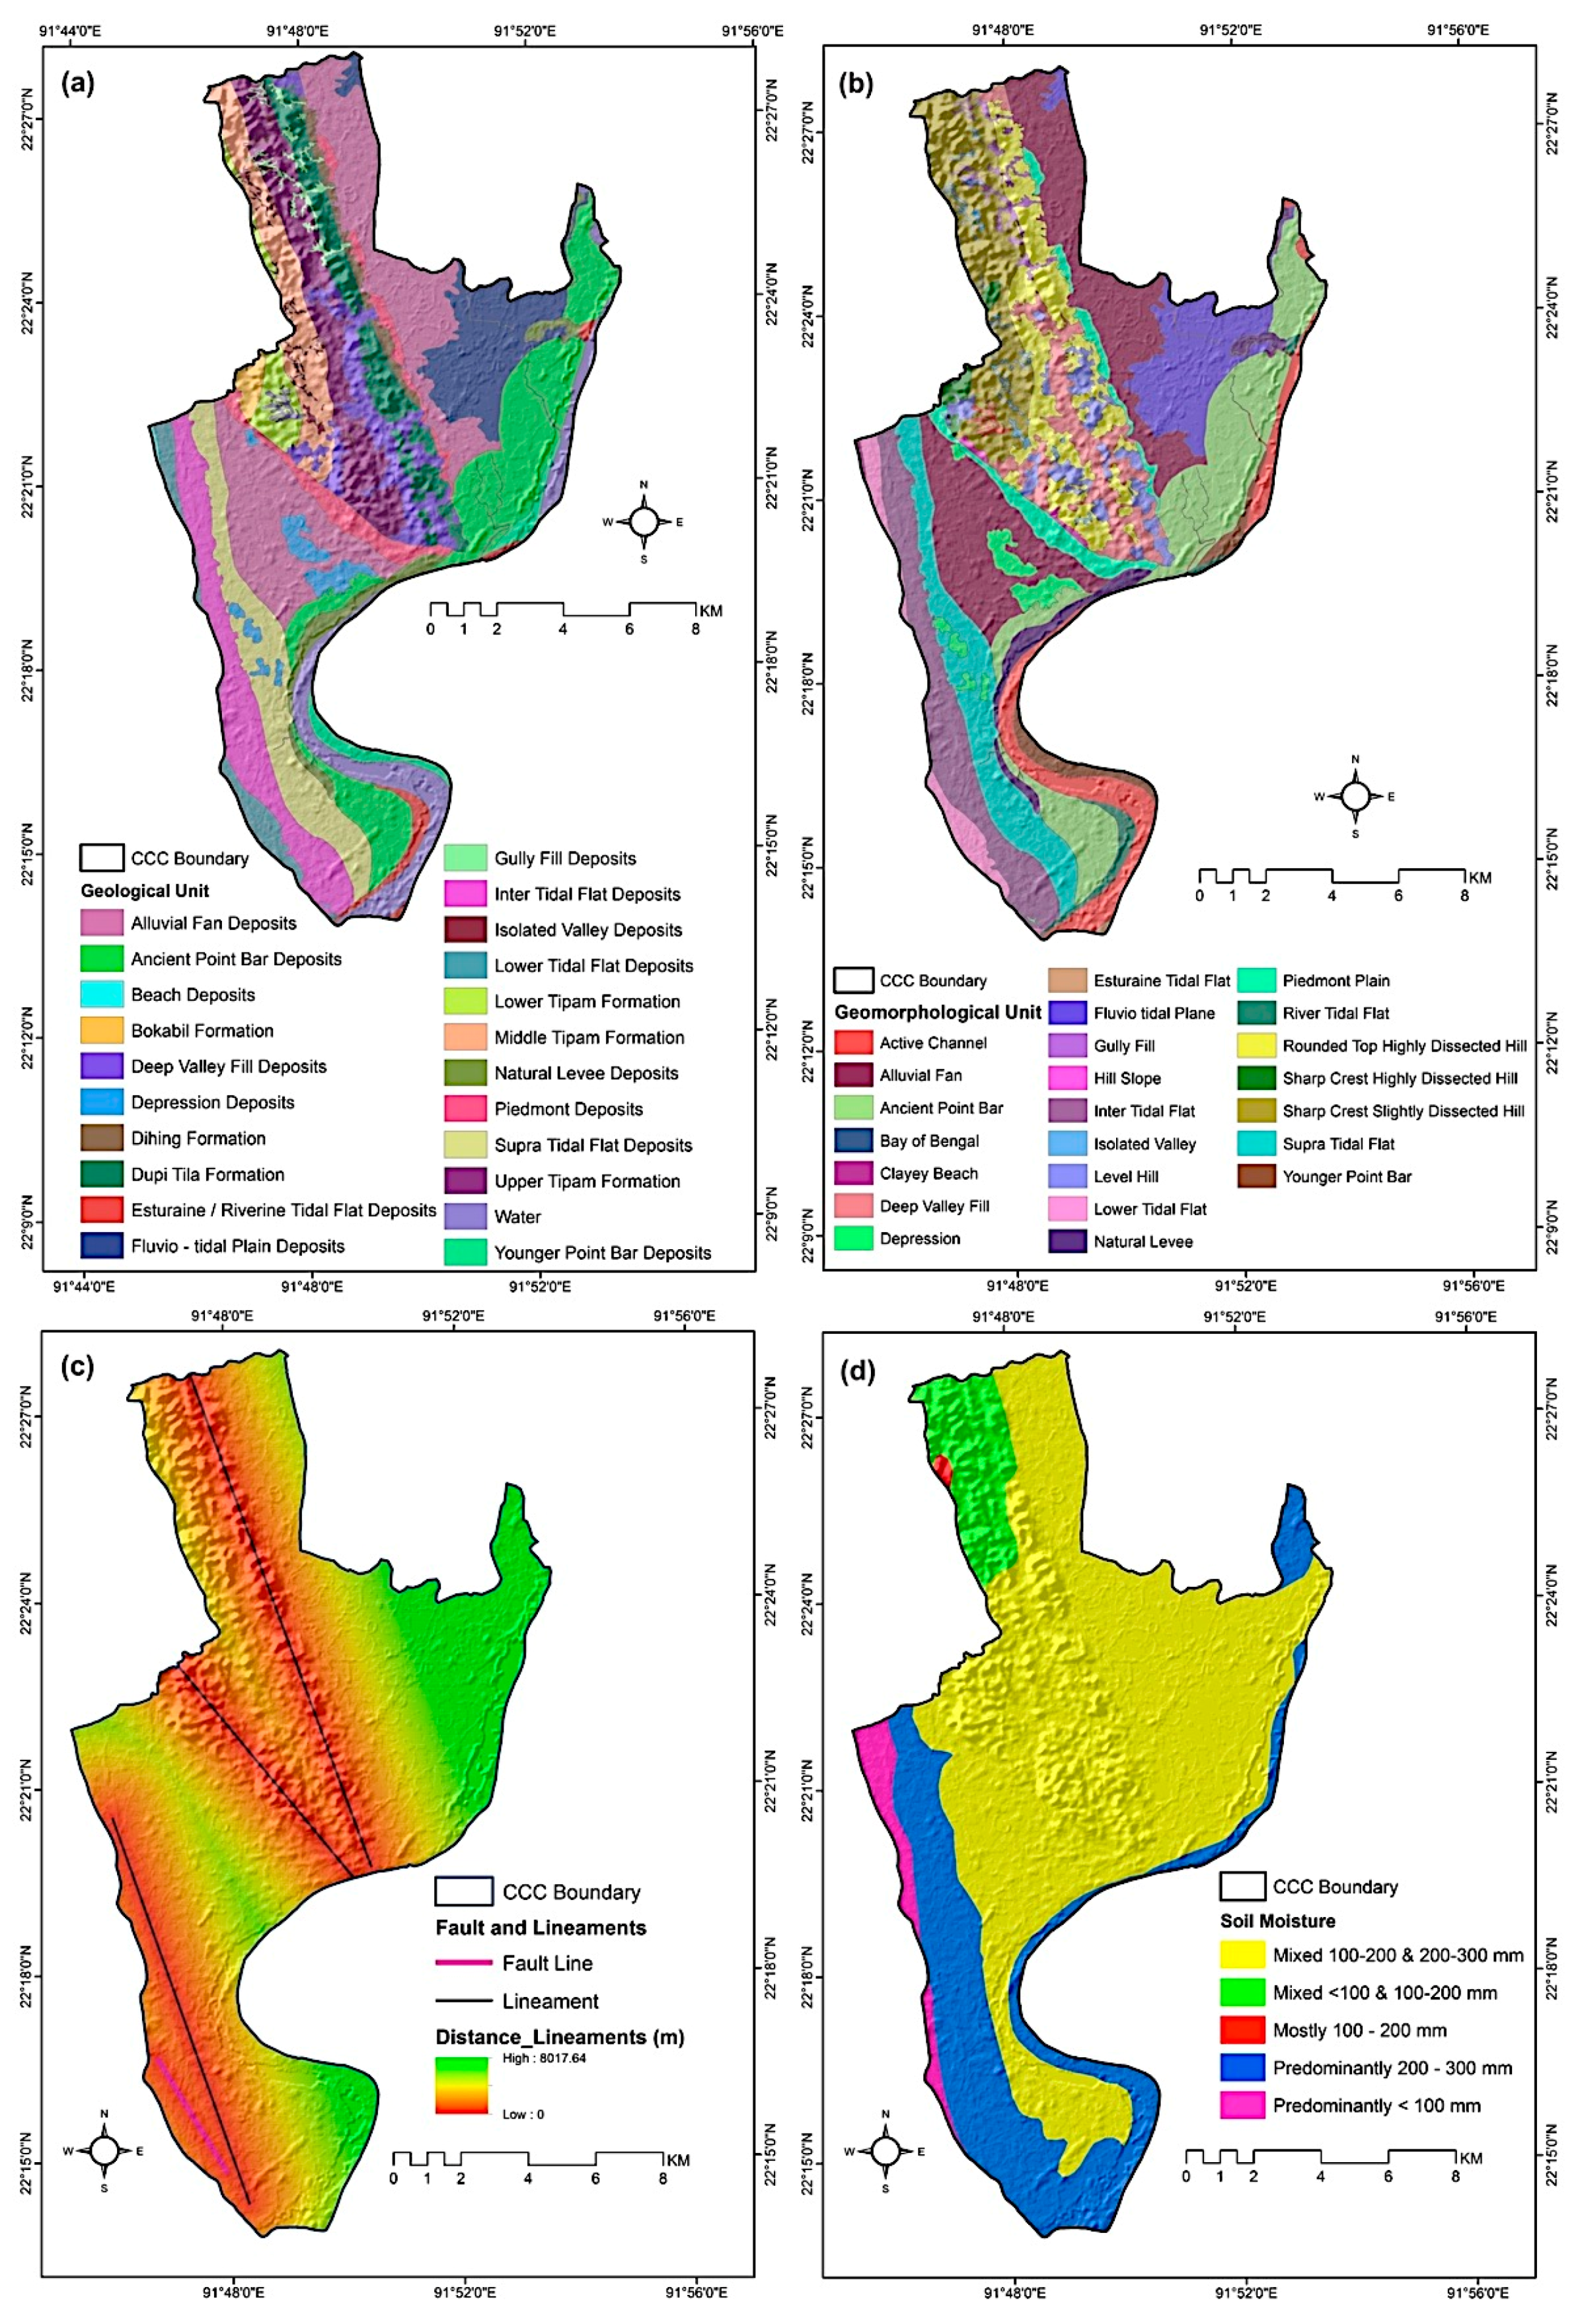
Figure 14.
Fuzzy membership map of (a) distance to building, and (b) distance to slope.
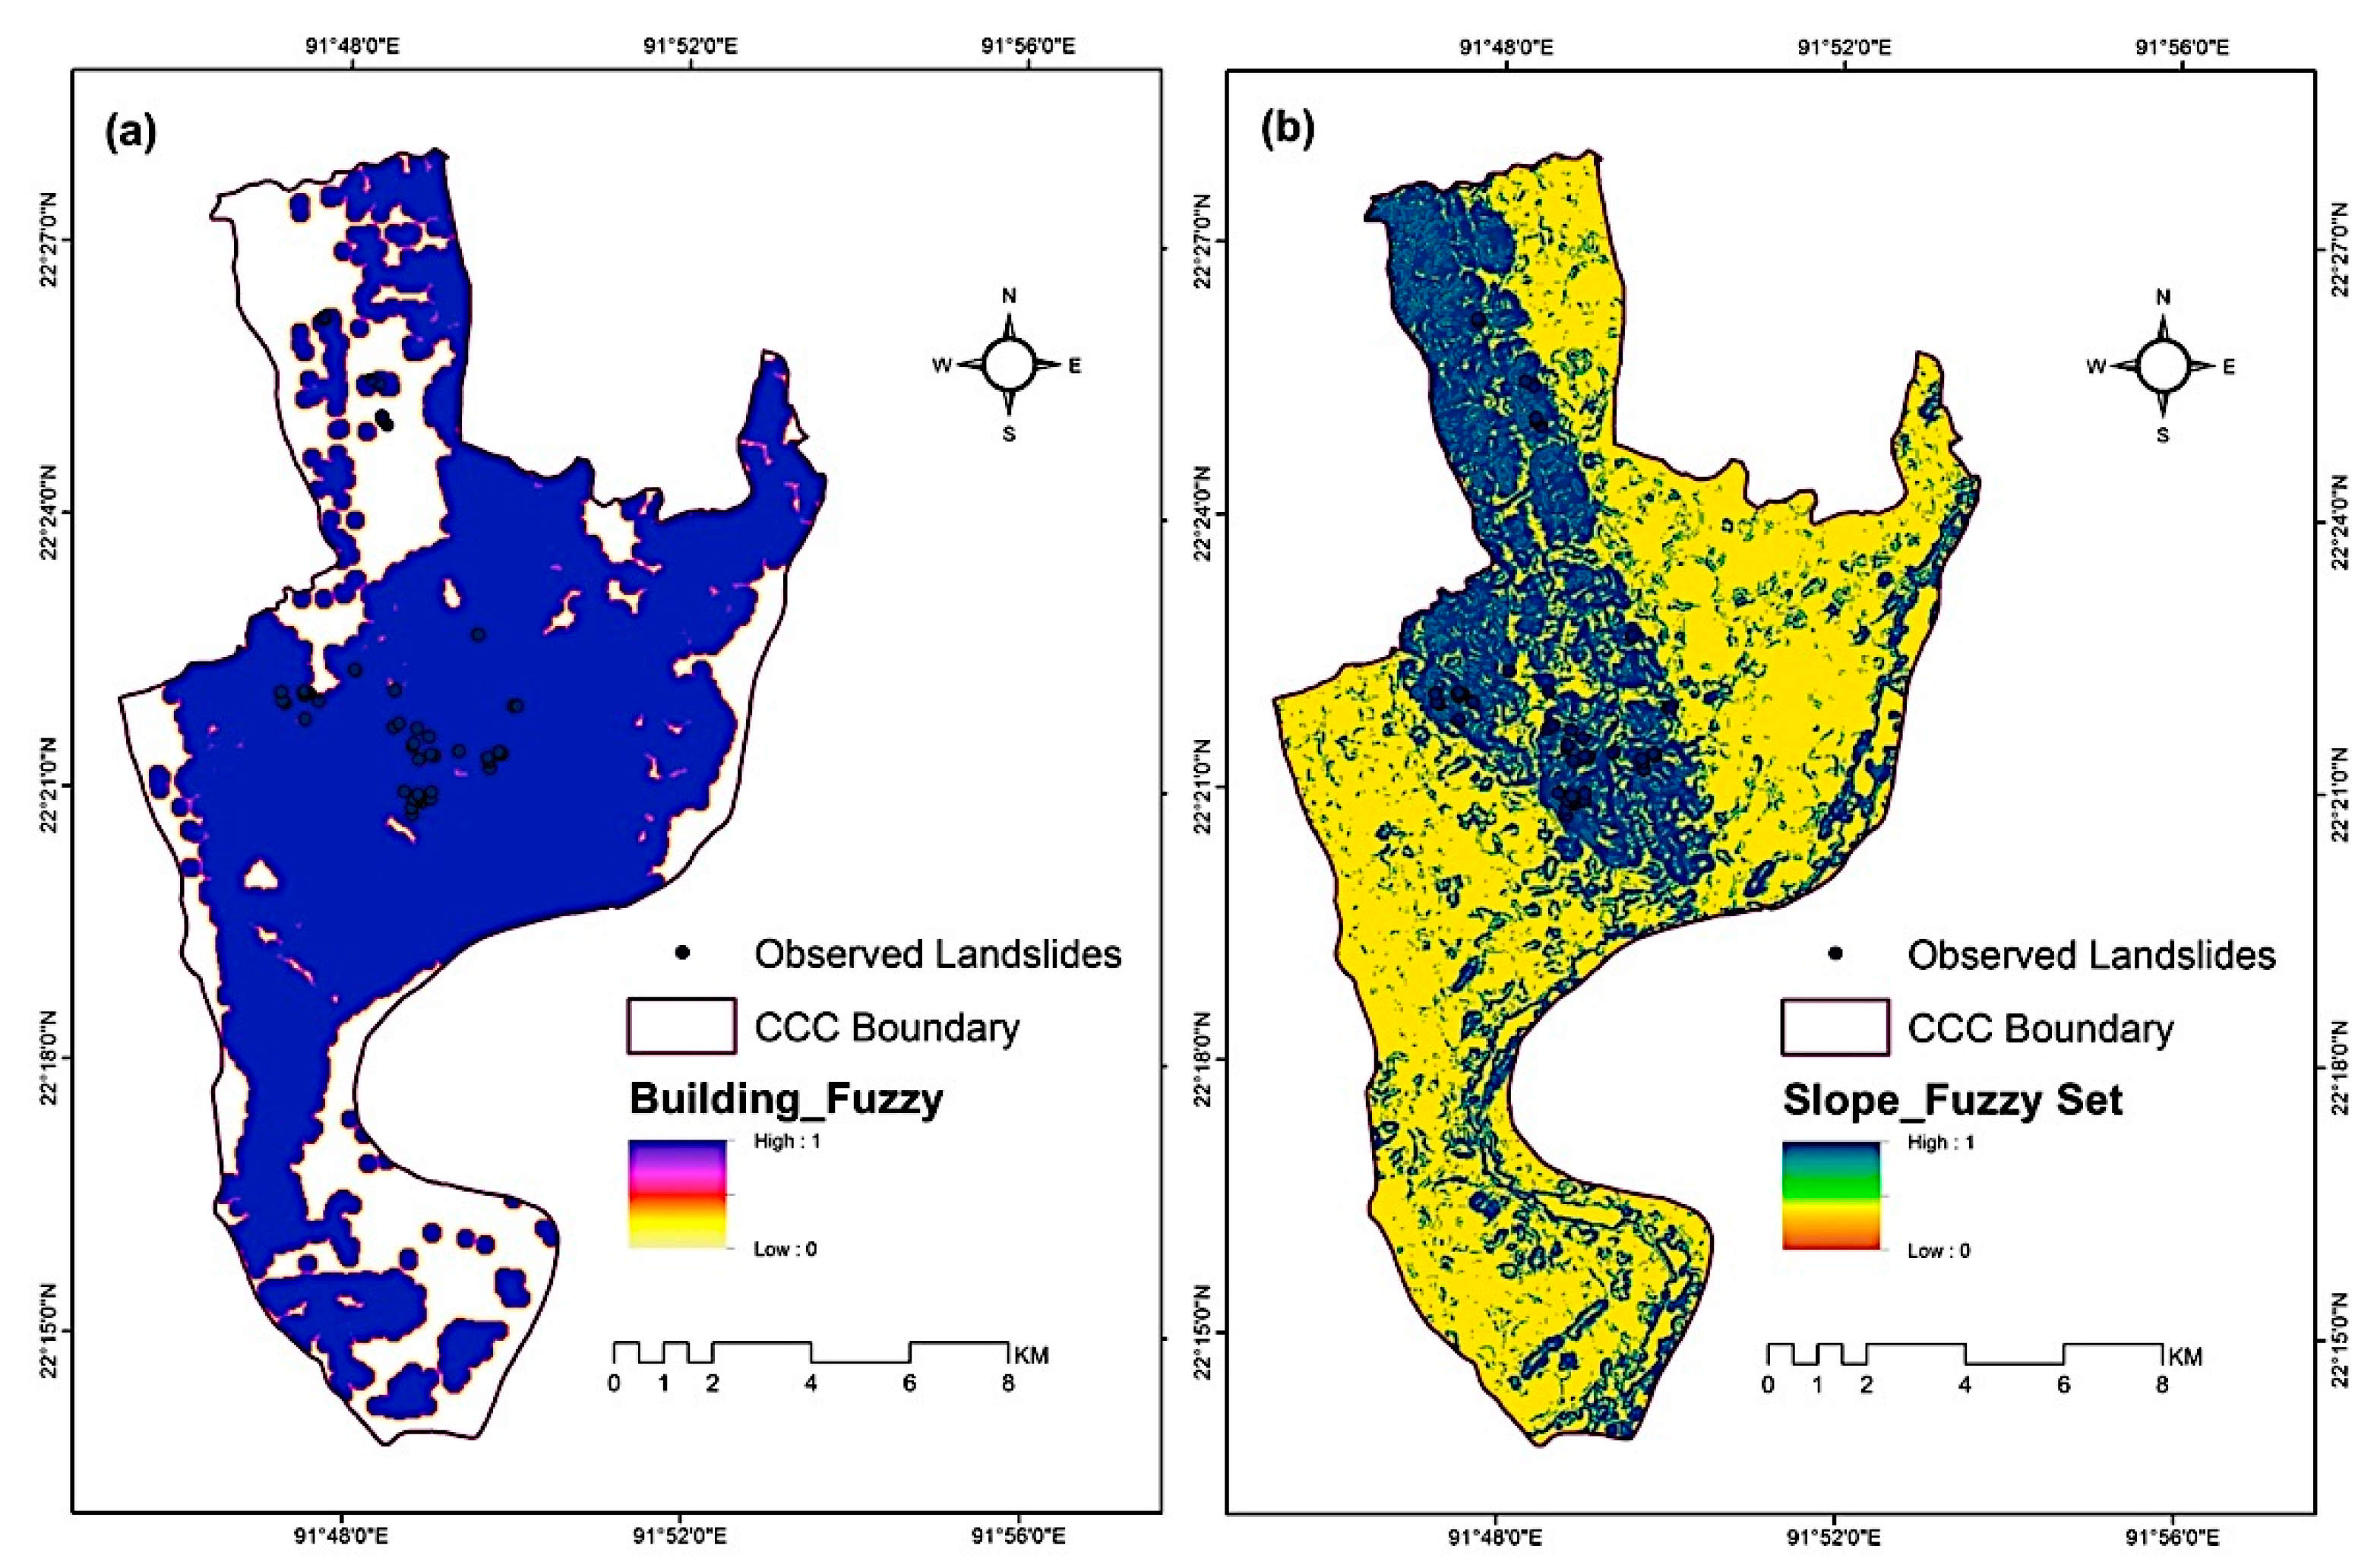
Figure 15.
Landslide susceptibility map applying the Dempster-Shafer weights of evidence (WoE) method.
Figure 15.
Landslide susceptibility map applying the Dempster-Shafer weights of evidence (WoE) method.

Figure 16.
Landslide susceptibility maps applying the (a) MR with all layers, (b) MR with PCA layers, and (c) MR with Fuzzy layers.
Figure 16.
Landslide susceptibility maps applying the (a) MR with all layers, (b) MR with PCA layers, and (c) MR with Fuzzy layers.

Figure 17.
Assessing model performances based on the relative operating characteristic (ROC) curves.
Figure 17.
Assessing model performances based on the relative operating characteristic (ROC) curves.
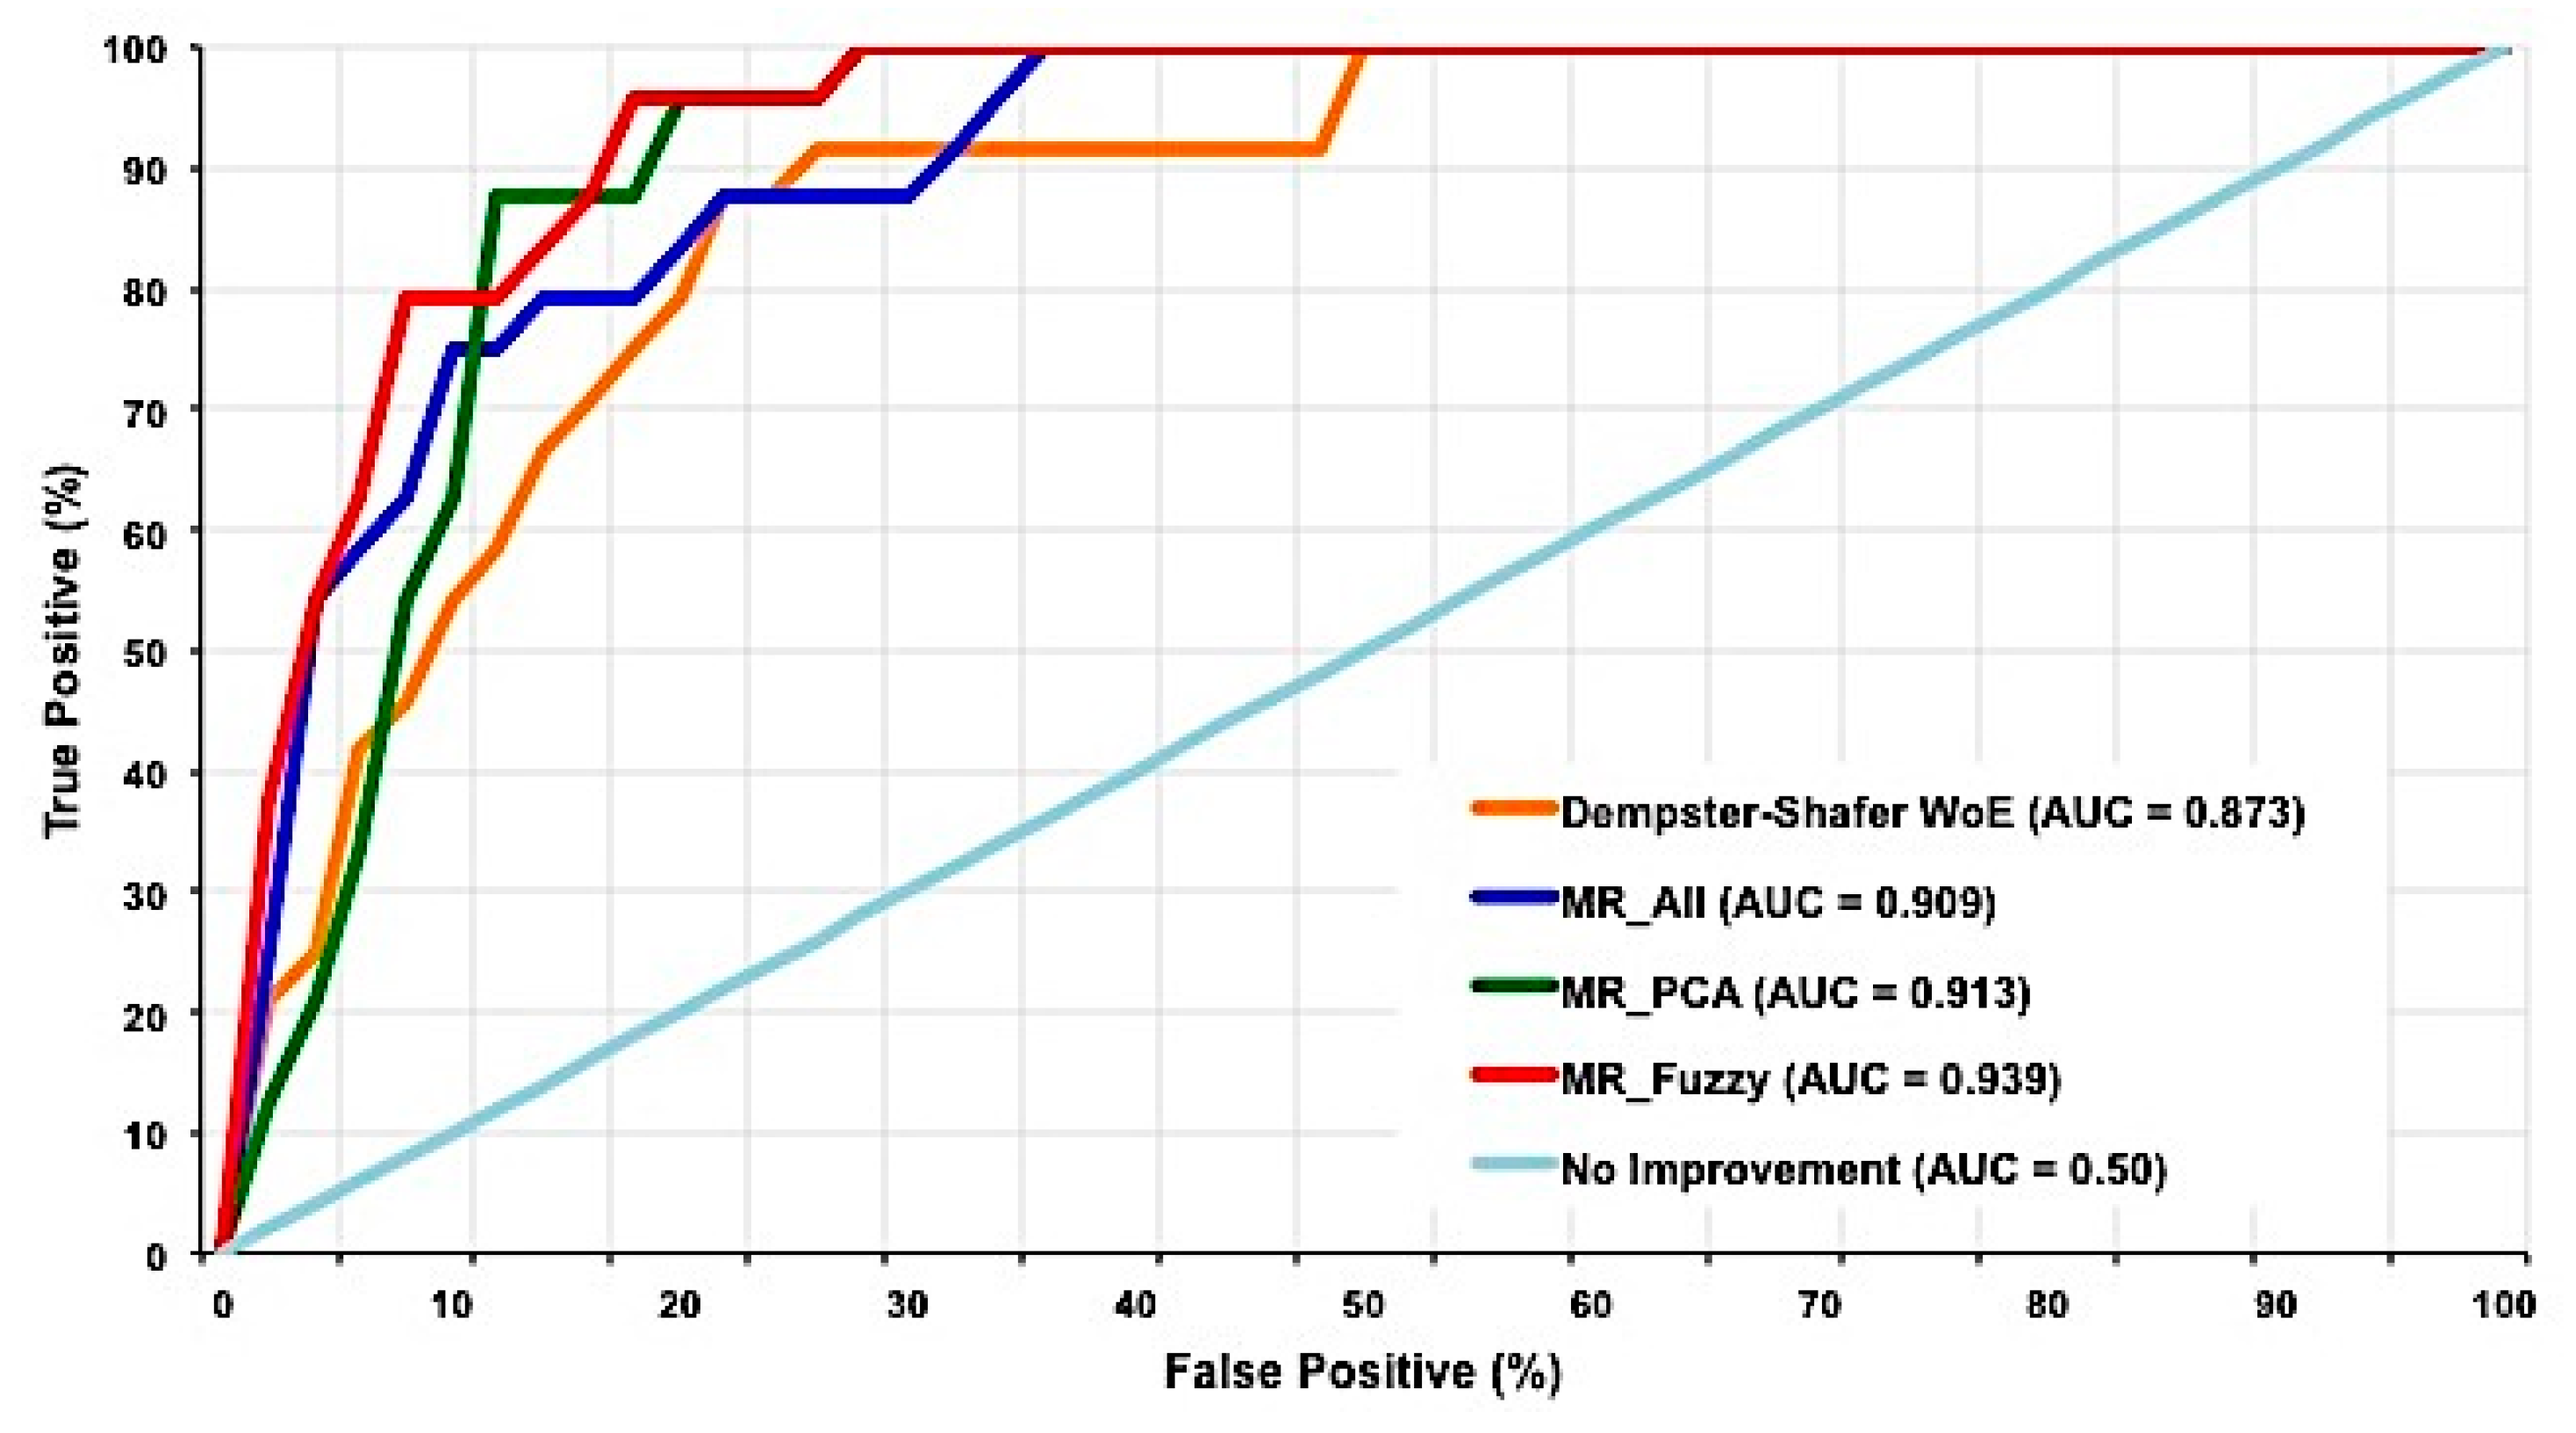
Figure 18.
Landuse change in the Lalkhan Bazaar area, Chittagong (Source: Top Photo—Department of Environment, Chittagong; and Bottom Photo—Fieldwork, 2014).
Figure 18.
Landuse change in the Lalkhan Bazaar area, Chittagong (Source: Top Photo—Department of Environment, Chittagong; and Bottom Photo—Fieldwork, 2014).

Figure 19.
(a,b) Systematic hill cutting in the Lalkhan Bazaar area in CCC, and (c,d) a typical tribal housing in the Sandak Para community (21°48′37.17″N and 92°26′13.55″E), Thanchi, Bandarban, Bangladesh. Source: Fieldwork, 2014–2016.
Figure 19.
(a,b) Systematic hill cutting in the Lalkhan Bazaar area in CCC, and (c,d) a typical tribal housing in the Sandak Para community (21°48′37.17″N and 92°26′13.55″E), Thanchi, Bandarban, Bangladesh. Source: Fieldwork, 2014–2016.

Figure 20.
Conceptual framework for disaster causes.
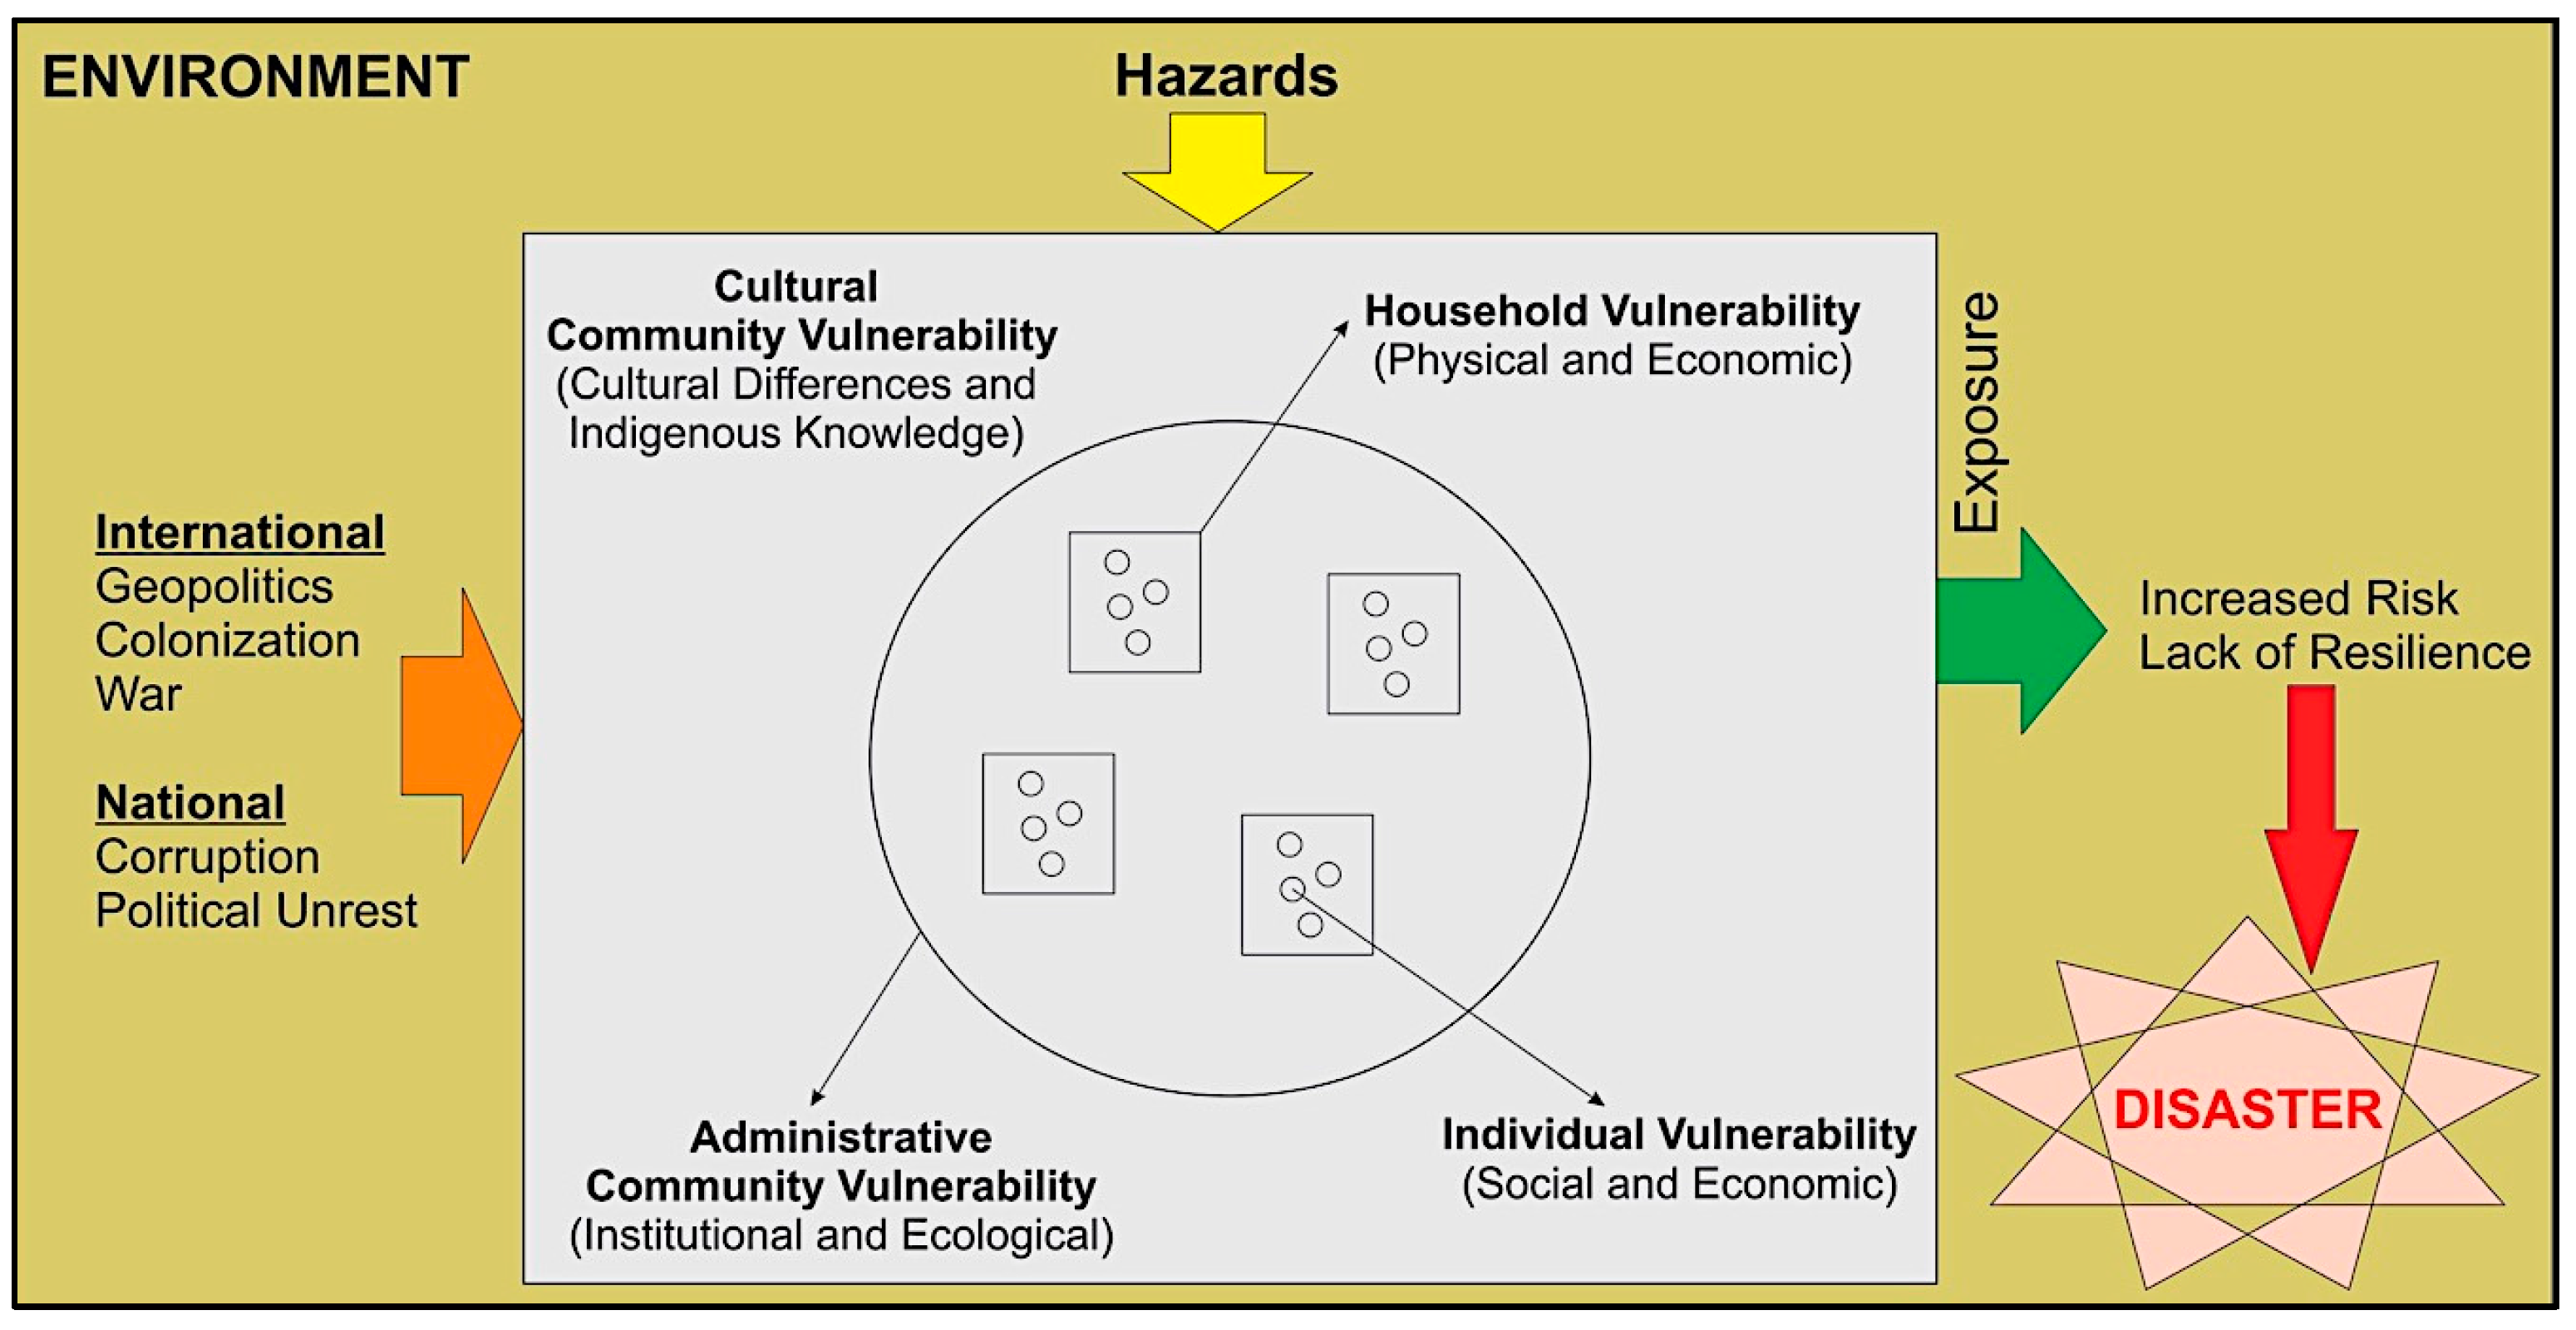
Table 1.
Results of the soils classification.
| Site/Hill Name | Plastic Limit | Liquid Limit | Plasticity Index | Sand (%) | Silt and Clay (%) | Soil Texture Class |
|---|---|---|---|---|---|---|
| Moisture % | ||||||
| Lalpahar | 23 | 42 | 19 | 34.1 | 65.9 | Sandy clay loam |
| Lalkhan Bazaar | 23 | 37 | 14 | 18.2 | 81.8 | Clay loam, silty clay loam |
| Golpahar | Non-plastic | 58.4 | 41.6 | Loamy sand, fine sand | ||
| Medical Hill | Non-plastic | 64.5 | 35.5 | Very fine sand | ||
Table 2.
Fuzzy membership conversion of distance from building factor.
| Class | Distance from Existing Building Structure (m) | Number of Landslides | Fuzzy Membership |
|---|---|---|---|
| 1 | 0–129.7998478 | 45 | 1 |
| 2 | 129.7998–338.9218247 | 4 | 0 |
| 3 | 338.9218–612.9437256 | 4 | 0 |
| 4 | 612.9437–1038.398782 | 0 | 0 |
| 5 | 1038.398–1838.831177 | 0 | 0 |
Table 3.
Fuzzy membership conversion of slope factor map.
| Class | Slope (°) | Number of Landslides | Fuzzy Membership |
|---|---|---|---|
| 1 | 0–1.150300912 | 6 | 0.25 |
| 2 | 1.150300913–3.096963995 | 11 | 0.70 |
| 3 | 3.096963996–5.663019876 | 16 | 1.00 |
| 4 | 5.663019877–9.113922613 | 12 | 0.85 |
| 5 | 9.113922614–22.56359482 | 8 | 0.70 |
Table 4.
Correlation coefficients between principal components and landslide causative factors.
| T-Mode Component | C1 | C2 | C3 | C4 |
| % Variance | 86.179401 | 4.083484 | 2.503674 | 1.784600 |
| Eigen Value | 107.489000 | 5.093208 | 3.122758 | 2.225878 |
| Variables | C1 | C2 | C3 | C4 |
| Rainfall | 0.362872 | −0.258761 | −0.146017 | 0.556049 |
| Road_dist | 0.157526 | −0.218939 | −0.421608 | 0.383205 |
| Slope | 0.265153 | −0.288537 | 0.010958 | 0.367769 |
| Soil_moisture | −0.303418 | −0.037902 | 0.875664 | 0.279113 |
| Stream_dist | 0.041511 | −0.037156 | 0.040036 | 0.131143 |
| NDVI | 0.205003 | −0.139066 | −0.022635 | 0.647661 |
| Hill cut | −0.006615 | 0.003081 | 0.163614 | 0.123938 |
| Geomorphology | 0.981827 | −0.183803 | 0.020797 | −0.040053 |
| Geology | 0.973329 | 0.226579 | −0.003578 | 0.034181 |
| Fault_dist | −0.446028 | 0.184316 | −0.067581 | −0.192175 |
| Drain_dist | 0.105115 | −0.239417 | −0.522183 | 0.424086 |
| Building_dist | 0.126201 | −0.203501 | −0.487229 | 0.332616 |
Table 5.
Individual regression coefficients for MR_All method.
| Variable | Coefficient | T-test (189336) | p-Value |
|---|---|---|---|
| Intercept | −0.000282 | −1.343087 | 0.089637 |
| Rainfall | −0.000018 | −0.753064 | 0.225725 |
| Road_distance | −0.000037 | −0.901577 | 0. 183795 |
| Slope | 0.000185 | 6.089593 | <0.00001 |
| Soil_moisture | 0.000047 | 2.755146 | 0.002934 |
| Stream_distance | 0.000008 | 0.378409 | 0.352567 |
| NDVI | 0.000018 | 0.755844 | 0.224885 |
| Hill cut | 0.000038 | 0.694826 | 0.243591 |
| Geomorphology | −0.000002 | −0.205457 | 0.418786 |
| Geology | 0.000012 | 1.359212 | 0.087042 |
| Fault_distance | −0.000051 | −1.716166 | 0.043082 |
| Drain_distance | −0.000031 | −0.989421 | 0.161332 |
| Building_distance | −0.000025 | −0.613568 | 0.269939 |
Table 6.
Individual regression coefficients for MR_PCA method.
| Variable | Coefficient | T-test (189344) | p-Value |
|---|---|---|---|
| Intercept | −0.000510 | −3.616316 | 0.00015 |
| Component 1 (C1) | 0.000010 | 4.092914 | 0.000021 |
| Component 2 (C2) | −0.000009 | −0.807720 | 0.209834 |
| Component 3 (C3) | 0.000072 | 4.902595 | <0.00001 |
| Component 4 (C4) | 0.000050 | 2.857804 | 0.002133 |
Table 7.
Individual regression coefficients for MR_Fuzzy method.
| Variable | Coefficient | T-test (189336) | p-Value |
|---|---|---|---|
| Intercept | −0.000311 | −2.425386 | 0.007655 |
| Rainfall | 0.000107 | 0.823217 | 0.205198 |
| Road_distance | 0.000571 | 1.626519 | 0.051922 |
| Slope | 0.000226 | 0.341482 | 0.366401 |
| Soil_moisture | 0.002758 | 6.734273 | <0.00001 |
| Stream_distance | 0.000084 | 0.645373 | 0.259367 |
| NDVI | 0.000013 | 0.172802 | 0.431404 |
| Hill cut | 0.000111 | 1.161067 | 0.122822 |
| Geomorphology | 0.000295 | 1.823625 | 0.034107 |
| Geology | −0.000044 | −0.083936 | 0.466926 |
| Fault_distance | 0.000170 | 1.434242 | 0.075758 |
| Drain_distance | 0.000364 | 1.447719 | 0.073851 |
| Building_distance | −0.000190 | −0.920333 | 0.178787 |
© 2017 by the authors. Licensee MDPI, Basel, Switzerland. This article is an open access article distributed under the terms and conditions of the Creative Commons Attribution (CC BY) license (http://creativecommons.org/licenses/by/4.0/).
Share and Cite
MDPI and ACS Style
Ahmed, B.; Dewan, A. Application of Bivariate and Multivariate Statistical Techniques in Landslide Susceptibility Modeling in Chittagong City Corporation, Bangladesh. Remote Sens. 2017, 9, 304. https://doi.org/10.3390/rs9040304
AMA Style
Ahmed B, Dewan A. Application of Bivariate and Multivariate Statistical Techniques in Landslide Susceptibility Modeling in Chittagong City Corporation, Bangladesh. Remote Sensing. 2017; 9(4):304. https://doi.org/10.3390/rs9040304
Chicago/Turabian StyleAhmed, Bayes, and Ashraf Dewan. 2017. "Application of Bivariate and Multivariate Statistical Techniques in Landslide Susceptibility Modeling in Chittagong City Corporation, Bangladesh" Remote Sensing 9, no. 4: 304. https://doi.org/10.3390/rs9040304
Note that from the first issue of 2016, this journal uses article numbers instead of page numbers. See further details here.