
Loess Landslide Inventory Map Based on GF-1 Satellite Imagery


1
State Key Laboratory of Soil Erosion and Dryland Farming on the Loess Plateau, Institute of Soil and Water Conservation, Northwest A&F University, Yangling 712100, China
2
Satellite Environmental Center, Ministry of Environmental Protection, Beijing 100094, China
*
Author to whom correspondence should be addressed.
Remote Sens. 2017, 9(4), 314; https://doi.org/10.3390/rs9040314
Submission received: 4 January 2017
/
Revised: 20 March 2017
/
Accepted: 24 March 2017
/
Published: 28 March 2017
(This article belongs to the Special Issue Remote Sensing of Landslides)
Abstract
:Rainfall-induced landslides are a major threat in the hilly and gully regions of the Loess Plateau. Landslide mapping via field investigations is challenging and impractical in this complex region because of its numerous gullies. In this paper, an algorithm based on an object-oriented method (OOA) has been developed to recognize loess landslides by combining spectral, textural, and morphometric information with auxiliary topographic parameters based on high-resolution multispectral satellite data (GF-1, 2 m) and a high-precision DEM (5 m). The quality percentage (QP) values were all greater than 0.80, and the kappa indices were all higher than 0.85, indicating good landslide detection with the proposed approach. We quantitatively analyze the spectral, textural, morphometric, and topographic properties of loess landslides. The normalized difference vegetation index (NDVI) is useful for discriminating landslides from vegetation cover and water areas. Morphometric parameters, such as elongation and roundness, can potentially improve the recognition capacity and facilitate the identification of roads. The combination of spectral properties in near-infrared regions, the textural variance from a grey level co-occurrence matrix (GLCM), and topographic elevation data can be used to effectively discriminate terraces and buildings. Furthermore, loess flows are separated from landslides based on topographic position data. This approach shows great potential for quickly producing accurate results for loess landslides that are induced by extreme rainfall events in the hilly and gully regions of the Loess Plateau, which will help decision makers improve landslide risk assessment, reduce the risk from landslide hazards and facilitate the application of more reliable disaster management strategies.
1. Introduction
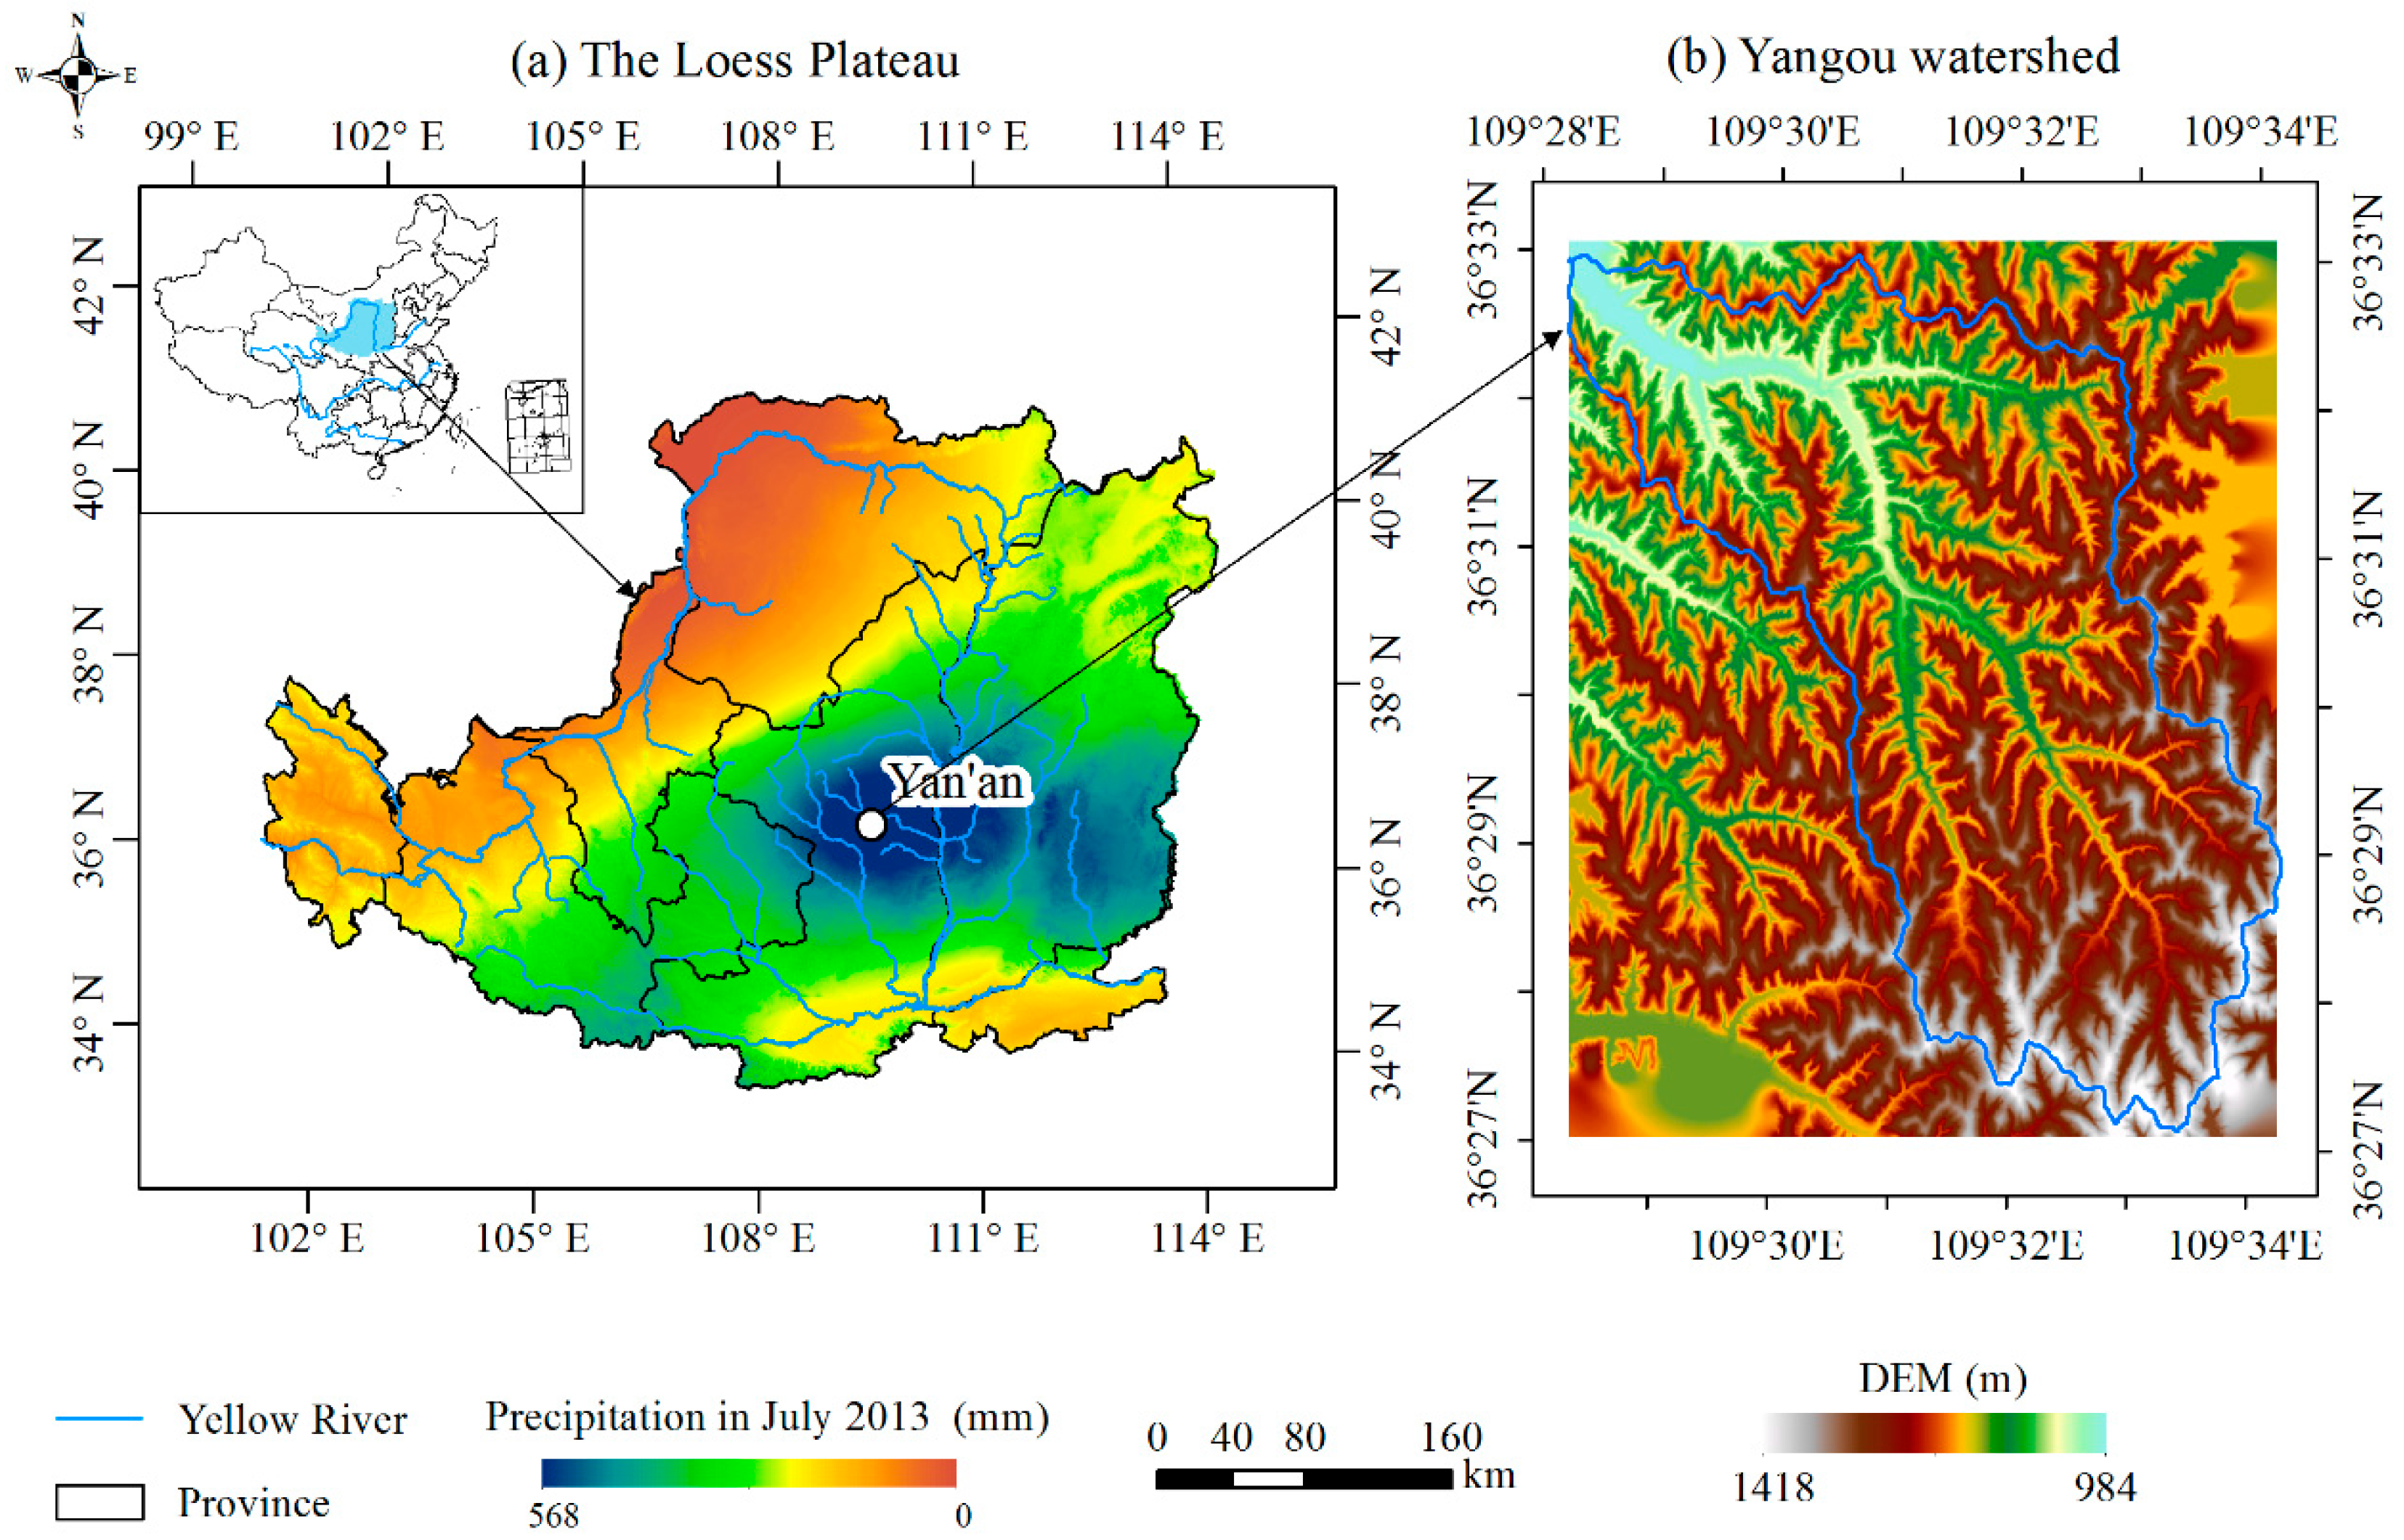
Landslides represent a major geological hazard and play an important role in the evolution of landscapes [1,2]. Landslides can be caused by a variety of natural or human-induced triggers, such as extreme rainfall, earthquakes and engineering activity, and often result in tragic casualties, tremendous economic losses and ecological environment damage [3,4,5]. In particular, numerous landslides occur in the hilly and gully regions of China’s Loess Plateau during the rainy season from July to September [6]. In July 2013, prolonged heavy rain fell over an area of approximately 37,000 km2 in Yan’an in the central part of the Loess Plateau, and this rain induced 8135 landslides, destroyed approximately 10,000 cave dwellings, displaced 160,000 residents and killed 45 people according to the local government [7]. Landslide monitoring and mapping are the most essential measures to protect against landslide hazards and improve risk management.
Landslide-related studies have examined various perspectives on landslide hazards in the geo-environmental sciences over the past two decades, such as landslide inventories, susceptibility and hazard zoning, landslide monitoring and early warning, and land risk assessment and management [8,9,10,11]. Landslide monitoring and mapping remain research hotspots because they play a fundamental role in comprehensively examining landslide mechanics and are crucial to landslide hazard mitigation [1,12]. Numerous efforts have been devoted to preparing landslide inventory maps to improve landslide risk assessment and management, reduce uncertainties and facilitate more reliable decision making [1,4,13]. Visual interpretation and field investigations have conventionally been used to produce landslide inventories [14]. This traditional method of landslide investigation is time consuming and costly, and the results are somewhat unreliable [15,16]. Therefore, early studies often focused on detecting large or individual landslides, mostly for limited areas [7,17]. Improvements in monitoring capability through the use of very high resolution imagery (e.g., 0.61 m QuickBird, 0.5 m WorldView, 2.5 m SPOT-5, 1 m Ikonos and 2 m GF-1) have enabled regional and relatively small landslide inventory mapping. Recent studies have increasingly utilized these high-resolution remote sensing images for landslide mapping and risk assessment [18,19]. The availability of very high resolution images and the development of satellite image processing techniques can allow us to produce more reliable landslide inventory maps.
Several image processing techniques can be categorized into two groups: pixel-based and object–oriented approaches. Pixel-based methods classify each pixel in the image without considering its neighborhood. Previous studies have documented conventional pixel-based approaches, including parallelepiped, minimum distance, maximum likelihood, iterative self-organizing data analysis technique (ISODATA), K-mean, etc. [20,21]. Recently, advanced pixel-based techniques, such as artificial neural networks (ANN) and support vector machines (SVM), have been applied to produce landslide inventory maps based on information-rich high-resolution imagery [22,23]. However, the abilities of these methods to describe a landslide are somewhat limited. The landslide results are not suitable for identifying landslide boundaries [16]. These classifications only rely on spectral signatures, which are not suitable for characterizing geomorphic processes such as landslides [24,25]. In addition, the outputs from pixel-based methods are typically difficult to verify on the ground [14]. Object-oriented approaches (OOAs) can incorporate a multitude of diagnostic landslide features, including its spectral, textural, morphological and topographic characteristics. Previous works have proven these methods’ abilities to successfully detect landslides by quantifying various diagnostic landslide features [14,24,26]. OOAs have been used to detect landslides and have been shown to perform better than pixel-based methods [27]. Classifications from OOAs can be 15%–20% better than those from pixel-based techniques [16]. Rau et al. [15] created a landslide inventory map using an OOA by combining optical ortho-images and a digital elevation model. Li et al. [28] proposed a semi-automated approach for landslide mapping using change detection applied to bi-temporal aerial orthophotos. However, these approaches mainly depend on knowledge that has been developed by experts for the detection of landslides [15,29]. The identification capacity for landslides must be further validated in other areas and requires a comprehensive understanding of all potentially useful landslide characteristics.
Landslide hazards in China have exhibited a sharp increase since the 1980s [17]. The most serious landslides have occurred in western China and are always catastrophic because of their large affected areas and the number of fatalities [30,31]. Numerous studies have investigated these large-scale landslides triggered by earthquakes together with prolonged rainfalls. Representative examples include the “Wenchuan” earthquake, a catastrophic earthquake that occurred on 12 May 2008 and measured Ms 8.0 in surface wave magnitude [32,33], and the “Zhouqu” debris event, a catastrophic debris flow that occurred on 7 August 2010 and was triggered by a rainstorm with an intensity of 77.3 mm·h−1 [34]. Loess landslides comprise an area of 6.3 × 10⁵ km2 and have been extensively investigated; however, the loess landslide inventory is essentially based on a field-based method [7,35]. Since the implementation of the “Grain to Green” project, which was launched by the Chinese government in 1999, soil erosion on sloping areas has been comprehensively controlled; however, gravitational erosion, such as loess landslides from extreme precipitation events of the Loess Plateau, occurs more frequently [36]. The spatial distribution and mechanisms of loess landslides remain poorly understood because of inadequate investigation and limited knowledge of the nature of loess landslides [7]. Thus, we must study how to more quickly obtain results for loess landslides over a large area with automated/semi-automated methods instead of manual approaches.
The purpose of this study is to provide an effective approach to recognize and map loess landslides by analyzing recognition indices to determine the parameters and their corresponding thresholds. We quantitatively assessed the ability of identification parameters, including spectral, textural and morphometric features, to distinguish landslides from their surroundings using GF-1 satellite imagery combined with a DEM.
2. Materials and Methods
2.1. Study Areas
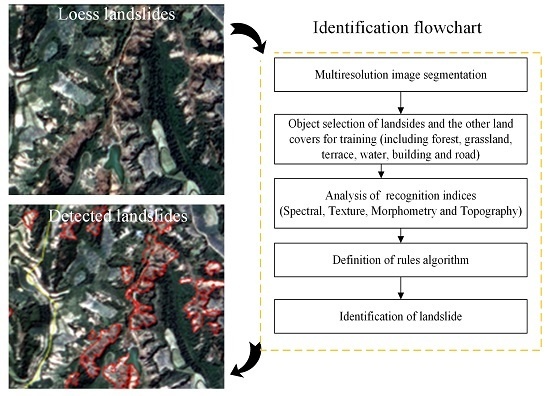
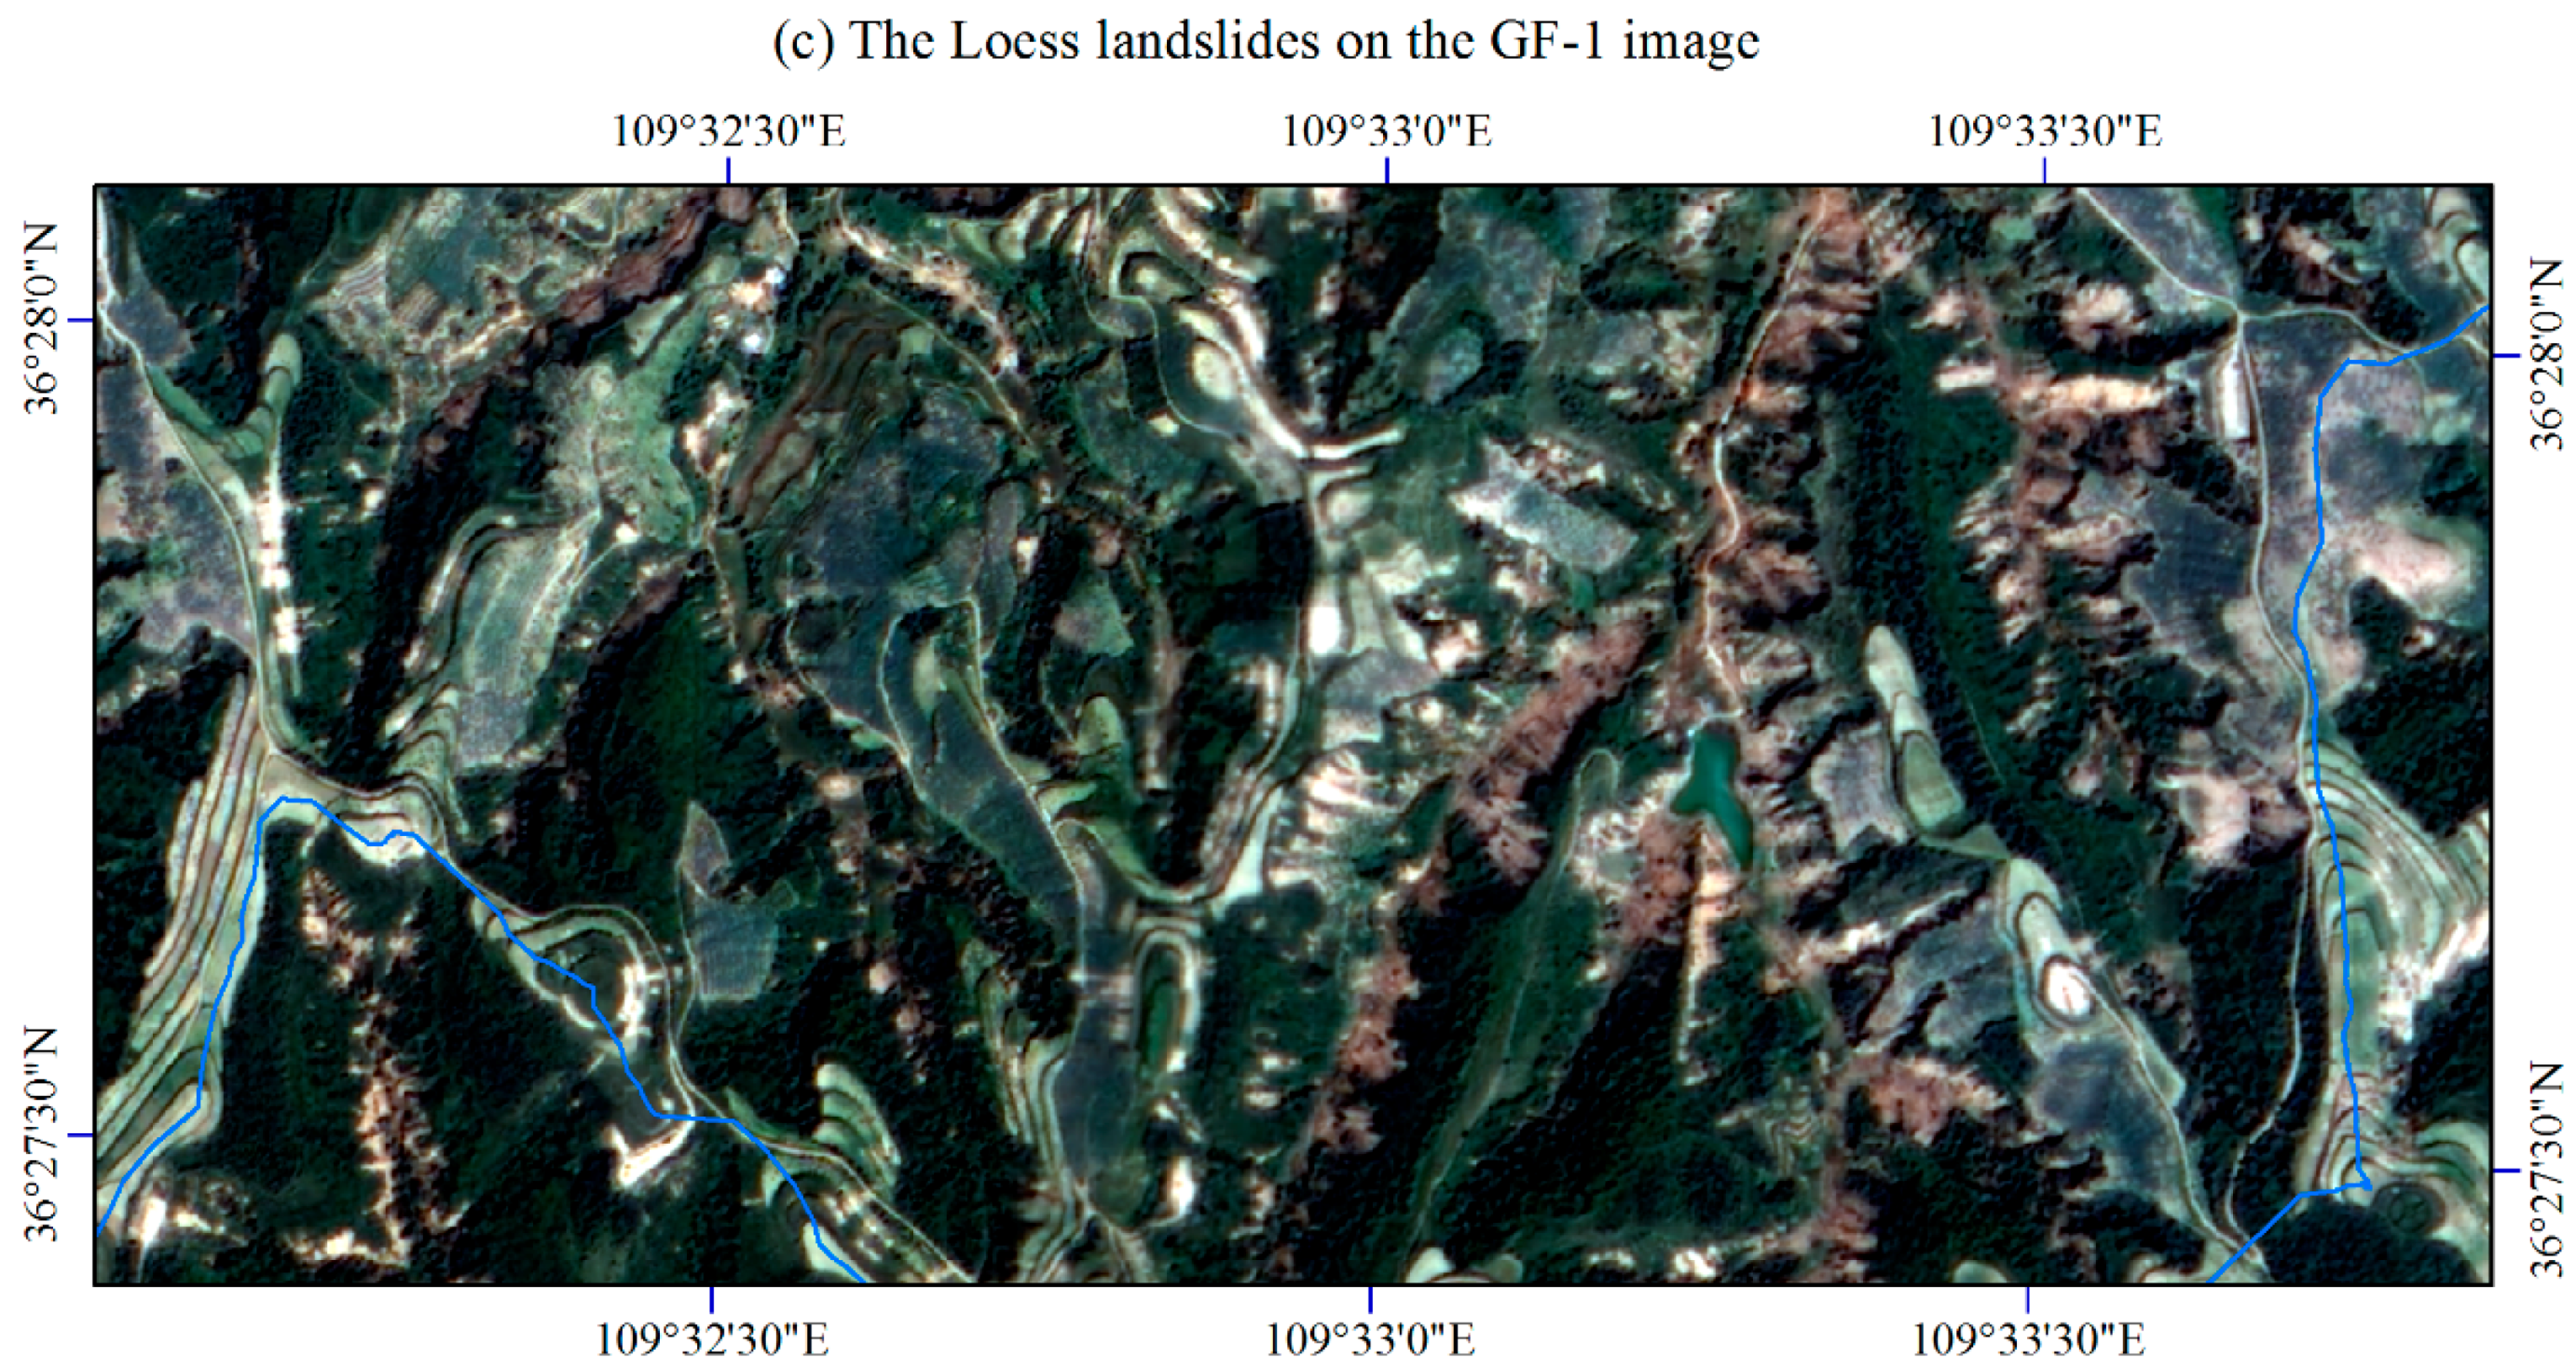
The study area is located in the Yangou watershed (36°27′N to 36°33′N, 109°28′E to 109°35′E) in Yan’an prefecture, which is in a hilly region that is dissected by numerous gullies on China’s Loess Plateau (Figure 1a,b). The watershed measures 48.0 km2; its topography is complex, and the gully density is 2.74 km·km−2 [37]. The study area includes a variety of land uses, such as farmland, orchard, grassland, shrubs, and forest, which are primarily distributed across three topographic positions, i.e., summits, slope areas, and gullies. Most of the farmland is located on summits and in gullies with relatively wide and flat land and better road development. Orchards are cultivated on summits and areas with slopes less than 25°. Areas with grass, shrubs and forests are primarily located on slopes and in gullies. The exploitation of oil and the expansion of orchards and built-up areas into landslide-prone areas have produced instabilities in potentially unstable slope areas. Loess landslides (Figure 1c) from heavy and prolonged rainfall are the most serious widespread natural hazards and have caused substantial losses of life and property in recent decades [7,35]. The investigation of landslide hazards and their prevention represents an urgent task.
2.2. Proposed Approach
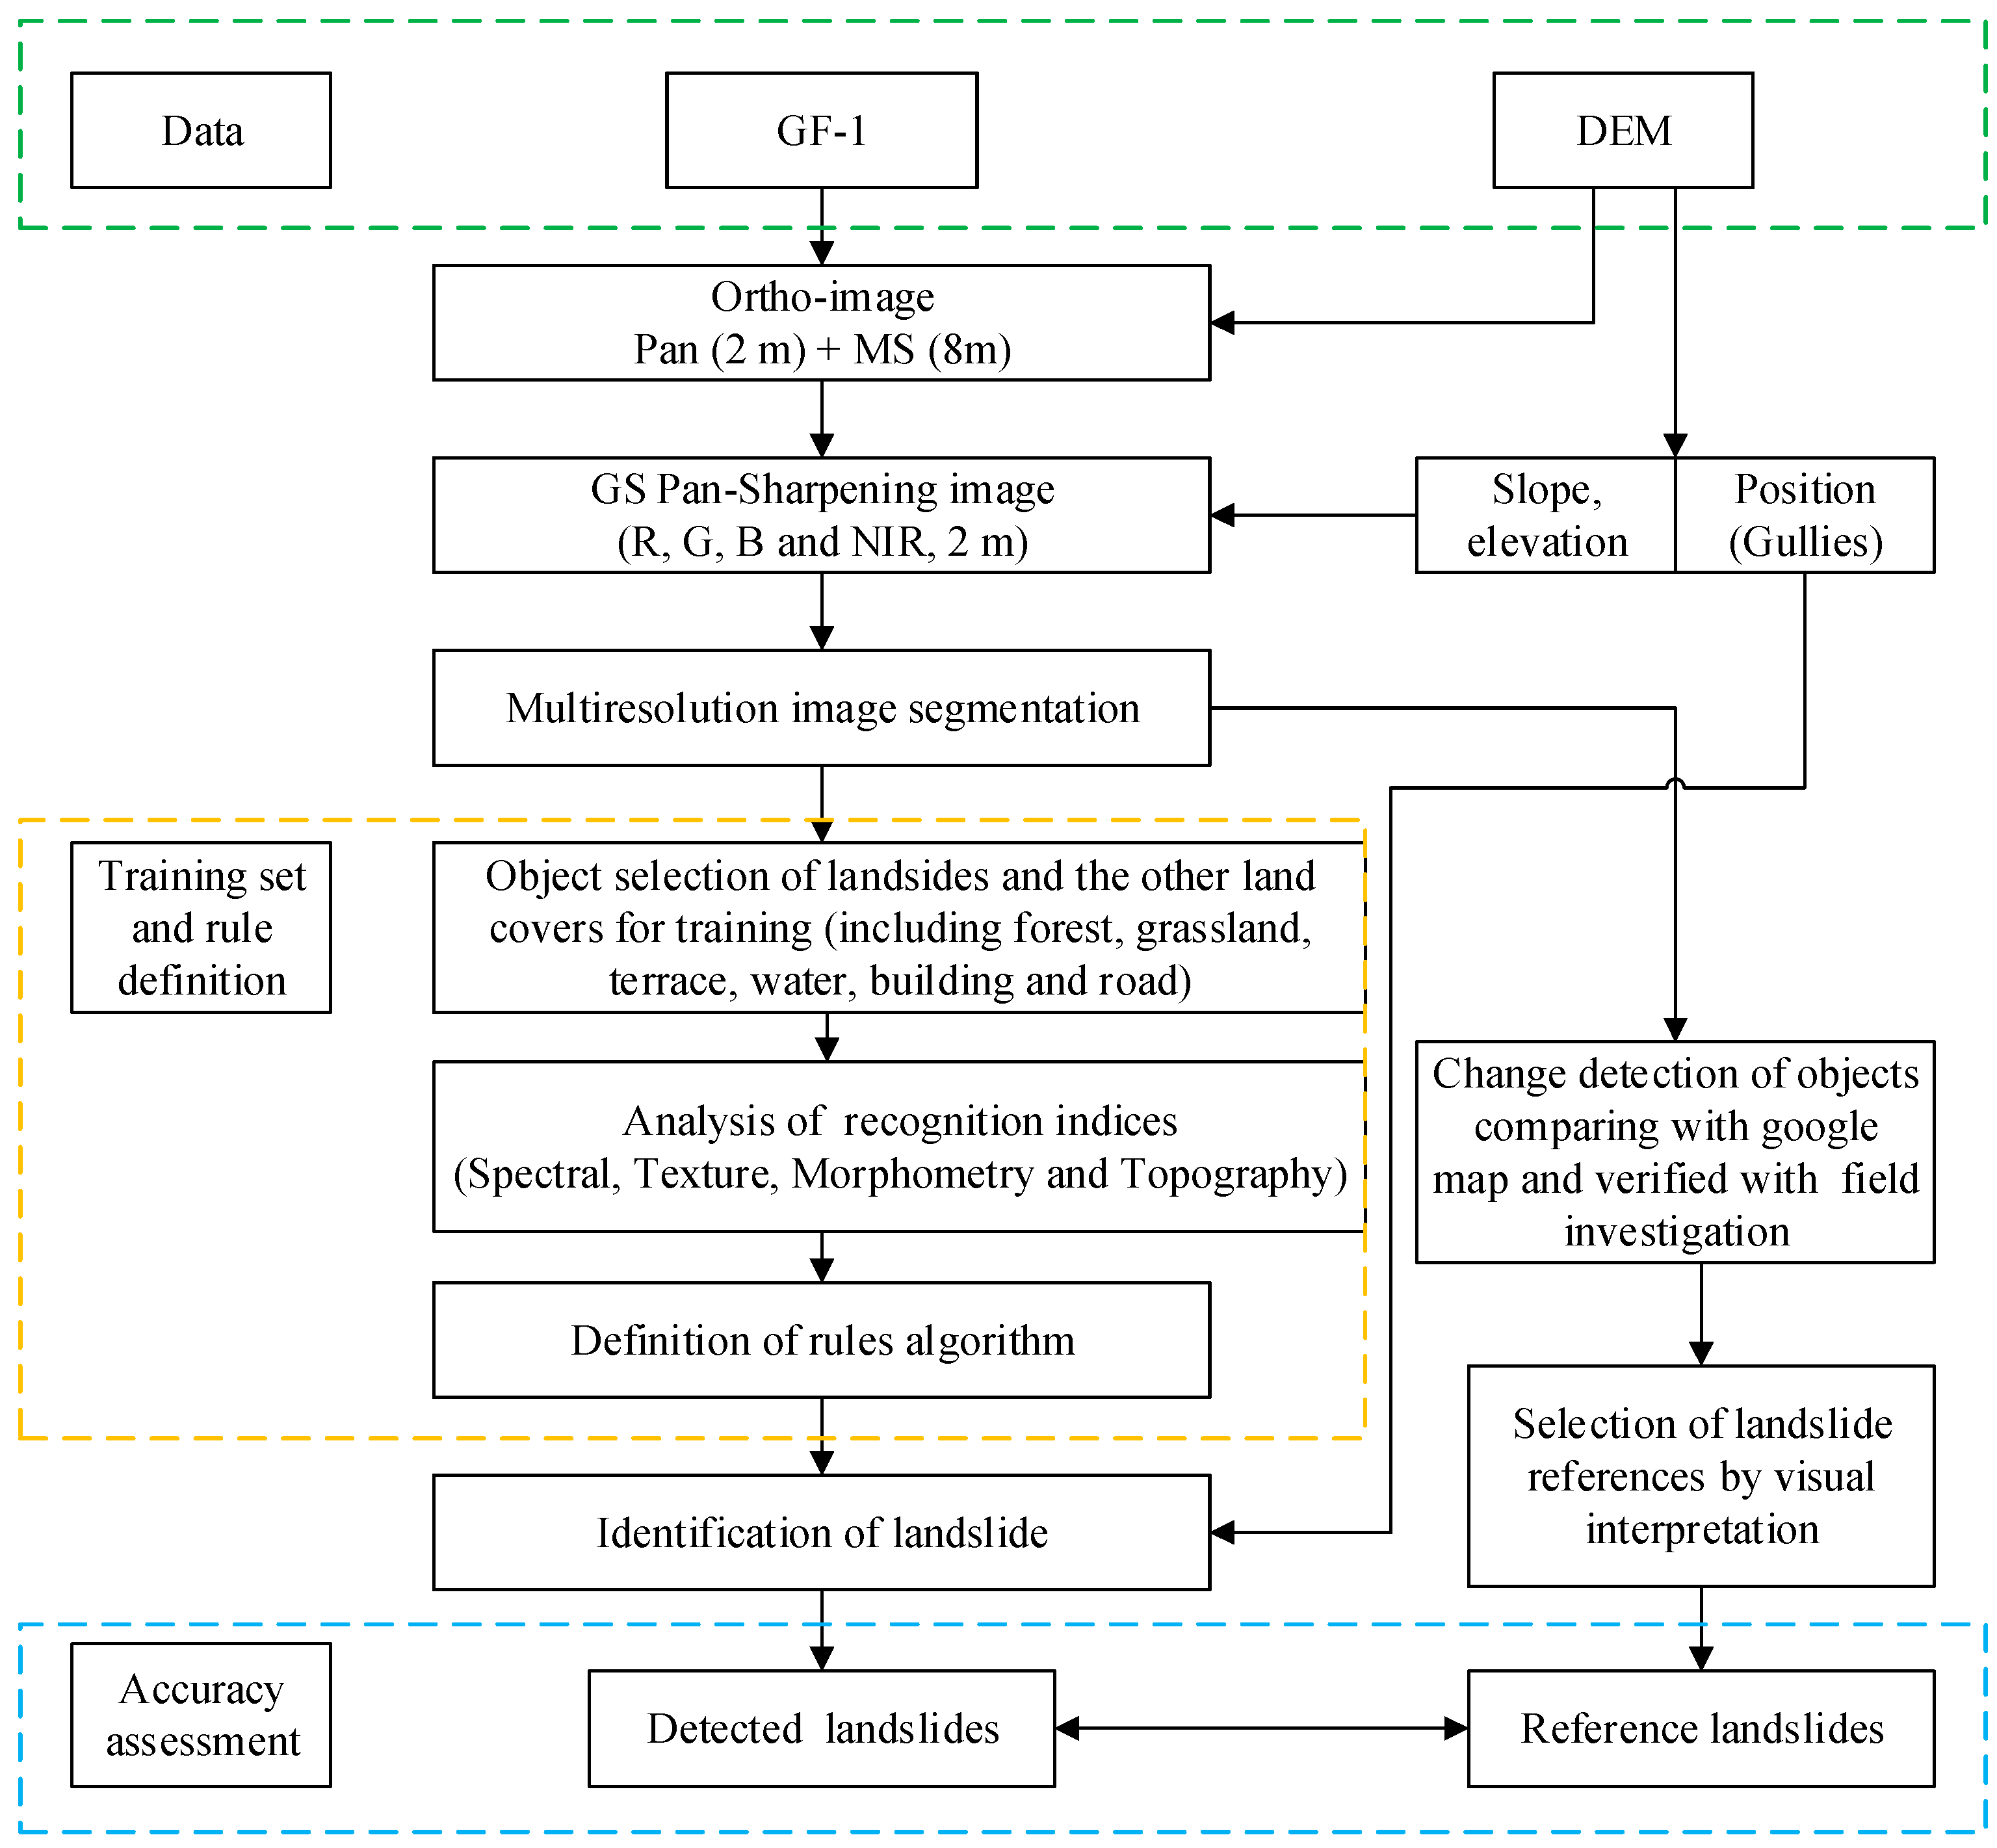
A flowchart of the landslide recognition scheme is shown in Figure 2. In the beginning, GF-1 images were pre-processed, including an atmospheric correction, orthorectification, and they were fused using the Pan-Sharpening method. The slope gradient and position were derived from the DEM. Synthetic high-spatial-resolution ortho-images combined with topographic slope and elevation were adopted within the multiresolution image segmentation. Then, two more steps were performed for recognition analysis of indices based on the training samples and establishment of the identification rules. Finally, landslide detected accuracy was assessed by comparing with a landside reference map, which was interpreted by a change detection before and after the landslide events and verified with field investigations.
2.2.1. Data Sources and Processing
GF-1 satellite imagery was used in the study to extract the spectral diagnostic features of loess landslides. This imagery was produced by the first satellite to equip a high-resolution land-observation system in China, which launched in April 2013. The satellite is equipped with two imaging systems, namely, the Panchromatic (2-m resolution) and Multi-Spectral (8-m resolution) systems. The GF-1 dataset used in our study was acquired on 15 August 2013 and was made available by the satellite environment center of the Ministry of Environmental Protection. The surface reflectance data of the acquired GF-1 imagery were obtained following radiometric calibration and atmospheric correction, which were performed with the available GF-1 calibration coefficients and the ENVI FLAASH module [38]. Furthermore, the GF-1 imagery was georeferenced and orthorectified using the 5-m DEM created from a 1:10,000 topographic map. Finally, the high-spatial-resolution multispectral GF-1 imagery was enhanced by combining 2-m resolution panchromatic and 8-m resolution multispectral data with the ENVI Gram-Schmidt Pan-Sharpening module [39].
A high-precision DEM with 5-m spatial resolution was used to calculate the topographic parameters of loess landslides in the study. This DEM was a hydrologically correct DEM that was created from 1:10,000 contour lines, which were obtained from the Shaanxi Administration of Surveying, Mapping and Geo-information using the ANUDEM software [40]. The hydrological boundary of the Yangou watershed and streamlines were derived from a DEM using the ARCGIS software. Then, derivatives such as topographic slopes and positions were calculated. These topographic variables were integrated to separate landslides from their surroundings.
2.2.2. Object-Oriented Analysis and Segmentation Techniques
An OOA can integrate different types of datasets, such as spectral, textural and topography datasets [41]. Our analysis was conducted using the ENVI Feature Extraction module, which enables segmentation of multi-band images into spectrally diverse components by including spectral characteristics, surface textures and an option to include topographic information in the analysis. It is not practical to attempt to outline landslides using single segmentation because of land cover variability. Therefore, multi-scale segmentation and merging were needed to obtain proper landslide candidate objects, which were controlled by scale, shape, color and compactness parameters. Once objects are appropriately outlined, attribute values for each derived object can be calculated by the ENVI Feature Extraction module.
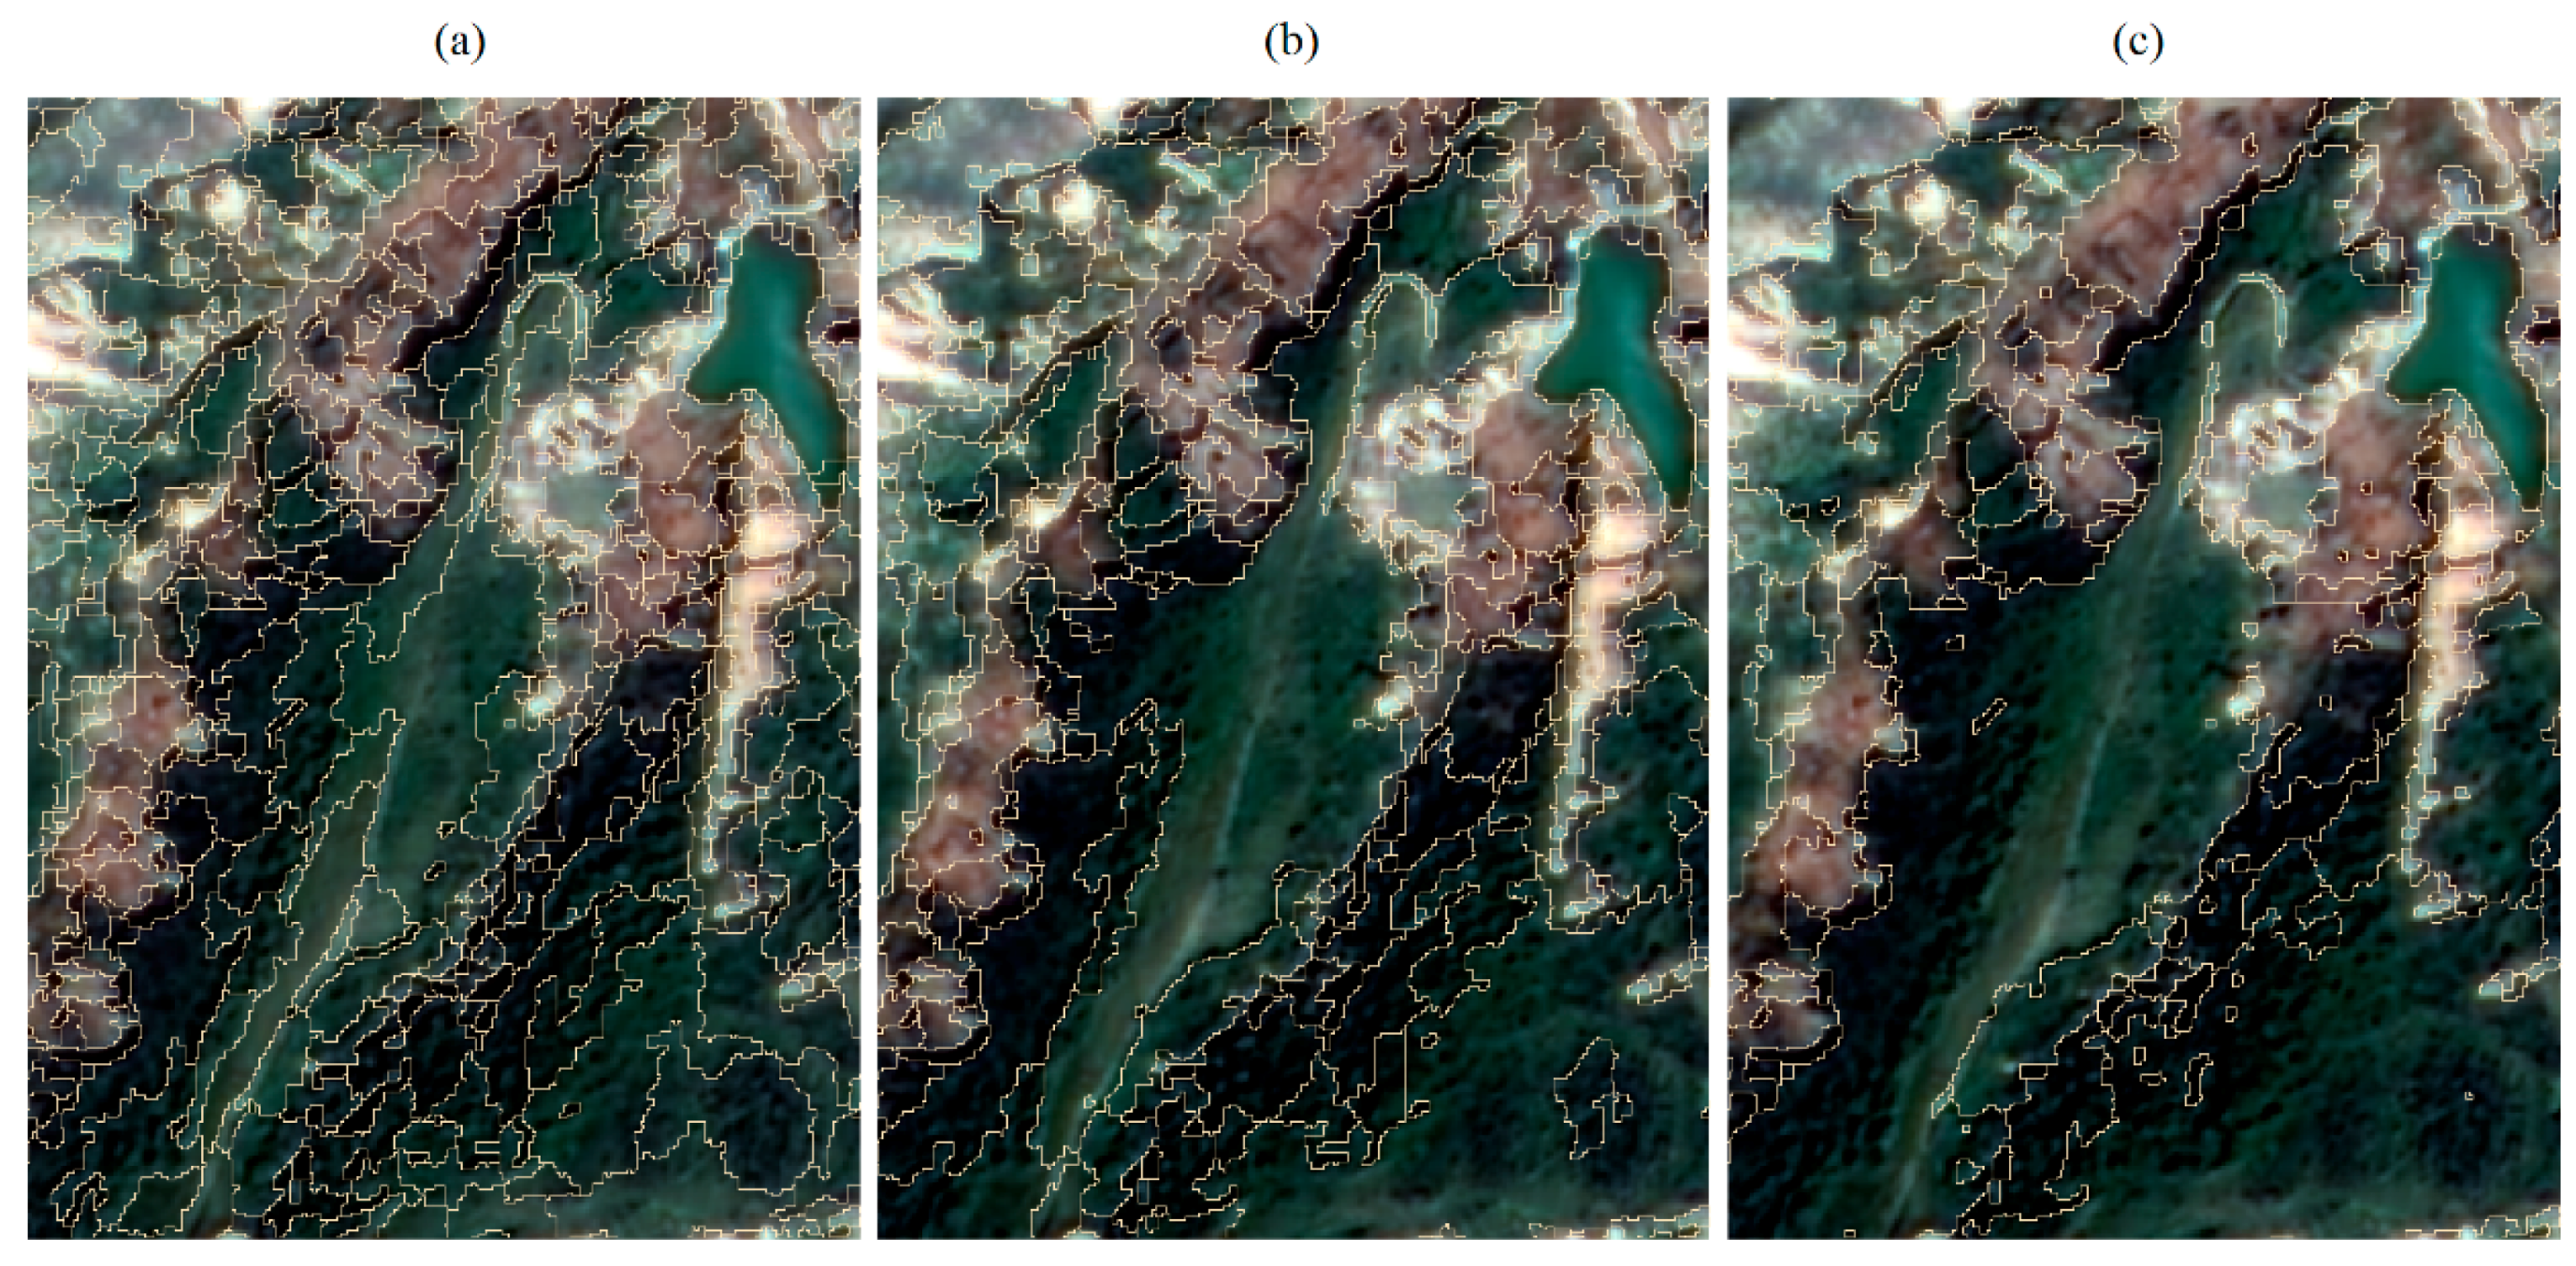
Multi-scale segmentation and merging were performed to determine favorable loess landslide objects based on GF-1 synthetic high-spatial-resolution imagery (2-m resolution). The scale parameter is highly correlated with the spatial resolution of an image but might not be directly linked to a certain object. To find an appropriate scale value, exhaustive testing and visual verification must still be performed. A trial-and-error method based on scale gradients was adopted to find an approximate and reasonable scale parameter in this paper. Scale segmentation effects related to over-segmentation (a scale value of 15), suitable segmentation (a scale value of 36.8) and under-segmentation (a scale value of 50) are illustrated in Figure 3. Landslide objects with a segmental scale parameter of 15 were sufficiently fine for the same object to be divided into several parts (Figure 3a), those with a segmental scale parameter of 36.8 were suitable to effectively delineate landslides (Figure 3b), and those with a scale parameter of 50 were sufficiently coarse for non-landslide areas to be divided into landslides (Figure 3c). The option for a smaller scale was more conducive to maintaining the purity of landslide objects, delineating the landslides, and depicting the relevant spectral, spatial, and textural properties of loess landslides.
2.2.3. Identification Indices of Loess Landslides
The spectral, textural and some morphometric characteristics of loess landslides were analyzed by comparing landslides and other diverse land covers. The other land covers used for the comparison were selected by the same method adopted for the landslides training set. Table 1 shows the diagnostic indices or quantitative criteria used to characterize landslides based on spectral, texture, and morphometric features used in the study. Topographic attributes, such as slope and position, can be used for classifying landslides and loess flows because the landslides always occur on the sloped areas, and the flows mainly concentrate in the gullies.
2.2.4. Accuracy Assessment
The accuracy assessment was performed using an independent inventory as a landslide reference. This inventory was prepared through heuristic interpretation of images aided by field investigation. Landslide reference objects and ortho-images were rendered on the corresponding DEM in a 3-D visualized environment and were intuitively and accurately selected through visual interpretation. Field investigations of loess landslides within the watershed in November 2013 were also conducted to interpret landslide reference objects in the image. Furthermore, we performed a comparative analysis by using the extracted landslide references with Google Earth maps before the landslides occurred.
Accuracy assessments were performed through an area-based confusion matrix. Some accuracy indices that were recommended by Rau et al. [15] were evaluated in this study, such as the user accuracy (UA), producer accuracy (PA), branching factor (BF), miss factor (MF), quality percentage (QP), and kappa index. Their definitions are stated in the following equations:
where TP is a true positive, TN is a true negative, FP is a false positive, FN is a false negative, and TA is the total of an area.
3. Results
3.1. Identification of Spectral, Texture and Morphometric Characteristics of Loess Landslides
The spectral reflectance in Figure 4 is illustrated by using box plots to distinguish different types of land cover in the Yangou watershed. The NDVI was found to be useful for discriminating landslides from vegetation cover and water areas (Figure 4a). The values of NDVI for landslides were between 0.13 and 0.34, whereas those for forest (0.67–0.78) and grassland (0.56–0.68) were much higher. The NDVI values for terrace ranged from 0.24 to 0.58 and can be partly discriminated from landslides due to their partly overlapping distributions. Water areas exhibited strong spectral absorption characteristics; therefore, they can be easily removed. We also found that loess landslides have a much higher reflectance in the visible channels (blue, green and red) compared to vegetation cover (Figure 4b–d) and therefore can also be easily discriminated based on their reflectance features. The reflectance values of roads ranged from 0.09 to 0.12 in the blue spectral region, larger than those of the loess landslides (0.06–0.10) (Figure 4b). Based on the blue reflectance differences between landslides and roads, considerably large areas covered with roads can be removed. Eliminating terraces, water areas and buildings from landslide candidates by using the reflectance characteristics in the visible spectral region was difficult (Figure 4b–d). Terrace areas and buildings could be partly removed in the near-infrared band from landslide candidates (Figure 4e). The reflectance values of terraces in the near-infrared region ranged from 0.23 to 0.33, being higher than loess landslides (0.14–0.25). The results for discriminating terraces from landslide candidates in the near-infrared region were better than those for NDVI, which combined spectral information in the red and near-infrared bands. The least distinct characteristics between landslides and terraces in the red band decreased their detection capacity. The reflectance values for buildings ranged between 0.06 and 0.18 in the near-infrared regions and could be applied to discriminate buildings from landslide candidates (Figure 4e). New bands for the hue, saturation, and intensity were created and applied by using a color-space transformation from RGB to HIS (Figure 4f–h). Based on the observations for hue, saturation, and intensity for these different types of land covers, the transformations were not recommended in this application to discriminate landslides from other types of land covers in addition to forest and grassland because these land cover types had substantially overlapping distributions of hue, saturation, and intensity.
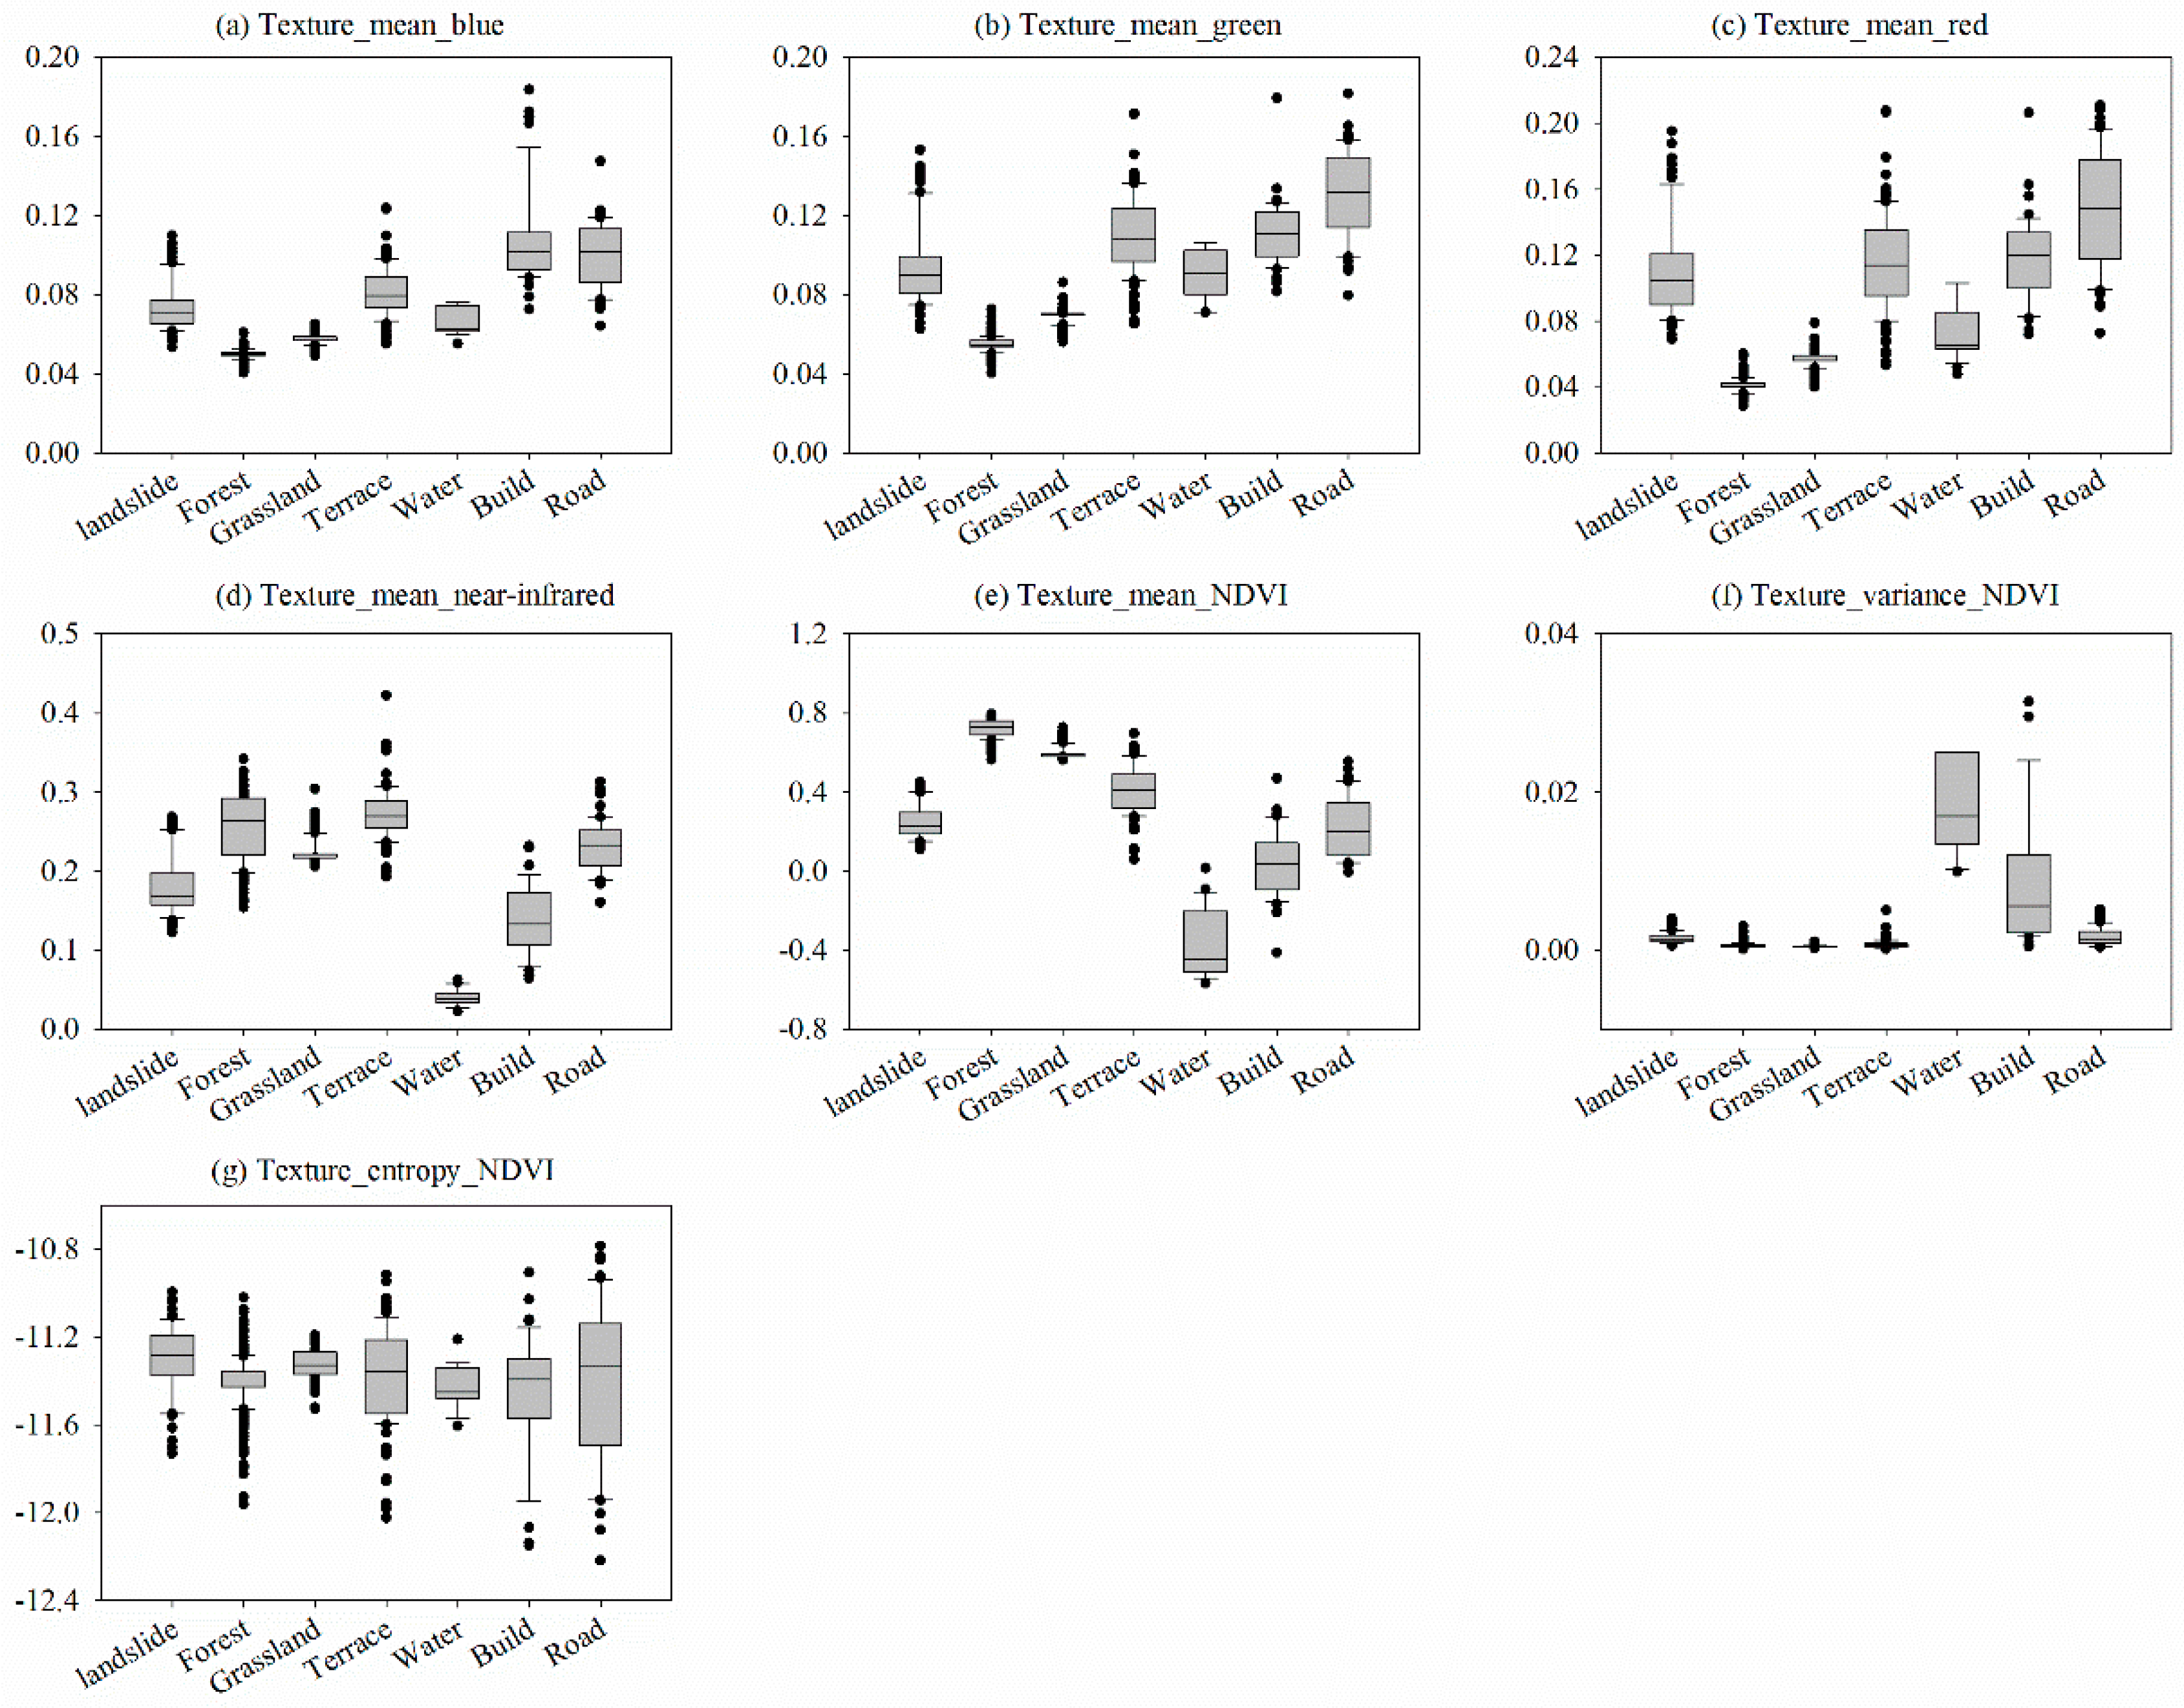
The texture in an image, namely, the frequency of combinations of grey levels, was calculated by using a grey level co-occurrence matrix (GLCM), which was also applied as a diagnostic feature for landslides and other types of land covers (Figure 5). The means of the textures in the visible spectral region (blue, green and red) can clearly discriminate forests and grassland from landslide candidates because of their lower values compared to landslides (Figure 5a–c). Water areas had the lowest texture values (less than 0.06) in the near-infrared band among these land cover types and could be easily detected (Figure 5d). The texture values of terraces were between 0.24 and 0.31 in the near-infrared region, higher than those of landslides (0.14 to 0.25), and could also be applied to distinguish terrace areas from landslides but had minimal overlapping distributions for values between 0.24 and 0.25 (Figure 5d). The mean texture values of NDVI could also be used to discriminate forests, grassland, water areas and even some terraces from landslides (Figure 5e). A comparison of texture variances of NDVI revealed the characteristics of these land cover types and enabled differentiation among landslides, water areas and buildings (Figure 5f). The texture variances of the NDVI of landslides were less than 0.0025, being much lower than those of water areas (0.01–0.025) and buildings (0.002–0.024, minimal overlap). The application of the texture entropy of NDVI produced strongly overlapping results for these land cover types; none proved to be suitable for distinguishing these types (Figure 5g).
Morphometric features can potentially improve classification in OOAs and were also applied to detect landslides in this study (Figure 6). The morphometric characteristics of landslides, such as area, length and compactness, can be used to discriminate grassland from landslide candidates (Figure 6a–c). The area and length of loess landslides were much smaller than those of grassland (Figure 6a,b). The compactness of the landslides ranged from 0.13 to 0.21, higher than those of grassland (Figure 6c). These morphometric characteristics were not suitable for distinguishing between landslides and forests because nearly half of their distributions overlapped (Figure 6a–c). Water areas could also be removed from landslide candidates according to their area and length ranges (Figure 6a,b). No land cover type could be distinguished by using the characteristics of solidity (Figure 6d). Most roads could be removed based on the parameters of roundness and elongation because road objects have much lower roundness and higher elongation compared to loess landslides (Figure 6e,f). Buildings were not completely differentiated from loess landslides through the application of rectangular-fit, although they have relatively regular shapes (Figure 6g).
3.2. Topography Characteristics of Loess Landslides
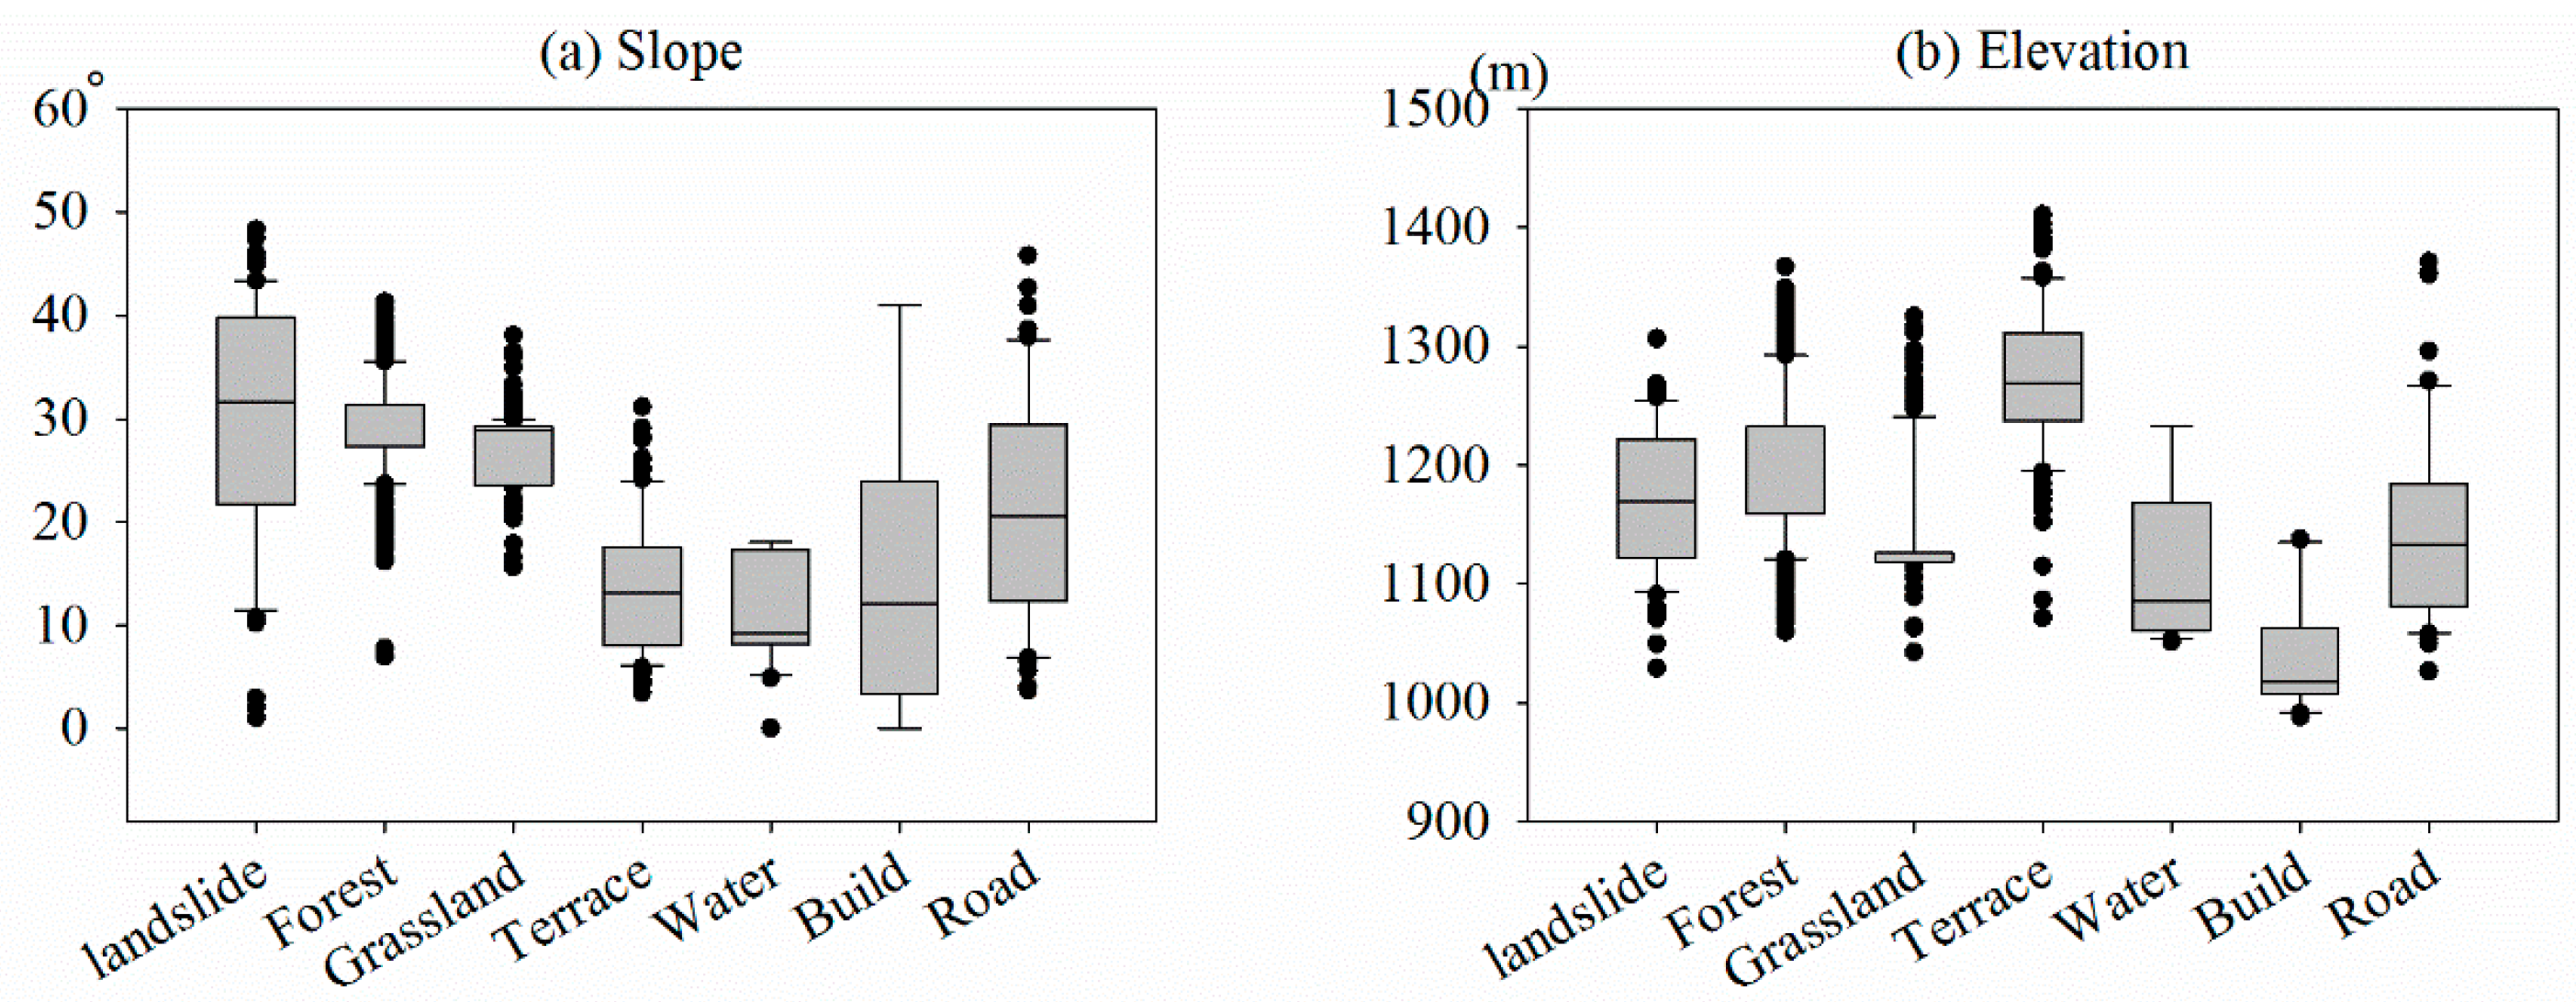
A set of topography variables that were derived from DEMs were applied to separate loess landsides from their surroundings and are illustrated in Figure 7. Loess landslides usually occur along hill slopes with slopes that range from 10° to 45° (Figure 7a) and with elevations between 1100 and 1250 m (Figure 7b). The gentle to moderate slopes (less than 25°) in our study were often converted to terraces for agriculture purposes and orchards (Figure 7a). In addition, these terraces were constructed on the summits of hill slopes and therefore were located at the highest elevations (more than 1200 m) compared to other land covers (Figure 7b). Although these characteristics of the terraces can thus serve as diagnostic features to enable discrimination from landslide candidates, there were more overlapping distributions between landslides and terraces; thus, they cannot be completely separated from each other in these regions. The large areas of buildings could be separated from landslide candidates because these structures are often built near relatively broader gullies and at lower elevations of less than 1130 m (Figure 7b).
Landslide materials, which usually accumulate or flow along gullies in the hilly and gully regions of the Loess Plateau, often combine with sloping landslides and exhibit similar spectral characteristics (Figure 8). When multi-scale segmentation is applied, these materials can be combined together as an object. Discriminating slopping landslides from loess debris flows was found to be difficult. To obtain more reasonable results for loess landslides, we extracted their topographic positions from DEMs, such as those of gullies (Figure 8a), and separated loess landslides from loess debris flows in the gullies (Figure 8b).
3.3. Rules for the Discrimination of Landslides and Other Land Covers
The following algorithm was established based on the identifiable spectral, texture, morphometry and topography characteristics of loess landslides and other land cover types (Table 2):
Landslides = (0.13 < NDVI < 0.34), (0.06 < Blue < 0.10, 1.08 < Elongation < 2.48, and 0.24 < Roundness < 0.62), (0.14 < Near infrared < 0.25, 1100 < Elevation < 1250), and (Variance of texture NDVI < 0.0025)
- (1)
- The values of NDVI are greater than 0.13 and less than 0.34. Forest, grassland and water areas can be completely removed.
- (2)
- The spectral values of the blue band were between 0.06 and 0.10. Elongation was higher than 1.08 and lower than 2.48. In addition, roundness was restricted to within 0.24–0.62. Considerable portions of roads could be distinguished.
- (3)
- The spectral values of the near-infrared band can range from 0.14 to 0.25, and the elevation can vary from 1100 to 1250. Most areas containing terraces and buildings can be discriminated from landslide candidates.
- (4)
- The variance of the NDVI texture was less than 0.0025. A portion of the buildings can be further removed.
- (5)
- A cleanup operation was performed to eliminate non-landslide areas occupying parts of an object.
- (6)
- Finally, hillslope landslides were separated from loess flows using the extracted gullies.
3.4. Detected Loess Landslides and Accuracy Assessment
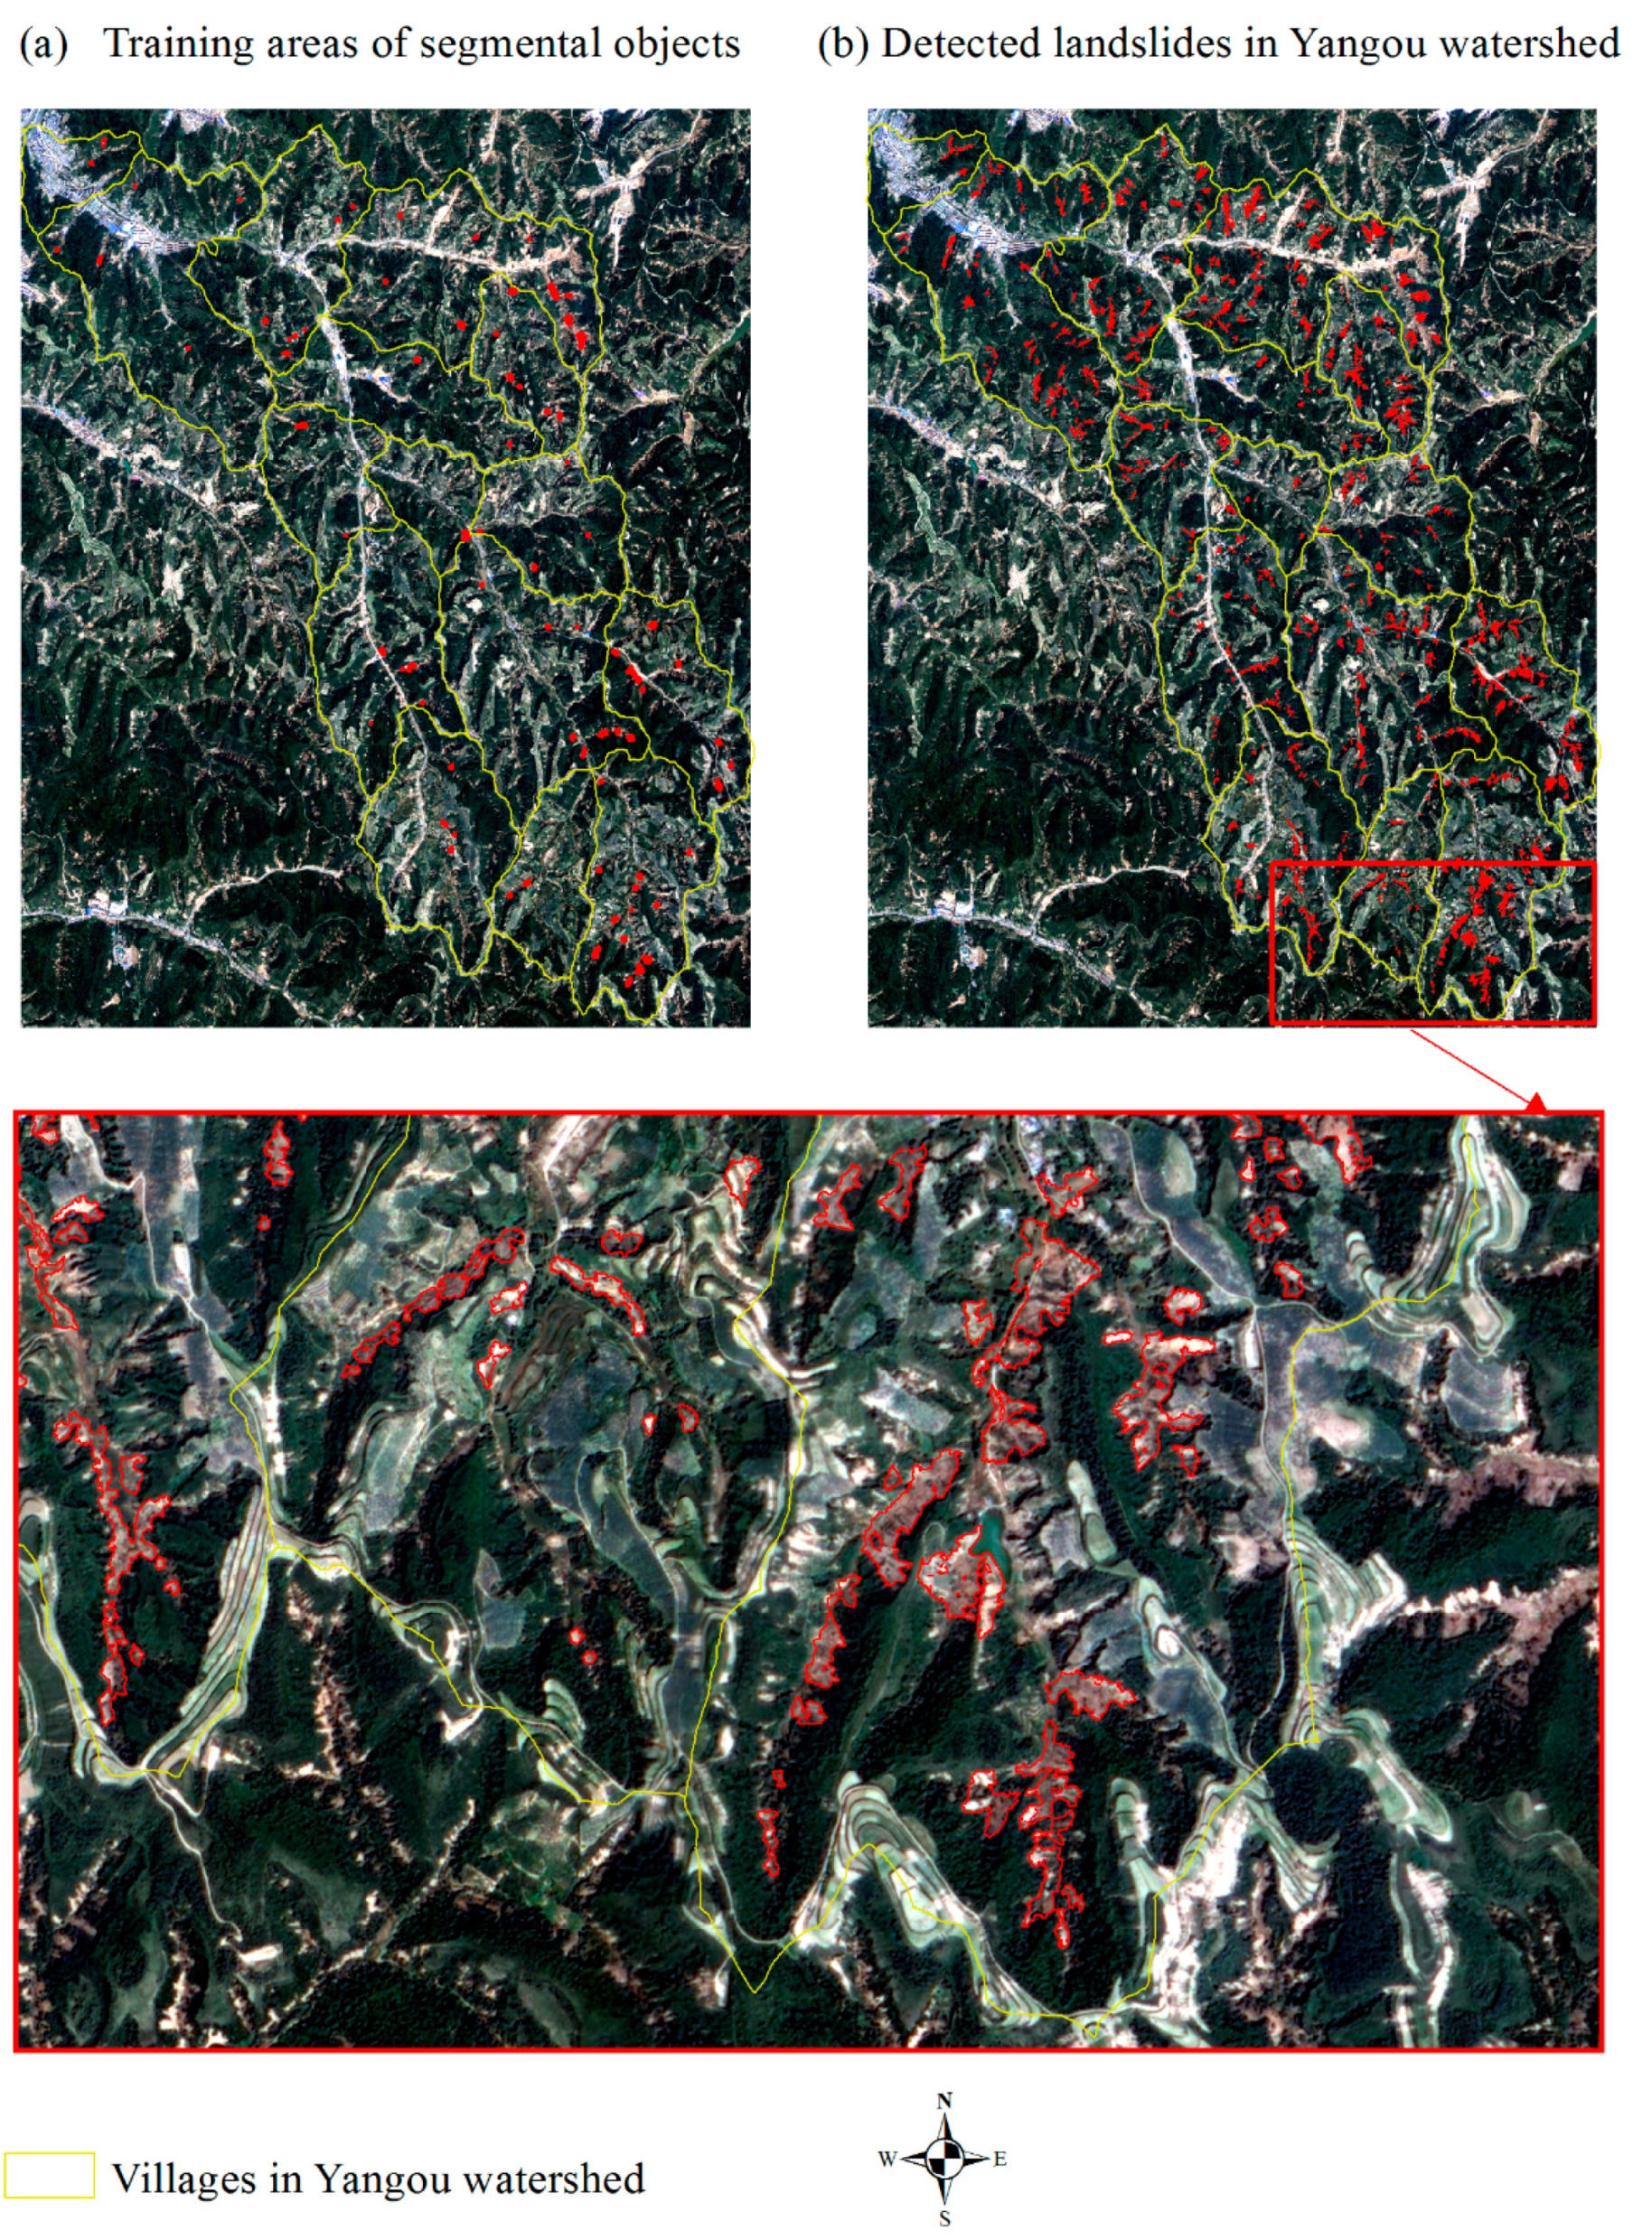
The landslide detection results and accuracy assessments are illustrated in Table 3. The training areas of landslide objects (Figure 9a), which depended on the sizes of villages and quantity of landslides, ranged between 0.05% and 0.70% among the villages in the Yangou watershed, with the total training area comprising 3.62% of the total study area. The detected landslides (Figure 9b) in the Yangou watershed measured 2.05 km2, less than that of the landslide references (2.30 km2). The UA (0.97) and PA values (0.91) were high, which presented lower rates of commission and omission errors. The BF (0.03) and MF values (0.10) were very low, which indicated that the amount of incorrectly categorized and missed landslide pixels was very low and represented a better algorithm for landslide detection. The QP values were all greater than 0.80, and the kappa indices were all higher than 0.85, indicating better landslide detection with the proposed approach.
4. Discussion
OOA approaches have proven to be effective and useful high-spatial-resolution imagery processing techniques for extracting landslides according to previous studies [15,29]. More reasonable and accurate landslide classifications can be achieved with OOA approaches [16]. In particular, spectral information from landslides and some topographical variables can be integrated with OOAs to greatly improve the identification of landslide. The current major issues of landslide identification with OOAs include the selection of training samples, determination of threshold values, and choice of diagnostic features and a semantic network for classification [15]. Previous approaches for the recognition of landslides were mainly derived from knowledge that was developed by experts for the detection of landslides [14,15,28]. In our study, we quantitatively analyzed the spectral, textural, and morphometric properties of loess landslides and topographic characteristics. Furthermore, an appropriate algorithm was developed for the extraction of loess landslides, which were determined from a few training samples (averaged for 3.62% of the total study area in Table 3). The identification algorithm of landslides was validated in the hilly and gully loess regions, and the results represented a good assessment (i.e., the QP values were all greater than 0.80 and the kappa indices were all higher than 0.85 in Table 3). These accuracy assessments indicated better landslide detection when using the proposed approach.
The NDVI was found to be a very useful method and was considered as an initial criterion in our study, although certain other diagnostic features can also discriminate loess landslides from vegetation cover and water areas (Figure 4, Figure 5 and Figure 6). The hill slopes were exposed after landslide events and exhibited lower reflectivity characteristics compared to surrounding areas covered with vegetation. These changes to the land covers could be best represented by NDVI, which has also been successfully used by previous studies [14,15]. In our study, we used NDVI as a diagnostic feature to discriminate loess landslides from vegetation cover and water areas (Figure 4a). The brightness, or the weighted average of the image intensity, has been used as a spectral diagnostic feature in previous studies. Martha et al. [14] used the brightness as a diagnostic feature to remove shadows and rocky areas; shadows have lower brightness and rocky areas have higher brightness compared to landslides. Rau et al. [15] believed that the brightness was sometimes more significant than the NDVI when filtering out vegetation areas and bare soil, except for removing shadows and clouds. In our study, we found that the brightness (intensity) can remove most of the vegetation areas (forest and grassland) and small parts of roads from landslide candidates (Figure 4h). However, this diagnostic feature was not recommended in this study because the brightness for these land covers, such as forest and grassland, had substantially overlapping distributions with those of landslides (Figure 4h) and had relatively poorer ability to distinguish landslides from vegetation areas compared to NDVI (Figure 4a,h). In addition, clouds did not exist, and shadows were not obvious in the acquired GF-1 image, so the brightness feature was not used in the study.
The texture has seldom been applied in previous studies as a diagnostic feature for landslides and other types of land covers. Martha et al. [14] used the texture means of the red band to discriminate terrace patterns, which exhibit unique textures (terraces are parallel to contours, and their width is largely uniform), in a Resourcesat-1 image with 5.8-m spatial resolution. Our results confirmed that the texture means in the near-infrared region can also be applied to distinguish terrace areas (0.24 to 0.31) from landslides (0.14 to 0.25) in high-spatial-resolution images (GF-1, 2 m), although they have minimal overlapping distributions (Figure 5d). Furthermore, we found that the texture variances of NDVI proved to be suitable for distinguishing landslides from buildings (Figure 5f), reflecting the larger heterogeneity of buildings compared to other land covers.
The topographic slope is usually used as a diagnostic indicator; however, a large overlapping distribution existed between loess landslides and terraces in this study (Figure 7a). In these areas, gentle to moderate slopes (less than 25°) were often converted to terraces for agriculture purposes and orchards. Loess landslides often occurred between two sides of the slopes, and their materials were deposited into narrow gullies. When multi-scale segmentation was performed, the hillslope landslides and their deposited materials in the gully, which had smaller slopes, were often segmented as an object, thus creating a relatively large overlapping distribution of topographic slopes between loess landslides and terraces. High elongation and low roundness were found to be very helpful in identifying both major and minor roads (Figure 6f,e). An alternative and similar diagnostic feature from previous studies, namely, the length/width ratio, can also be helpful to identify roads [14]. Hill slope landslides were separated based on the topographic position (a comprehensive topographic feature of elevation, slope, etc.), which was derived from the DEM, to obtain more reasonable results and to identify and improve the recognition accuracy of loess landslides.
The mapping of loess landslides is an urgent and difficult task due to the large number of loess landslides occurring in regions with complex topographies and numerous gullies. By comprehensively analyzing the spectral, textural, morphometric and topographic properties of loess landslides, we can successfully develop a suitable algorithm to distinguish loess landslides, rationally assess landslide hazards and reduce landslide damage by adopting proper mitigation measures.
Landslide recognition is very important in loess areas. Our proposed method potentially provides a way to quantify parameters by analyzing recognition indices. However, at the present stage of development, several issues remain to be solved in the future, such as the limitations and drawbacks related to real application in other areas or for other landslide types. Thus, the parameters need to be adjusted according to the specific research situation when applied in other areas. Although the parameters and their thresholds for landslide recognition must be adjusted case by case, our method provides a concept and a similar procedure for determining parameters and their thresholds in different areas where different types of landslides can occur. Some common parameters and their thresholds can also be used in other landslide identification studies.
5. Conclusions
This paper has demonstrated the use of a combination of spectral, textural, and morphometric information and some auxiliary topographic parameters to detect loess landslides in the hilly and gully regions of the Loess Plateau. Multi-scale segmentation and merging based on an object-oriented analysis were conducted to obtain favorable loess landslide candidate objects. We quantitatively analyzed the characteristics of the spectral, textural, morphometric and topographic properties of loess landslides rather than using expert knowledge. In this study, NDVI was found to provide the best representation for separating vegetation cover and water areas from landslide candidates in the hilly and gully regions of the Loess Plateau. The spectral characteristics of the blue regions and the morphometric parameters, such as elongation and roundness, can assist in identifying roads. The spectral properties in near-infrared regions, textural variance of NDVI, and topographic elevation can be used to effectively discriminate terraces and buildings. Additionally, the partly overlapping distributions of some diagnostic features demonstrated their discriminative abilities when applied to different land covers. This method shows great potential in rapidly producing results after landslides induced by extreme rainfall events occur in the Loess Plateau.
Acknowledgments
This research was supported by the Governmental Public Industry Research Special Funds for Projects (201501049), the National Natural Science Foundation of China (41501293 and 41501022), the National Key Research and Development Program of China (2016YFC0402401) and the Special-Funds of Scientific Research Programs of State Key Laboratory of soil Erosion and Dryland Farming on the Loess Plateau (A314021403-Q2).
Author Contributions
Xingmin Mu and Wenyi Sun conceived and designed the experiments; Wenyi Sun performed the experiments and analyzed the data; and Wenyi Sun wrote the paper.
Conflicts of Interest
The authors declare no conflict of interest.
References
- Wu, X.; Chen, X.; Zhan, F.B.; Hong, S. Global research trends in landslides during 1991–2014: A bibliometric analysis. Landslides 2015, 12, 1215–1226. [Google Scholar] [CrossRef]
- Sassa, K.; Tsuchiya, S.; Fukuoka, H.; Mikos, M.; Doan, L. Landslides: Review of achievements in the second 5-year period (2009–2013). Landslides 2015, 12, 213–223. [Google Scholar] [CrossRef]
- Xu, C.; Xu, X.W.; Yu, G.H. Landslides triggered by slipping-fault-generated earthquake on a plateau: An example of the 14 april 2010, ms 7.1, Yushu, China Earthquake. Landslides 2013, 10, 421–431. [Google Scholar] [CrossRef]
- Vorpahl, P.; Elsenbeer, H.; Märker, M.; Schröder, B. How can statistical models help to determine driving factors of landslides? Ecol. Model. 2012, 239, 27–39. [Google Scholar] [CrossRef]
- Gassner, C.; Promper, C.; Beguería, S.; Glade, T. Climate change impact for spatial landslide susceptibility. In Engineering Geology for Society and Territory; Lollino, G., Manconi, A., Clague, J., Shan, W., Chiarle, M., Eds.; Springer: Cham, Switzerland, 2015; pp. 429–433. [Google Scholar]
- Buchroithner, M.F.; Changyao, W.; Hengzhang, L. Landslide Erosion in the Loess Plateau (P.R. China) by Remote Sensing. In Proceedings of the International Symposium on Geological Hazards, Beijing, China, 20–25 October 1991; pp. 550–554. [Google Scholar]
- Wang, G.; Li, T.; Xing, X.; Zou, Y. Research on loess flow-slides induced by rainfall in July 2013 in YAN’AN, NW China. Environ. Earth Sci. 2015, 73, 7933–7944. [Google Scholar] [CrossRef]
- Yang, W.; Shen, L.; Shi, P. Mapping landslide risk of the world. In World Atlas of Natural Disaster Risk; Springer: Berlin/Heidelberg, Germany, 2015; pp. 57–66. [Google Scholar]
- Kirschbaum, D.; Stanley, T.; Zhou, Y. Spatial and temporal analysis of a global landslide catalog. Geomorphology 2015, 249, 4–15. [Google Scholar] [CrossRef]
- Pradhan, B.; Buchroithner, M.F. Terrigenous Mass Movements: Detection, Modelling, Early Warning and Mitigation Using Geoinformation Technology; Springer: New York, NY, USA, 2012. [Google Scholar]
- Chen, W.; Xie, X.; Wang, J.; Pradhan, B.; Hong, H.; Bui, D.T.; Duan, Z.; Ma, J. A comparative study of logistic model tree, random forest, and classification and regression tree models for spatial prediction of landslide susceptibility. Catena 2017, 151, 147–160. [Google Scholar] [CrossRef]
- Mondini, A.C.; Guzzetti, F.; Reichenbach, P.; Rossi, M.; Cardinali, M.; Ardizzone, F. Semi-automatic recognition and mapping of rainfall induced shallow landslides using optical satellite images. Remote Sens. Environ. 2011, 115, 1743–1757. [Google Scholar] [CrossRef]
- Guzzetti, F.; Reichenbach, P.; Ardizzone, F.; Cardinali, M.; Galli, M. Estimating the quality of landslide susceptibility models. Geomorphology 2006, 81, 166–184. [Google Scholar] [CrossRef]
- Martha, T.R.; Kerle, N.; Jetten, V.; van Westen, C.J.; Kumar, K.V. Characterising spectral, spatial and morphometric properties of landslides for semi-automatic detection using object-oriented methods. Geomorphology 2010, 116, 24–36. [Google Scholar] [CrossRef]
- Rau, J.Y.; Jhan, J.P.; Rau, R.J. Semiautomatic object-oriented landslide recognition scheme from multisensor optical imagery and DEM. IEEE Trans. Geosci. Remote 2014, 52, 1336–1349. [Google Scholar] [CrossRef]
- Moosavi, V.; Talebi, A.; Shirmohammadi, B. Producing a landslide inventory map using pixel-based and object-oriented approaches optimized by TAGUCHI method. Geomorphology 2014, 204, 646–656. [Google Scholar] [CrossRef]
- Huang, R.Q. Some catastrophic landslides since the twentieth century in the southwest of china. Landslides 2009, 6, 69–81. [Google Scholar]
- Plank, S.; Hölbling, D.; Eisank, C.; Friedl, B.; Martinis, S.; Twele, A. Comparing Object-Based Landslide Detection Methods Based on Polarimetric Sar and Optical Satellite Imagery—A Case Study in Taiwan. In Proceedings of the 7th International Workshop on Science and Applications of SAR Polarimetry and Polarimetric Interferometry, POLinSAR 2015, Frascati, Italy, 27–30 January 2015; pp. 27–30. [Google Scholar]
- Hölbling, D.; Friedl, B.; Eisank, C. Object-based change detection for landslide monitoring based on spot imagery. In Proceedings of the GU General Assembly 2014, Vienna, Austria, 27 April–2 May 2014. [Google Scholar]
- Danneels, G.; Pirard, E.; Havenith, H.B. Automatic Landslide Detection from Remote Sensing Images Using Supervised Classification Methods. In Proceedings of the IEEE International Geoscience and Remote Sensing Symposium, Barcelona, Spain, 23–27 July 2007. [Google Scholar]
- Wan, S.; Lei, T.; Chou, T. A landslide expert system: Image classification through integration of data mining approaches for multi-category analysis. Int. J. Geogr. Inf. Sci. 2012, 26, 747–770. [Google Scholar] [CrossRef]
- Bui, D.T.; Tuan, T.A.; Klempe, H.; Pradhan, B.; Revhaug, I. Spatial prediction models for shallow landslide hazards: A comparative assessment of the efficacy of support vector machines, artificial neural networks, kernel logistic regression, and logistic model tree. Landslides 2015, 13, 361–378. [Google Scholar]
- Alimohammadlou, Y.; Najafi, A.; Gokceoglu, C. Estimation of rainfall-induced landslides using ANN and fuzzy clustering methods: A case study in saeen slope, Azerbaijan Province, Iran. Catena 2014, 120, 149–162. [Google Scholar] [CrossRef]
- Lahousse, T.; Chang, K.T.; Lin, Y.H. Landslide mapping with multi-scale object-based image analysis—A case study in the Baichi Watershed, Taiwan. Nat. Hazards Earth Syst. Sci. 2011, 11, 2715–2726. [Google Scholar] [CrossRef]
- Singleton, A.; Li, Z.; Hoey, T.; Muller, J.P. Evaluating sub-pixel offset techniques as an alternative to d-insar for monitoring episodic landslide movements in vegetated terrain. Remote Sens. Environ. 2014, 147, 133–144. [Google Scholar] [CrossRef]
- Lu, P.; Stumpf, A.; Kerle, N.; Casagli, N. Object-oriented change detection for landslide rapid mapping. IEEE Geosci. Remote Sens. Lett. 2011, 8, 701–705. [Google Scholar] [CrossRef]
- Stumpf, A.; Kerle, N. Object-oriented mapping of landslides using random forests. Remote Sens. Environ. 2011, 115, 2564–2577. [Google Scholar] [CrossRef]
- Li, Z.; Shi, W.; Myint, S.W.; Lu, P.; Wang, Q. Semi-automated landslide inventory mapping from bitemporal aerial photographs using change detection and level set method. Remote Sens. Environ. 2016, 175, 215–230. [Google Scholar] [CrossRef]
- Martha, T.R.; van Westen, C.J.; Kerle, N.; Jetten, V.; Kumar, K.V. Landslide hazard and risk assessment using semi-automatically created landslide inventories. Geomorphology 2013, 184, 139–150. [Google Scholar] [CrossRef]
- Wei, Y.; Jin, J.; Wang, Q. Impacts of natural disasters and disaster risk management in China: The case of China’s experience in the wenchuan earthquake. In Resilience and Recovery in Asian Disasters; Aldrich, D.P., Oum, S., Sawada, Y., Eds.; Springer: London, UK, 2015; pp. 287–307. [Google Scholar]
- Chen, X.L.; Yu, L.; Wang, M.M.; Lin, C.X.; Liu, C.G.; Li, J.Y. Brief communication: Landslides triggered by the m-s=7.0 Lushan Earthquake, China. Nat. Hazard Earth Syst. 2014, 14, 1257–1267. [Google Scholar] [CrossRef]
- Liu, F.; Li, J.; Yang, S. Landslide erosion associated with the wenchuan earthquake in the minjiang river watershed: Implication for landscape evolution of the Longmen Shan, Eastern Tibetan Plateau. Nat. Hazards 2015, 76, 1911–1926. [Google Scholar] [CrossRef]
- Chen, Q.; Cheng, H.Q.; Yang, Y.H.; Liu, G.X.; Liu, L.Y. Quantification of mass wasting volume associated with the giant landslide daguangbao induced by the 2008 Wenchuan Earthquake from persistent scatterer InSAR. Remote Sens. Environ. 2014, 152, 125–135. [Google Scholar] [CrossRef]
- Tang, C.; Rengers, N.; van Asch, T.W.J.; Yang, Y.H.; Wang, G.F. Triggering conditions and depositional characteristics of a disastrous debris flow event in Zhouqu City, Gansu Province, Northwestern China. Nat. Hazard Earth Syst. 2011, 11, 2903–2912. [Google Scholar] [CrossRef]
- Xu, L.; Dai, F.; Tu, X.; Tham, L.; Zhou, Y.; Iqbal, J. Landslides in a loess platform, North-west China. Landslides 2014, 11, 993–1005. [Google Scholar] [CrossRef]
- Sun, W.Y.; Shao, Q.Q.; Liu, J.Y.; Zhai, J. Assessing the effects of land use and topography on soil erosion on the Loess plateau in China. Catena 2014, 121, 151–163. [Google Scholar] [CrossRef]
- Sun, W.; Zhu, H.; Guo, S. Soil organic carbon as a function of land use and topography on the Loess Plateau of China. Ecol. Eng. 2015, 83, 249–257. [Google Scholar] [CrossRef]
- ENVI. Atmospheric Correction Module. QUAC and FLAASH User’s Guide. Available online: http://www.harrisgeospatial.com/portals/0/pdfs/envi/flaash_module.pdf (accessed on 4 January 2017).
- Laben, C.A.; Brower, B.V. Process for Enhancing the Spatial Resolution of Multispectral Imagery using Pan-Sharpening. U.S. Patent 6011875, 4 January 2000. [Google Scholar]
- Hutchinson, M. Anudem version 5.3, user guide. In Canberra: Fenner School of Environment and Society; Australian National University: Acton, Australia, 2011. [Google Scholar]
- Yourdon, E. Object-Oriented Systems Design: An Integrated Approach; Prentice Hall: Upper Saddle River, NJ, USA, 1993. [Google Scholar]
Figure 1.
Location of the study area on the Loess Plateau in China: (a) areas with high concentrations of rainstorms in the Loess Plateau in July 2013; (b) variation in the elevation of the Yangou watershed; and (c) loess landslides in the GF-1 image of the study area.
Figure 1.
Location of the study area on the Loess Plateau in China: (a) areas with high concentrations of rainstorms in the Loess Plateau in July 2013; (b) variation in the elevation of the Yangou watershed; and (c) loess landslides in the GF-1 image of the study area.


Figure 2.
Flowchart of the loess landslide recognition scheme.

Figure 3.
Multi-scale segmentation and merging of GF-1 high-spatial-resolution imagery for the Yangou watershed: (a) scale parameter of 15; (b) scale parameter of 36.8; and (c) scale parameter of 50.
Figure 3.
Multi-scale segmentation and merging of GF-1 high-spatial-resolution imagery for the Yangou watershed: (a) scale parameter of 15; (b) scale parameter of 36.8; and (c) scale parameter of 50.

Figure 4.
Identification of loess landslides from other land covers based on spectral characteristics: (a) Normalized Difference Vegetation Index (NDVI); (b–e) the spectral reflectance values of the blue, green, red and near-infrared bands in the GF-1 image, respectively; and (f–h) hue, saturation, and intensity created using a color space transformation from RGB to HIS.
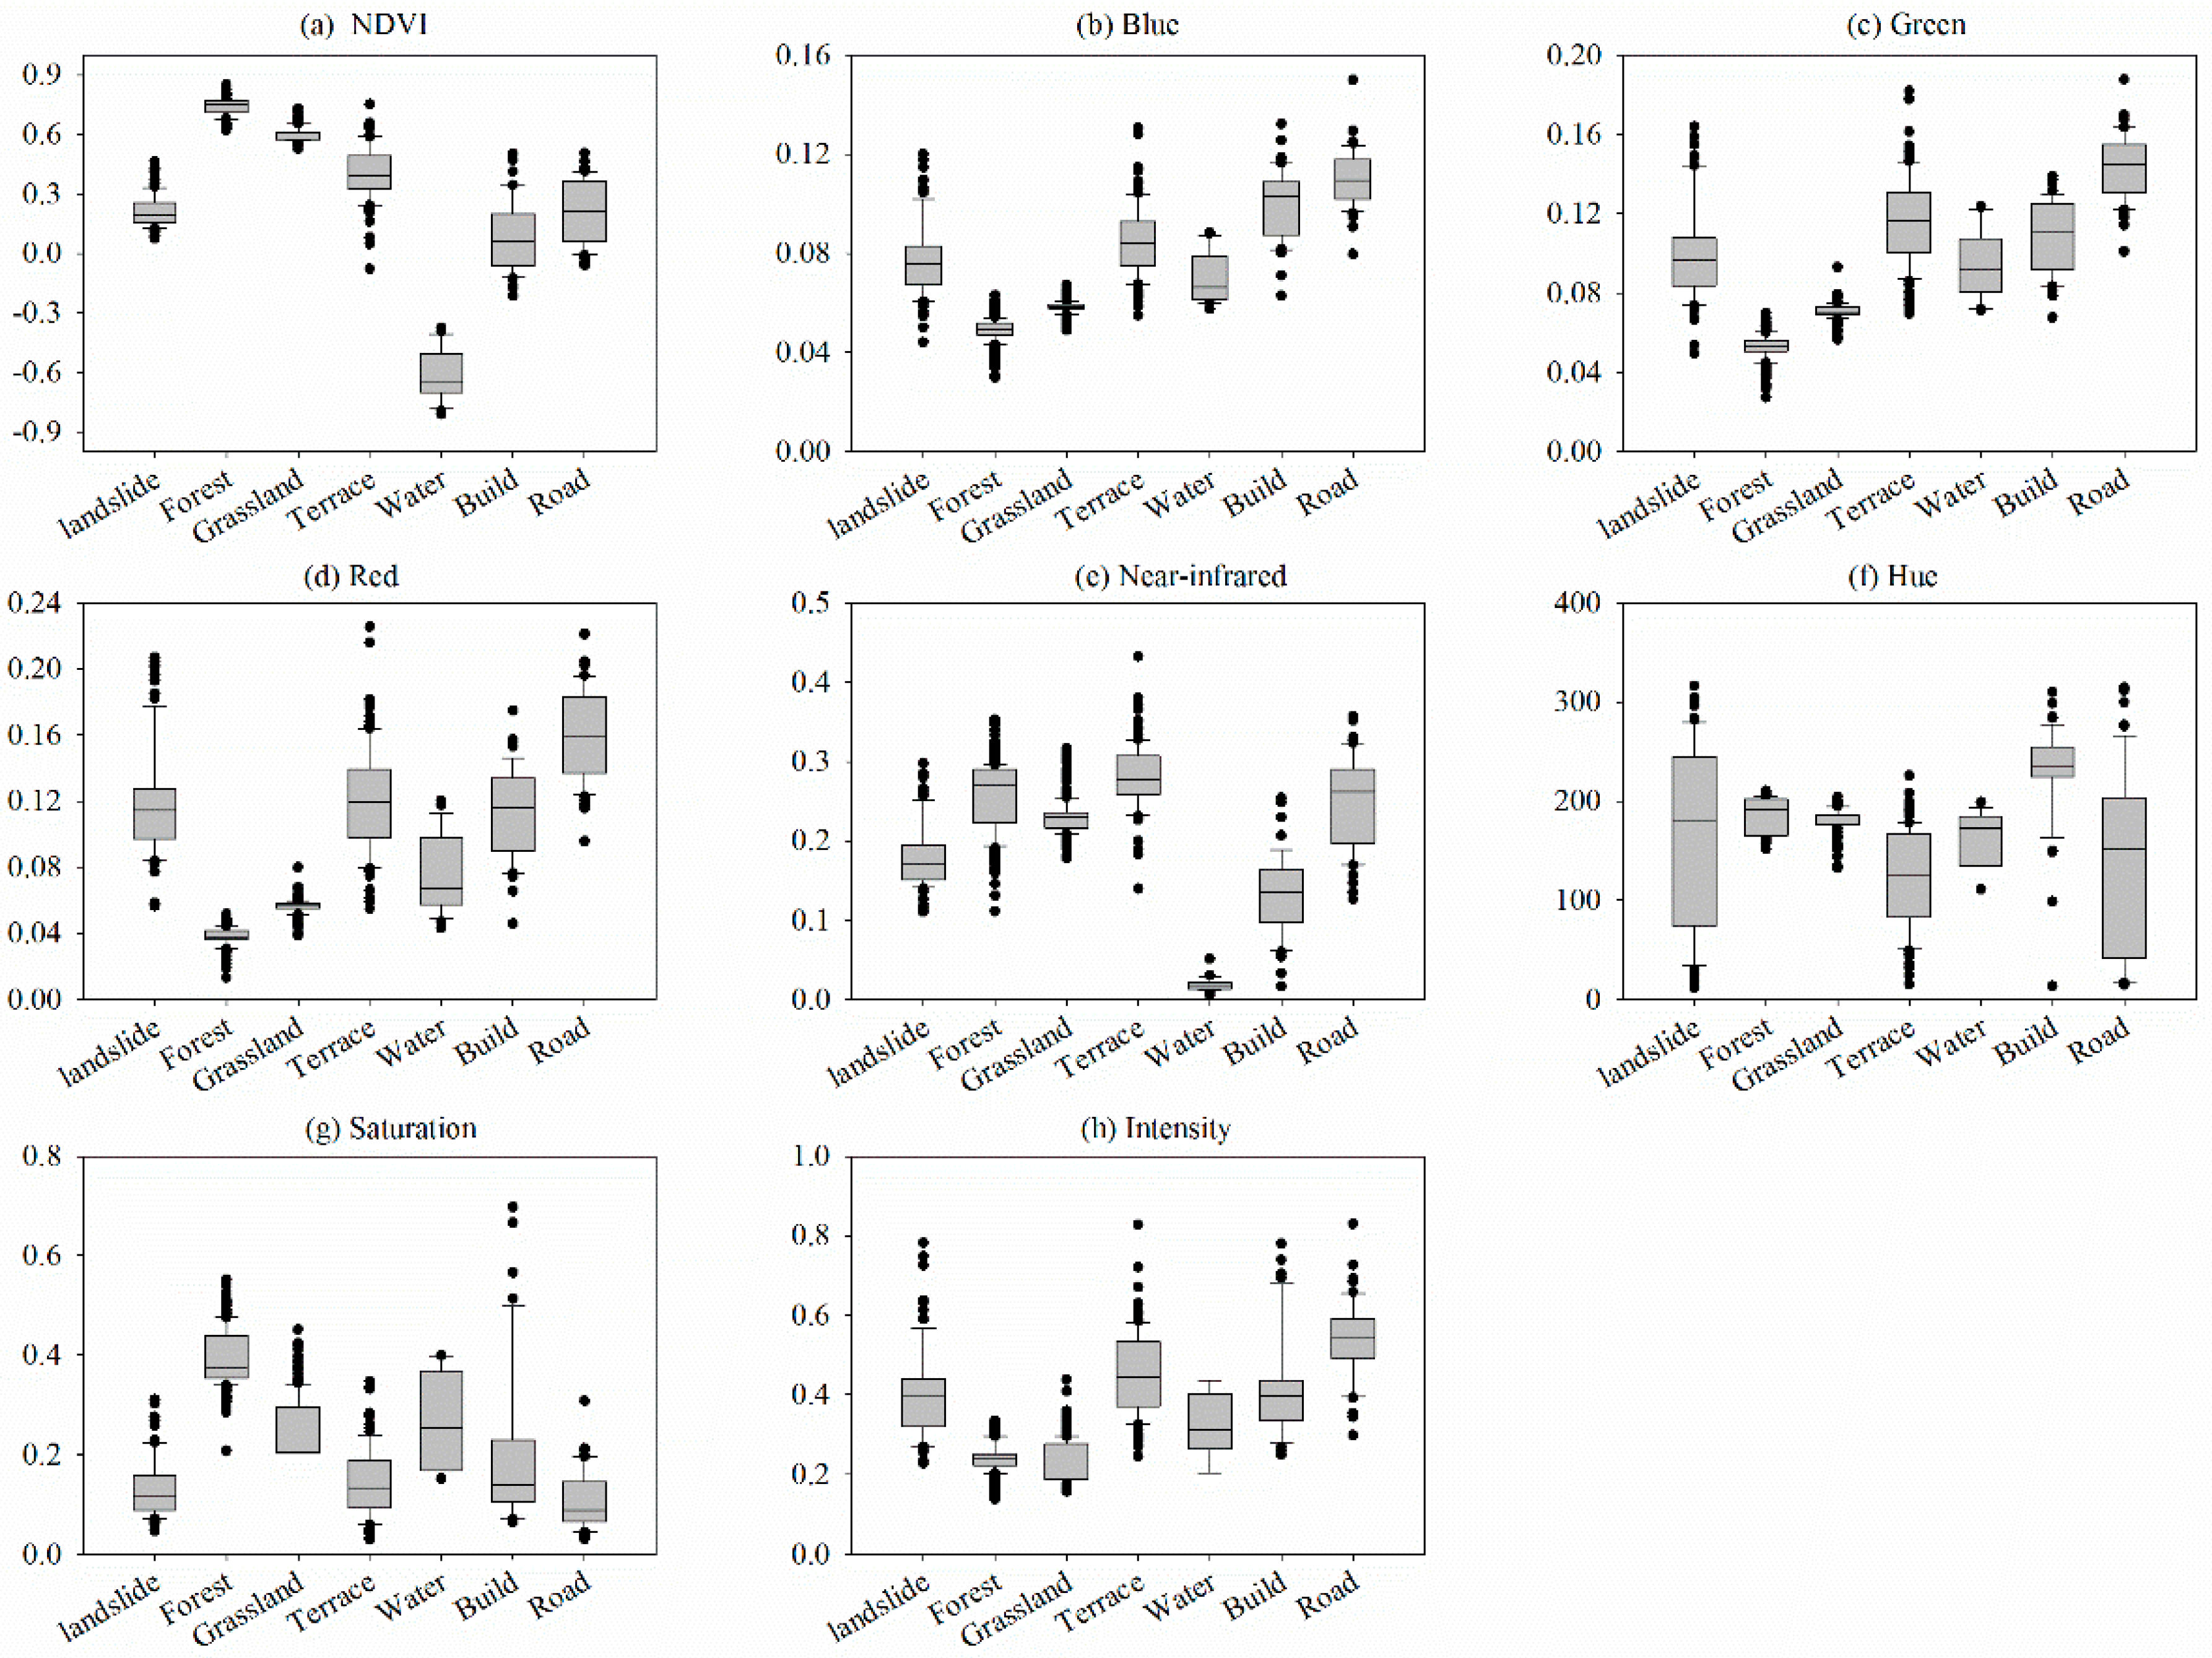
Figure 5.
(a–g) Identification based on textural characteristics between loess landslides and other land covers.
Figure 5.
(a–g) Identification based on textural characteristics between loess landslides and other land covers.

Figure 6.
(a–g) Identification based on morphometric characteristics between loess landslides and other land cover types.
Figure 6.
(a–g) Identification based on morphometric characteristics between loess landslides and other land cover types.
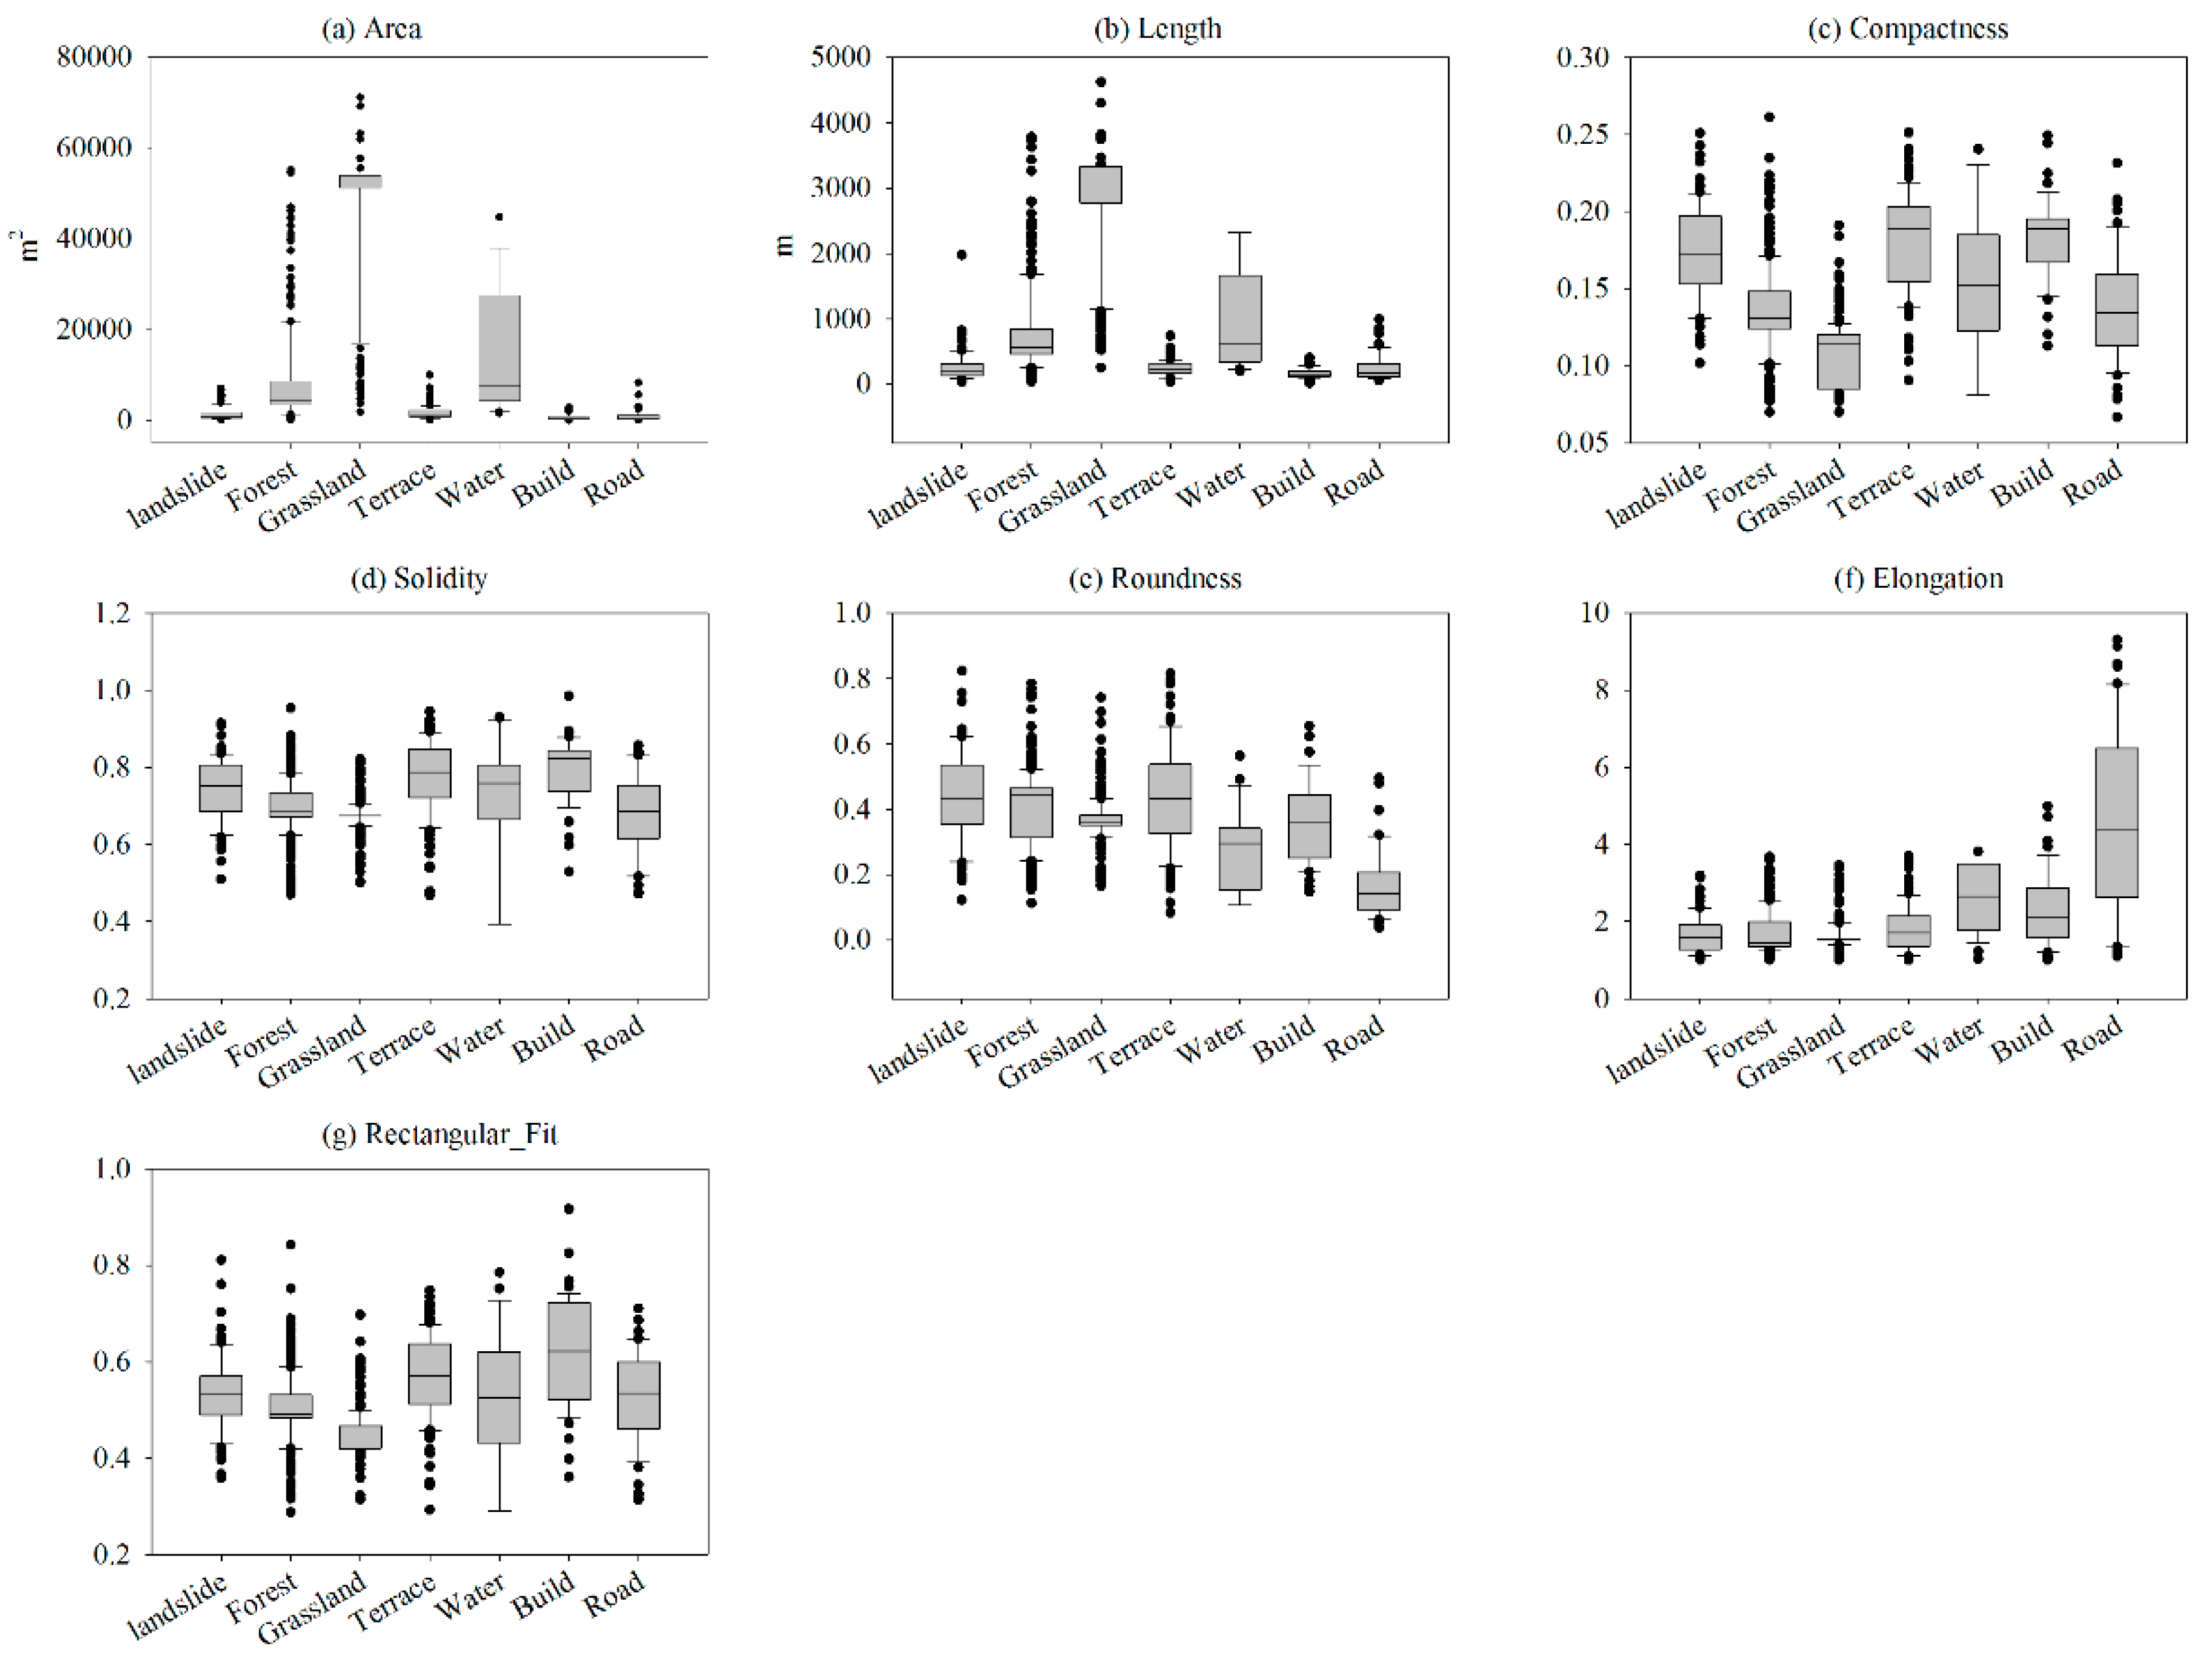
Figure 7.
(a,b) Identification based on topographic characteristics between loess landslides and other land cover types.
Figure 7.
(a,b) Identification based on topographic characteristics between loess landslides and other land cover types.

Figure 8.
Topographic position of gullies in the Yangou watershed (a); and its overlay on the GF-1 satellite image (b).
Figure 8.
Topographic position of gullies in the Yangou watershed (a); and its overlay on the GF-1 satellite image (b).
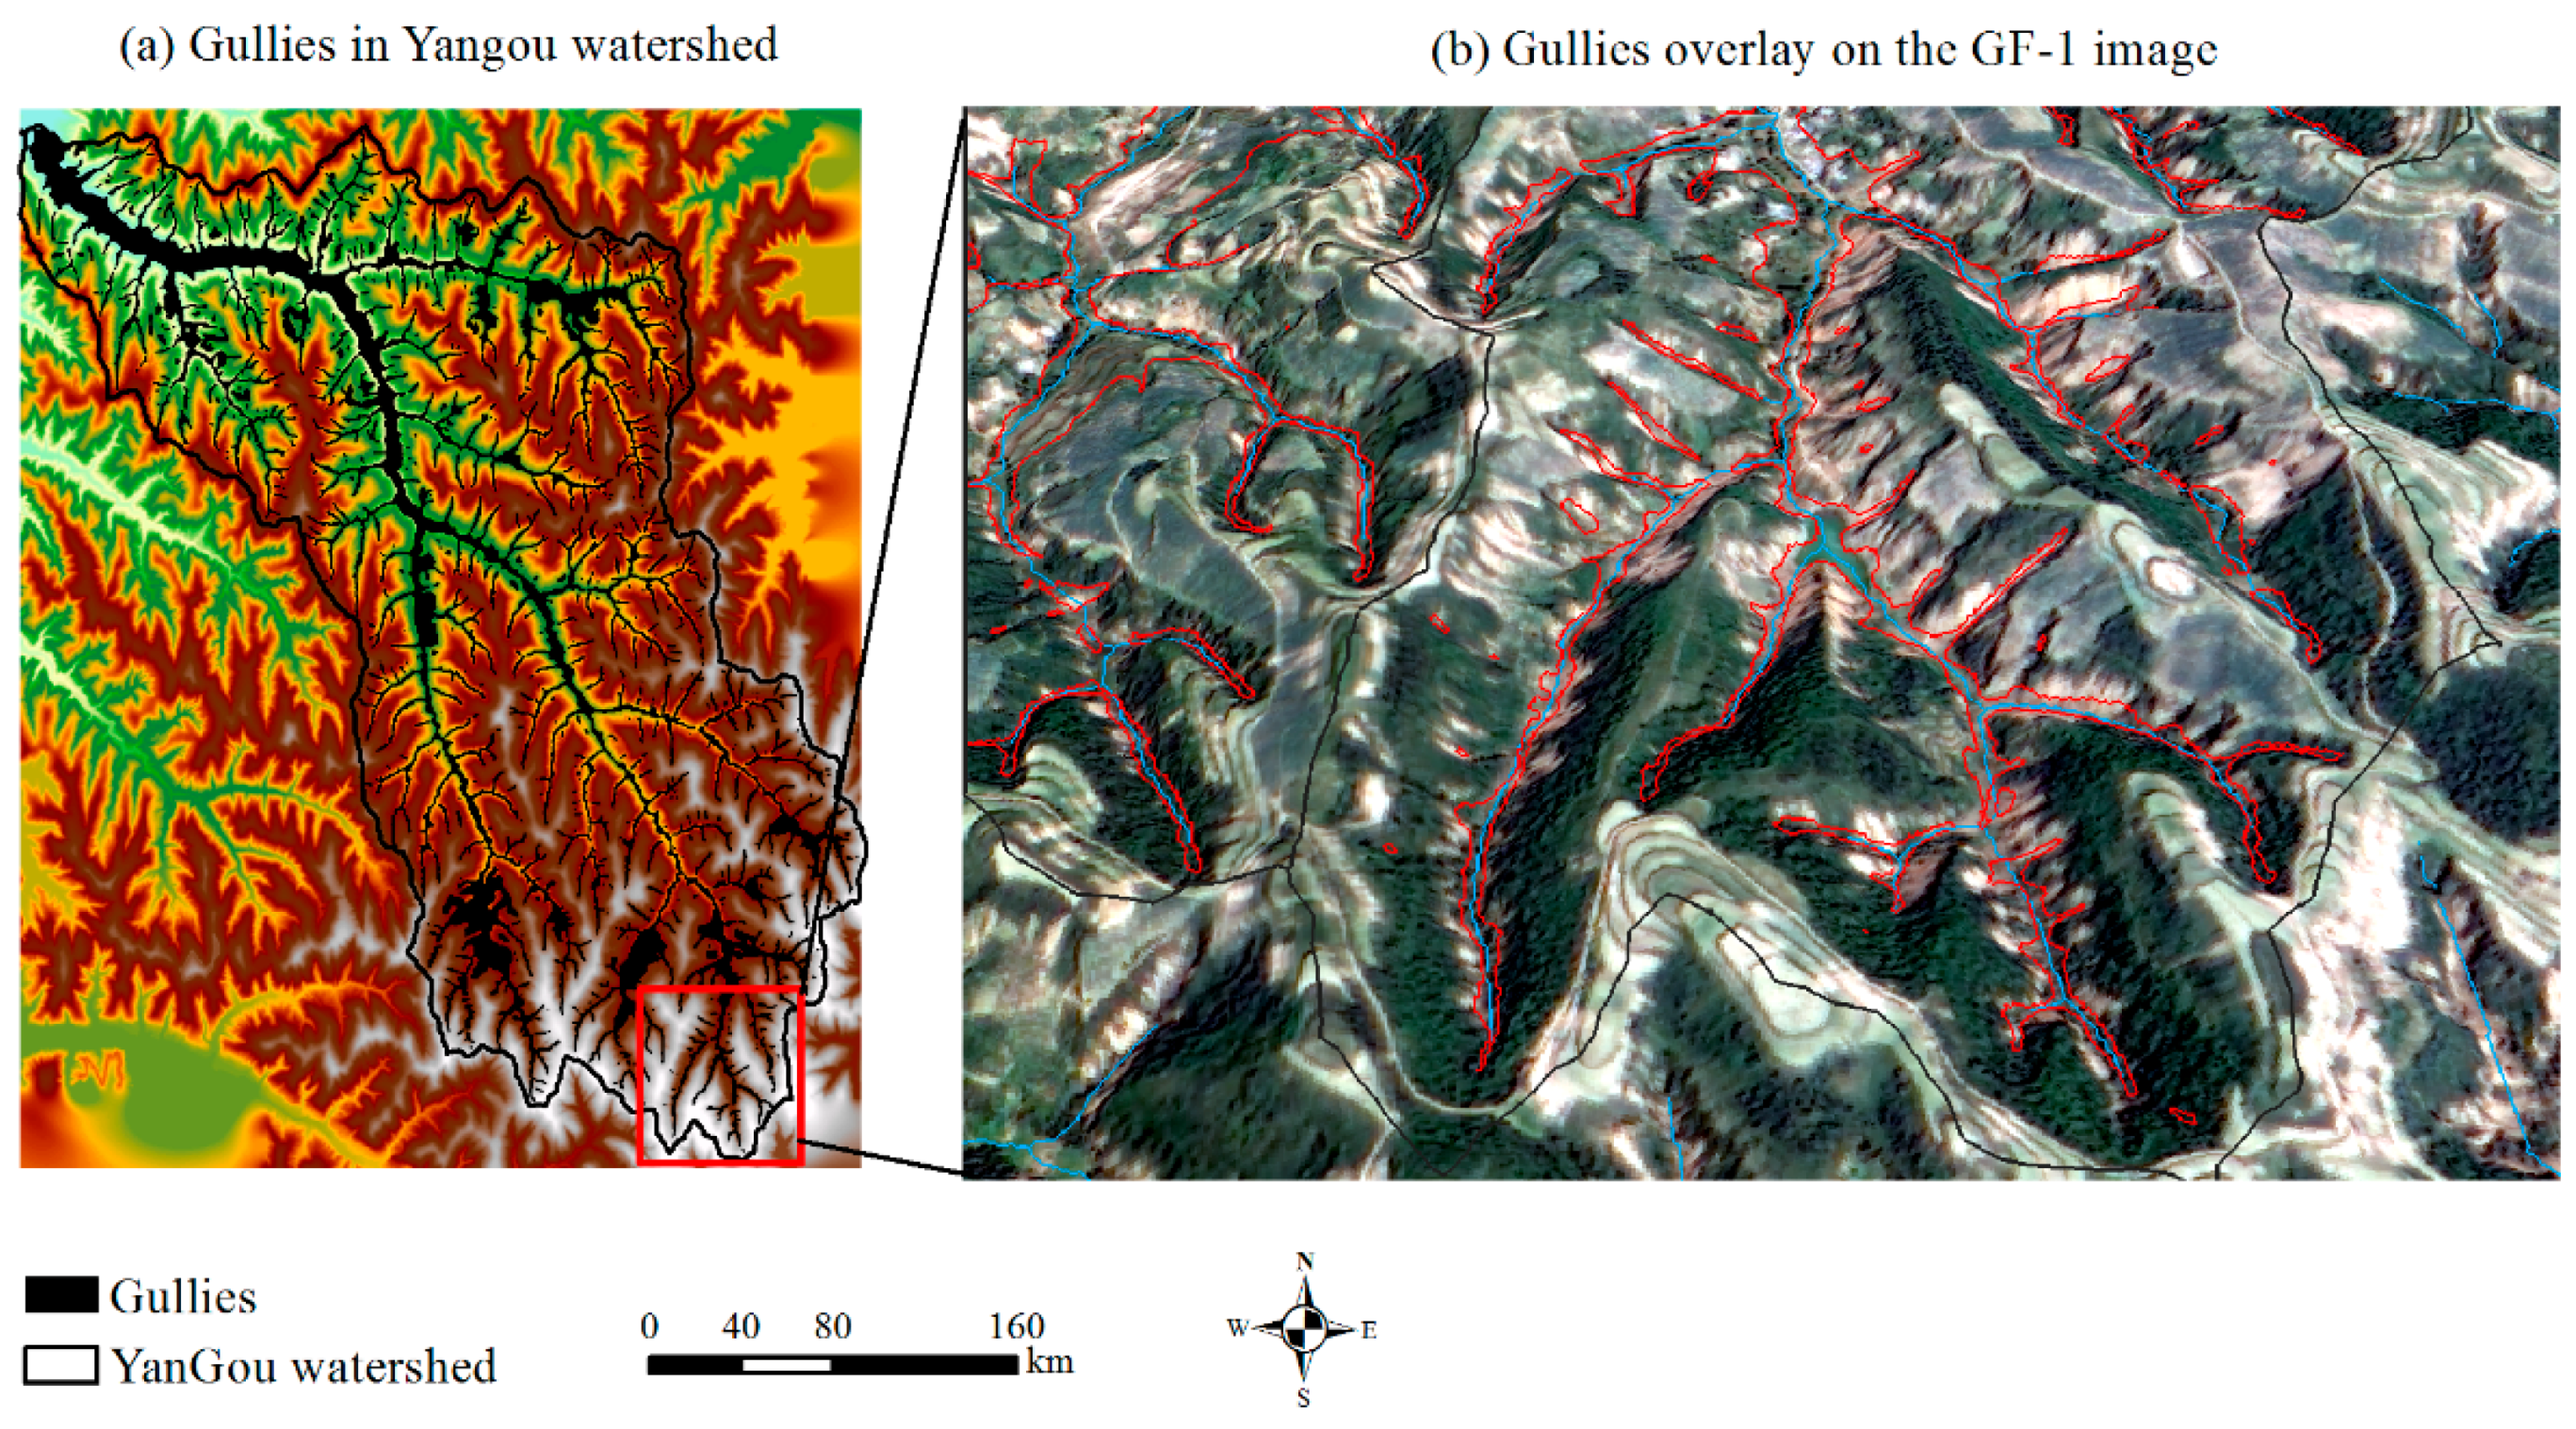
Figure 9.
Landslides for the accuracy assessment: (a) training objects of the loess landslides in the Yangou watershed; and (b) detected landslides in the Yangou watershed.
Figure 9.
Landslides for the accuracy assessment: (a) training objects of the loess landslides in the Yangou watershed; and (b) detected landslides in the Yangou watershed.


Table 1.
List of spectral, texture and morphometry attributes for identification of Loess landslides.
Table 1.
List of spectral, texture and morphometry attributes for identification of Loess landslides.
| Types | Attributes | Descriptions |
|---|---|---|
| Spectral | Reflectance | Mean of pixels comprising a segmented object in the blue, green, red or near-infrared band |
| NDVI | The ratio of the difference between near-infrared and red reflectance to their sum as an indicator of vegetation greenness | |
| HIS | Hue, saturation, and intensity created using a color space transformation from red-green-blue color model (RGB) to hue- intensity-saturation (HIS) | |
| Texture | Mean | Average of the pixels comprising a segmented object inside the kernel |
| Variance | Average variance of the pixels comprising a segmented object inside the kernel | |
| Entropy | Average entropy of the pixels comprising a segmented object inside the kernel | |
| Morphometry | Area | Total area of the polygon, minus the area of the holes |
| Length | The combined length of all boundaries of the polygon, including the boundaries of the holes | |
| Compactness | A shape measure that indicates the compactness of the polygon. A circle is the most compact shape, with a value of 1/π. The compactness value of a square is 1/2(sqrt(π)). Sqrt refers to square root calculations | |
| Solidity | A shape measure that compares the area of the polygon to the area of a convex hull surrounding the polygon. The solidity value for a convex polygon with no holes is 1.0, and this value for a concave polygon is less than 1.0 | |
| Roundness | A shape measure that compares the area of the polygon to the square of the maximum diameter of the polygon. The roundness value for a circle is 1, and the value for a square is 4/π | |
| Elongation | A shape measure that indicates the ratio of the major axis of the polygon to the minor axis of the polygon. The elongation value for a square is 1.0, and the value for a rectangle is greater than 1.0 | |
| Rectangular_Fit | A shape measure that indicates how well the shape is described by a rectangle. This attribute compares the area of the polygon to the area of the oriented bounding box enclosing the polygon. The rectangular fit value for a rectangle is 1.0, and the value for a non-rectangular shape is less than 1.0 |
Table 2.
Summary of the identifiable spectral, texture, morphometry and topography characteristics between loess landslides and other land cover types.
Table 2.
Summary of the identifiable spectral, texture, morphometry and topography characteristics between loess landslides and other land cover types.
| Types | Variables | Landslides | Forest | Grassland | Terrace | Water | Building | Road |
|---|---|---|---|---|---|---|---|---|
| Spectral | NDVI | 0.13–0.34 | 0.67–0.78 | 0.56–0.68 | <0 | |||
| Blue band | 0.06–0.10 | 0.09–0.12 | ||||||
| Near infrared band | 0.14–0.25 | 0.23–0.33 | 0.06–0.18 | |||||
| Texture | Mean of texture | 0.14–0.25 | 0.24–0.31 | |||||
| Variance of texture | <0.0025 | 0.0015–0.024 | ||||||
| Morphometry | Elongation | 1.08–2.48 | 1.40–8.35 | |||||
| Roundness | 0.24–0.62 | 0.06–0.30 | ||||||
| Topography | Slope | 10–45 | <25 | |||||
| Elevation | 1100–1250 | >1200 | <1130 |
Table 3.
Landslide detection results and accuracy assessments among the villages in the Yangou watershed.
Table 3.
Landslide detection results and accuracy assessments among the villages in the Yangou watershed.
| No. | SITE Name | Area (km2) | Training Area (km2) | Training Area (%) | Landslide References (km2) | Detected Landslides (km2) | User Accuracy (UA) | Producer Accuracy (PA) | Branching Factor (BF) | Miss Factor (MF) | Quality Percentage (QP) | Kappa Index |
|---|---|---|---|---|---|---|---|---|---|---|---|---|
| 1 | YangJiaPan | 3.85 | 0.024 | 0.63 | 0.27 | 0.25 | 0.98 | 0.96 | 0.02 | 0.04 | 0.95 | 0.97 |
| 2 | ShiTouGou | 2.13 | 0.003 | 0.14 | 0.06 | 0.05 | 0.93 | 0.95 | 0.08 | 0.05 | 0.89 | 0.94 |
| 3 | MaTa | 3.77 | 0.004 | 0.10 | 0.15 | 0.14 | 0.96 | 0.93 | 0.04 | 0.07 | 0.90 | 0.94 |
| 4 | NanZhuangHe | 5.09 | 0.010 | 0.20 | 0.21 | 0.18 | 0.99 | 0.86 | 0.01 | 0.16 | 0.85 | 0.92 |
| 5 | SiChaPu | 3.42 | 0.004 | 0.10 | 0.18 | 0.15 | 0.98 | 0.86 | 0.02 | 0.17 | 0.84 | 0.91 |
| 6 | ShaoYuanLiang | 2.91 | 0.020 | 0.70 | 0.22 | 0.21 | 0.97 | 0.97 | 0.03 | 0.03 | 0.94 | 0.97 |
| 7 | WuZhaoYuan | 4.85 | 0.024 | 0.49 | 0.40 | 0.33 | 0.99 | 0.82 | 0.01 | 0.21 | 0.82 | 0.89 |
| 8 | LaoZhuangPin | 1.36 | 0.002 | 0.17 | 0.03 | 0.02 | 0.87 | 0.83 | 0.15 | 0.20 | 0.74 | 0.85 |
| 9 | JiDanMao | 2.49 | 0.002 | 0.10 | 0.10 | 0.08 | 0.93 | 0.85 | 0.08 | 0.18 | 0.80 | 0.88 |
| 10 | QiuGou | 3.82 | 0.005 | 0.12 | 0.11 | 0.10 | 0.88 | 0.97 | 0.14 | 0.03 | 0.86 | 0.92 |
| 11 | KangKeLao | 2.96 | 0.002 | 0.06 | 0.06 | 0.06 | 0.92 | 0.94 | 0.09 | 0.07 | 0.86 | 0.93 |
| 12 | ZhaoZhuang | 5.74 | 0.003 | 0.05 | 0.25 | 0.24 | 0.99 | 0.94 | 0.01 | 0.06 | 0.94 | 0.97 |
| 13 | LiuLin | 1.15 | 0.001 | 0.10 | 0.02 | 0.02 | 0.88 | 1.00 | 0.14 | 0.00 | 0.88 | 0.94 |
| 14 | MiaoHe | 2.28 | 0.005 | 0.20 | 0.09 | 0.08 | 0.98 | 0.97 | 0.02 | 0.03 | 0.95 | 0.97 |
| 15 | QiuShuTa | 1.80 | 0.008 | 0.45 | 0.15 | 0.14 | 0.97 | 0.89 | 0.03 | 0.12 | 0.87 | 0.92 |
| Total for YanGou | 47.63 | 0.117 | 3.62 | 2.30 | 2.05 | 0.97 | 0.91 | 0.03 | 0.10 | 0.88 | 0.93 | |
© 2017 by the authors. Licensee MDPI, Basel, Switzerland. This article is an open access article distributed under the terms and conditions of the Creative Commons Attribution (CC BY) license (http://creativecommons.org/licenses/by/4.0/).
Share and Cite
MDPI and ACS Style
Sun, W.; Tian, Y.; Mu, X.; Zhai, J.; Gao, P.; Zhao, G. Loess Landslide Inventory Map Based on GF-1 Satellite Imagery. Remote Sens. 2017, 9, 314. https://doi.org/10.3390/rs9040314
AMA Style
Sun W, Tian Y, Mu X, Zhai J, Gao P, Zhao G. Loess Landslide Inventory Map Based on GF-1 Satellite Imagery. Remote Sensing. 2017; 9(4):314. https://doi.org/10.3390/rs9040314
Chicago/Turabian StyleSun, Wenyi, Yuansheng Tian, Xingmin Mu, Jun Zhai, Peng Gao, and Guangju Zhao. 2017. "Loess Landslide Inventory Map Based on GF-1 Satellite Imagery" Remote Sensing 9, no. 4: 314. https://doi.org/10.3390/rs9040314
Note that from the first issue of 2016, this journal uses article numbers instead of page numbers. See further details here.