
Building Damage Assessment Using Multisensor Dual-Polarized Synthetic Aperture Radar Data for the 2016 M 6.2 Amatrice Earthquake, Italy


1
Department of Architecture and Building Engineering, Tokyo Institute of Technology, Yokohama 226-8502, Japan
2
Department of GIS and Remote Sensing, University of Tabriz, Tabriz 5166616471, Iran
*
Author to whom correspondence should be addressed.
Remote Sens. 2017, 9(4), 330; https://doi.org/10.3390/rs9040330
Submission received: 15 February 2017
/
Revised: 26 March 2017
/
Accepted: 27 March 2017
/
Published: 30 March 2017
Abstract
:On 24 August 2016, the M 6.2 Amatrice earthquake struck central Italy, well-known as a seismically active region, causing considerable damage to buildings in the town of Amatrice and the surrounding area. Damage from this earthquake was assessed quantitatively by means of multitemporal synthetic aperture radar (SAR) coherence and SAR intensity methods using dual-polarized SAR data obtained from the Sentinel-1 (VV, VH) and ALOS-2 (HH, HV) satellites. We developed linear discriminant functions based on three items: (1) the differential coherence values; (2) the differential backscattering intensity values of pre- and post-event images; and (3) a binary damage map of the optical pre- and post-event imagery. The accuracy of the proposed model was 84% for the Sentinel-1 data and 76% for the ALOS-2 data. The damage proxy maps deduced from the linear discriminant functions can be useful in the parcel-by-parcel assessment of building damage and development of spatial models for the allocation of urban search and rescue operations.

1. Introduction
A powerful earthquake usually starts suddenly and without warning. Ground shaking after a powerful earthquake is extremely destructive, and can cause affected buildings to collapse. Conventional inspection conducted on the ground is an accurate way to understand the resulting damage; however, this method has some drawbacks. For instance, when large areas are affected, it can be difficult to obtain information on the number of damaged buildings through ground inspection in the period immediately after an earthquake. People trapped in collapsed buildings can generally survive for only about 48 h after an earthquake, so a rapid assessment of the damage to buildings is necessary [1,2]. For a better post-earthquake response, immediate decisions must be taken based on the severity of damage to the buildings affected; however, blocked roads and insufficient information about the spatial distribution of damage can hinder rescue operations in the first hours after an earthquake.
In the last decade, increasing use has been made of remote-sensing data to assess the damage caused by earthquakes, floods, and other disasters [1,2,3,4]. In particular, space-borne remote sensors, including optical or synthetic aperture radar (SAR) devices, permit the inspection of large areas at costs that are affordable for various institutes and organizations. The re-inspection intervals of such satellites are becoming increasingly shorter as new missions with different orbital altitudes are launched, and the use of auxiliary satellites increases. For instance, the two Sentinel satellites (Sentinel-1A and Sentinel-1B), launched as part of the European Union’s Copernicus program, will be able to gather information from the entire surface area of the Earth within a period of six days, demonstrating the enormous potential of space-borne imaging as a technique for disaster monitoring.
Very-high-resolution (VHR) optical data can give us information about the status of building roofs and the presence of debris. However, the particular characteristics of urban building materials are frequently reflected as complexity in optical data remotely sensed over towns and cities [5]. This means that, although VHR optical data gathered from both nadir-looking and side-looking sensors are useful for the characterization of various classes of damage (e.g., light destruction, moderate destruction, heavy destruction, or collapse) or the lack of damage to buildings, such data are not effective in permitting a rapid response. The different materials produce a wide variation of spectral responses in VHR optical images, potentially leading to chaotic interpretation and an inability to assess damage in an area by means of rapid visual inspection. In addition, weather conditions, such as the presence of clouds (e.g., in equatorial regions) or dust (e.g., in dry regions), can hamper optical imaging.
For SAR systems, on the other hand, the impact of various types of material is limited, and the spectral responses can show where the extent of damage is high or low [5]. In addition, SAR imaging is unaffected by weather conditions, and SAR images can be captured during either daytime or nighttime. Various methods have been proposed for using SAR data to detect damage to buildings [6,7]. Generally, SAR damage assessment is performed by one of two main methods, the first based on the SAR intensity and the second on the SAR coherence. In both methods, the geometry of the SAR images (e.g., the angle of incidence, the track number, or the imaging mode) has to remain constant. The SAR intensity method involves comparing images recorded before and after the event, and relies on differences in the backscattering intensity and in intensity correlation coefficients to identify regions with potential damage. Matsuoka and Yamazaki [8] showed that two sets of data acquired by the European Remote Sensing (ERS) satellite before and after the Kobe earthquake of 1995 showed a significant decrease in the backscattering coefficient and a lower correlation coefficient for the intensity in areas of severe damage. This method has been applied to the assessment of building damage for other earthquakes, such as the Bam earthquake of 2004 with data from ENVISAT ASAR, and the Haiti earthquake of 2010 with the TerraSAR-X data [9,10]. In the case of the Bam earthquake, the results were obtained only for groups of neighboring buildings, due to the coarser resolution of the SAR data (>10 m). However, in the more-recent Haiti earthquake, the use of sub-10 m VHR images from the TerraSAR-X satellite permitted the assessment of damage to individual buildings [10].
The second method (the SAR coherence method) is also based on pre- and post-event SAR images, and it relies on the correlation between interferometric phase measurements. Fielding et al. [11] developed a multitemporal method for mapping building damage in the city of Bam from differences in interferometric coherence (pre-disaster coherence and co-disaster coherence) of the data from ENVISAT ASAR. The method has also produced successful results with other earthquakes, such as the Gorkha earthquake (2015), where data from COSMO–SkyMed and ALOS-2 SAR were used [12].
Both the SAR intensity method and the SAR coherence method have advantages and shortcomings. In the SAR intensity method, backscattering data for the Earth’s surface are incompletely controlled by the satellite geometry, wavelengths, and acquisition duration, whereas in the SAR coherence method, data are highly dependent on the similar factors to give precise interferometric results [13,14]. However, under ideal geometric conditions, the performance of the SAR coherence method is superior in terms of its ability to classify buildings as damaged or intact [15]. Overall, for larger spatial and temporal baselines, the SAR coherence method provides additional information to that obtainable by optical imaging alone; moreover, it also provides a higher accuracy in terms of the assessment of building damage. On the other hand, for larger spatial baselines, SAR intensity data provide reliable information on ground changes [6]. An assessment of the results from most previous studies indicates that regardless of the location of the urban area, a combination of the SAR intensity and SAR coherence methods can markedly increase the overall accuracy [16,17,18,19].
The first multipolarized SAR data were obtained after the launches of the ENVISAT, ALOS-1, and RADARSAT-2 satellites. However, previous studies generally focused on the use of single-polarized data, and the capabilities of various combinations of SAR polarizations in the field of earthquake engineering have not been sufficiently investigated in relation to the assessment of damage to buildings. The full-polarization mode has been suggested as a practical method for detecting damage to buildings, because various items of information can be derived from it [20,21]. A marked improvement of the detection of urban damage was achieved by examining the polarimetric coherence between RR and LL circular polarization in fully polarized SAR after the Tohoku earthquake of 2011 [22]. Note, however, that fully polarized data are more rarely available than single- or dual-polarized data. Dual polarization is probably a better tool than single polarization for observing damage ratios, because it can improve the quality of deduced phase and intensity information, despite the noise created by satellite systems, which inherently limits the capability of dual-polarized SAR images in terms of the segregation of collapsed buildings.
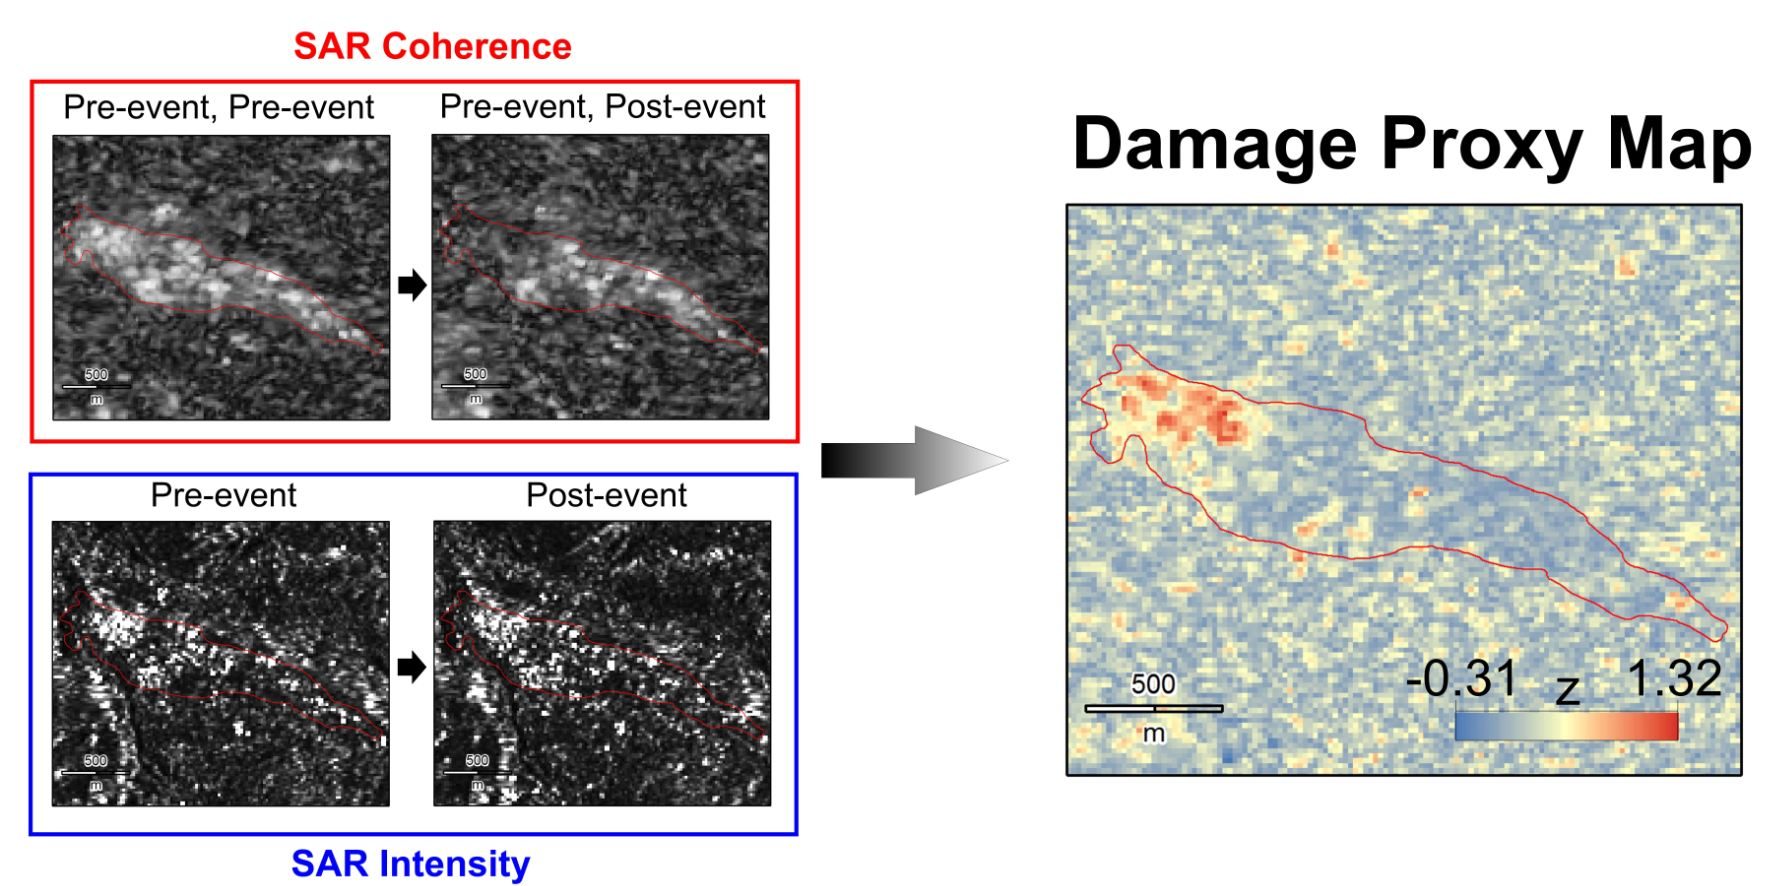
In this study, we examined ways of using a combination of multitemporal VV + VH (Sentinel-1) and HH + HV (ALOS-2) SAR images to improve the accuracy of building-damage detection in the town of Amatrice in central Italy, struck by an earthquake on 24 August 2016. A combination of SAR intensity and SAR coherence methods was applied by using the absolute value of the mean difference of coherence () and the absolute value of the mean difference of the backscattering intensity () for each dataset. The linear discriminant functions () from two independent tests and a dependent binary damage map were extracted to provide final damage proxy maps (DPMs). The DPMs demonstrate that in the collapsed buildings, the values were considerably higher, but their use in identifying ‘slightly damaged’ buildings was limited due to the complex relationships between the SAR data and existing scales for grading building damage, such as the European Macroseismic Scale 98 (EMS-98). From the DPMs, some ambiguities regarding the presence of high values in areas of ‘no damage’ have been addressed. Additionally, a correlation between the DPMs and the topography is presented for the narrow Amatrice valley.
2. Study Area and SAR Data
The M 6.2 Amatrice earthquake struck central Italy at 13:36 GMT on 24 August 2016, resulting in 299 fatalities and injuries to about 400 people, mostly in Amatrice, a small historic town almost 15 km from the epicenter. Seismological records from the Italian network showed that the precise location of the earthquake was near the small town of Accumoli in the Rieti province [23,24]. Damage also occurred in several other provinces, such as Perugia, Ascoli Piceno, and L’Aquila. The calculated focal mechanism of the main event was in agreement with the tectonic settings of the region for a normal faulting. The maximum reported peak ground acceleration (PGA) was 0.42 g at the epicenter (Figure 1), and this earthquake was one of the largest experienced in the Abruzzo region since the well-known L’Aquila earthquake of 2009 [23]. After the main shock, the number of recorded aftershocks also increased until the end of October 2016. The spatial distribution of the aftershocks had a NW–SE trend, with a 40 km radius, and these were eventually followed by another strong earthquake on 30 October 2016 (M 6.5 at 6:40 GMT) (Figure 1) [24]. The EMS-98, including five damage levels (slight damage, moderate damage, heavy damage, very heavy damage, and destruction) has been defined for field classification. Since the identification of level 1 to 4 from satellite imagery is challenging, these levels have been considered as “unsatisfactory” or “no damage” classes in a binary map. Thus, among the 322 recognized buildings in the town of Amatrice, 113 were shown as having collapsed in a binary map (0 = ‘no damage’; 1 = ‘collapsed’), derived from a manual inspection of high-resolution pre-event (21 May 2016) and post-event (25 August 2016) optical images, acquired by DigitalGlobe’s WorldView satellites (Figure 2). Most of the collapsed buildings were located in the older western part of the town. Most of the historic and traditional buildings in the town were constructed from bricks and rubble stones of irregular shape and size, and these tended to disintegrate due to the presence of insufficient amounts of mortar [24]. In addition, some of those masonry buildings had been modified in recent years (e.g., by the insertion of terraces or by increasing the number of floors); these modified buildings could be visually identified because of the presence of buildings materials that differed from the original ones. According to the EMS-98 classification, such buildings are the most vulnerable class of vertical structures (group A) [25]. The Prompt Assessment of Global Earthquake for Response (PAGER) system for fatality and economic loss impact estimation following significant earthquakes also estimated that approximately 19,000 people experienced MMI (Modified Mercalli Intensity) VIII, and 145,000 people experienced MMI VI [26]. The perceived intensity in some parts of the study region was VIII, which means that severe damage to large numbers of old and traditional buildings is to be expected.
The Sentinel-1 (A) is a C-SAR (λ = 5.6 cm) satellite that began operation on 3 April 2014, with a revisit interval of 12 days, for a wide range of uses. It has four different imaging modes: Stripmap (SM), Interferometric Wide Swath (IW), Extra-Wide Swath (EW), and Wave (WV). Among these modes, SM, IW, and EW can be used for damage monitoring. These three modes are available with single (HH or VV) or dual polarization (HH, HV or VV, VH), whereas WV is only available with single polarization. The SM mode provides a higher spatial resolution (5 m × 5 m) for emergency events in limited cases, whereas IW, which has a slightly coarser spatial resolution (5 m × 20 m), is used for normal purposes, ranging from land management to natural-disaster monitoring. The EW mode of Sentinel-1 also has a coarser spatial resolution (20 m × 40 m), but it provides a wider width (~400 km) than IW (~250 km), which can be used for coastal monitoring and ship tracking, but is less useful in damage monitoring because of its extremely large size. We obtained three level-1 single-look complex (SLC) images in the IW mode, which contained SAR data and orbit and attitude information in a slant range geometry. All the images were from descending orbits, with a dual-polarization mode (VV, VH) for each frame. The angle of incidence for the acquired images was 39.4°, and the absolute differences in the angles of incidence () for the pre-seismic and co-seismic interferometric pairs were 0.002° and 0.009°, respectively. The temporal gap between the master image (9 August 2016) and the slave images (4 July 2016 and 2 September 2016) was relatively short, and all images were obtained during the summer season. Some effects that might decrease the correlation between a pre-seismic pair and a co-seismic pair, such as the presence of snow or differences in the density and height of vegetation, can be assumed to have constant values when the temporal gap between the master and slave images is short. Along with the Sentinel-1 SAR images, three ALOS-2 (PALSAR-2) images were also acquired from the ALOS-2 satellite, equipped with an L-band (λ = 22.9 cm) SAR sensor. This satellite was launched by the Japan Aerospace Exploration Agency (JAXA) on 24 May 2014. The revisit interval of this satellite is 14 days, and it has three imaging modes that can be chosen to maximize the effectiveness of SAR monitoring according to the particular objective. The imaging modes are as follows: Spotlight (SPT), a high-resolution mode; Stripmap (SM), a medium-resolution mode, and ScanSAR (WD), a low-resolution mode with a broad coverage. The SPT mode, which has a fine spatial resolution of between 1 m and 3 m, is not yet widely available. However, the SM mode, for studying various deformations, including structural damage, is available with three different beams: SM1 (3 m), SM2 (6 m), or SM3 (10 m). We obtained three SM3 images, two of which were pre-seismic and one post-seismic. All images were from descending orbits (path 92) with a dual-polarization mode (HH + HV) for each frame. However, the temporal baselines between the master image (25 May 2016) and the slave images (16 March 2016 and 31 August 2016) were longer for both the ALOS-2 interferometric pairs than were those for Sentinel-1. However the normal baselines were not greatly different, indicating that the spatial decorrelation for both datasets should be similar. In addition, with an incidence angle of 36.2°, and rather small values for both pre-seismic and co-seismic pairs (0.011° and 0.009°, respectively), the images were potentially suitable for coherence generation. See Table 1 for the relevant SAR data parameters. In this paper, all SAR data (Sentinel-1 or ALOS-2) were obtained before the second main shock on 30 October 2016. The results therefore show the damage consequences of the Amatrice earthquake of 24 August 2016. Figure 3 shows the co-seismic tear-shaped interferograms stretched 20 km in the NNW direction for both the Sentinel-1 and ALOS-2 datasets. The number of fringes in the Sentinel-1 interferogram is higher than that in the ALOS-2 interferogram, due to C-band inherency. However, in both cases the main displacement, calculated from the interferograms for the town of Accumoli (near to the epicenter), reached about 25 cm in the satellite’s line of sight (LOS) direction.
3. Methodology
Mapping of building damage can be performed by ground inspection, by remote sensing, or by an integrated method. The information gathered on damaged buildings from the field is accurate, because of the logical fit between the observations and damage grades of the standard codes. However, the level of damage as assessed from space in terms of earthquake-engineering definitions is bothersome and complex. Thus, the “detecting damage” in this study is not necessarily the actual damage, it is just identified as the collapse-to-not collapsed state based on our knowledge from SAR and optical imagery. This problem is particularly acute for light and moderate grades of damage, because cracks in walls or joint detachments can be invisible or undetectable in satellite imagery. However, this might not be too important from the viewpoint of disaster mapping and site reconnaissance, because the population of highly damaged buildings needs to be evaluated first. Under these circumstances, the efficiency of remote sensing by using SAR data, especially from different sensors and with different polarizations, has advantages over ground-based methods. Nevertheless, there is no straightforward SAR method that meets the needs of users or strategy makers. The existing methods vary from region to region, due to differences in local parameters such as vegetation, topography, or building performance [7,8,11,18,22,27]. None of the studies discussed in Section 1 has focused on a combination of dual-polarized SAR intensity and dual-polarized SAR coherence together with discriminant analysis. Here, we combine all of these datasets with the aim of developing robust DPMs that provide a rapid and pragmatic method for damage assessment, even for areas with incomplete building inventories.
3.1. SAR Intensity and SAR Coherence
The intensity values were derived from Sentinel-1 and ALOS-2 SLC images, and were then converted into backscattering coefficients. Despeckling or reduction of signal-corrected noise was carried out by applying a multiplicative noise model in 5 × 5 window sizes for all the images [28]. Because the differential backscattering values were to be integrated with the relative differential coherence map, all the values had to be normalized. As shown in Figure 4, in the pre-seismic intensity images from both Sentinel-1 (VV, VH) and ALOS-2 (HH, HV), it can be concluded that strong reflections in the built-up areas (white pixels within the red boundary) are related to a double-bounce pattern of SAR backscattering ratios between the Earth’s surface and undamaged buildings in Amatrice. It is obvious that the number of white pixels is higher in the Sentinel-1 intensity maps (Figure 4a–d). This frequently happens as a result of the C-band’s lower penetration capability and volumetric scattering over vegetation canopies.
The characteristics of the damage were calculated from the absolute value of the difference in intensity between the master and slave (post-event) images for each sensor, as follows:
Here, is the absolute value of the difference in the backscattering coefficient; and are the pixel values for the pre-event and post-event images, respectively; is the normalized difference in the backscattering coefficient for two different polarizations of the same sensor; and is the absolute value of the mean difference in the backscattering coefficient for two different polarizations (dB). Note that in this step, only the differential backscattering of the pre-event and post-event with the shortest temporal baseline were taken into account, and the far temporal baselines were ignored. However, the values of for both Sentinel-1 and ALOS-2 did not match well with the reference binary map. Generally, higher values should represent damaged buildings, but high values were not observed in damaged areas exclusively, which means that the shapes of buildings (e.g., flat or gabled roofs) also affected the backscattering values [5]. With a lack of a building inventory, the number of buildings misclassified by a method based exclusively on intensity will be high. Therefore, it was reasonable to proceed through an integrated method that uses both intensity and coherence.
We calculated the interferometric correlations, which are a measure of the SAR reflection from the surface. Simply put, the interferometric correlation characterizes the amount of coherency of the complex phase signal of two SAR images at any given place. The complex correlation () inherently varies from 0 to 1, and also provides a measure of the quality of the interferograms. It can be defined as follows:
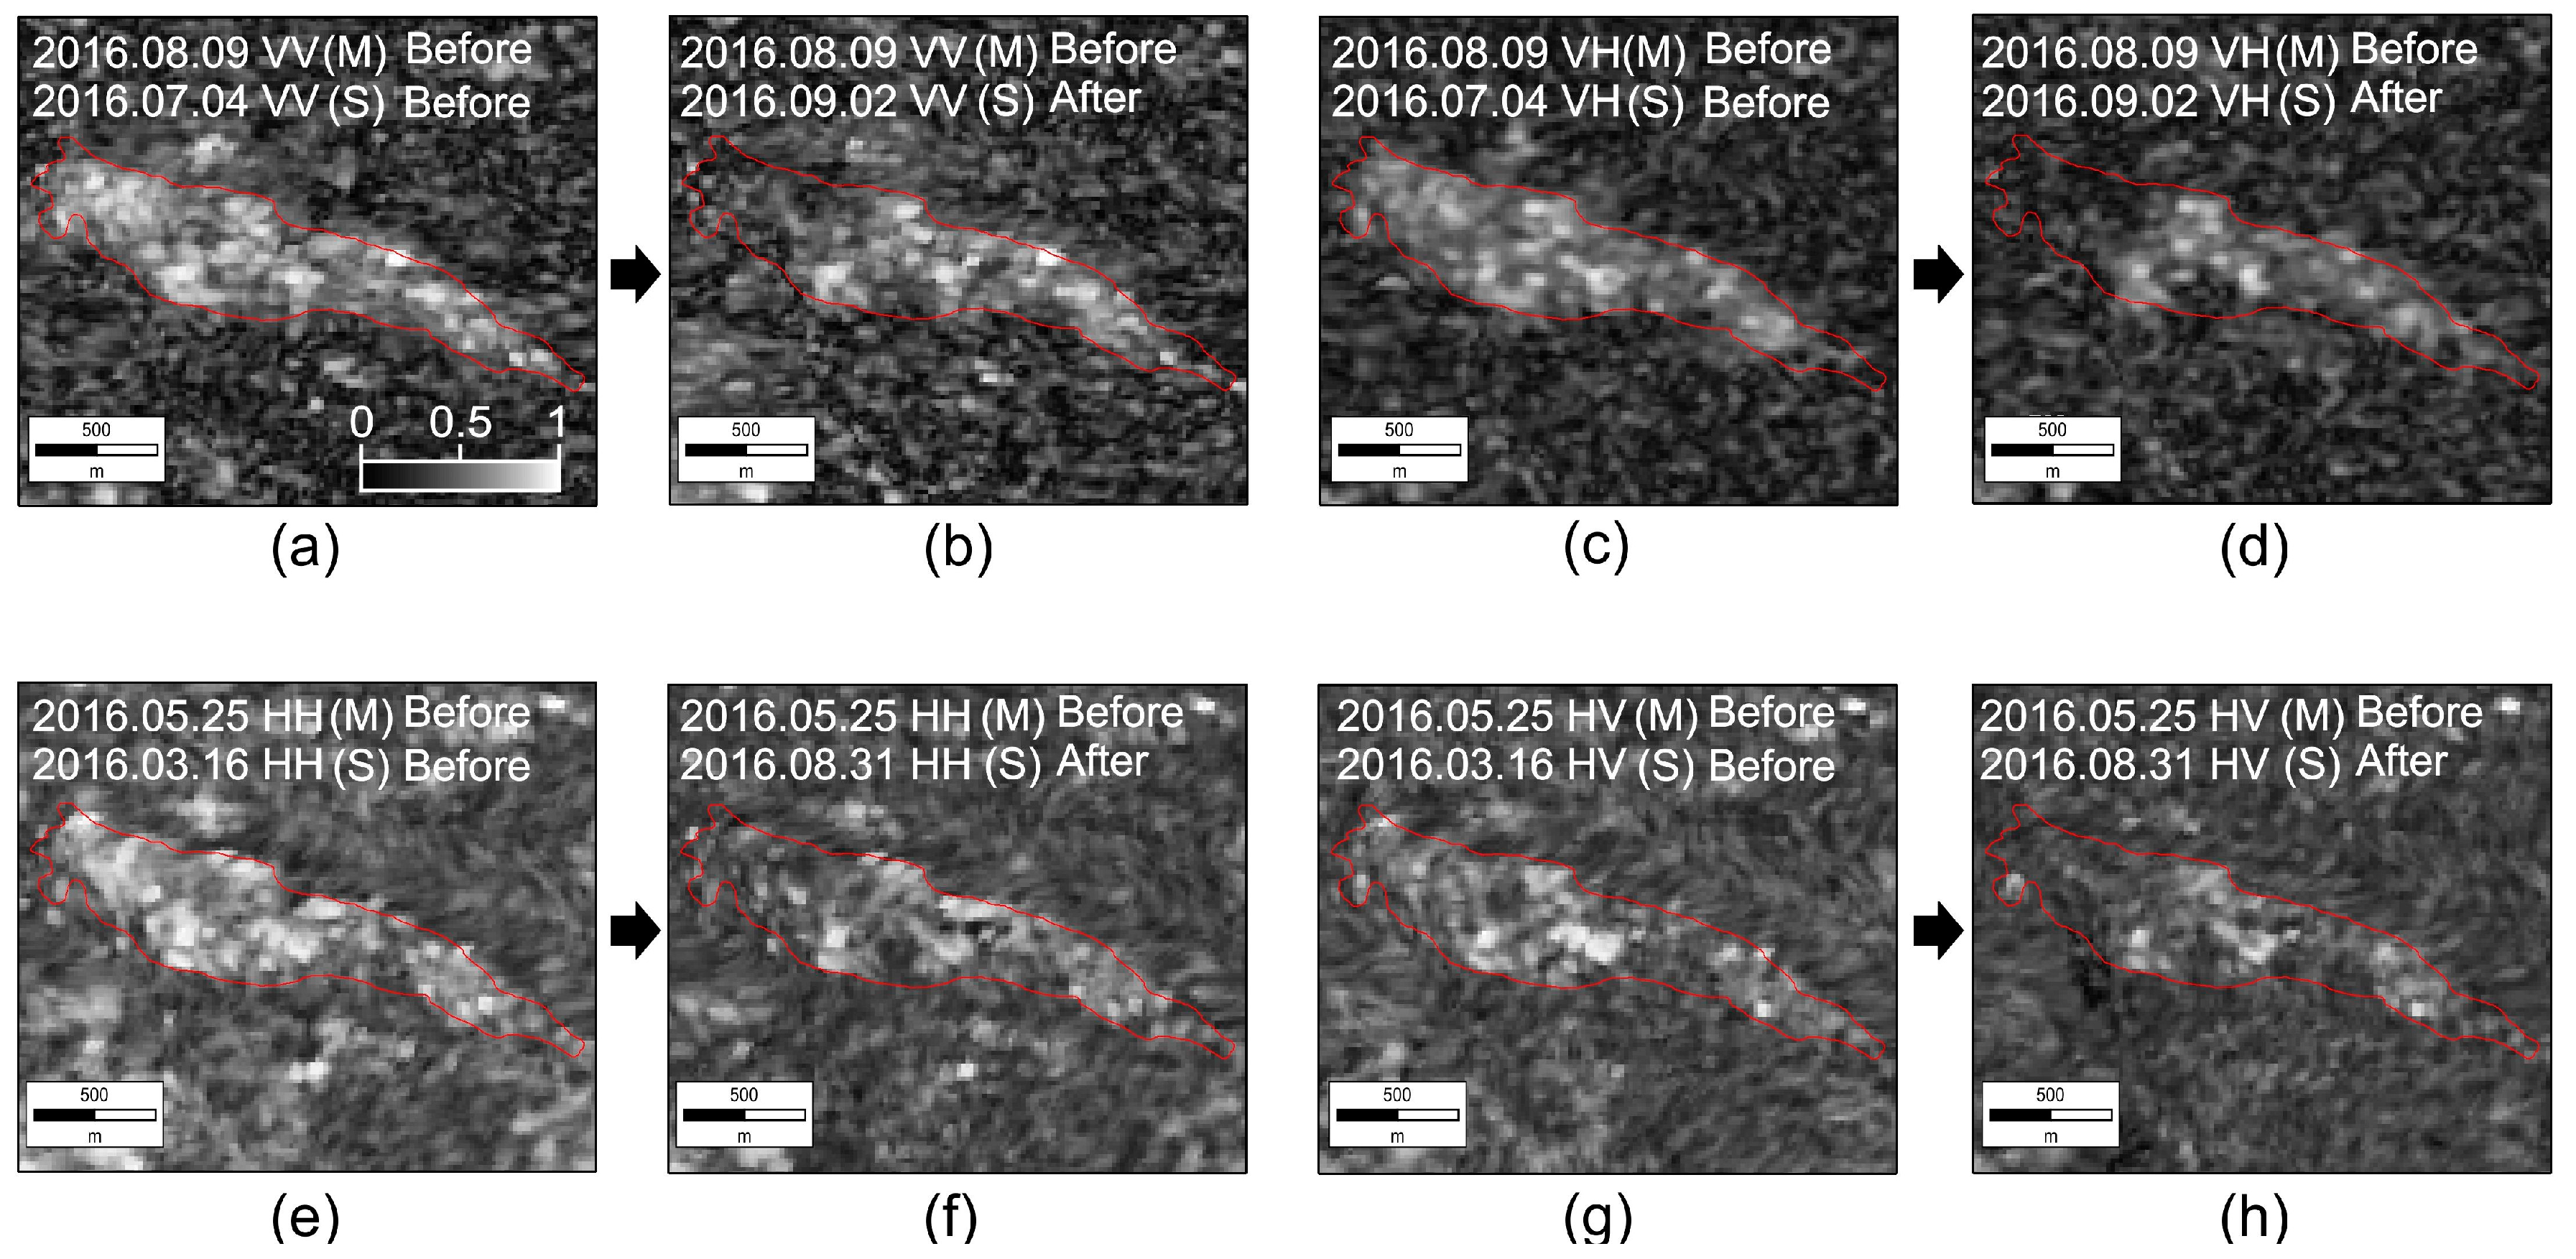
Here, and are the relative complex values for the first and second images in the interferometric analysis, and are the complex conjugates of the images used, and is the expected value. Areas with high coverages of vegetation usually lose coherence due to short-term effects, such as wind, or long-term effects, such as the growth of leaves, whereas in urban regions, coherence is maintained. Consequently, coherence also identifies urban and nonurban regions as a first-order outcome. Here, we used a multitemporal interferometric coherence-change technique with two pairs: one pair to generate a coherence map before the earthquake (two pre-event images), and another pair to generate a co-seismic coherence map (one pre-event image and one post-event image). Decorrelation aspects due to topographic phases were removed by using the 1-arcsec digital elevation model (DEM) of the Shuttle Radar Topography Mission (SRTM). Although the small window size reduced the effects of the phase gradient, it might, nevertheless, also have been the cause of wrong coherence values, especially in areas with a low correlation [29]. Despite this, we applied the same window size to that which we used in the previous method and, to execute a fair analysis, we assumed the grid sizes to be equal, regardless of the different spatial resolutions of the images used. The coherence maps were resampled and then geocoded by using the DEM so that the pre-event and co-seismic maps could be compared pixel-by-pixel. Figure 5 shows the pre-event and co-seismic coherence maps for Sentinel-1 (Figure 5a–d) and ALOS-2 (Figure 5e–h). In the pre-event maps, regardless of their polarization (Figure 5a,c,e,g), the white pixels homogeneously represent the stability of the built-up area over the town, whereas in the co-seismic maps (Figure 5b,d,f,h) the stability shows perturbations; in particular, the NW part of the town showed significant decorrelation. A decrease in coherence (dark pixels) manifests itself as an indicator of changes that can be used as an indicator for damage assessment. In all the co-seismic maps, the group of buildings with detected damage runs almost from the northwest to the southeast of the town. However, it must be noted that a decrease in coherence also can be observed in nonurban areas, probably as a result of small agricultural changes or changes in vegetation. The generated coherence maps from different polarizations (i.e., VV, VH for Sentinel-1 and HH, HV for ALOS-2) contributed to the calculation of the absolute value of the mean difference in coherence as follows:
Here, is the absolute value of the differential coherence, is the normalized difference coherence, and is the absolute value of the mean difference in coherence from two different polarizations. This procedure leads to two damage indicators ( and ). In the individual coherence maps (), the number of damaged buildings can be estimated or distinguished by using a threshold value. As shown in Figure 6, 0.5 was assigned as the threshold value. The pre-event coherence charts (Figure 6a,c,e,g) are tight, whereas their corresponding co-seismic coherence charts (Figure 6b,d,f,h) are shifted and stretched toward lower values. However, the numbers of misjudged buildings in the pre-event VV and HH maps ( and ) are lower than in the pre-event VH and HV maps ( and ). The mean coherence pixel values over the town for the pre-event VV and HH maps are 0.61 and 0.63, respectively. The values for the corresponding VH and HV maps are 0.53 and 0.54, respectively, showing that the HH and VV maps are the optimal coherence maps and are more sensitive indicators. Accordingly, in the weighting process before the discriminant analysis, VV and HH should earn higher weights than VH and HV. The revised mean difference coherence value () from two different polarizations is defined as follows:
The value of is controlled by the phase differences of different SAR acquisitions, which is related to the changes caused by damage. On the other hand, is controlled by the power of the scattering coefficient (intensity) between two acquisitions, but the damage signals are contaminated by other time-related changes. Figure 7 show a comparison of the absolute mean difference intensity and the absolute mean difference coherence between 0 and 1 classes. Each blue (no damage) or red (collapsed) circle indicates the mean values of the individual building, and the black solid point is the corresponding average value with the standard deviation of indices. The damage grade in the coherence maps is stated more clearly. Thus, their contribution in the DPM is higher than that of the intensity maps. However, it must be noted that the building footprints are better identified in the maps. The values of (black circles) in Figure 7a,c are 0.135 and 0.134, respectively, which are markedly lower than those for the collapsed buildings, which are 0.333 and 0.334, respectively (Figure 7b,d). Because of the different natures of and , the results from single models are unsatisfactory. In the next subsection, we develop a new discriminant indicator that uses both and , and we examine how much the new score can boost the accuracy of assessment of damaged buildings.
3.2. Discriminant Analysis and Damage Proxy Maps
A discriminant analysis according to two independent tests ( and ) and one binary map was carried out to differentiate collapsed buildings from other buildings. Note that the binary map of Amatrice shows two classes: 0 is ‘no damage’ buildings, and 1 is ‘collapsed’ buildings. This map is provided from high-resolution optical imagery, and does not imply that the ‘no damage’ buildings are intact buildings. Thus, in the discriminant analysis, 0 means ‘unsatisfactory’ and 1 means ‘satisfactory’. The number of buildings in the binary map is 322, of which 209 are classed as 0, and 113 are classed as 1. We predicted new scores based on the sorted binary map for both the Sentinel-1 and ALOS-2 data. Discriminant analysis is closely related to linear-regression analysis, which characterizes two or more classes of objects. We regressed independent variables on the dependent variable and we assigned a value based on the location of the centroids of the buildings. Table 2 shows the details of the regression analysis. The discriminant score () can be calculated as follows:
Here, is the number of buildings, is the predicted value for each individual building, and and are the regression coefficients for and , respectively. The values can be interpreted as the probabilities of being within the group. Simply put, they are first-order indicators of the damaged buildings, to define a threshold between the binary groups. Defining a simple threshold as a median value, as we did in Section 3.1, is too simplistic. Thus, the cutoff between ‘no damage’ and ‘collapsed’ classes should be calculated. This can be calculated on the basis of the number of ‘no damage’ and ‘collapsed’ buildings from the binary map and from their corresponding discriminant score (), as follows:
Here, is the cutoff value, and are the numbers of ‘no damage’ and ‘collapsed’ buildings, respectively, and and are the averaged discriminant scores for ‘no damage’ and ‘collapsed’ classes, respectively. The calculated cutoff values for Sentinel-1 and ALOS-2 were 0.350 and 0.352, respectively. Generally the buildings in Group 0 have lower values than buildings in Group 1. If , we classify building as ‘no damage’ and if , building is classified in the ‘collapsed’ group. We can compare the predicted dependent values with the actual binary map to determine the rate of misclassification. The number of misclassified buildings for the Sentinel-1 and ALOS-2 datasets were 52 and 77, respectively. In the Sentinel-1 dataset, the total numbers of buildings classified as ‘no damage’ and ‘collapsed’ were 171 and 99, respectively, and the accuracy of classification of the buildings as ‘no damage’ or ‘collapsed’ was 81% and 87%, respectively. In the ALOS-2 dataset, the total numbers of buildings classified as ‘no damage’ and ‘collapsed’ were 157 and 88, respectively, and the accuracy of classification of the buildings as ‘no damage’ or ‘collapsed’ was 74% and 77%, respectively. Furthermore, the overall accuracy for the Sentinel-1 and ALOS-2 datasets was 84% and 76%, respectively. In addition, it must be mentioned that the accuracy of the single-polarization method was lower than that of the current procedure. The overall accuracies of discriminant analysis for single polarizations VV and VH (Sentinel-1) were 77% and 81%, respectively, and for HH and HV (ALOS-2), they were 75% and 72%, respectively.
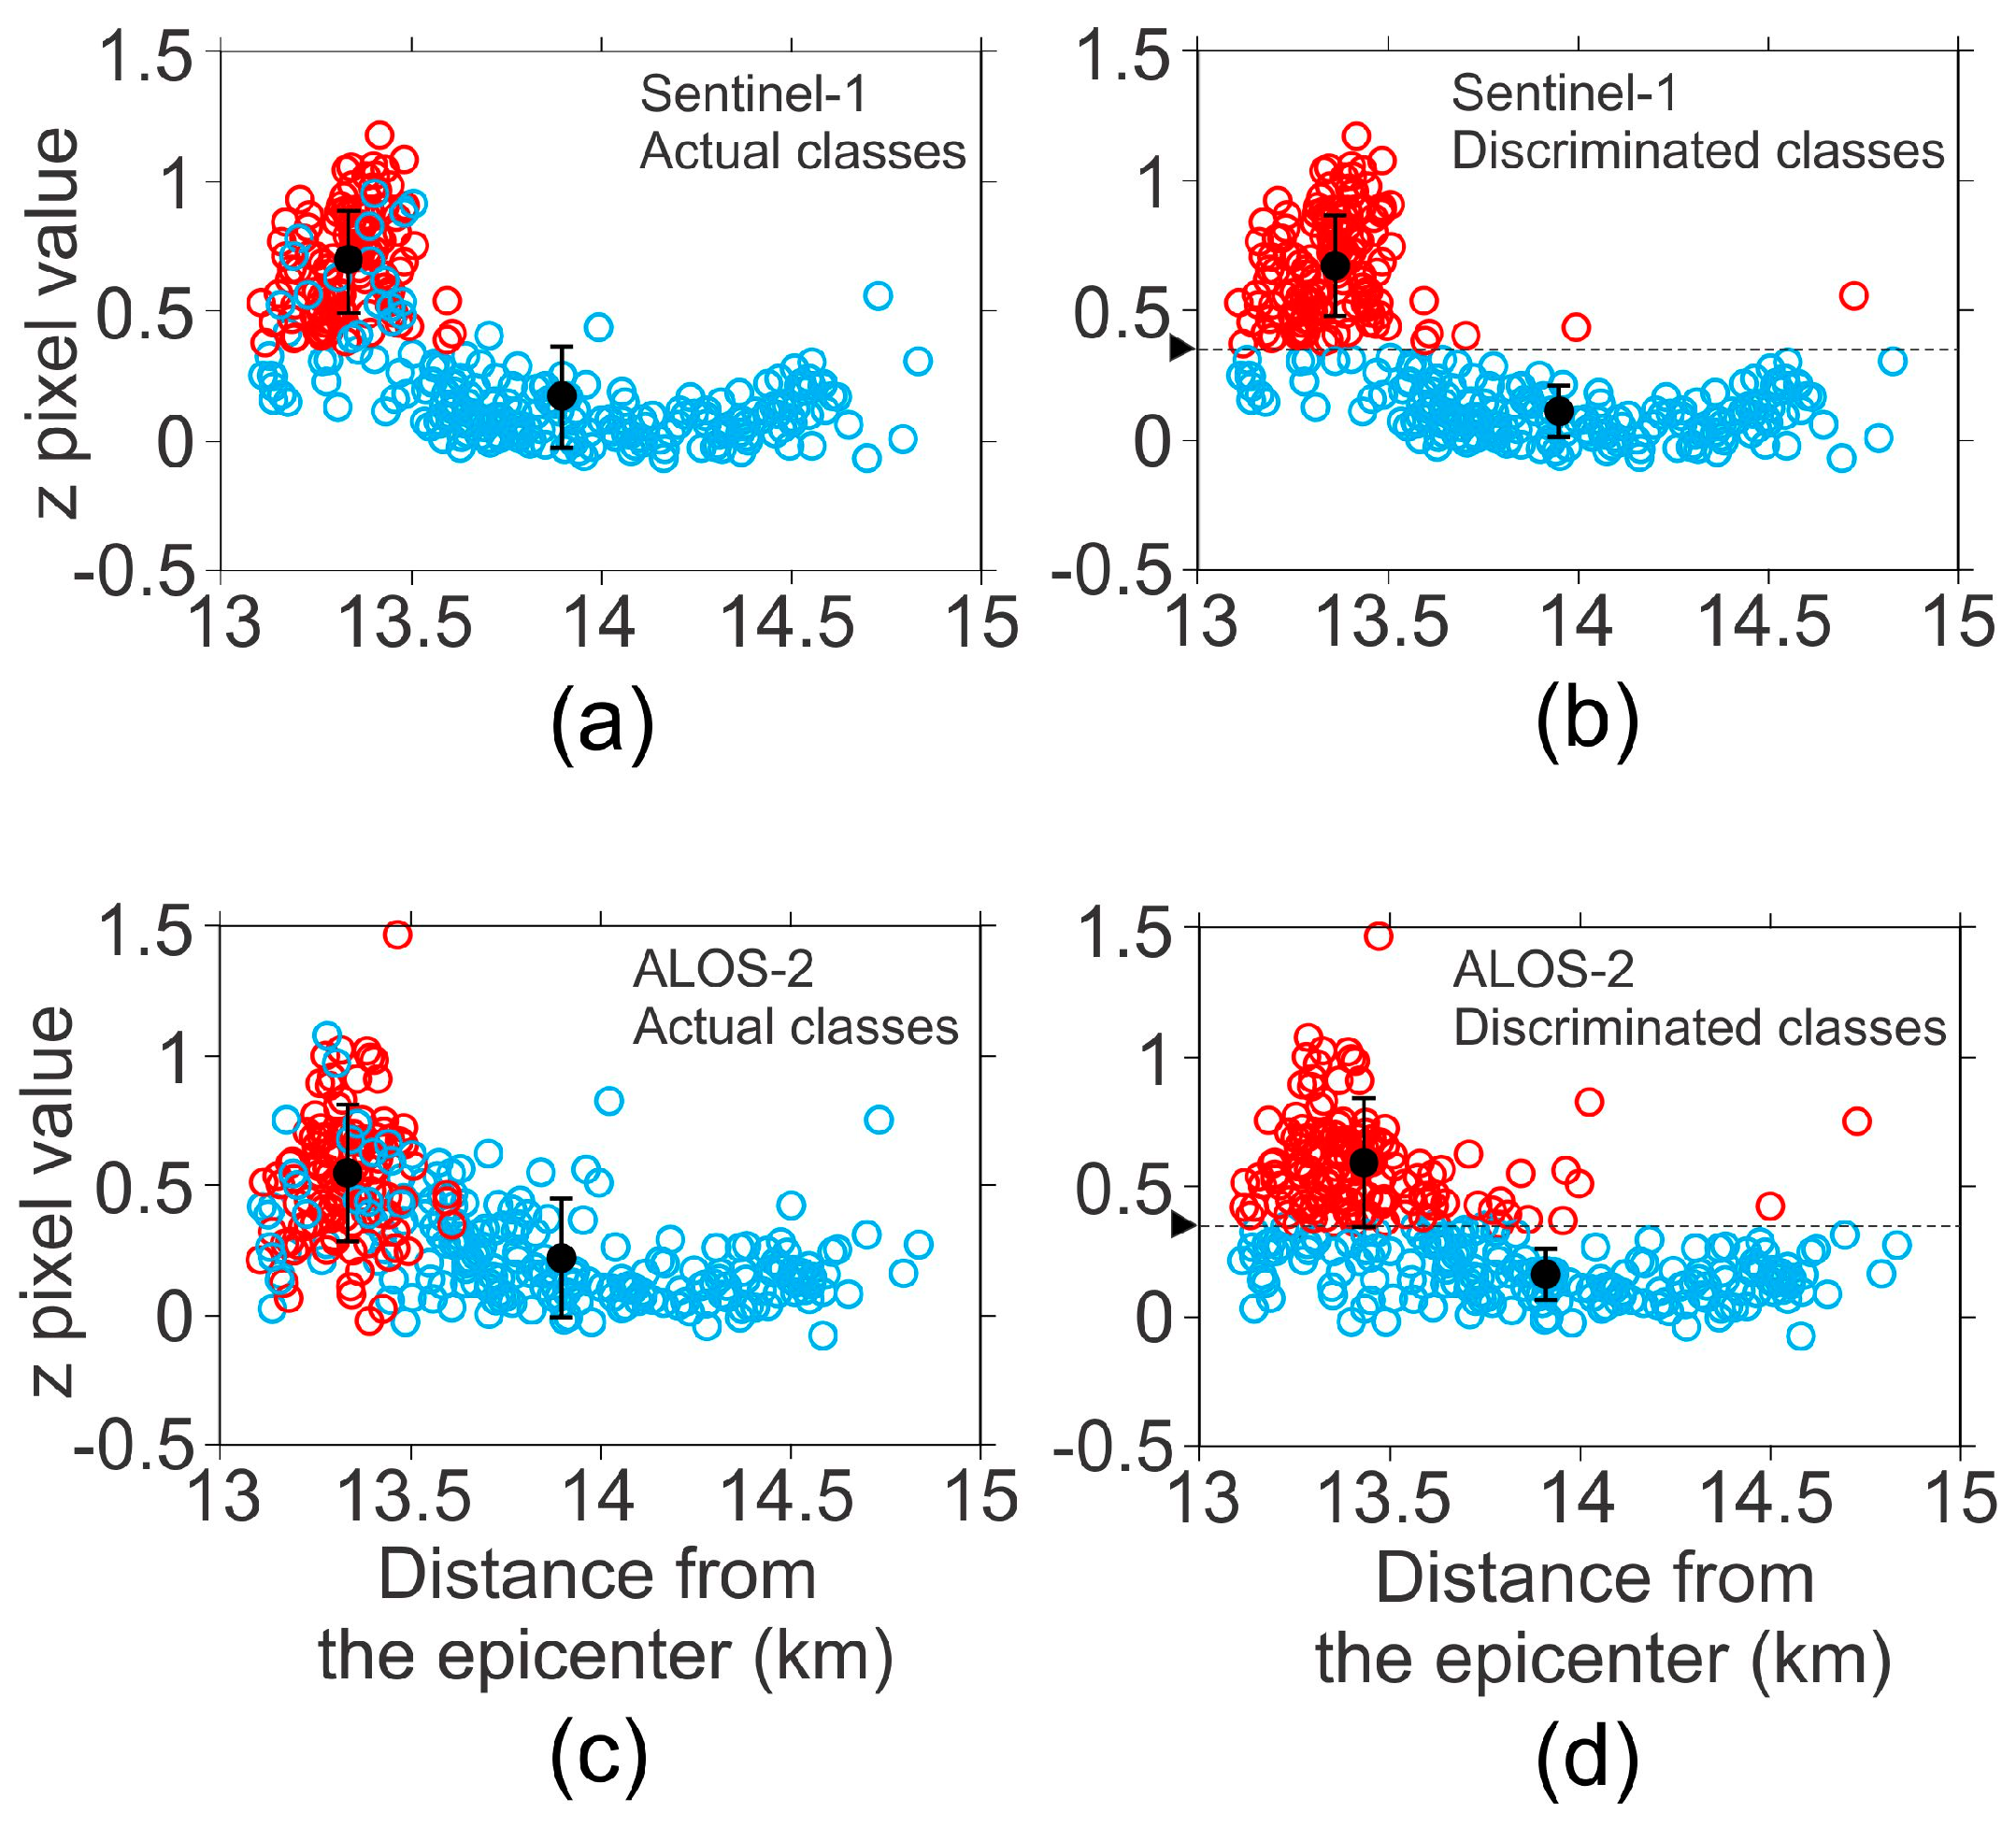
By using both the Sentinel-1 and ALOS-2 datasets, the accuracy of classification of the buildings as ‘collapsed’ was higher than that of the classification of the buildings as ‘no damage’, indicating that the discriminant analysis according to the binary maps was more successful (Table 3 and Table 4). On the other hand, the results can be interpreted as showing that the ability of the discriminant analysis in areas with a ‘slightly damaged’ ranking is limited. Despite the finer resolution of the ALOS-2 data, the Sentinel-1 dataset showed a better performance, which is not surprising, as the latter had a shorter temporal baseline. Figure 8 shows the distance of each building in Amatrice from the epicenter of the earthquake, together with the relevant discriminant score. The average value and standard deviations (solid black circles and error bars) of the ‘no damage’ class in Figure 8b,d are lower than the relevant actual values for the binary map (Figure 8a,c). However, this trend is not observed for ‘collapsed’ buildings (red circles). The trends for both actual classes (Figure 8a,c) and for the discriminated classes (Figure 8b,d) show that the values slightly decrease for those buildings that are located farther from the epicenter. This might occur for two main reasons: first, the quality of each individual building and the corresponding site conditions, which are unknown in this study, or secondly, attenuation of the earthquake waves in more-distant positions.
Once the relationship between the two tests ( and ) is established, the DPMs can be developed by using the following equations, which are extracted from discriminant analyses:
By using a geographical information system (GIS)-oriented method, raster maps were created for Equations (11) and (12). The method permits the calculation of the DPMs for the region on the basis of the existing raster pixel values of and . Figure 9 shows the DPMs for Sentinel-1 and ALOS-2 for Amatrice and its surrounding areas. The red pixels represent suspicious locations where heavy destruction might have occurred, whereas the blue pixels can be interpreted as undamaged areas. In the next sections, we discuss the vulnerability of the town and the accuracy of discriminant analysis for single polarization. We also address some ambiguities in the building classification and the suspicious areas shown in Figure 9 (Boxes 1 and 2).
4. Discussion
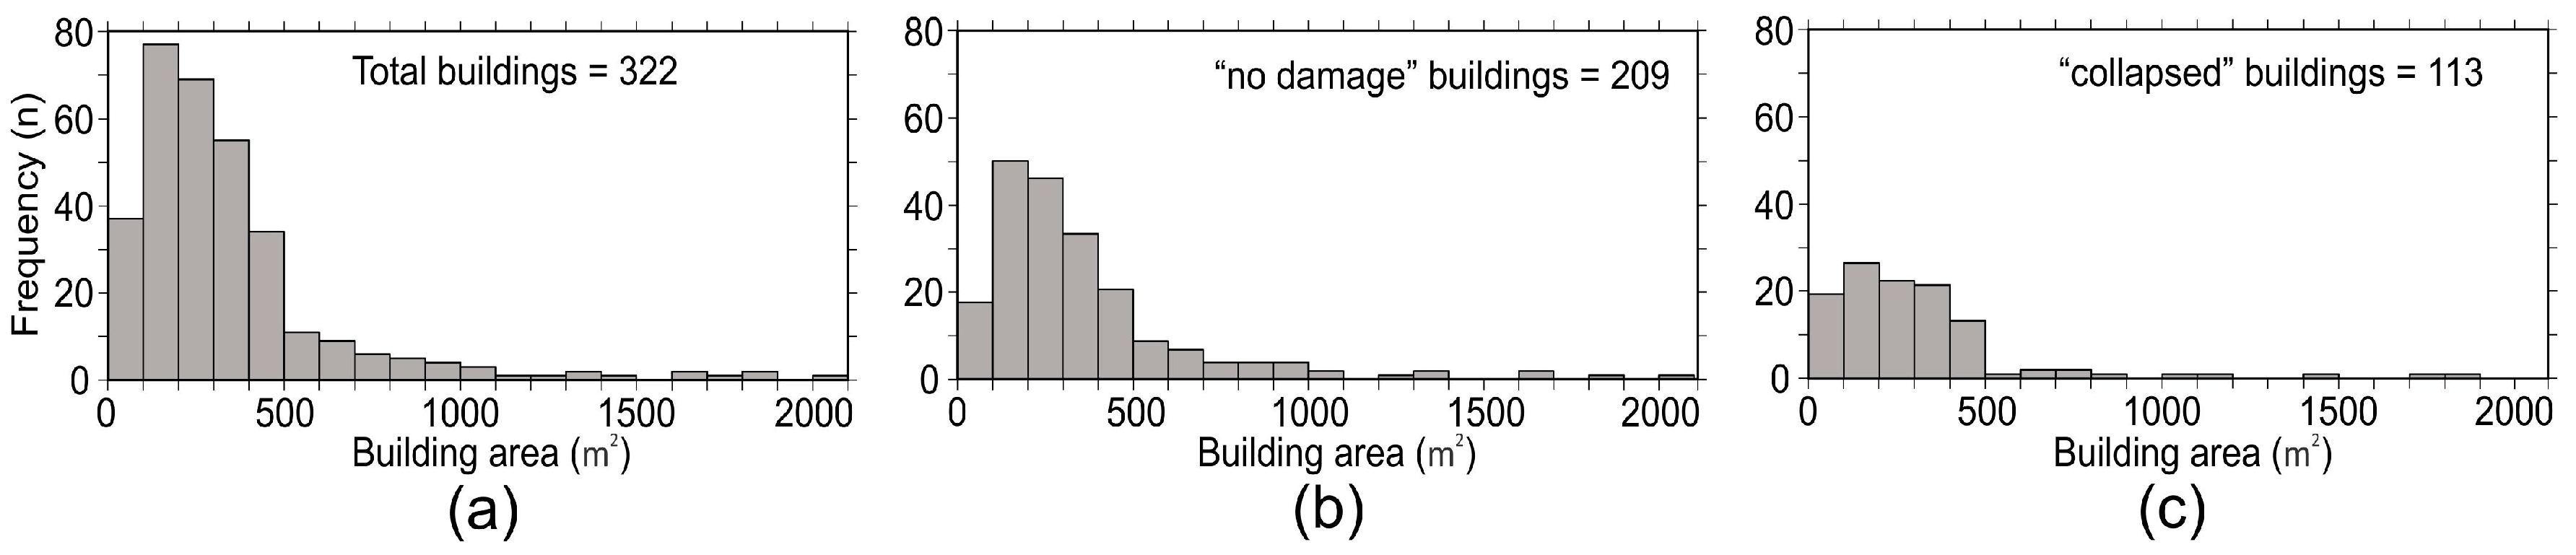
The area of land occupied by each of the buildings was extracted from the binary map. Figure 10a shows that the majority of structures in the town (roughly 57% of all buildings) had areas of less than 300 m2. A comparison of the distribution of all buildings (Figure 10a) and ‘no damage’ buildings (Figure 10b) revealed that the larger buildings (>500 m2) were mostly still standing, but that smaller buildings showed extreme damage. The size of the observed collapsed buildings varied from 50 m2 to 500 m2, but most collapses occurred for buildings with an area of less than 100 m2, of which 50% collapsed (Figure 10c). Many of these buildings were made of brick and stone. According to the EMS-98 building classification, they fell into Class A, which corresponds to the most vulnerable structures. The physical appearance of some of these buildings had been modified or manipulated over a period of years. These modifications, such as the cutting of openings in walls or the addition of terraces, also jeopardized the integrity of the buildings. The high rate of destruction of these smaller buildings shows that although retrofitting work had been done on some of these buildings, due to improper methods and poor maintenance jobs, this failed in most cases [24].
As shown in Table 3 and Figure 11, some collapsed buildings were misclassified as ‘no damage’ buildings, and vice versa. We did not find any mismatches for small buildings (<200 m2) from the Sentinel-1 DPM data, whereas in the ALOS-2 DPM data, a 39% misclassification of small buildings located in the dense areas was observed. All the buildings misclassified in the Sentinel-1 DPM were mid-size buildings (200–400 m2), whereas in the ALOS-2 DPM data, 40% of the misclassified buildings were found, especially in the middle of the town. Due to the coarser resolution, bunches of pixels with higher or lower z-values contaminate the neighboring individual pixels, which represent intact buildings. Consequently, misclassifications generally occur for the medium-resolution images in dense regions. A comparative study using other high-resolution (sub-meter) spotlight SAR data (i.e., TerraSAR-X and COSMO–SkyMed) with the current data should disclose new aspects of the damage.
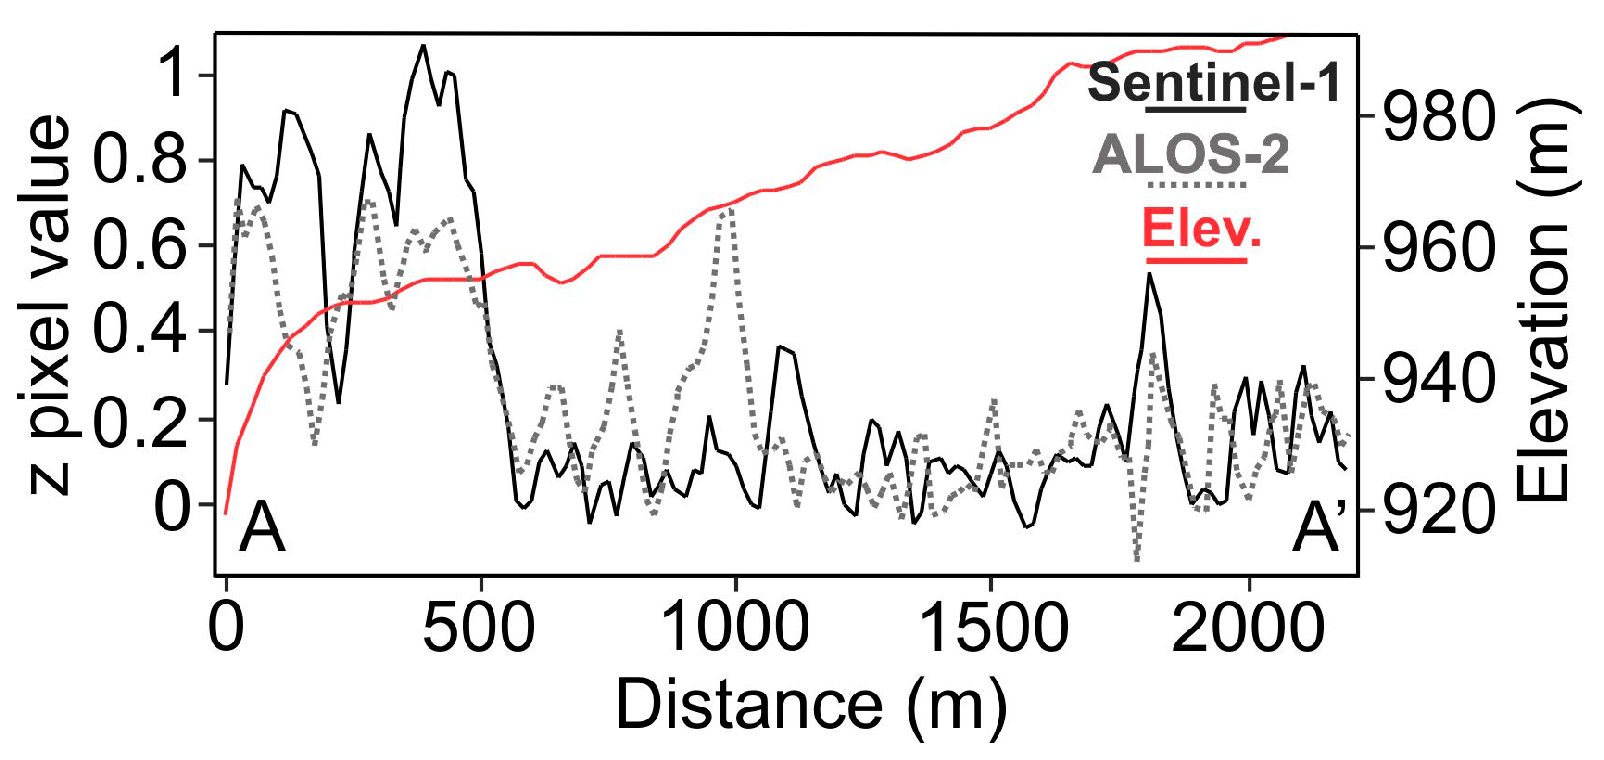
Figure 12 shows a topographic profile (SRTM 30 m), with the aim of revealing any potential correlations between the topography and DPMs. Due to the high sensitivity of DPMs over urban regions, the A–A’ profile was only selected within Amatrice, with a sampling width of 50 m. The location of the profile is shown in Figure 9. A comparison of the -values and topography suggests a reverse correlation, in which the -value decreases with increasing height from west to east. This means that the topography can be assumed to have an effect on the DPMs. It is probable that in higher positions, the rate of erosion is lower and the soil type is coarser. With these conditions, seismic wave amplification would be smaller, whereas at lower heights, it is likely that weak soils containing finer grains are abundant. The -values along the A–A’ profile from the Sentinel-1 and ALOS-2 DPMs show good agreement; however, there are marked differences between them in some areas. In the dense urban area, -values from Sentinel-1 DPM are higher, whereas in the middle of the town, where vegetation is dominant, the -values are considerably higher in the ALOS-2 DPM. This is mainly because of the wavelength characteristics of the C-band and L-band, which have different permeabilities and permittivities over the various objects [27,30].
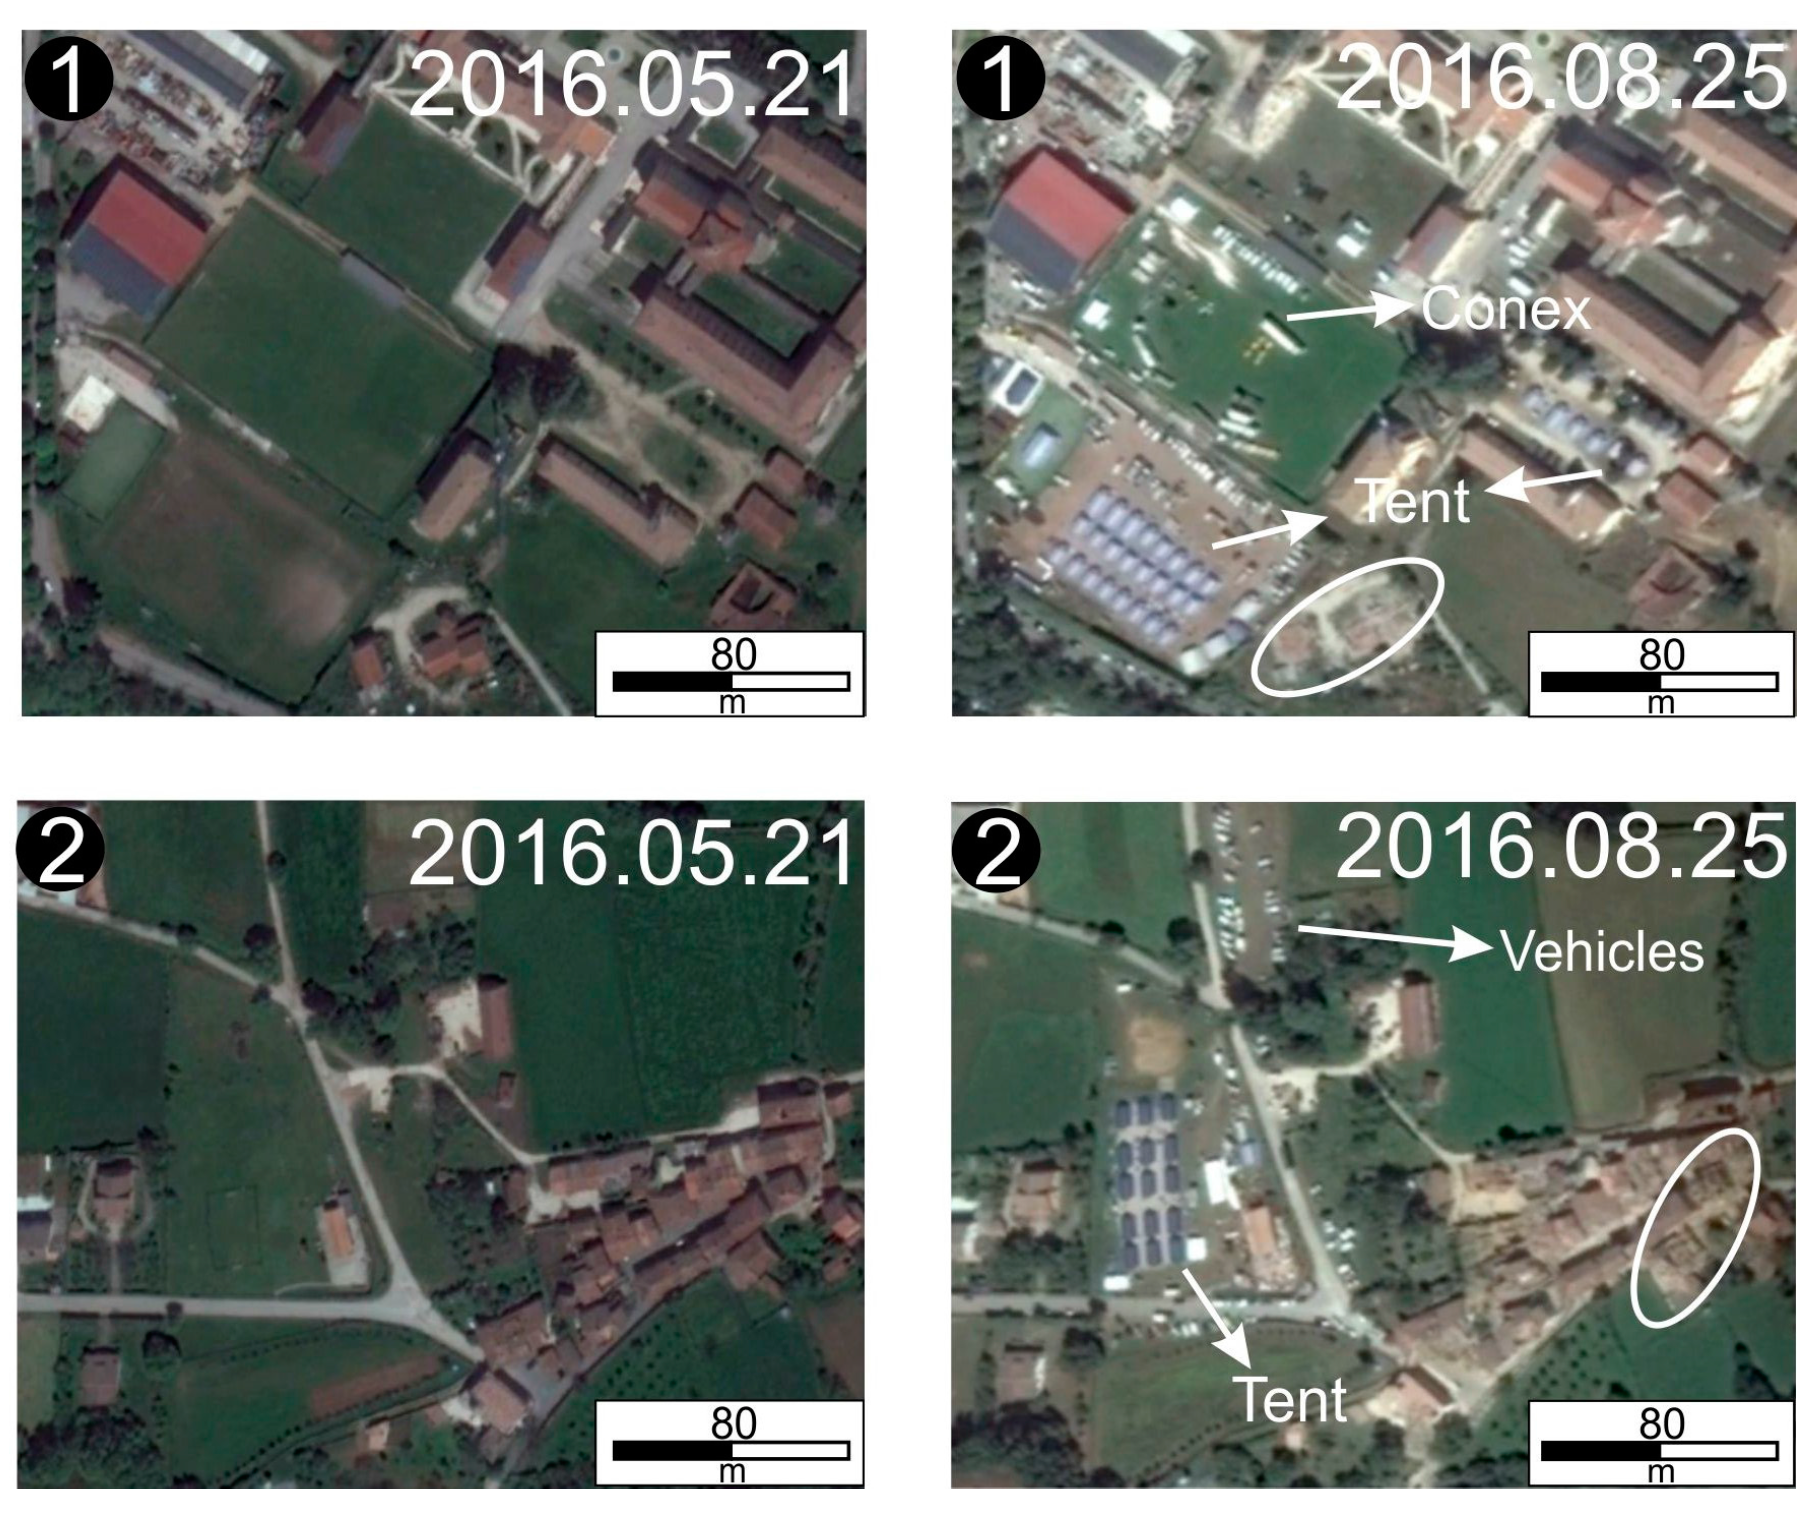
Like differential coherence and intensity maps, the proposed DPMs in this study are also sensitive to temporal changes on the Earth. Thus, the increases in -values do not reflect structural deformations exclusively. Unlike the former maps, they are not highly chaotic, and the higher values (red pixels) can be easily identified by simple visual inspections. In both DPMs, we identified two regions with mutually higher discriminant scores, which are shown by Boxes 1 and 2 in Figure 9. These regions have a sparse built-up area, opening to flat fields or lawns. The first thought was that there might be seasonal changes on the outskirts of the town. Figure 13 shows that despite the presence of some building destruction in these regions, the major changes are related to human activities after the earthquake. The presence of temporary shelters (containers, and Conex boxes) for homeless people produced considerable changes in phase, and these were the main cause of decorrelation in the output maps. The discriminant functions and corresponding coefficients were adopted for the Amatrice region to use the Sentinel-1 and ALOS-2 data. The results imply that the classification accuracy would be improved by applying discriminant functions for the town and its surrounding area. However, they are region-specific functions which are valid only for the study area. Transferability of the functions for a larger area may reduce the capability of the DPMs. For other regions, the development of new functions together with geological information can be applied.
5. Summary and Conclusions
Overall, this study suggests that the integrated method that we used can differentiate collapsed buildings from intact buildings with acceptable accuracy. Two different datasets from Sentinel-1 and ALOS-2 sensors were used to show the capabilities of SAR data in the monitoring of building damage. We proposed a new integrated method that uses dual-polarized data for either the SAR intensity or multitemporal SAR interferometry procedures. We also applied additional filters to the SAR intensity and SAR coherence results before developing the appropriate linear discriminant functions. Then, three main components were quantitatively considered in the discriminant analysis: first, the revised absolute mean differential coherence (); secondly, the absolute mean differential intensity (); and thirdly, the binary map derived from optical imagery. Because the main SAR scattering mechanism over the built-up areas is double-bounce scattering, the incorporation of SAR intensity and SAR coherence for VV and HH polarizations resulted in higher values at an orientation angle () near 0°; moreover, the incorporation of SAR intensity and SAR coherence for VH and HV polarizations also resulted in higher values with [31,32,33]. By incorporating different polarizations, the effect of as an important parameter on both the building orientation and the power signature is taken into account. The accuracy of single polarization VV and VH in the Sentinel-1 data is 77% and 81%. Similar to Sentinel-1, the accuracy of single polarization HH and HV in the ALOS-2 data is 75% and 72%. The results showed that the incorporation of different polarizations improved the accuracy of classification for both datasets, but this improvement was more apparent in the Sentinel-1 dataset. The overall accuracies for the Sentinel-1 and ALOS-2 datasets were 84% and 76%, respectively. Despite its lower spatial resolution, the Sentinel-1 dataset showed a better performance than the ALOS-2 data. This might be related to the shorter temporal baseline of the Sentinel-1 dataset compared with that of the ALOS-2 dataset, which manifests itself in the quality of the coherence maps. However, it must not be forgotten that for satellites with longer revisit intervals, such as ALOS-2, the designated SAR wavelength is longer (L-band) in comparison with the missions such as Sentinel-1, which has shorter revisit intervals and, consequently, a shorter wavelength (C-band). This kind of designation will reduce the disadvantage of missions with longer repeat cycles, but here the results imply that the temporal decorrelation plays an important role on the accuracy of discriminant analysis over built-up areas, regardless of the wavelengths used. The results also suggest that the building size has no significant impact on the accuracy of classification of the buildings. However, an increase in spatial resolution would permit better characterization of the damaged buildings versus undamaged buildings, and reduce relevant misclassifications. To meet this demand, the availability of ultrahigh-resolution SAR images (spotlight SAR data), such as those from TerraSAR-X and COSMO–SkyMed, over the study area must be examined. In addition, the contribution of other side-looking sensors, such as optical imagery and pictometry, might also allow us to present more-relevant damage states, which are usually related to the fronts and sides of buildings. These items can be complemented by ground truth information for future validation works.
Acknowledgments
This study was supported by the Japan Society for the Promotion of Science (JSPS) Grants-in-Aid for scientific research (KAKENHI) number 16F16380 and 15H05134. We would like to express of our gratitude to the Japan Aerospace Exploration Agency (JAXA), which provided the ALOS-2 data through the JAXA working group. We also thank the European Space Agency (ESA) for providing the Sentinel-1 data through Sentinels Scientific Data Hub. We would also like to thank the three anonymous reviewers for their valuable comments on improving the quality of this paper.
Author Contributions
Sadra Karimzadeh and Masashi Matsuoka conceived and designed the experiments. Sadra Karimzadeh and Masashi Matsuoka performed the experiments and analyzed the data. Sadra Karimzadeh created the figures and prepared the manuscript, which has been approved by all the authors.
Conflicts of Interest
The authors declare no conflict of interest.
References
- Karimzadeh, S.; Miyajima, M.; Hassanzadeh, R.; Amiraslanzadeh, R.; Kamel, B. A GIS-based seismic hazard, building vulnerability and human loss assessment for the earthquake scenario in Tabriz. Soil Dyn. Earthq. Eng. 2014, 66, 263–280. [Google Scholar] [CrossRef]
- Karimzadeh, S.; Feizizadeh, B.; Matsuoka, M. From a GIS-based hybrid site condition map to an earthquake damage assessment in Iran: Methods and trends. Int. J. Disaster Risk Reduct. 2017, 22, 23–36. [Google Scholar] [CrossRef]
- Karimzadeh, S. Characterization of land subsidence in Tabriz basin (NW Iran) using InSAR and watershed analyses. Acta Geod. Geophys. 2016, 51, 181–195. [Google Scholar] [CrossRef]
- Nakmuenwai, P.; Yamazaki, F.; Liu, W. Automated Extraction of Inundated Areas from Multi-Temporal Dual Polarization RADARSAT-2 Images of the 2011 Central Thailand Flood. Remote Sens. 2017, 9, 78. [Google Scholar] [CrossRef]
- Yang, X. Urban Remote Sensing: Monitoring, Synthesis and Modeling in the Urban Environment; Wiley-Blackwell: Oxford, UK, 2011. [Google Scholar]
- Plank, S. Rapid Damage Assessment by Means of Multi-Temporal SAR: A Comprehensive Review and Outlook to Sentinel-1. Remote Sens. 2014, 6, 4870–4906. [Google Scholar] [CrossRef]
- Gong, L.X.; Zhang, J.; Zeng, Q.M.; Wu, F. A Survey of Earthquake Damage Detection and Assessment of Buildings Using SAR Imagery. Chin. J. Earthq. Eng. Eng. Vib. 2013, 33, 195–201. (In Chinese) [Google Scholar]
- Matsuoka, M.; Yamazaki, F. Use of Satellite SAR Intensity Imagery for Detecting Building Areas Damaged Due to Earthquakes. Earthq. Spectra 2004, 20, 975–994. [Google Scholar] [CrossRef]
- Matsuoka, M.; Yamazaki, F. Building Damage Mapping of the 2003 Bam, Iran, Earthquake Using Envisat/ASAR Intensity Imagery. Earthq. Spectra 2005, 21, S285–S294. [Google Scholar] [CrossRef]
- Miura, H.; Midorikawa, S.; Matsuoka, M. Building Damage Assessment Using High-Resolution Satellite SAR Images of the 2010 Haiti Earthquake. Earthq. Spectra 2016, 32, 591–610. [Google Scholar] [CrossRef]
- Fielding, E.J.; Talebian, M.; Rosen, P.A.; Nazari, H.; Jackson, J.A.; Ghorashi, M.; Walker, R. Surface Ruptures and Building Damage of the 2003 Bam, Iran, Earthquake Mapped by Satellite Synthetic Aperture Radar Interferometric Correlation. J. Geophys. Res. Solid Earth 2003. [Google Scholar] [CrossRef]
- Yun, S.-H.; Hudnut, K.; Owen, S.; Webb, F.; Simons, M.; Sacco, P.; Gurrola, E.; Manipon, G.; Liang, C.; Fielding, E.; et al. Rapid Damage Mapping for the 2015 Mw 7.8 Gorkha Earthquake Using Synthetic Aperture Radar Data from COSMO–SkyMed and ALOS-2 Satellites. Seismol. Res. Lett. 2015, 86, 1549–1556. [Google Scholar] [CrossRef]
- Matsuoka, M.; Yamazaki, F. Interferometric Characterization of Areas Damaged by the 1995 Kobe Earthquake Using Satellite SAR images. In Proceedings of the 12th World Conference on Earthquake Engineering, Auckland, New Zealand, 30 January–4 February 2000. [Google Scholar]
- Yonezawa, C.; Takeuchi, S. Decorrelation of SAR Data by Urban Damages Caused by the 1995 Hyogoken-nanbu Earthquake. Int. J. Remote Sens. 2001, 22, 1585–1600. [Google Scholar] [CrossRef]
- Takeuchi, S.; Suga, Y.; Yonezawa, C.; Chen, A.J. Detection of Urban Disaster Using InSAR: A Case Study for the 1999 Great Taiwan Earthquake. In Proceedings of the IEEE 2000 International Geoscience and Remote Sensing Symposium, Honolulu, HI, USA, 24–28 July 2000. [Google Scholar]
- Arciniegas, G.A.; Bijker, W.; Kerle, N.; Tolpekin, V.A. Coherence- and Amplitude-Based Analysis of Seismogenic Damage in Bam, Iran, Using ENVISAT ASAR Data. IEEE Trans. Geosci. Remote Sens. 2007, 45, 1571–1581. [Google Scholar] [CrossRef]
- Chini, M.; Bignami, C.; Stramondo, S.; Pierdicca, N. Uplift and Subsidence Due to the 26 December 2004 Indonesian Earthquake Detected by SAR Data. Int. J. Remote Sens. 2008, 29, 3891–3910. [Google Scholar] [CrossRef]
- Stramondo, S.; Bignami, C.; Chini, M.; Pierdicca, N.; Tertulliani, A. Satellite Radar and Optical Remote Sensing for Earthquake Damage Detection: Results from Different Case Studies. Int. J. Remote Sens. 2006, 27, 4433–4447. [Google Scholar] [CrossRef]
- Arciniegas, G.A. Earthquake-Induced Urban Damage Analysis Using Interferometric SAR Data. Master’s Thesis, International Institute for Geo-Information Science and Earth Observation, Enschede, The Netherlands, 2005. [Google Scholar]
- Chen, S.; Sato, M. Tsunami Damage Investigation of Built-Up Areas Using Multitemporal Spaceborne Full Polarimetric SAR Images. IEEE Trans. Geosci. Remote Sens. 2013, 51, 1985–1997. [Google Scholar] [CrossRef]
- Li, X.; Guo, H.; Zhang, L.; Chen, X.; Liang, L. A New Approach to Collapsed Building Extraction Using RADARSAT-2 Polarimetric SAR imagery. IEEE Trans Geosci. Remote Sens. Lett. 2012, 9, 677–681. [Google Scholar]
- Watanabe, M.; Motohka, T.; Miyagi, Y.; Yonezawa, C.; Shimada, M. Analysis of Urban Areas Affected by the 2011 Off the Pacific Coast of Tohoku Earthquake and Tsunami with L-Band SAR Full-Polarimetric Mode. IEEE Trans. Geosci. Remote Sens. Lett. 2012, 9, 472–476. [Google Scholar] [CrossRef]
- INGV Working Group on the Amatrice Earthquake. Second Summary Report on the ML 6.0 Amatrice Earthquake of 24 August 2016 (Central Italy). Rome, 2016. Available online: https://ingvterremoti.files.wordpress.com/2016/11/en20160920_secondo_rapporto_finale_del-2408def.pdf (accessed on 8 February 2017).
- Azzaro, R.; Tertulliani, A.; Bernardini, F.; Camassi, R.; Del Mese, S.; Ercolani, E.; Graziani, L.; Locati, M.; Maramai, A.; Pessina, V.; et al. The 24 August 2016 Amatrice Earthquake: Macroseismic Survey in the Damage Area and EMS intensity Assessment. Ann. Geophys. 2016. [Google Scholar] [CrossRef]
- Grünthal, G. European Macroseismic Scale 1998 (EMS-98); Conseil de l’Europe: Luxembourg, 1998. [Google Scholar]
- Prompt Assessment of Global Earthquakes for Response (PAGER). Available online: http://earthquake.usgs.gov/data/pager/ (accessed on 8 February 2017).
- Matsuoka, M.; Nojima, N. Building Damage Estimation by Integration of Seismic Intensity Information and Satellite L-band SAR Imagery. Remote Sens. 2010, 9, 2111–2126. [Google Scholar] [CrossRef]
- Lee, J.S. Digital Image Enhancement and Noise Filtering by Use of Local Statistics. IEEE Trans. Pattern Anal. Mach. Intell. 1980. [Google Scholar] [CrossRef]
- Bürgmann, R.; Rosen, P.A.; Fielding, E.J. Synthetic Aperture Radar Interferometry to Measure Earth’s Surface Topography and Its Deformation. Annu. Rev. Earth Planet. Sci. 2000, 28, 169–209. [Google Scholar] [CrossRef]
- Matsuoka, M.; Yamazaki, F. Comparative Analysis for Detecting Areas with Building Damage from Several Destructive Earthquakes Using Satellite Synthetic Aperture Radar Images. J. Appl. Remote Sens. 2010, 4, 041867. [Google Scholar]
- Kimura, H. Radar Polarization Orientation Shifts in Built-Up Areas. IEEE Trans. Geosci. Remote Sens. Lett. 2008, 5, 217–221. [Google Scholar] [CrossRef]
- Watanabe, M.; Thapa, R.B.; Ohsumi, T.; Fujiwara, H.; Yonezawa, C.; Tomii, N.; Suzuki, S. Detection of Damaged Urban Areas Using Interferometric SAR Coherence Change with PALSAR‑2. Earth Planets Space 2016. [Google Scholar] [CrossRef]
- Ferro, A.; Brunner, D.; Bruzzone, L.; Lemoine, G. On the Relationship between Double Bounce and the Orientation of Buildings in VHR SAR Images. IEEE Geosci. Remote Sens. Lett. 2011, 8, 612–616. [Google Scholar] [CrossRef]
Figure 1.
Distribution of aftershocks and the main shock M 6.2 (red asterisk) overlaid with a PGA map provided by the Istituto Nazionale di Geofisica e Vulcanologia (INGV). The focal mechanism indicates normal faulting in a NW–SE direction.
Figure 1.
Distribution of aftershocks and the main shock M 6.2 (red asterisk) overlaid with a PGA map provided by the Istituto Nazionale di Geofisica e Vulcanologia (INGV). The focal mechanism indicates normal faulting in a NW–SE direction.
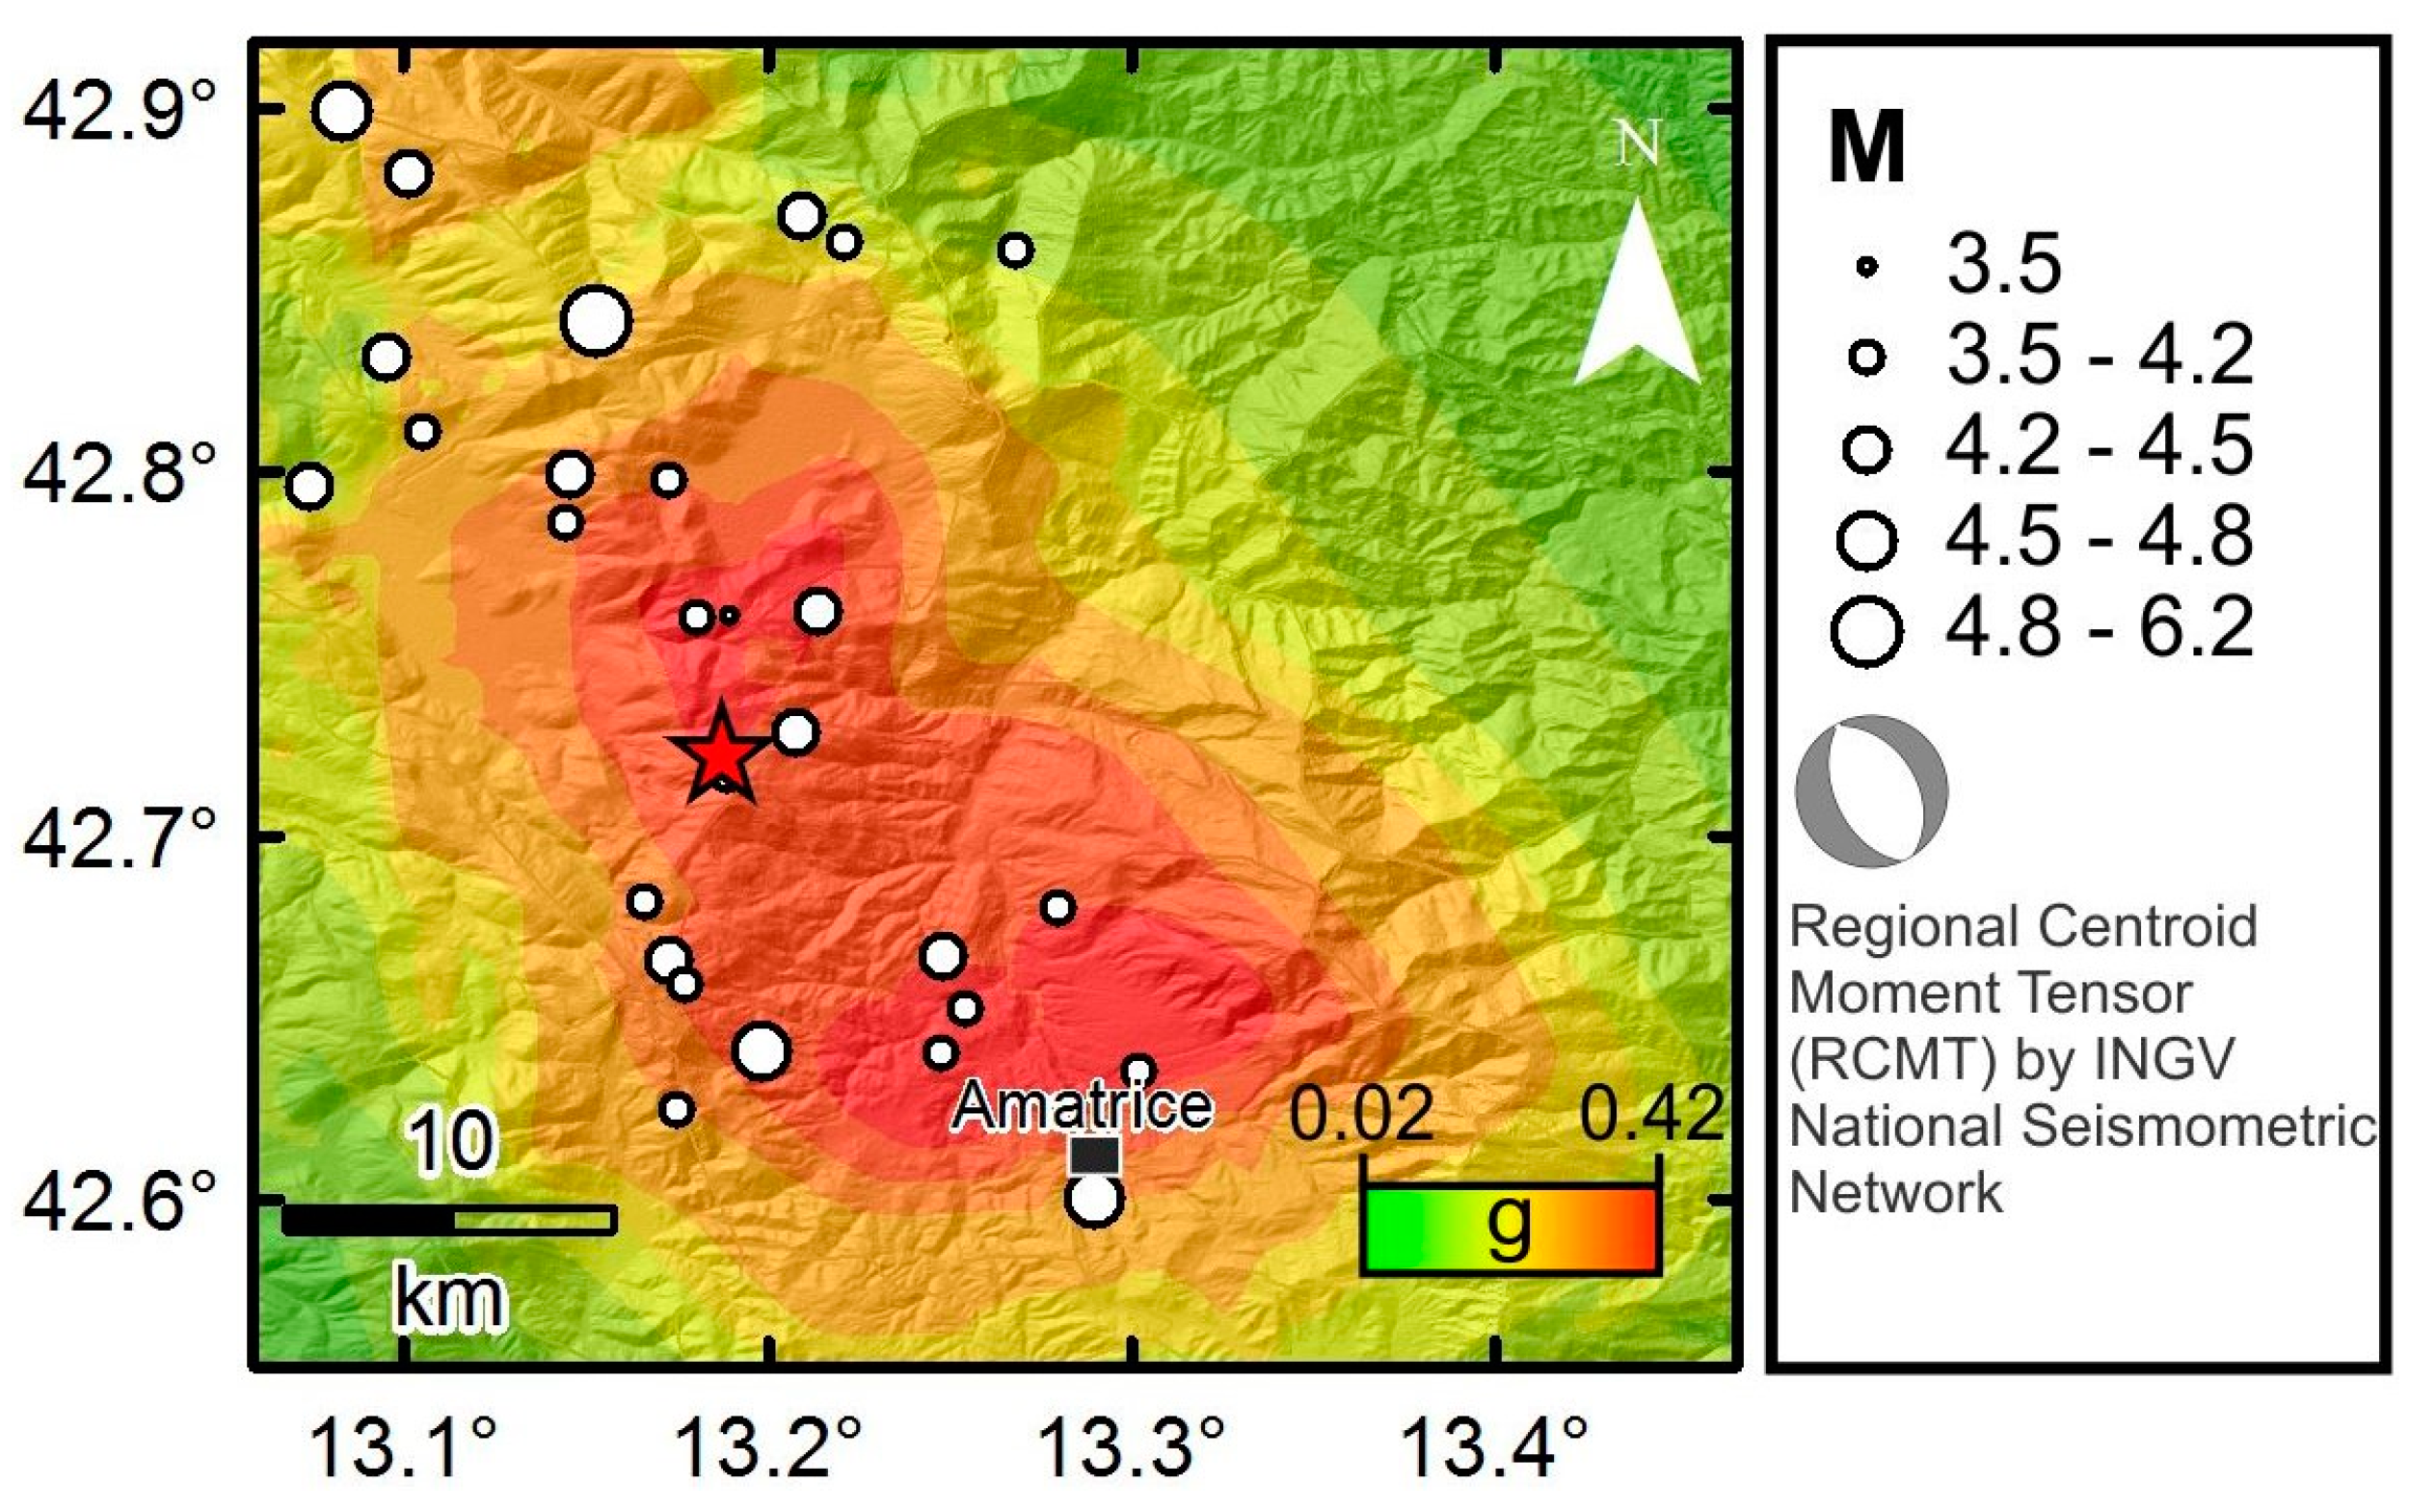
Figure 2.
(a) Pre-event; and (b) post-event optical images of Amatrice, obtained by DigitalGlobe’s WorldView satellites; (c) Binary map produced by visual inspection; (d) Examples of binary classification. The blue polygons are ‘no damage’ buildings, and the red polygons are ‘collapsed’ buildings. It must be noted that in this study “no damage” buildings are not exclusively intact buildings. They may have structural or non-structural damages which are invisible in satellite images.
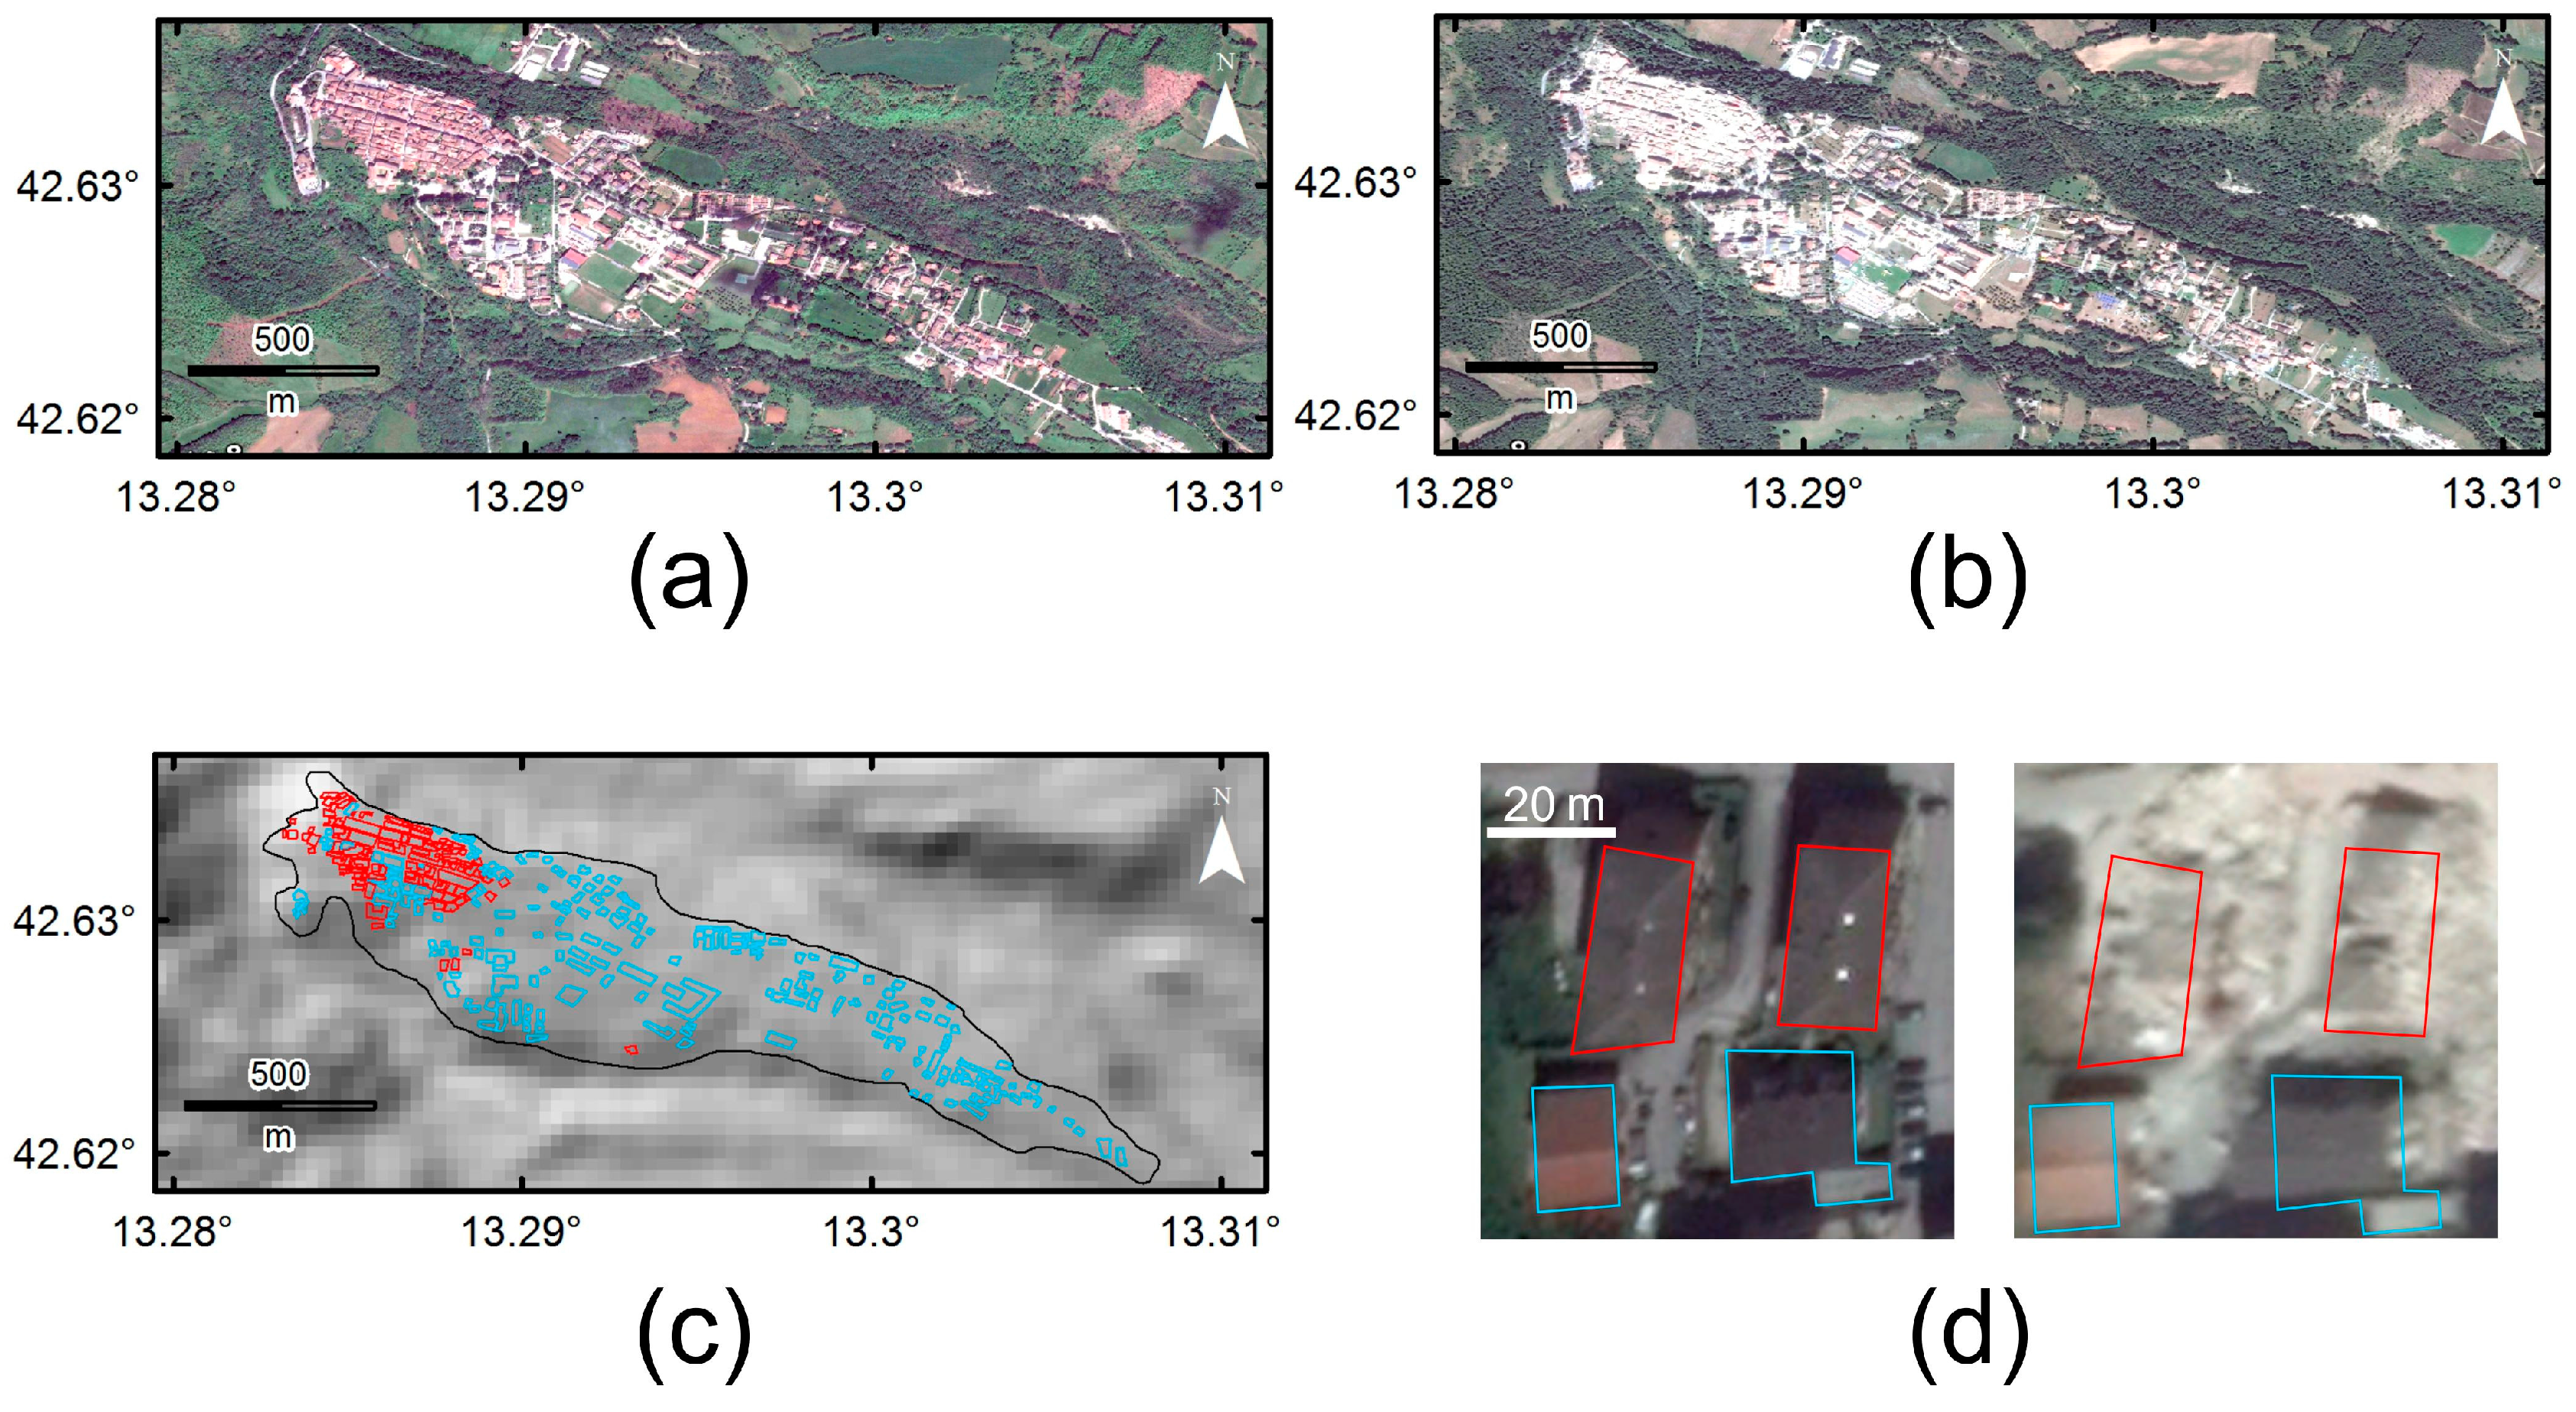
Figure 3.
Interferograms generated from descending orbits: (a) the co-seismic pair of Sentinel-1 (2016/08/09 VV and 2016/09/02 VV); (b) the co-seismic pair of ALOS-2 (2016/05/25 HH and 2016/08/31 HH).
Figure 3.
Interferograms generated from descending orbits: (a) the co-seismic pair of Sentinel-1 (2016/08/09 VV and 2016/09/02 VV); (b) the co-seismic pair of ALOS-2 (2016/05/25 HH and 2016/08/31 HH).
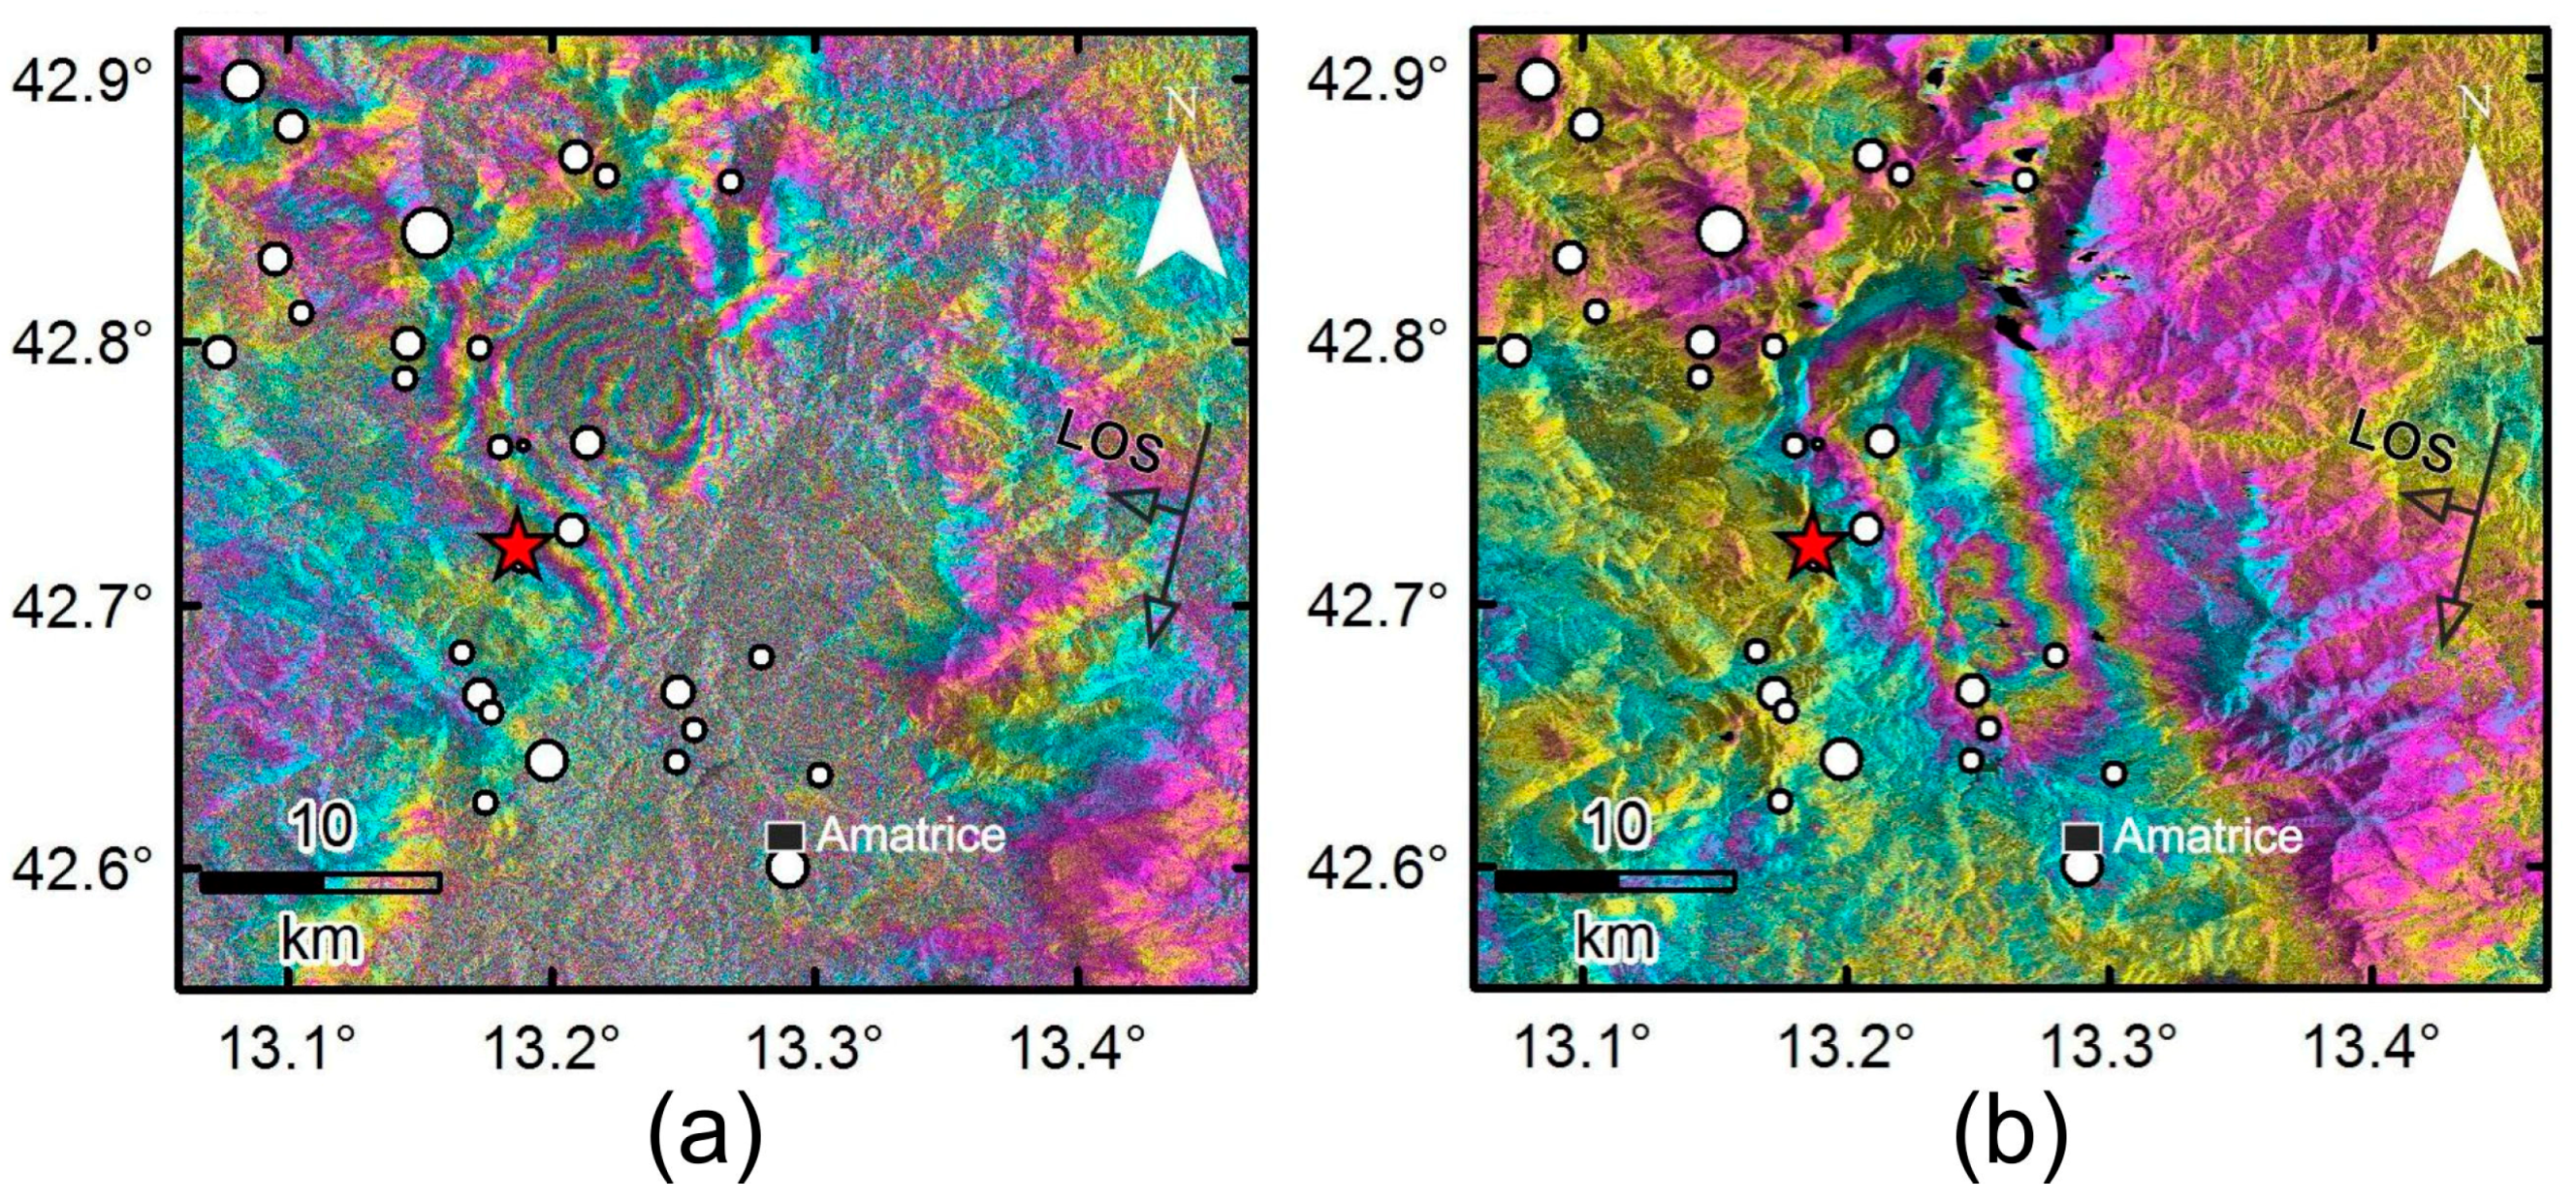
Figure 4.
Pre- and post-event Sentinel-1 (a–d); and ALOS-2 (e–h) intensity images for the target area. The red boundary defines the town of Amatrice.
Figure 4.
Pre- and post-event Sentinel-1 (a–d); and ALOS-2 (e–h) intensity images for the target area. The red boundary defines the town of Amatrice.
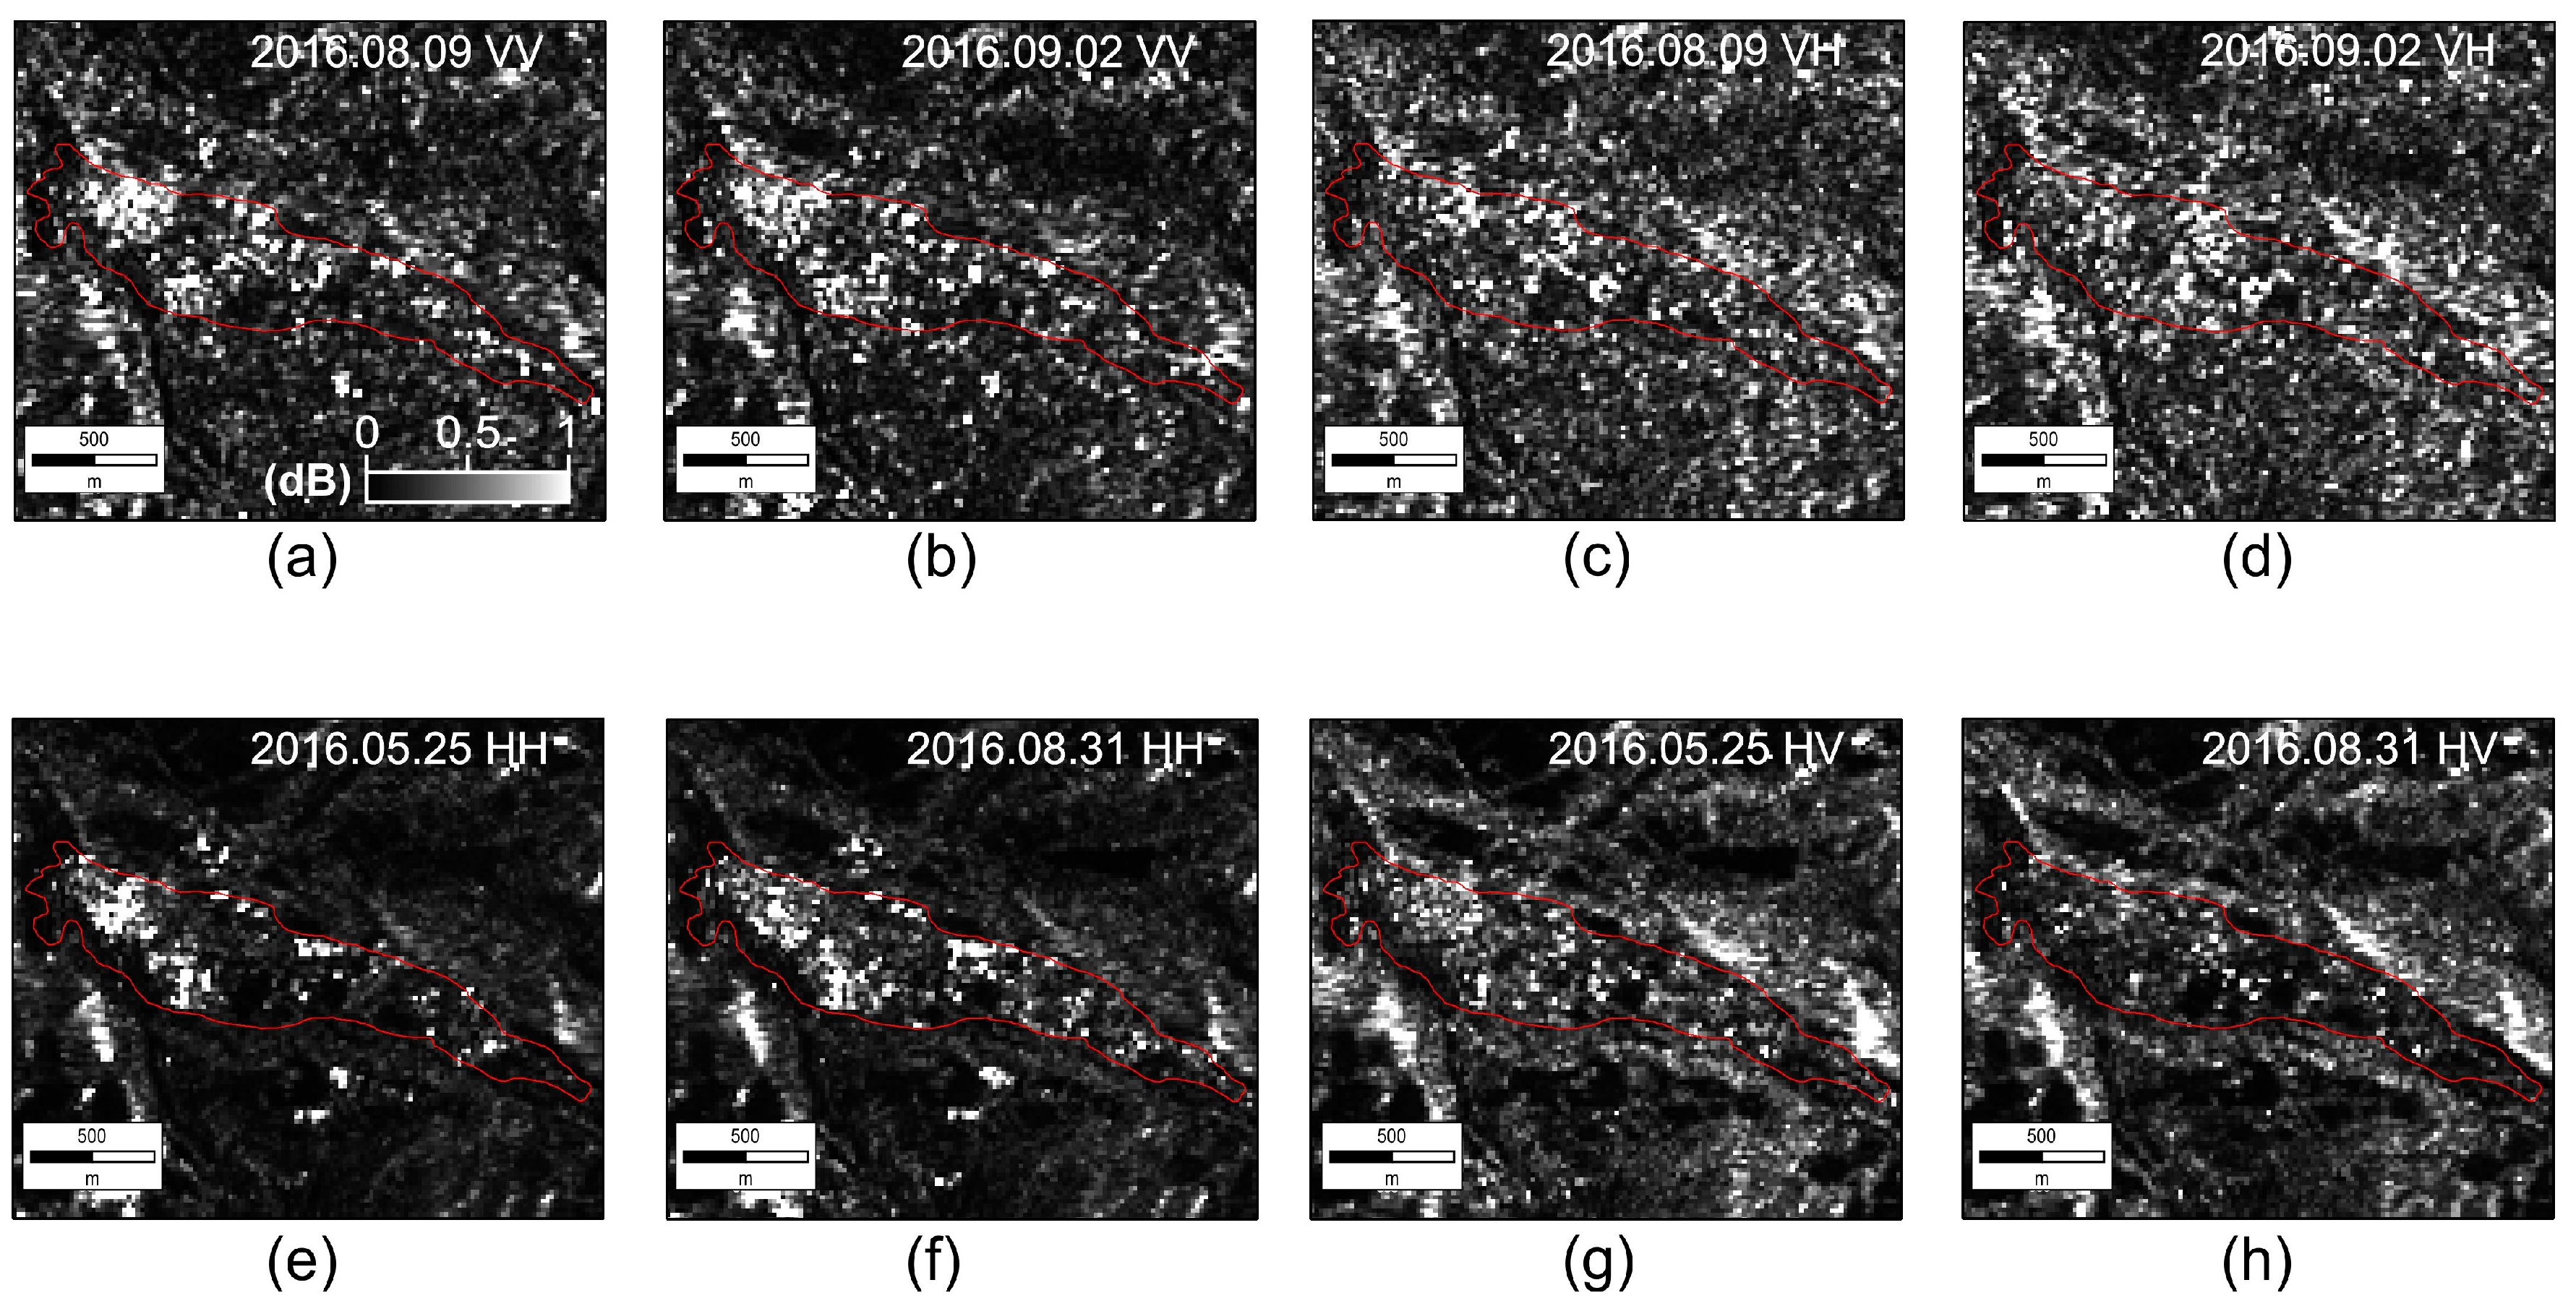
Figure 5.
Pre-event and co-seismic coherence () of Sentinel-1 data (a–d); and ALOS-2 data (e–h) in the target area.
Figure 5.
Pre-event and co-seismic coherence () of Sentinel-1 data (a–d); and ALOS-2 data (e–h) in the target area.

Figure 6.
Coherence distribution of Amatrice buildings in different polarizations for Sentinel-1 (a–d); and ALOS-2 (e–h).
Figure 6.
Coherence distribution of Amatrice buildings in different polarizations for Sentinel-1 (a–d); and ALOS-2 (e–h).
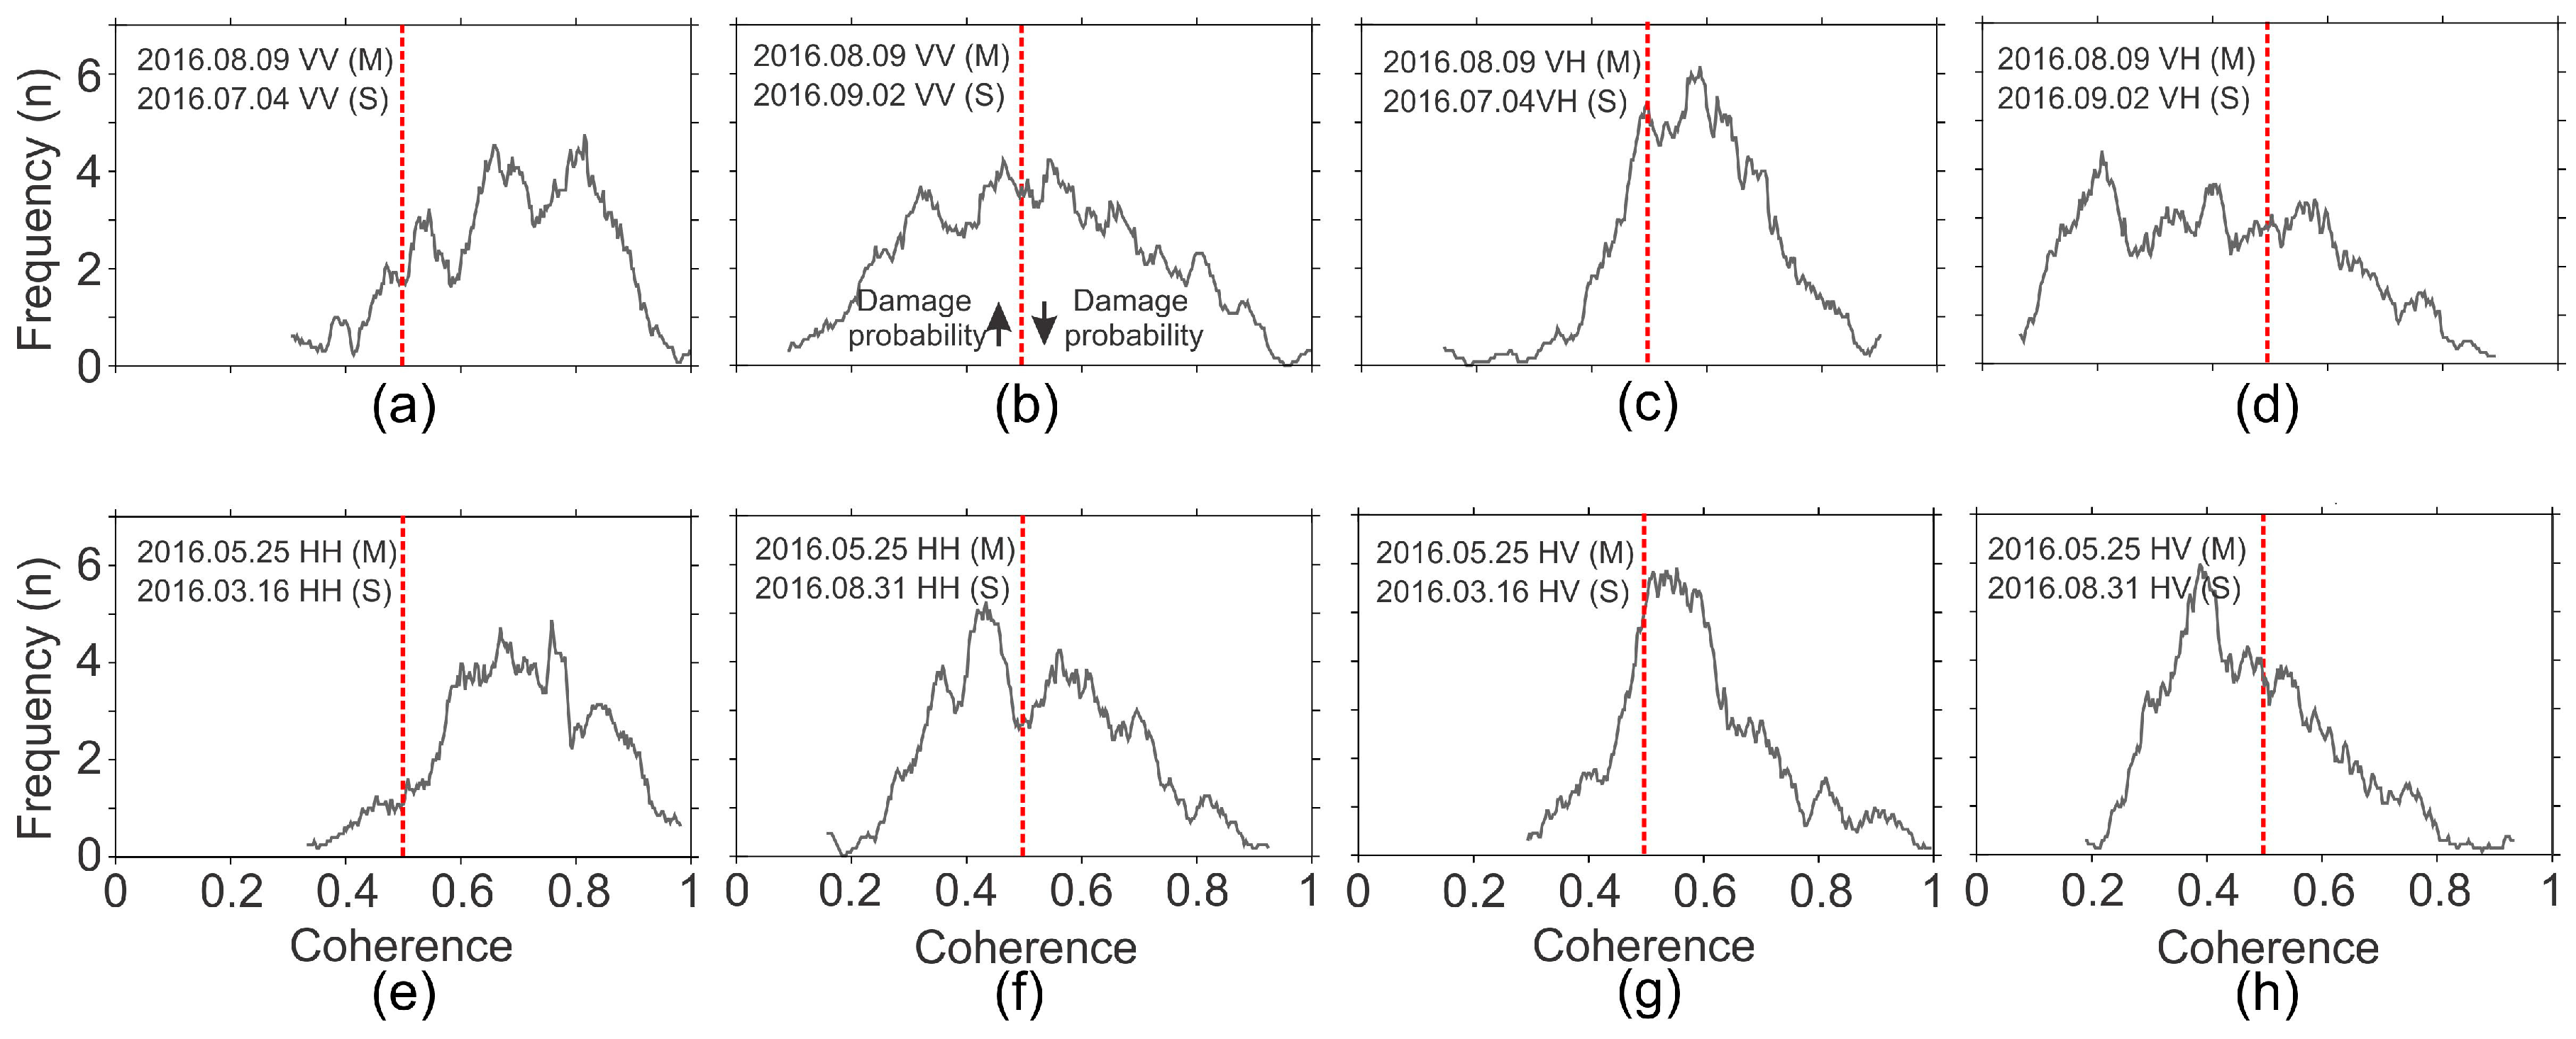
Figure 7.
Comparison of and in (a) Sentinel-1 ‘no damage’ buildings; (b) Sentinel-1 ‘collapsed’ buildings; (c) ALOS-2 ‘no damage’ buildings; and (d) ALOS-2 ‘collapsed’ buildings. The dashed discriminant lines were deduced from the relative discriminant analyses. The solid black circles are the average values, and the error bars show the standard deviations.
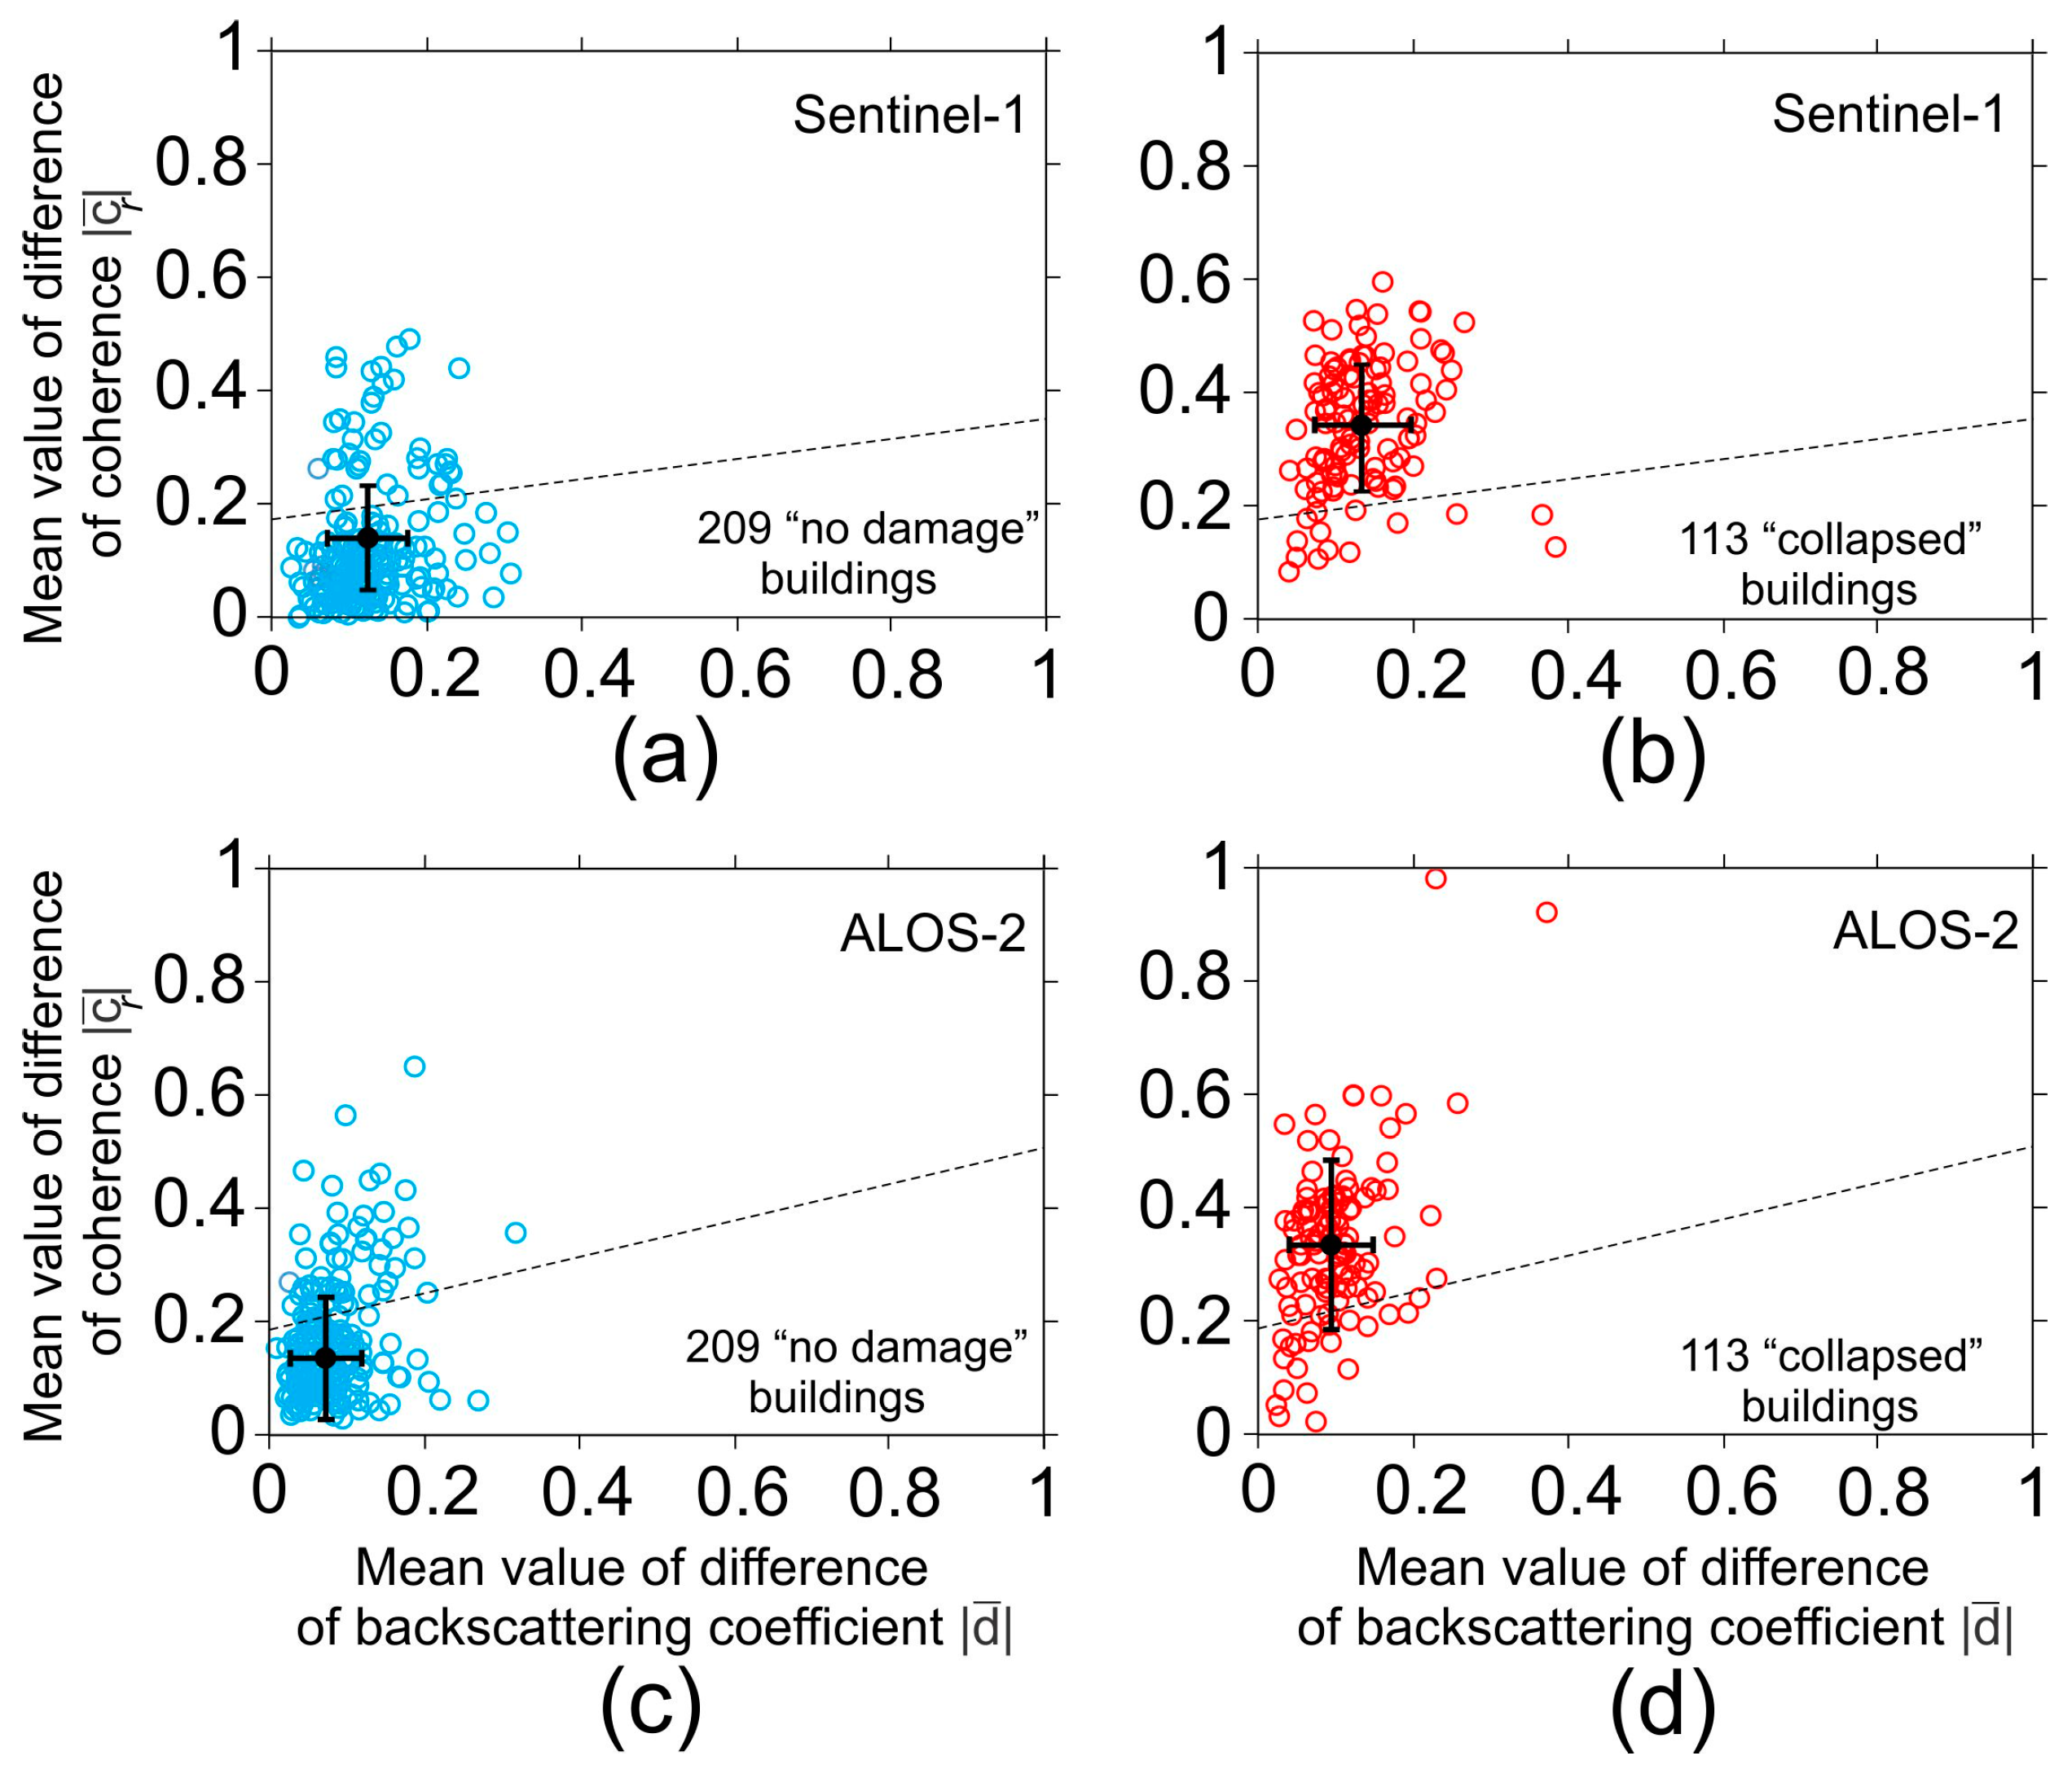
Figure 8.
Comparison of the discriminant score for each individual building and the corresponding distance from the epicenter: (a) for actual classes of the Sentinel-1 dataset; (b) for discriminated classes of the Sentinel-1 dataset; (c) for actual classes of the ALOS-2 dataset; (d) for discriminated classes of the ALOS-2 dataset. The solid black circles are average values, and the error bars are standard deviations. The black triangles in (b,d) are the cutoff points, deduced from relative discriminant analyses.

Figure 9.
DPM from (a) Sentinel-1; and (b) from ALOS-2 for Amatrice. The thick dashed lines are the profiles along the town shown in Figure 12. The brackets show the sampling width for the -score. Rectangles 1 and 2 indicate the suspicious -scores shown in Figure 13.
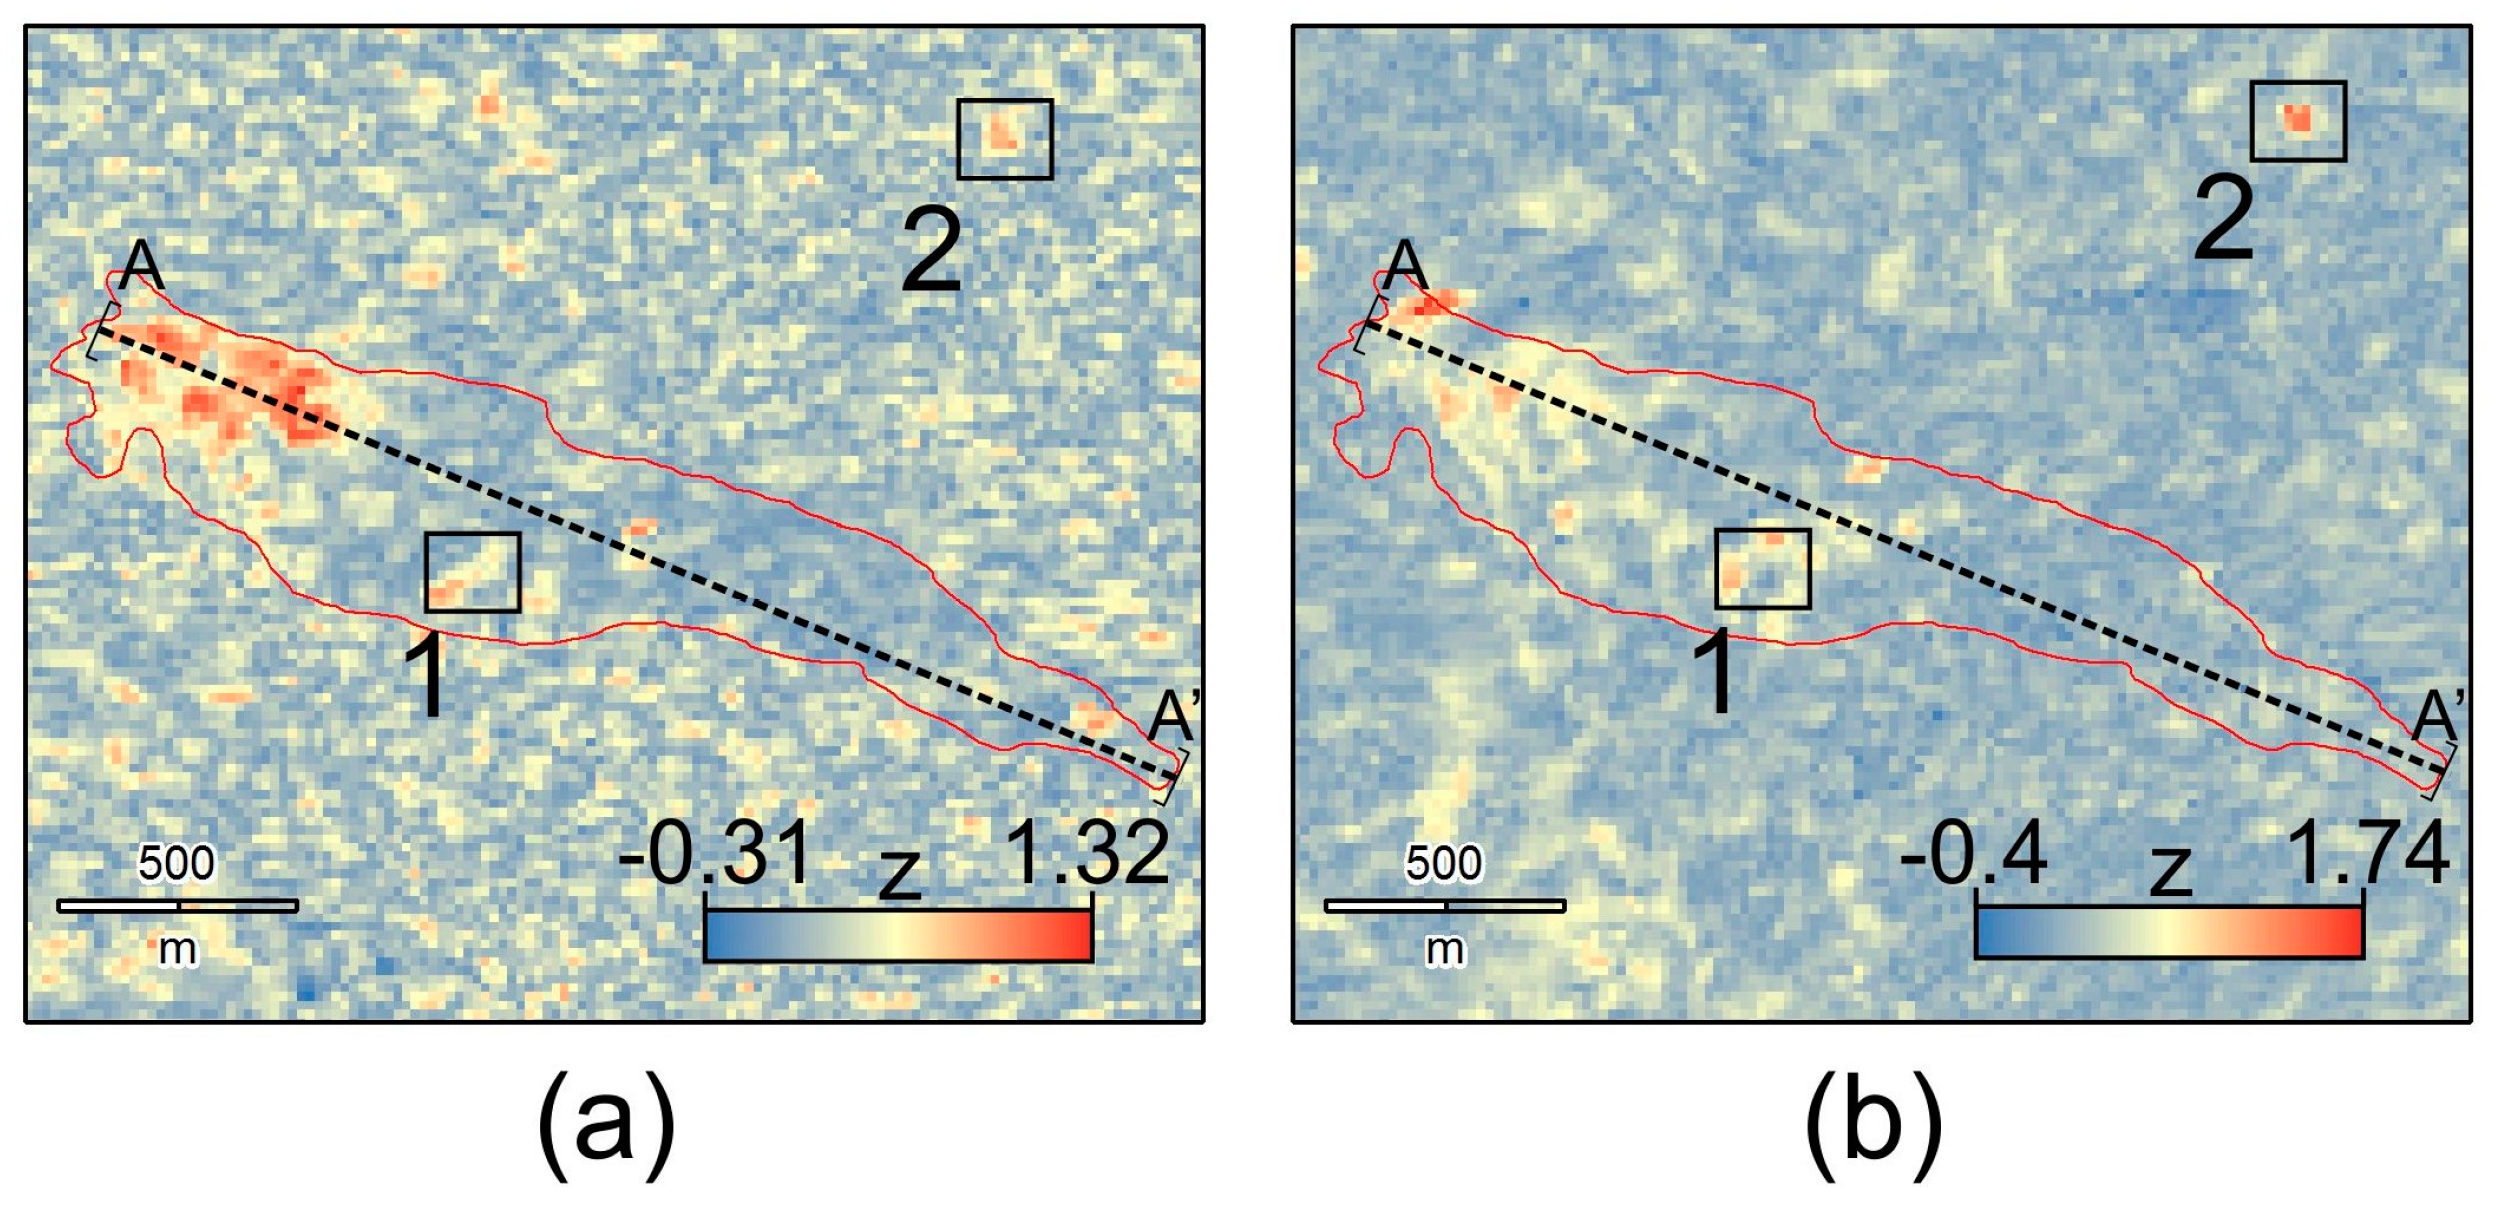
Figure 10.
Histograms of the building area in Amatrice: (a) for total buildings; (b) for ‘no damage’ buildings; and (c) for ‘collapsed’ buildings.
Figure 10.
Histograms of the building area in Amatrice: (a) for total buildings; (b) for ‘no damage’ buildings; and (c) for ‘collapsed’ buildings.

Figure 11.
Binary maps for Amatrice deduced from: (a) the Sentinel-1 dataset; and (b) the ALOS-2 dataset; (c) Binary map produced from optical imagery.
Figure 11.
Binary maps for Amatrice deduced from: (a) the Sentinel-1 dataset; and (b) the ALOS-2 dataset; (c) Binary map produced from optical imagery.
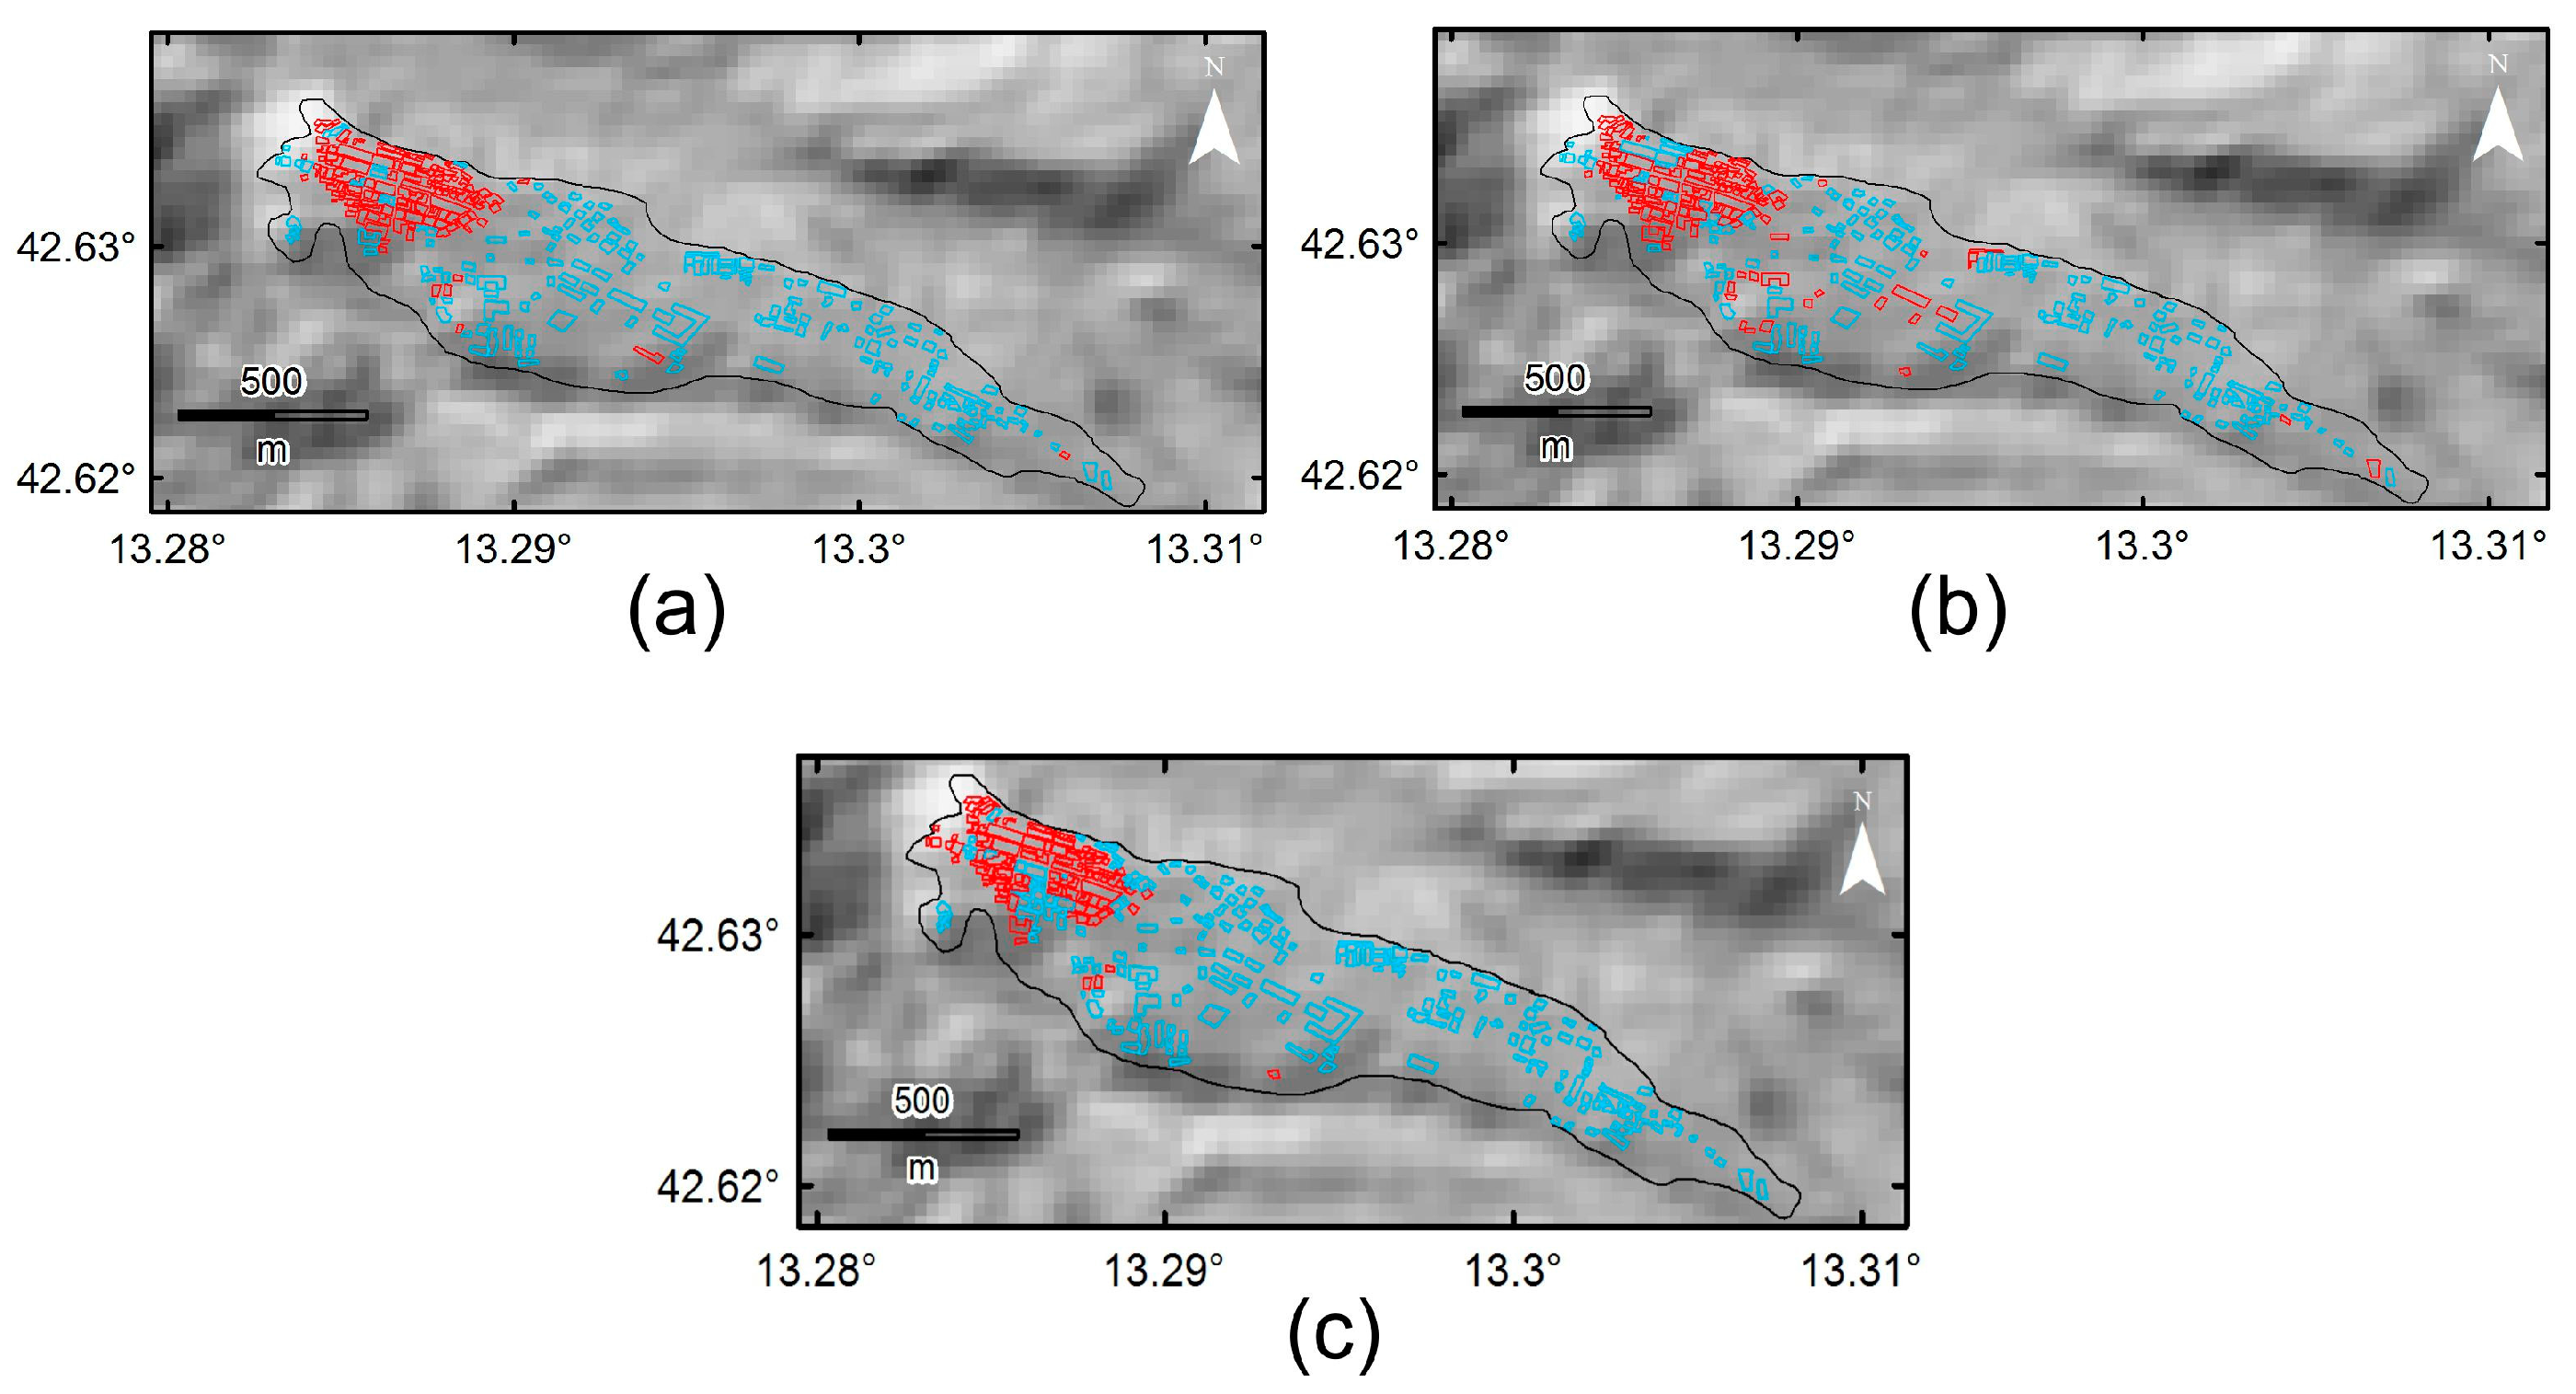
Figure 12.
DPM profiles (Sentinel-1 in black and ALOS-2 in gray) and topographic profiles (SRTM 30 m in red) along A–A’ shown in Figure 9.
Figure 12.
DPM profiles (Sentinel-1 in black and ALOS-2 in gray) and topographic profiles (SRTM 30 m in red) along A–A’ shown in Figure 9.

Figure 13.
Optical images before the earthquake (left) and after the earthquake (right). See their location in Figure 9. White ovals indicate destroyed buildings. White arrows indicate man-made changes for temporary settlement of the affected people.
Figure 13.
Optical images before the earthquake (left) and after the earthquake (right). See their location in Figure 9. White ovals indicate destroyed buildings. White arrows indicate man-made changes for temporary settlement of the affected people.


Table 1.
Detailed SAR information used for this study. , , and are the incidence angle, normal baseline, and temporal baseline, respectively.
Table 1.
Detailed SAR information used for this study. , , and are the incidence angle, normal baseline, and temporal baseline, respectively.
| Sensor | Mode | Date (yyyy/mm/dd) | Polarization | Pass Direction | |||
|---|---|---|---|---|---|---|---|
| Sentinel-1 (C-band) | IW | 4 July 2016 | 39.4 | VV/VH | D | 138 | 36 |
| Sentinel-1 (C-band) | IW | 9 August 2016 | 39.4 | VV/VH | D | 0 | 0 |
| Sentinel-1 (C-band) | IW | 2 September 2016 | 39.4 | VV/VH | D | 38 | 24 |
| ALOS-2 (L-band) | SM3 | 16 March 2016 | 36.2 | HH/HV | D | −142 | 70 |
| ALOS-2 (L-band) | SM3 | 25 May 2016 | 36.2 | HH/HV | D | 0 | 0 |
| ALOS-2 (L-band) | SM3 | 31 August 2016 | 36.2 | HH/HV | D | −88 | 98 |
Table 2.
Regression statistics of independent variables ( and ) and the binary map for Sentinel-1 and ALOS-2 datasets.
Table 2.
Regression statistics of independent variables ( and ) and the binary map for Sentinel-1 and ALOS-2 datasets.
| Sentinel-1 | ALOS-2 | ||
|---|---|---|---|
| Number of buildings | 322 | Number of buildings | 322 |
| R Square | 0.433 | R Square | 0.306 |
| Multiple R | 0.658 | Multiple R | 0.553 |
| Standard error | 0.360 | Standard error | 0.399 |
| Intercept coefficient | −0.052 | Intercept coefficient | −0.012 |
| −0.383 | −0.641 | ||
| 2.209 | 1.866 | ||
| Cutoff point | 0.350 | Cutoff point | 0.352 |
Table 3.
Accuracy of building classification according to the discriminant analysis and the binary map for Sentinel-1 and ALOS-2 datasets.
Table 3.
Accuracy of building classification according to the discriminant analysis and the binary map for Sentinel-1 and ALOS-2 datasets.
| Sentinel-1 | ALOS-2 | ||
|---|---|---|---|
| 171 | 157 | ||
| 99 | 88 | ||
| Misclassified | 52 | Misclassified | 77 |
| Total correct | 270 | Total correct | 245 |
| Total accuracy (%) | 84 | Total accuracy (%) | 76 |
| User’s accuracy (%) | 86 | User’s accuracy (%) | 82 |
| Producer’s accuracy (%) | 88 | Producer’s accuracy (%) | 82 |
Table 4.
Results of the accuracy assessment of different approaches.
| Sentinel-1 | Total Accuracy (%) | ALOS-2 | Total Accuracy (%) |
|---|---|---|---|
| Mean differential intensity approach () | 50 | Mean differential intensity approach () | 44 |
| Mean differential coherence approach () | 78 | Mean differential coherence approach () | 70 |
| Integrated approach () | 84 | Integrated approach () | 76 |
© 2017 by the authors. Licensee MDPI, Basel, Switzerland. This article is an open access article distributed under the terms and conditions of the Creative Commons Attribution (CC BY) license (http://creativecommons.org/licenses/by/4.0/).
Share and Cite
MDPI and ACS Style
Karimzadeh, S.; Mastuoka, M. Building Damage Assessment Using Multisensor Dual-Polarized Synthetic Aperture Radar Data for the 2016 M 6.2 Amatrice Earthquake, Italy. Remote Sens. 2017, 9, 330. https://doi.org/10.3390/rs9040330
AMA Style
Karimzadeh S, Mastuoka M. Building Damage Assessment Using Multisensor Dual-Polarized Synthetic Aperture Radar Data for the 2016 M 6.2 Amatrice Earthquake, Italy. Remote Sensing. 2017; 9(4):330. https://doi.org/10.3390/rs9040330
Chicago/Turabian StyleKarimzadeh, Sadra, and Masashi Mastuoka. 2017. "Building Damage Assessment Using Multisensor Dual-Polarized Synthetic Aperture Radar Data for the 2016 M 6.2 Amatrice Earthquake, Italy" Remote Sensing 9, no. 4: 330. https://doi.org/10.3390/rs9040330
Note that from the first issue of 2016, this journal uses article numbers instead of page numbers. See further details here.