
Object-Oriented Landslide Mapping Using ZY-3 Satellite Imagery, Random Forest and Mathematical Morphology, for the Three-Gorges Reservoir, China


1
Institute of Geophysics and Geomatics, China University of Geosciences, Wuhan 430074, China
2
Surveying and Geospatial Engineering, School of Civil and Environmental Engineering, The University of New South Wales, Sydney, NSW 2052, Australia
*
Author to whom correspondence should be addressed.
Remote Sens. 2017, 9(4), 333; https://doi.org/10.3390/rs9040333
Submission received: 9 January 2017
/
Revised: 27 March 2017
/
Accepted: 29 March 2017
/
Published: 31 March 2017
(This article belongs to the Special Issue Remote Sensing of Landslides)
Abstract
:Landslide mapping (LM) has recently become an important research topic in remote sensing and geohazards. The area near the Three Gorges Reservoir (TGR) along the Yangtze River in China is one of the most landslide-prone regions in the world, and the area has suffered widespread and significant landslide events in recent years. In our study, an object-oriented landslide mapping (OOLM) framework was proposed for reliable and accurate LM from ‘ZY-3’ high spatial resolution (HSR) satellite images. The framework was based on random forests (RF) and mathematical morphology (MM). RF was first applied as an object feature information reduction tool to identify the significant features for describing landslides, and it was then combined with MM to map the landslides. Three object-feature domains were extracted from the ‘ZY-3’ HSR data: layer information, texture, and geometric features. A total group of 124 features and 24 landslides were used as inputs to determine the landslide boundaries and evaluate the landslide classification accuracy. The results showed that: (1) the feature selection (FS) method had a positive influence on effective landslide mapping; (2) by dividing the data into two sets, training sets which consisted of 20% of the landslide objects (OLS) and non-landslide objects (ONLS), and test sets which consisted of the remaining 80% of the OLS and ONLS, the selected feature subsets were combined for training to obtain an overall classification accuracy of 93.3% ± 0.12% of the test sets; (3) four MM operations based on closing and opening were used to improve the performance of the RF classification. Seven accuracy evaluation indices were used to compare the accuracies of these landslide mapping methods. Finally, the landslide inventory maps were obtained. Based on its efficiency and accuracy, the proposed approach can be employed for rapid response to natural hazards in the Three Gorges area.
1. Introduction
The socio-economic stability of the area near the Three Gorges Reservoir (TGR) along the Yangtze River in China is under serious threat caused by many active small and large landslides, which are major geological hazards in the region. More than 3800 landslides have been reported [1], progressively causing injuries and casualties to individuals as well as significant economic and environmental consequences [2,3,4,5]. Though considerable attention has been paid to landslide mapping (LM) over the past few decades, mapping landslides reliably and accurately for practical engineering applications has proved to be difficult [6,7,8,9]. Traditional field surveys are often time-consuming, labor-intensive, and costly, even though they can achieve reliable results [10].
Nowadays, the availability of high spatial resolution (HSR) remote sensing satellite images have enabled more reliable mapping of landslides more rapidly than ever before [2,11,12]. There has been considerable research on LM based on HSR data, such as IKONOS [13], pan-sharpened Quickbird [14], pan-sharpened Advanced Land Observing Satellite (ALOS) [15], and airborne Light Detection And Ranging (LIDAR) [16]. For the monitoring of slow-moving landslides and LM in cloudy areas, Synthetic Aperture Radar (SAR) images and Interferometric SAR (InSAR) technology have been widely used because of their advantages over optical images [17,18]. Although there has been considerable research on LM based on HSR satellite images, until now the use of the Chinese ‘ZY-3’ satellite data for LM in TGR has not been reported in academic publications.
Current methods for LM can be grouped into two broad categories of pixel based (PB) and object-oriented (OO) approaches. The most commonly used PB methods for LM are based on change detection (CD) because of its simplicity and applicability [19]. Although it has been applied for different HSR satellite images, the limitation of this method is the diversity of the landslide components which have affected the accuracy of the detected changes [20]. Other PB methods such as image matching techniques [21] and machine learning [22] have also achieved satisfactory LM results.
Object-oriented approaches, for which the units are image objects, consisting of pixels with similar spectral signatures, have become widely used for many geoscience related research projects in order to exploit geometric and contextual image information from multi-source data, which are often unavailable for the traditional PB methods [23,24]. Some researchers have proved that using an OO approach can lead to feasible results by combining CD [25], segmentation optimization methods [26], and spatiotemporal analysis [27,28]. However, the identification of landslide boundaries and the context characteristics of neighborhood objects have not been adequately defined to produce a reliable LM.
Landslides, which can be briefly described as the movement of rock, soil, or debris down a slope, are complex systems, and are expected to occur under circumstances similar to those that have led to past slope failures [29]. Effective object-oriented landslide mapping (OOLM) requires the definition of object-features from remote sensing and thematic data, such as image band information, texture, and geometric features ranging in number from several to dozens. However, there are no universal guidelines for feature selection (FS) that can influence the accuracy of OOLM. When a large number of features are available, the extraction of the appropriate features for different study areas is a complex process, while various OOLM models can also be applied.
The random forests (RF) algorithm, which can provide high classification accuracy without overfitting, is based on classification trees [30]. It has been demonstrated to be an effective tool in dealing with vagueness and uncertainty of information, and has led to excellent performance for the analyses of many complex remote sensing datasets [8,31,32].
Mathematical morphology (MM), which is based on set theory, lattice theory, topology, and random functions, is used for the processing and analysis of geometrical structures [33]. Recently, MM approaches have attracted increasing attention for the consideration of topological and geometric continuous-space concepts. For example, the researchers of [20] have increased the accuracy of LM by using MM to remove errors in detected landslide candidates.
The objective of this paper is to examine the applicability of a FS method, RF algorithm, and MM method for OOLM using ‘ZY-3’ HSR satellite images in the TGR, China. The proposed OOLM methodology was developed using the eCognition® software (Version 9.0.1) and R statistical programming environment. The rest of this paper is organized as follows: Section 2 describes the study area and the data used and details the framework of the OOLM; Section 3 presents the experimental results; discussions are presented in Section 4; and conclusions are given in Section 5.
2. Materials and Methods
2.1. Study Area
The study area lies in Shazhenxi Town, Hubei Province, about 70 km west of the Three Gorges Dam with an area of 38.49 km2 (Figure 1), located between latitudes of 31.011°N and 31.049°N, and longitudes between 110.313°E and 110.514°E, with elevations above sea level ranging from 157 m to 919 m. The Yangtze River broadly crosses the study area in a WNW–ESE direction. The climate in the area is typically subtropical, with hot and humid summers but cold and dry winters, while heavy rainfall is mainly concentrated in spring and summer, with an average annual precipitation of 1100 mm. The area is located in the transitional zone between the south end of the Zigui syncline, which is oriented mainly N–S, and the Baifuping anticline, which is oriented mainly W–E. The geological base of this area is Triassic detrital rock (Shazhenxi Group) and Jurassic silt, lutite, pelitic siltstone, and sandstone (Niejiashan Group). The Niukou–Xiangluping fault zone, comprising the main faults and fracture systems in the study area, crosses the Zigui basin with an orientation of NNE-SSW, leading to the formation of ‘weak’ zones that are conductive to slope instability [34].
2.2. Landslide Inventory, Image and Thematic Input Layers
Landslides in this study area, which mostly comprise old rock and shallow soils, were visually identified on 1:10,000-scale color aerial photographs (Figure 2). Based on a series of field surveys, and reviews of historical and bibliographical data, 24 landslides were finally mapped and subsequently digitized and rasterized in Environmental Systems Research Institute (ESRI)’s ArcGIS software (Version 10.3.0) with a grid cell size of 5.8 × 5.8 m, which is the same resolution as the multispectral remote sensing data used for the study.
A total of eleven layers were derived as inputs from the satellite data and thematic maps (Table 1).
One ‘ZY-3’ HSR image with a spatial resolution of 5.8 m for the multispectral bands (Path/row, 113/132), and 2.1 m for the panchromatic band (Path/row, 113/139), acquired on 30 April 2013, was procured for this study. An Normalized Difference Vegetation Index (NDVI) map was derived from the near infrared and red bands of the ‘ZY-3’ HSR images as an additional layer. The digital elevation model (DEM) of the area with a resolution of 12.5 m was resampled to a resolution of 5.8 m to be compatible with the other data sets. Six thematic layers were derived from the DEM data as input layers in order to define the landslide features: Curvature, Hillshade, Roughness, Flow direction, and Slope.
2.3. Methodology
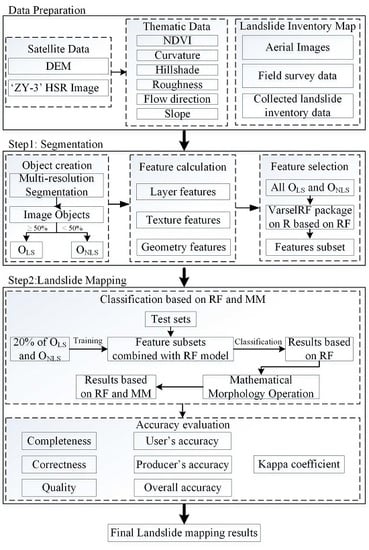
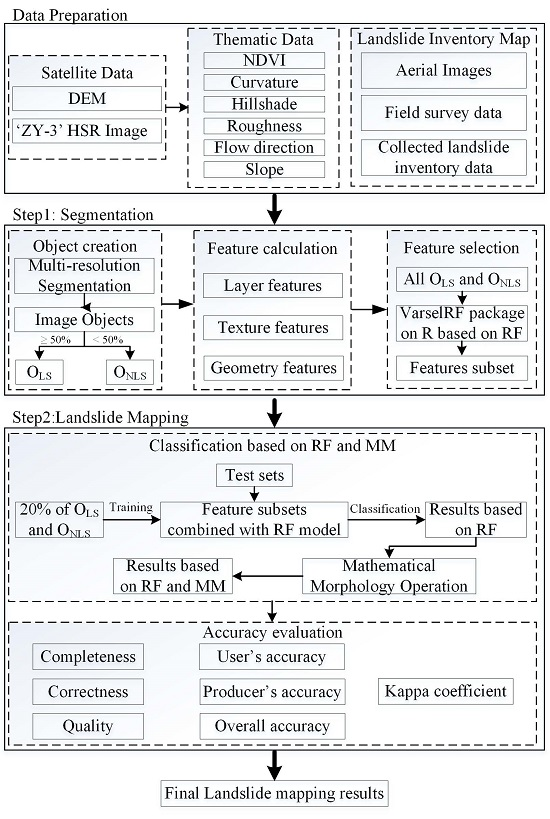
The OOLM framework, shown in Figure 3, consists of two steps: image segmentation and landslide mapping. For the image segmentation, image objects were extracted from ‘ZY-3’ HSR images and DEM data using multi-resolution segmentation (MRS). The objects were then labeled according to whether they were landslides (OLS) (which comprised more than 50% of the extracted objects), or non-landslide objects (ONLS), by combining the objects with the landslide inventory. Then a FS method based on the RF algorithm was used to reduce the feature sample dataset size, after which a 10-fold cross validation method was applied using subsets of the spatial features, where for each cross validation, 80% of the landslides were withheld for testing, to reduce potentially high spatial autocorrelation between the training and the test sets.
In the landslide mapping step, by combining the feature subset derived from image segmentation, a RF model was applied to classify the test sets into OLS and ONLS, and the accuracies of classification were assessed. Finally, four different MM operations, which were opening, closing, opening followed by closing, and closing followed by opening, were used to deal with the errors which were present inside and outside the extracted landslide object candidates and the classification accuracies were assessed once again.
2.3.1. Image Segmentation
For the OO method, image segmentation is the necessary and first prerequisite, because delineation qualities of the target objects such as size and shape have a direct influence on the accuracy of the subsequent image classification [35]. There are many segmentation methods, but MRS is a frequently used method in landslide studies [36] and was chosen for this study.
In the MRS procedure, three user-defined parameters are very important; scale, shape, and color. The scale parameter (SCP) is an abstract term, which determines the maximum allowed heterogeneity within the resulting image objects [37]. The color parameter (CP), which refers to the spectral homogeneity, and shape parameter (SHP), for defining the textural homogeneity of the resulting image objects, are other important parameters. They both are weighted from 0 to 1 and the sum of their weights is 1 in the eCognition® software (Version 9.0.1). The shape criterion is often divided into two groups: smoothness used to optimize image objects by regarding the smoothness of their borders; and compactness, utilized to optimize image objects with regard to their compactness.
2.3.2. Calculation of Object Features
In this study, three object-feature domains, which were layer, texture, and geometry, comprising a total of 124 features were extracted from the ‘ZY-3’ HSR data by using the eCognition® software (Version 9.0.1) (Table 2) as recommended by previous researchers [8,38].
The Max and Min refer to the maximum and minimum pixel values, while standard deviation (Stdv) and mean refer to the standard deviation and the mean intensity values of all pixels forming an image object, respectively. The Ratio value is the layer mean value of an image object divided by the sum of all layer mean values. The MaxDiff value of each object is the absolute value of the difference of the maximum object mean value () and the minimum object mean value () in each layer, divided by the object brightness B, which was defined as the sum of the object means in the same layers divided by the number of corresponding layers ().
The texture features used in this study were derived from the gray level co-occurrence matrix (GLCM), which can be used to calculate 14 textures [39]. Considering the computational efficiency and frequent reports on strong correlations among them [40], a subset of five texture measures was selected, which were entropy (Ent.), Mean, correlation (Cor.), contrast (Con.), and standard deviation (Stdv.). Using the eCognition® software (Version 9.0.1) [41], the GLCM frequencies were calculated in symmetric matrices for the four directions of neighboring pixels at 0°(N–S), 45°(NE–SW), 90°(E–W), or 135°(SW–NE), respectively, which together with the sum of the four directional GLCMs (GLCMall dir.) gave five rotation-invariant texture measures per image object for each band.
The geometric features used in this study were Shape index, Density, Main direction, Roundness, Length-width ratio, Area, and Number of Pixels. The shape index is calculated from the length of the border of each image object divided by four times the square root of its area. The density describes the distribution in space of the pixels of an image object. The main direction feature of an image object is defined as the direction of the eigenvector belonging to the larger of the two eigenvalues derived from the covariance matrix of the spatial distribution of the image object. The roundness is calculated from the difference of the ellipse enclosing an object and the ellipse enclosed by an object. The length-width ratio is the ratio of length and width of an object. The area is simply the number of pixels that form the image object.
2.3.3. Random Forests-Based Landslide Mapping (RFLM)
The RF algorithm, which was developed by [30], has been widely used in many fields of study in remote sensing and has been considered as an efficient non-parametric ensemble learning decision tree based method, because of its excellent performance for classification or regression [16,42,43]. It was selected as the landslide mapping model in this study, based on its ability in finding useful patterns in large volumes of data.
It is known that many problems can be caused by large feature sets in the process of classification, such as: low efficiency due to the numerous resources [44], loss of accuracy when the optimal number of features is significantly lower than the number of features [45], and unrelated input features, which may cause model overfitting. Therefore, eliminating redundant or correlated features in the input layers is important for improving the classification accuracy for a particular study area.
In this paper, the varSelRF package [46] implemented in the R statistical programming environment [47] was used for feature selection, which is based on the random forest (RF) algorithm [48]. A procedure which was proposed by [49] based on two RFs was applied to determine the feature subsets that were recommended for the construction of the final RF classifiers. The first RF was used to create an initial feature ranking with the numbers set to 3000, while the second RF was used to exclude the least important 20% of the features based on an iterative process with the numbers set to 1000. All OLS and an equal number of randomly selected ONLS were applied for feature selection. One third of them were used for the training set and the remainder as an out-of-bag (OOB) sample, were used to assess the second RF misclassification rate (OOB error). Following the method of [8], the final feature subset was selected according to the RF that produced the lowest OOB error.
2.3.4. Mathematical Morphology Operation
Although the RF method can achieve effective results in LM, its performance can be further improved by eliminating some errors which are present both outside and inside the landslide candidates. In order to improve the performance, two MM operations (opening and closing) and their combinations (opening followed by closing, closing followed by opening) were successively applied to the RFLM results [33]. The type of the structuring elements used in this paper was a array k, k = {1, 1, 1}.
3. Results
3.1. Image Segmentation and Feature Selection
Although some new tools are proposed to estimate the SCP for segmentation processes [31,50], its selection still often requires an iterative trial-and-error optimization method because the segmentation quality can be visually assessed [51]. After several trial-and-error attempts to find the proper MRS parameters [52], in order to ensure that the segment boundaries of the smallest landslide areas are derived, the SCP, CP, SHP, smoothness, and compactness values were set to 10, 0.9, 0.1, 0.5, and 0.5, respectively, for the implementation of MRS using the eCognition® software (Version 9.0.1). Figure 4 shows the segmentation results of the Fanjiaping and Tanjiahe landslides. The study area was segmented into 124,511 objects, including 17,612 OLS. The mapped OLS covered an area of 4.92 km2 which represents 12.79% of the study area. The smallest landslide covered an area of 7077 m2, whereas the largest, which is the Fanjiaping landslide located on the southern side of the Yangtze River, was 1.5 km2.
Based on the varSelRF package, the features used in the final landslide mapping were reduced from 124 to 26. The selected features are shown in Table 3.
From Table 3, it is inferred that the Mean, Min, Max, and Ratio features play the most important roles in the RF based FS method in this study, which is different from [16]. The NIR layer is the most important one which is present in all of the features, followed by Hillshade, Roughness, Blue, and Flow Direction, which are all shown in four of the five selected features. Features Green and Pan were also present three times and twice, respectively.
3.2. Landslide Mapping Accuracy Assessment
For quantitative evaluation, the mapped landslides were compared with the landslide reference maps, using seven evaluation indices, i.e., Completeness, Correctness, Quality, User’s accuracy (UA), Producer’s accuracy (PA), Overall accuracy (OA), and Kappa coefficient (KAPPA).
Completeness, Correctness, and Quality can be expressed by the following equations:
where is the total area of the mapped landslides that are matched with the ground truth, is the total area of the ground truth, is the total area of the mapped landslides, and is the total area of the ground truth that are unmatched with the mapped landslides.
In these seven evaluation indices, the higher the index values, the higher the accuracy.
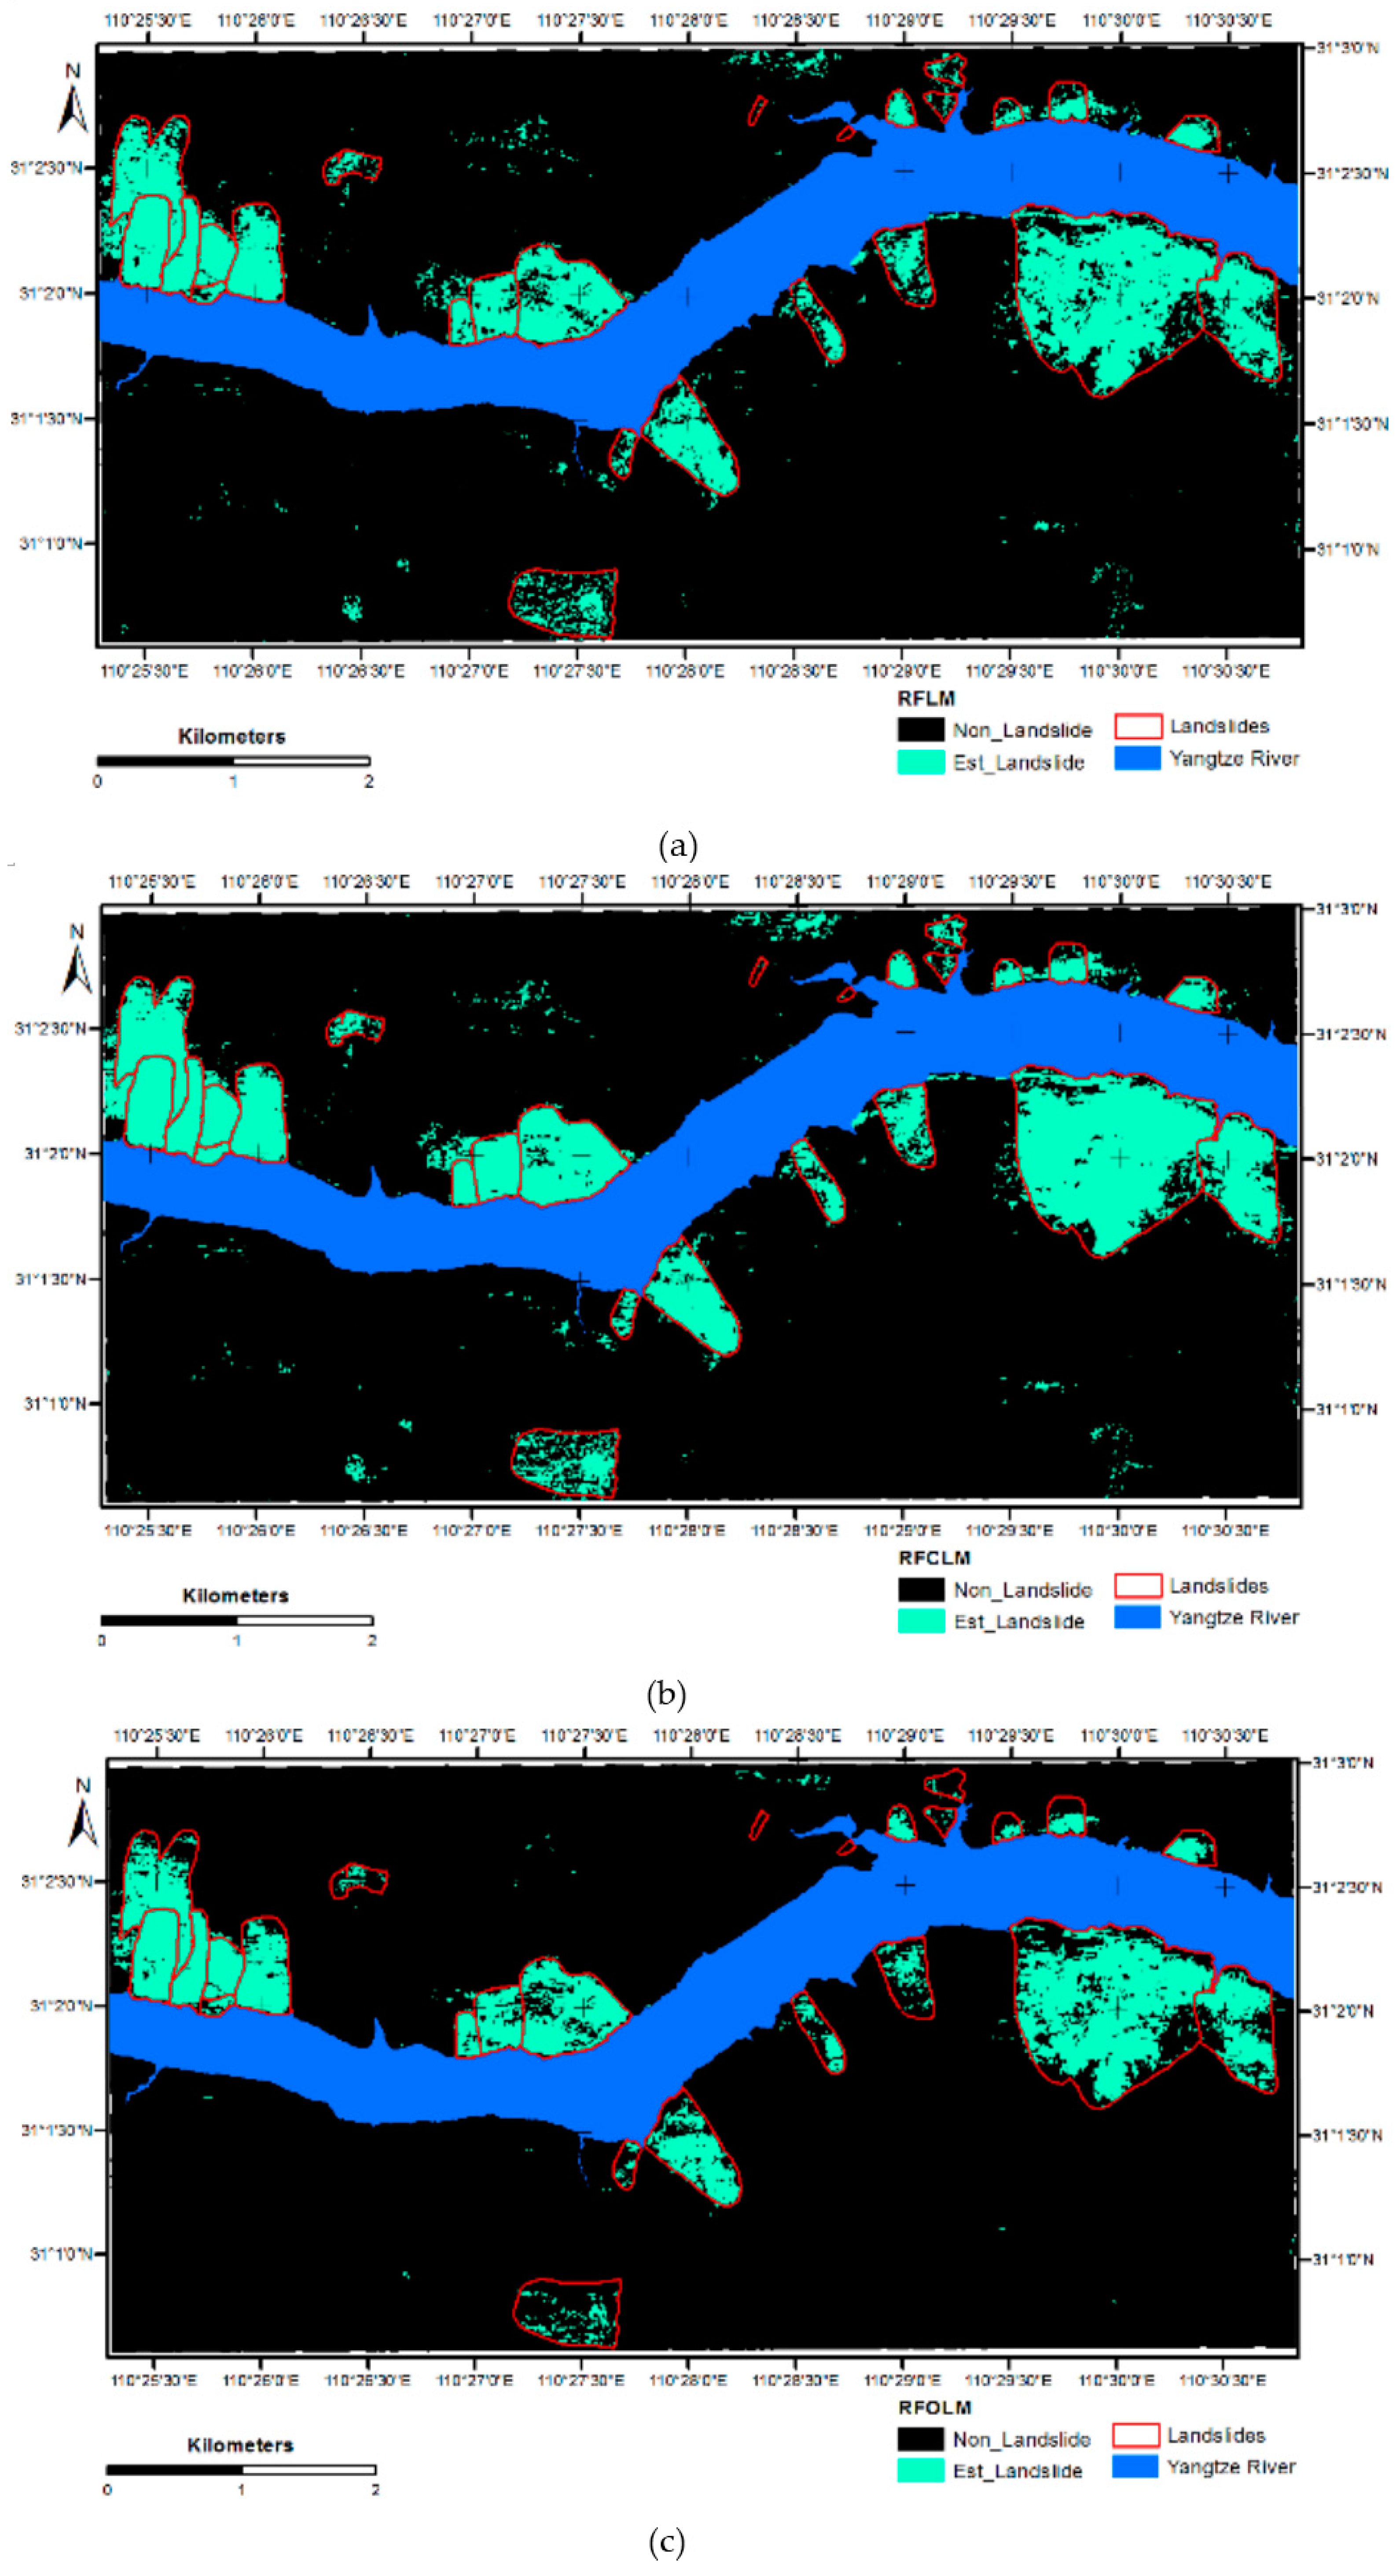
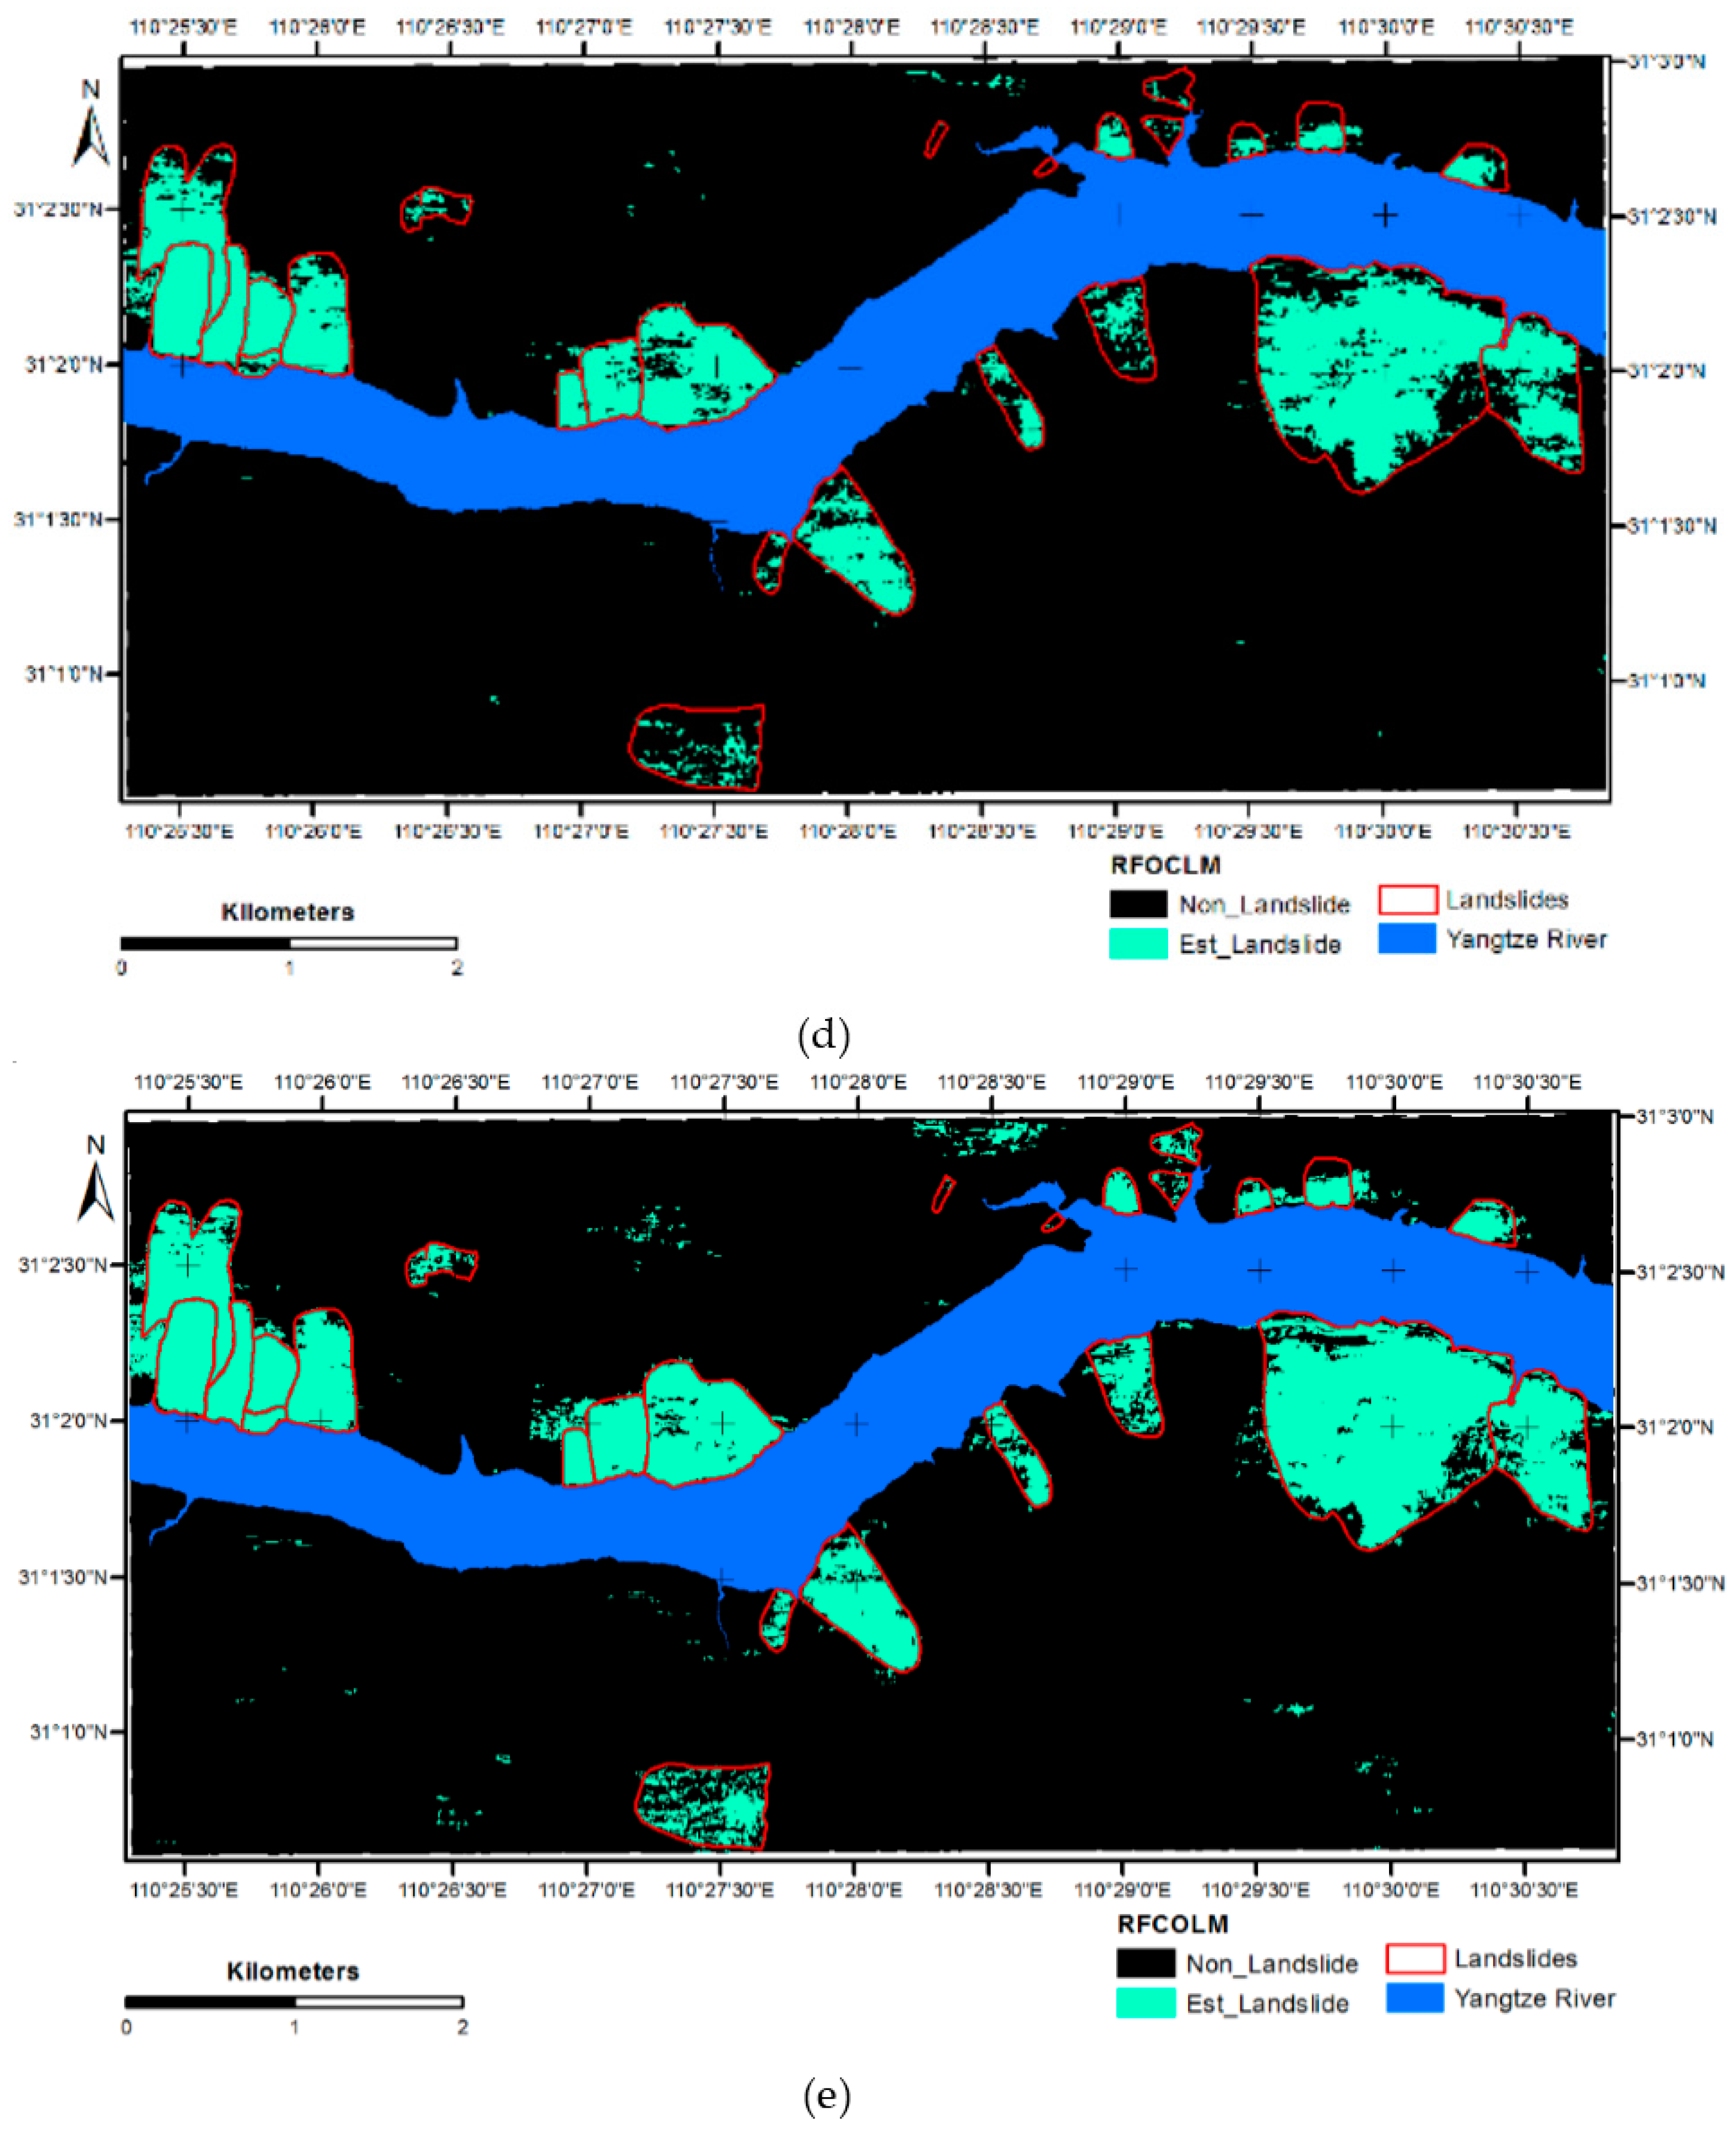
Initially, 20% of the OLS and ONLS were randomly selected as training data, and then a 10-fold cross validation method was used, along with the selected feature subset shown in Table 3, to train the RFLM model. Then the test sets were classified using the trained model, and the classification accuracies were 85.5% ± 0.44% (UA), 66.4% ± 0.27% (PA), 93.3% ± 0.12% (OA), and 71.7% ± 0.29% (KAPPA), respectively. Then the landslides of the whole study area were mapped using the trained RFLM model, and the result is shown in Figure 5a. In order to improve the performance of the RFLM result, the closing and opening mathematical morphology operations and their combinations were used, corresponding to RFCLM (closing), RFOLM (opening), RFOCLM (opening followed by closing), and RFCOLM (closing followed by opening), respectively. The results are shown in Figure 5b–e. To evaluate the advantages of the mathematical morphology operations, the accuracies obtained after each has been applied are compared with the RFLM. The final quantitative evaluation results are presented in Table 4.
From the point of view of Completeness and PA, the RFCLM method provides improved results over the other four methods, while the performances of RFLM in these two indices are neither the best nor worst among the five methods. Compared with RFLM, the values of Completeness and PA of RFOLM and RFOCLM deteriorate to 63.8% ± 0.88%, 64.1% ± 0.97%, 67.8% ± 0.89%, and 67.6% ± 0.97%, respectively, while the values of Completeness and PA of RFCLM and RFCOLM increase to 84.1% ± 0.36%, 84.2% ± 0.61%, 81.5% ± 0.47%, and 83.0% ± 0.66%, respectively. They indicate that the MM closing can improve Completeness and PA, but the MM opening reduces the two indices.
As for Correctness and UA, the RFLM provides slightly better results than RFCLM but they are not as good as for the other three models. RFOLM and RFOCLM achieve similar performance, and both obtain the best performance among all models. Values for Correctness and UA of RFOCLM are almost the same as for RFOLM, which are 97.4% ± 0.12%, 96.9% ± 0.44%, 97.6% ± 0.13%, and 96.9% ± 0.42%, respectively. This indicates that regarding the values for Completeness and UA, MM opening improves Correctness and UA while MM closing decreases these two evaluation indices.
In terms of Quality and KAPPA, the best performances for both are obtained by RFCOLM, while RFLM is ranked 3rd of the five methods. MM opening does not improve the Quality and KAPPA evaluations of RFOLM, because they decrease to 61.2% ± 0.56% and 74.3% ± 0.76%, respectively, compared with the value of RFLM, while MM closing does improve the Quality evaluation index, which increases to 77.0% ± 0.48%, and 77.6% ± 0.39%, respectively.
From the perspective of OA, it can be seen that the five methods have similar values, with the highest value of 96.7% ± 0.1%, which occurred for the RFCOLM method.
It is known that MM closing can fill holes inside landslide candidates [20], while MM opening is employed to remove errors outside the landslide candidates, so MM closing can increase the , , , and the number of estimate landslide candidates, and MM opening can decrease them. However, and the number of reference landslides is constant, so MM closing can improve Completeness, PA, Quality, and KAPPA, while MM opening causes the opposite effect. MM opening can improve Correctness and UA, while MM closing causes these two indices to decrease slightly.
Based on the above, it is clear that overall the RFCOLM method has the best performance among these five methods, since it resulted in the three highest accuracies out of the seven evaluation indices, and produced better results than the RFLM method in all evaluation indices. Compared with [36], we have found that UA, PA, and OA are all increased by using the MM operations. Then, we evaluated the statistical significance of the improvement of the landslide mapping results in terms of the accuracies when including the MM operation after RFLM, by using the McNemar’s test with a 5% significance level for each pair of the landslide mapping results. According to the calculated and z values, the null hypothesis () of no significant difference between the two landslide map accuracies is rejected. This means that the use of MM operation is beneficial for RF-based landslide mapping.
4. Discussion
It is significant that the features selected for LM all belong to the layer features (Table 3), while none of the texture or geometry features were selected for the present study, but in [16] the use of texture and geometry features resulted in increases in the landslide mapping accuracy. Since the materials in most of the landslides in this study area are rock and shallow soil, the mechanisms of the landslides result in differences in the spectral information in the surrounding areas. For example, most of the landslides have low NDVI values, while the surrounding areas have high NDVI values. This is because the vegetation cover on the landslides sites has been damaged.
Although the spatial resolution of current satellite images can be as small or less than 1 m, obtaining LM reliably from satellite remote sensing images is still a challenging task. The proposed methods resulted in good performance for LM in the present study by combining the RF algorithm with a mathematical morphology operation. Compared with the similar study area in TGR, the UA, PA, and OA obtained in this study are higher than in [16,43]. The researchers in [16] used airborne LIDAR to map landslides in TGR by using the support vector machine (SVM) and RF method, for which the highest UA (67.21% ± 0.10%), PA (71.78% ± 0.24%), and OA (77.36% ± 0.13%) were obtained. The researchers in [43] used a feature reduced and RF algorithm to map landslides in TGR. They obtained UA, PA, and OA in their research of 68.45% ± 0.05%, 72.91% ± 0.05%, 78.24% ± 0.03%, respectively, while this study revealed a UA of 92.8% ± 0.53%, PA of 83.0% ± 0.66%, and OA of 96.7% ± 0.1%.
However, some uncertainties still remain. First of all, the segmentation process can introduce uncertainties in LM, because the landslide reference cannot be segmented into exact objects. Although some segmentation methods are available in eCognition® (Version 9.0.1), errors are inevitable, which will decrease the accuracy of LM [43]. Second, there are several key parameters in the RF based LM methods that need to be adjusted for different experiments. Generally speaking, applying different parameter values may improve or worsen the final results. Thus, a trial-and-error optimization method may be the most effective way to find the optimal parameter values in practical applications. Third, since the proposed model did not work well for slow-moving landslides which exist in TGR, this will be the research focus in the future.
5. Conclusions
This paper has applied a hybrid model within the framework of object-oriented landslide mapping to identify landslides in the Three Gorges Reservoir area from ‘ZY-3’ high spatial resolution satellite images. The proposed model utilizes the greater generalization capabilities of RFs for the effective elimination of redundant features by a feature selection method together with mathematical morphology operations.
Three object-feature domains, which contain 124 features, were generated from the ‘ZY-3’ HSR satellite data. By using the feature selection method based on the RF algorithm, 26 features were selected for the feature subset. Since most of the selected features were derived from the image layers, it can be concluded that the multi-spectral band ‘ZY-3’ HSR satellite image provides adequate information and therefore the proposed feature selection method can provide effective information for landslide mapping in the TGR area.
Training sets which consisted of 20% of OLS and ONLS were used to train the RF model based on the selected feature subsets, and UA, PA, OA, and KAPPA of the RFLM for the remaining test sets were found to be 85.5% ± 0.44% (UA), 66.4% ± 0.27% (PA), 93.3% ± 0.12% (OA), and 71.7% ± 0.29% (KAPPA). Four different mathematical morphology operations based on closing and opening and their combinations, were used to improve the performance of the RFLM. Besides UA, PA, OA, and KAPPA, another three evaluation indices were used to compare the performance of these five LM models. Overall, the RFCOLM method has the best performance among the five LM methods. The results showed that MM operations can clearly improve the performance of RFLM in each accuracy evaluation index. Thus, it can be concluded that, by using the features extracted from ‘ZY-3’ HSR satellite data, the feature selection method, a random forests algorithm and MM method, provides an effective method for object-oriented landslide identification in the TGR.
Acknowledgments
This work was supported in part by the National Natural Science Foundation of China (61601418); and in part by the National High Technology Research and Development Program of China (2012AA121303). The authors would like to thank the handling editor and anonymous reviewers for their valuable comments and suggestions, which significantly improved the quality of this paper.
Author Contributions
Tao Chen implemented all the landslide mapping methods in the eCognition® and R statistical programming environment, conducted the experiments, and finished the first draft. John C. Trinder and Ruiqing Niu supervised the research, and John C. Trinder contributed to the editing and review of the manuscript.
Conflicts of Interest
The authors declare no conflict of interest.
References
- Liu, C.Z.; Liu, Y.H.; Wen, M.S.; Li, T.F.; Lian, J.F.; Qin, S.W. Geo-Hazard Initiation and Assessment in the Three Gorges Reservoir. In Landslide Disaster Mitigation in Three Gorges Reservoir, China; Wang, F.W., Li, T.L., Eds.; Springer: Berlin/Heidelberg, Germany, 2009; pp. 3–40. [Google Scholar]
- Keefer, D.K.; Larsen, M.C. Assessing landslide hazards. Science 2007, 316, 1136–1138. [Google Scholar] [CrossRef] [PubMed]
- Huang, R.; Fan, X. The landslide story. Nat. Geosci. 2013, 6, 325–326. [Google Scholar] [CrossRef]
- Niu, R.; Wu, X.; Yao, D.; Peng, L.; Ai, L.; Peng, J. Susceptibility assessment of landslides triggered by the Lushan earthquake, April 20, 2013, China. IEEE J. Sel. Top. Appl. Earth Obs. Remote Sens. 2014, 7, 3979–3992. [Google Scholar] [CrossRef]
- Keefer, J. Landslide risks rise up agenda. Nature 2014, 511, 272–273. [Google Scholar]
- Nagarajan, R.; Mukherjee, A.; Roy, A.; Khire, M. Technical note temporal remote sensing data and GIS application in landslide hazard zonation of part of Western Ghat, India. Int. J. Remote Sens. 1998, 19, 573–585. [Google Scholar] [CrossRef]
- Van Westen, C.J.; Castellanos, E.; Kuriakose, S.L. Spatial data for landslide susceptibility, hazard, and vulnerability assessment: An overview. Eng. Geol. 2008, 102, 112–131. [Google Scholar] [CrossRef]
- Stumpf, A.; Kerle, N. Object-oriented mapping of landslides using Random Forests. Remote Sens. Environ. 2011, 115, 2564–2577. [Google Scholar] [CrossRef]
- Scaioni, M.; Longoni, L.; Melillo, V.; Papini, M. Remote sensing for landslide investigations: An overview of recent achievements and perspectives. Remote Sens. 2014, 6, 9600–9652. [Google Scholar] [CrossRef]
- Galli, M.; Ardizzone, F.; Cardinali, M.; Guzzetti, F.; Reichenbach, P. Comparing landslide inventory maps. Geomorphology 2008, 94, 268–289. [Google Scholar] [CrossRef]
- Metternicht, G.; Hurni, L.; Gogu, R. Remote sensing of landslides: An analysis of the potential contribution to geo-spatial systems for hazard assessment in mountainous environments. Remote Sens. Environ. 2005, 98, 284–303. [Google Scholar] [CrossRef]
- Guzzetti, F.; Mondini, A.C.; Cardinali, M.; Fiorucci, F.; Santangelo, M.; Chang, K.T. Landslide inventory maps: New tools for an old problem. Earth Sci. Rev. 2012, 112, 42–66. [Google Scholar] [CrossRef]
- Hervas, J.; Barredo, J.I.; Rosin, P.L.; Pasuto, A.; Mantovani, F.; Silvano, S. Monitoring landslides fromoptical remotely sensed imagery: The case history of Tessina landslide, Italy. Geomorphology 2003, 54, 63–75. [Google Scholar] [CrossRef]
- Kieffer, D.S.; Jibson, R.; Rathje, E.M.; Kelson, K. Landslides triggered by the 2004 Niigata Ken Chuetsu, Japan, earthquake. Earthq. Spectra 2006, 22, 47–73. [Google Scholar] [CrossRef]
- Voigt, S.; Kemper, T.; Riedlinger, T.; Kie, R.; Scholte, K.; Mehl, H. Satellite image analysis for disaster and crisis-management support. IEEE Trans. Geosci. Remote Sens. 2007, 45, 1520–1528. [Google Scholar] [CrossRef]
- Chen, W.; Li, X.; Wang, Y.; Chen, G.; Liu, S. Forested landslide detection using LiDAR data and the random forest algorithm: A case study of the Three Gorges, China. Remote Sens. Environ. 2014, 152, 291–301. [Google Scholar] [CrossRef]
- Hilley, G.E.; Burgmann, R.; Ferretti, A.; Novali, F.; Rocca, F. Dynamics of slow-moving landslides from permanent scatterer analysis. Science 2004, 304, 1952–1955. [Google Scholar] [CrossRef] [PubMed]
- Lu, P.; Casagli, N.; Catani, F.; Tofani, V. Persistent Scatterers Interferometry Hotspot and Cluster analysis (PSI-HCA) for detection of extremely slow-moving landslides. Int. J. Remote Sens. 2012, 33, 466–489. [Google Scholar] [CrossRef]
- Lu, D.; Mausel, P.; Brondizio, E.; Moran, E. Change detection techniques. Int. J. Remote Sens. 2004, 25, 2365–2401. [Google Scholar] [CrossRef]
- Li, Z.; Shi, W.; Myint, S.W.; Lu, P.; Wang, Q. Semi-automated landslide inventory mapping from bitemporal aerial photographs using change detection and level set method. Remote Sens. Environ. 2016, 175, 215–230. [Google Scholar] [CrossRef]
- Travelletti, J.; Malet, J.P.; Delacourt, C. Image-based correlation of Laser Scanning point cloud time series for landslide monitoring. Int. J. Appl. Earth Obs. 2014, 32, 1–18. [Google Scholar] [CrossRef]
- Cheng, G.; Guo, L.; Zhao, T.; Han, J.; Li, H.; Fang, J. Automatic landslide detection from remote-sensing imagery using a scene classification method based on BoVW and pLSA. Int. J. Remote Sens. 2013, 34, 45–59. [Google Scholar] [CrossRef]
- Moosavi, V.; Talebi, A.; Shirmohammadi, B. Producing a landslide inventory map using pixel-based and object-oriented approaches optimized by Taguchi method. Geomorphology 2014, 204, 646–656. [Google Scholar] [CrossRef]
- Blaschke, T. Object based image analysis for remote sensing. ISPRS-J. Photogramm. Remote Sens. 2010, 65, 2–16. [Google Scholar] [CrossRef]
- Lu, P.; Stumpf, A.; Kerle, N.; Casagli, N. Object-oriented change detection for landslide rapid mapping. IEEE Geosci. Remote Sens. Lett. 2011, 8, 701–705. [Google Scholar] [CrossRef]
- Martha, T.R.; Kerle, N.; van Westen, C.J.; Jetten, V.; Kumar, K.V. Segment optimization and data-driven thresholding for knowledge-based landslide detection by object-based image analysis. IEEE Trans. Geosci. Remote Sens. 2011, 49, 4928–4943. [Google Scholar] [CrossRef]
- Behling, R.; Roessner, S.; Kaufmann, H.; Kleinschmit, B. Automated spatiotemporal landslide mapping over large areas using rapideye time series data. Remote Sens. 2014, 6, 8026–8055. [Google Scholar] [CrossRef]
- Behling, R.; Roessner, S.; Golovko, D.; Kleinschmit, B. Derivation of long-term spatiotemporal landslide activity—A multi-sensor time series approach. Remote Sens. Environ. 2016, 186, 88–104. [Google Scholar] [CrossRef]
- Pradhan, B.; Jebur, M.N.; Shafri, H.Z.M.; Tehrany, M.S. Data Fusion Technique Using Wavelet Transform and Taguchi Methods for Automatic Landslide Detection From Airborne Laser Scanning Data and QuickBird Satellite Imagery. IEEE Trans. Geosci. Remote Sens. 2016, 54, 1610–1622. [Google Scholar] [CrossRef]
- Breiman, L. Random Forests. Mach. Learn. 2001, 45, 5–32. [Google Scholar] [CrossRef]
- Lawrence, R.L.; Wood, S.D.; Sheley, R.L. Mapping invasive plants using hyperspectral imagery and Breiman Cutler classifications (randomForest). Remote Sens. Environ. 2006, 100, 356–362. [Google Scholar] [CrossRef]
- Stumpf, A.; Lachiche, N.; Malet, J.P.; Kerle, N.; Puissant, A. Active learning in the spatial domain for remote sensing image classification. IEEE Trans. Geosci. Remote Sens. 2014, 52, 2492–2507. [Google Scholar] [CrossRef]
- Soille, P. Morphological Image Analysis: Principles and Applications; Springer: New York, NY, USA, 2003. [Google Scholar]
- Liu, J.G.; Mason, P.J.; Clerici, N.; Chen, S.; Davis, A.; Miao, F.; Deng, H.; Liang, L. Landslide hazard assessment in the Three Gorges area of the Yangtze river using ASTER imagery: Zigui-Badong. Geomorphology 2004, 61, 171–187. [Google Scholar] [CrossRef]
- Duro, D.C.; Franklin, S.E.; Dube, M.G. Multi-scale object-based image analysis and feature selection of multi-sensor earth observation imagery using random forests. Int. J. Remote Sens. 2012, 33, 4502–4526. [Google Scholar] [CrossRef]
- Baatz, M.; Schäpe, A. Multiresolution segmentation: An optimization approach for high quality multi-scale image segmentation. Available online: http://www.ecognition.com/sites/default/files/405_baatz_fp_12.pdf (accessed on 9 January 2017).
- Definiens Professional Earth (DPE). Definiens Professional 5 User Guide; Definiens AG: München, Germany, 2006; p. 249. [Google Scholar]
- Martha, T.R.; Kerle, N.; van Westen, C.J.; Kumar, K.V. Characterising spectral, spatial and morphometric properties of landslides for semi-automatic detection using object-oriented methods. Geomorphology 2010, 116, 24–36. [Google Scholar] [CrossRef]
- Haralick, R.M.; Shanmugam, K.; Dinstein, I.H. Textural features for image classification. IEEE Trans. Syst. Man Cybern. 1973, SMC-3, 610–621. [Google Scholar] [CrossRef]
- Laliberte, A.S.; Rango, A. Texture and scale in object-based analysis of subdecimeter resolution unmanned aerial vehicle (UAV) imagery. IEEE Trans. Geosci. Remote Sens. 2009, 47, 761–770. [Google Scholar] [CrossRef]
- Trimble. eCognition Developer 8.64.0 Reference Book; Trimble Documentation; Trimble Germany GmbH: Munich, Germany, 2011. [Google Scholar]
- Cutler, D.R., Jr.; Edwards, T.C.; Beard, K.H.; Cutler, A.; Hess, K.T. Random forests for classification in ecology. Ecology 2007, 88, 2783–2792. [Google Scholar] [CrossRef] [PubMed]
- Li, X.; Cheng, X.; Chen, W.; Chen, G.; Liu, S. Identification of forested landslides using LiDar data, object-based image analysis, and machine learning algorithms. Remote Sens. 2015, 7, 9705–9726. [Google Scholar] [CrossRef]
- Kursa, M.B.; Rudnicki, W.R. Feature selection with the Boruta package. J. Stat. Softw. 2010, 36, 1–13. [Google Scholar] [CrossRef]
- Kohavi, R.; John, G.H. Wrappers for feature subset selection. Artif. Intell. 1997, 97, 273–324. [Google Scholar] [CrossRef]
- Diaz-Uriarte, R. varSelRF. Available online: https://cran.r-project.org/web/packages/varSelRF/varSelRF.pdf (accessed on 9 January 2017).
- R Development Core Team. R: A Language and Environment for Statistical Computing; R Foundation for Statistical Computing: Vienna, Austria, 2006. [Google Scholar]
- Liaw, A. RandomForest: Breiman and Cutler’s Random Forests for Classification and Regression. Version 4.6-12. 2015. Available online: https://cran.r-project.org/web/packages/randomForest/randomForest.pdf (accessed on 9 January 2017).
- Diaz-Uriarte, R.; Alvarez de Andres, S. Gene selection and classification of microarray data using random forest. BMC Bioinform. 2006. [Google Scholar] [CrossRef] [PubMed]
- Dragut, L.; Csillik, O.; Eisank, C.; Tiede, D. Automated parameterisation for multi-scale image segmentation on multiple layers. ISPRS J. Photogramm. Remote Sens. 2014, 88, 119–127. [Google Scholar] [CrossRef] [PubMed]
- Myint, S.W.; Gober, P.; Brazel, A.; Grossman-Clarke, S.; Weng, Q. Per-pixel vs. object-based classification of urban land cover extraction using high spatial resolution imagery. Remote Sens. Environ. 2011, 115, 1145–1161. [Google Scholar] [CrossRef]
- Aksoy, B.; Ercanoglu, M. Landslide identification and classification by object-based image analysis and fuzzy logic: An example from the Azdavay region (Kastamonu, Turkey). Comput. Geosci. 2012, 38, 87–98. [Google Scholar] [CrossRef]
Figure 1.
Location of the study area. (A) Site map of the Three Gorges area of the Yangtze River, China. (B) Digital elevation model (DEM) overlaid with landslides; the red hatched areas represent landslides areas.
Figure 1.
Location of the study area. (A) Site map of the Three Gorges area of the Yangtze River, China. (B) Digital elevation model (DEM) overlaid with landslides; the red hatched areas represent landslides areas.
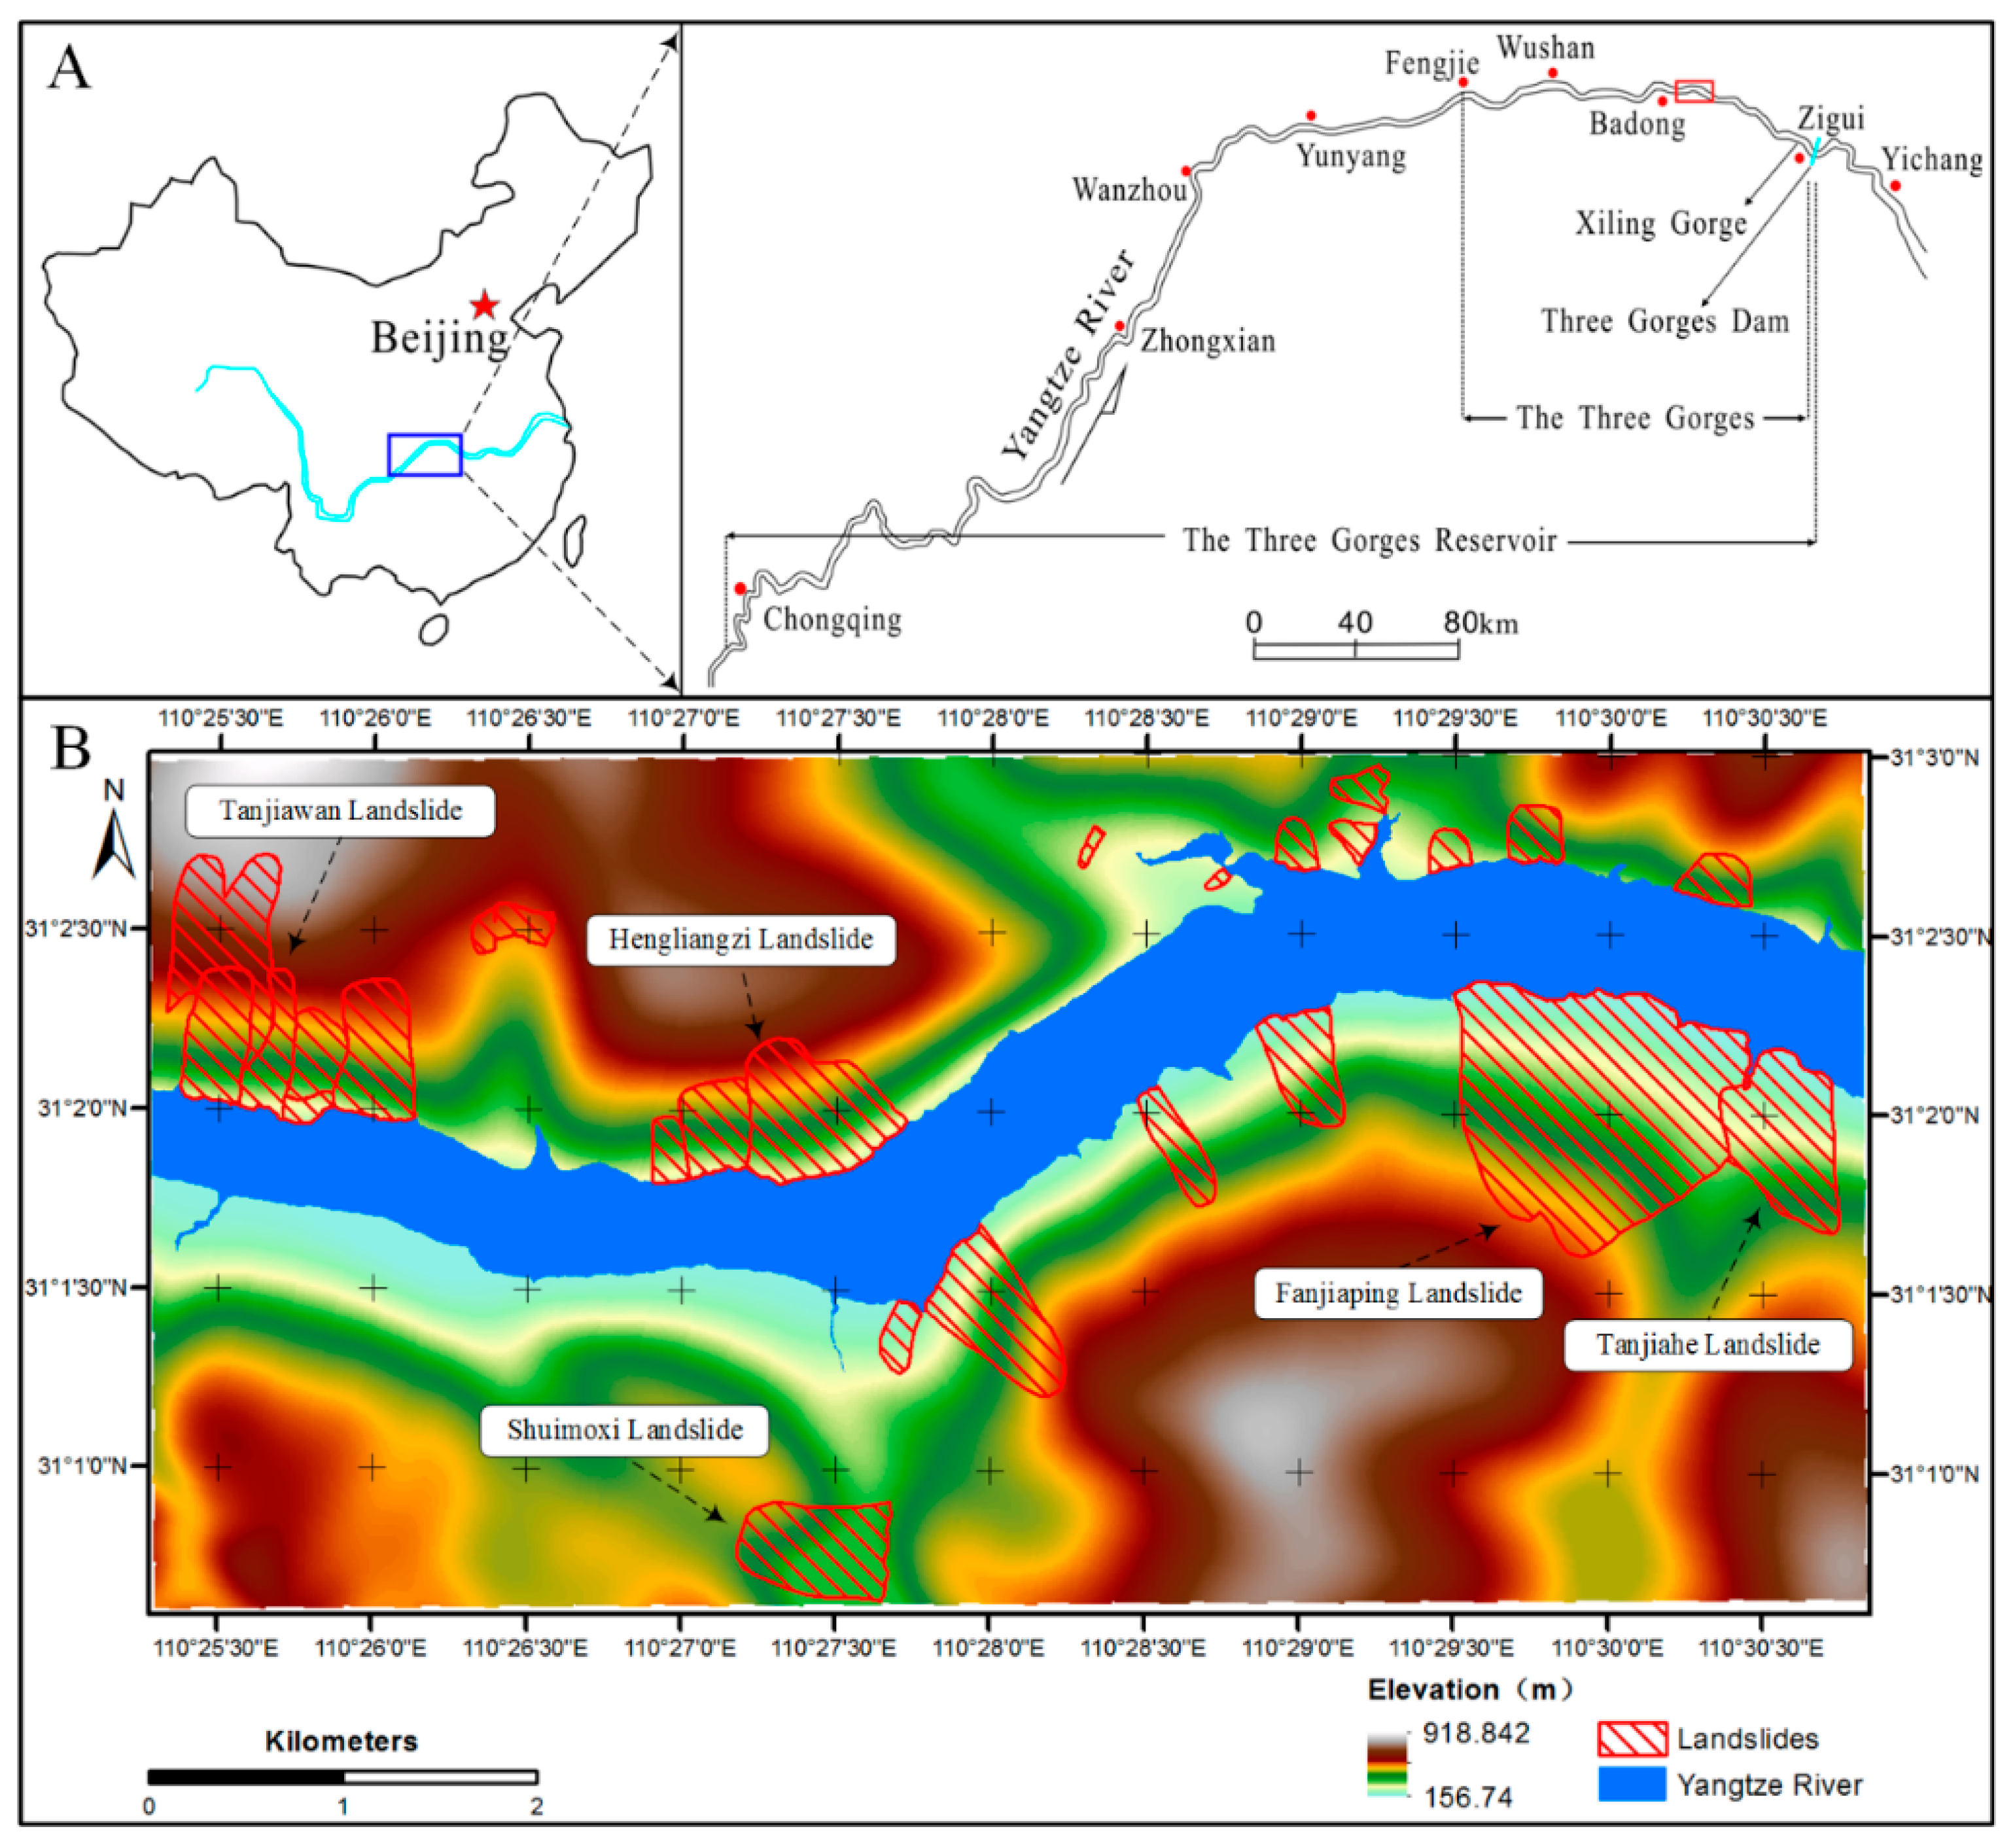
Figure 2.
The Fanjiaping landslide identified by the aerial photographs of the landslide.
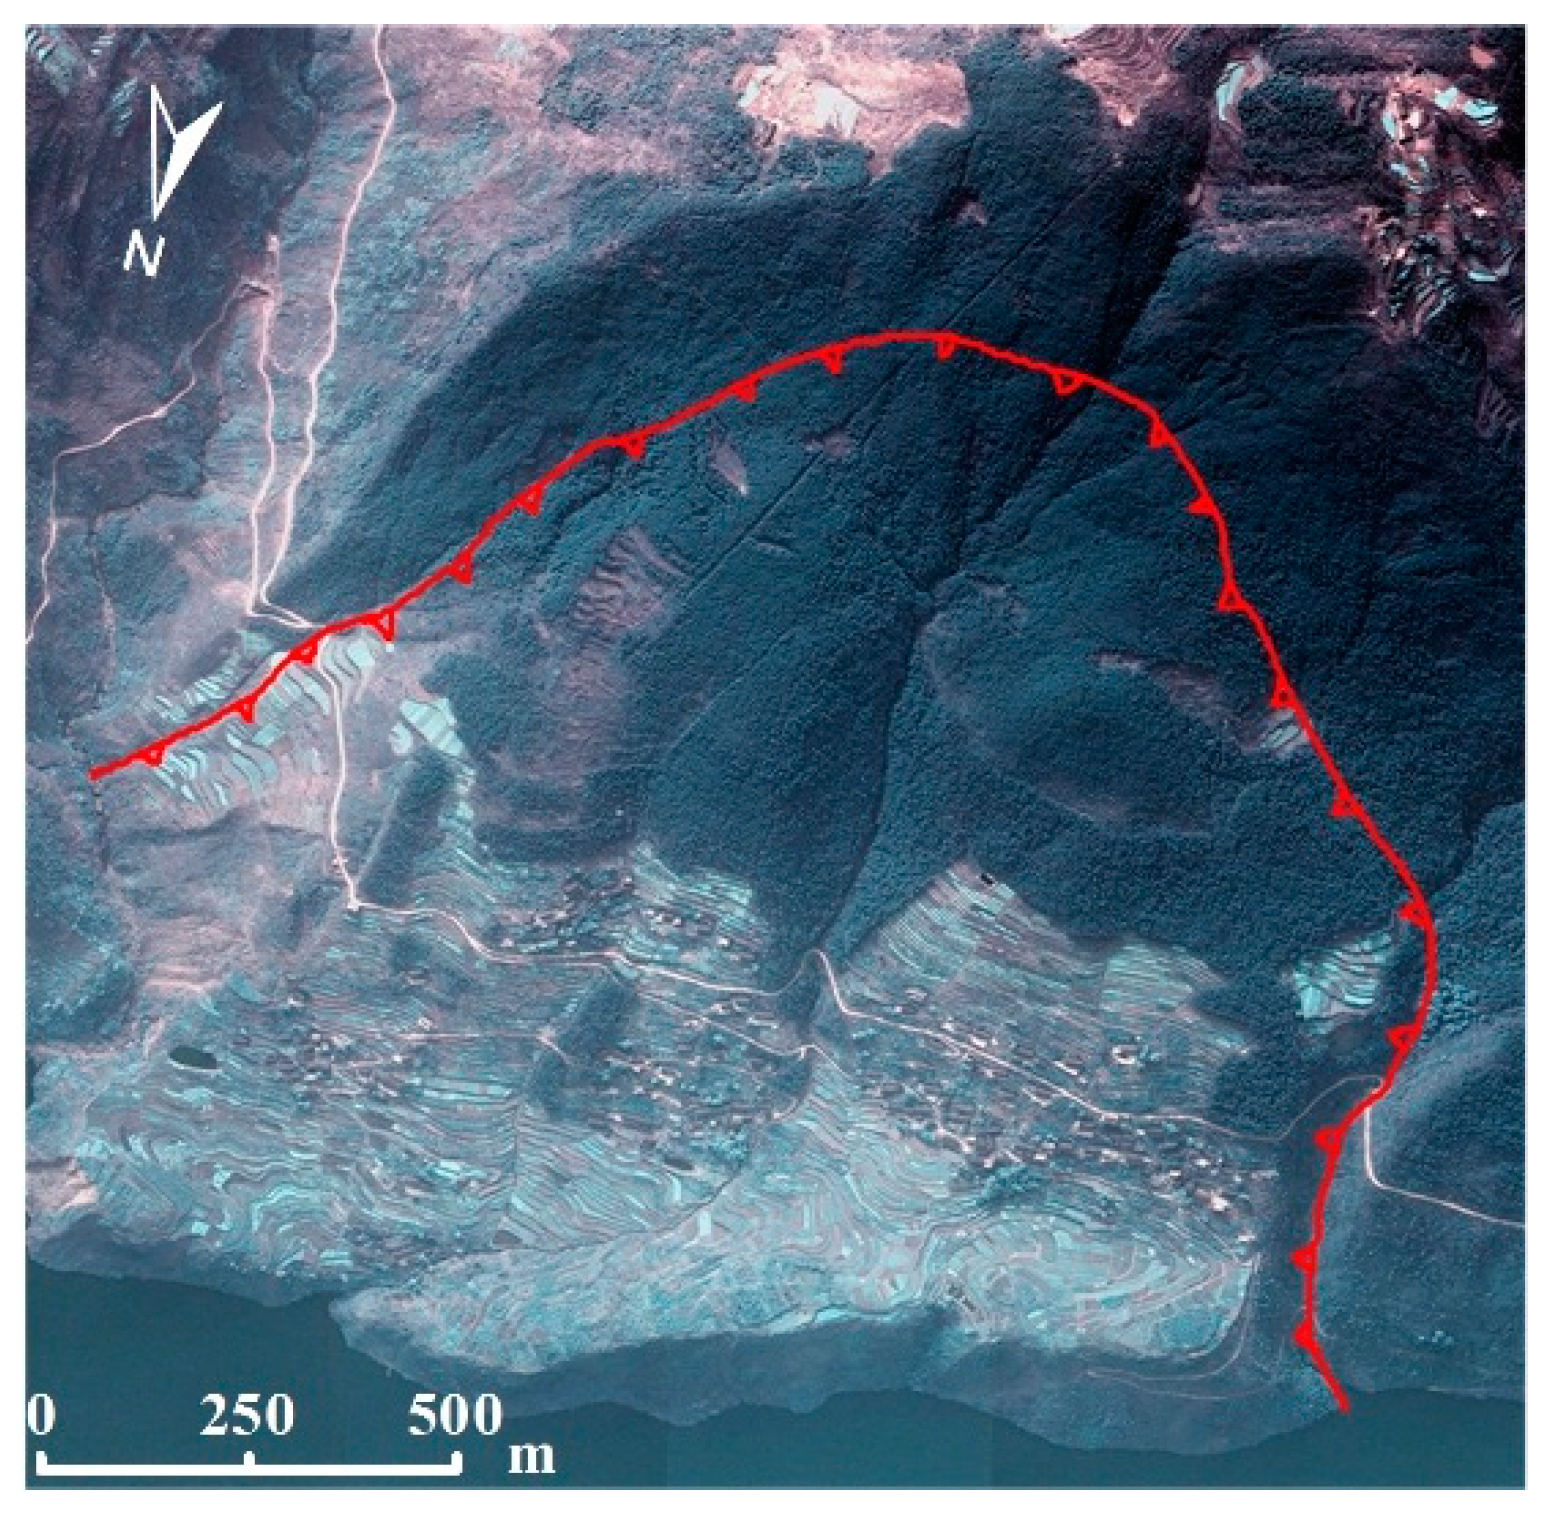
Figure 3.
Flow chart of the proposed methods in this study.
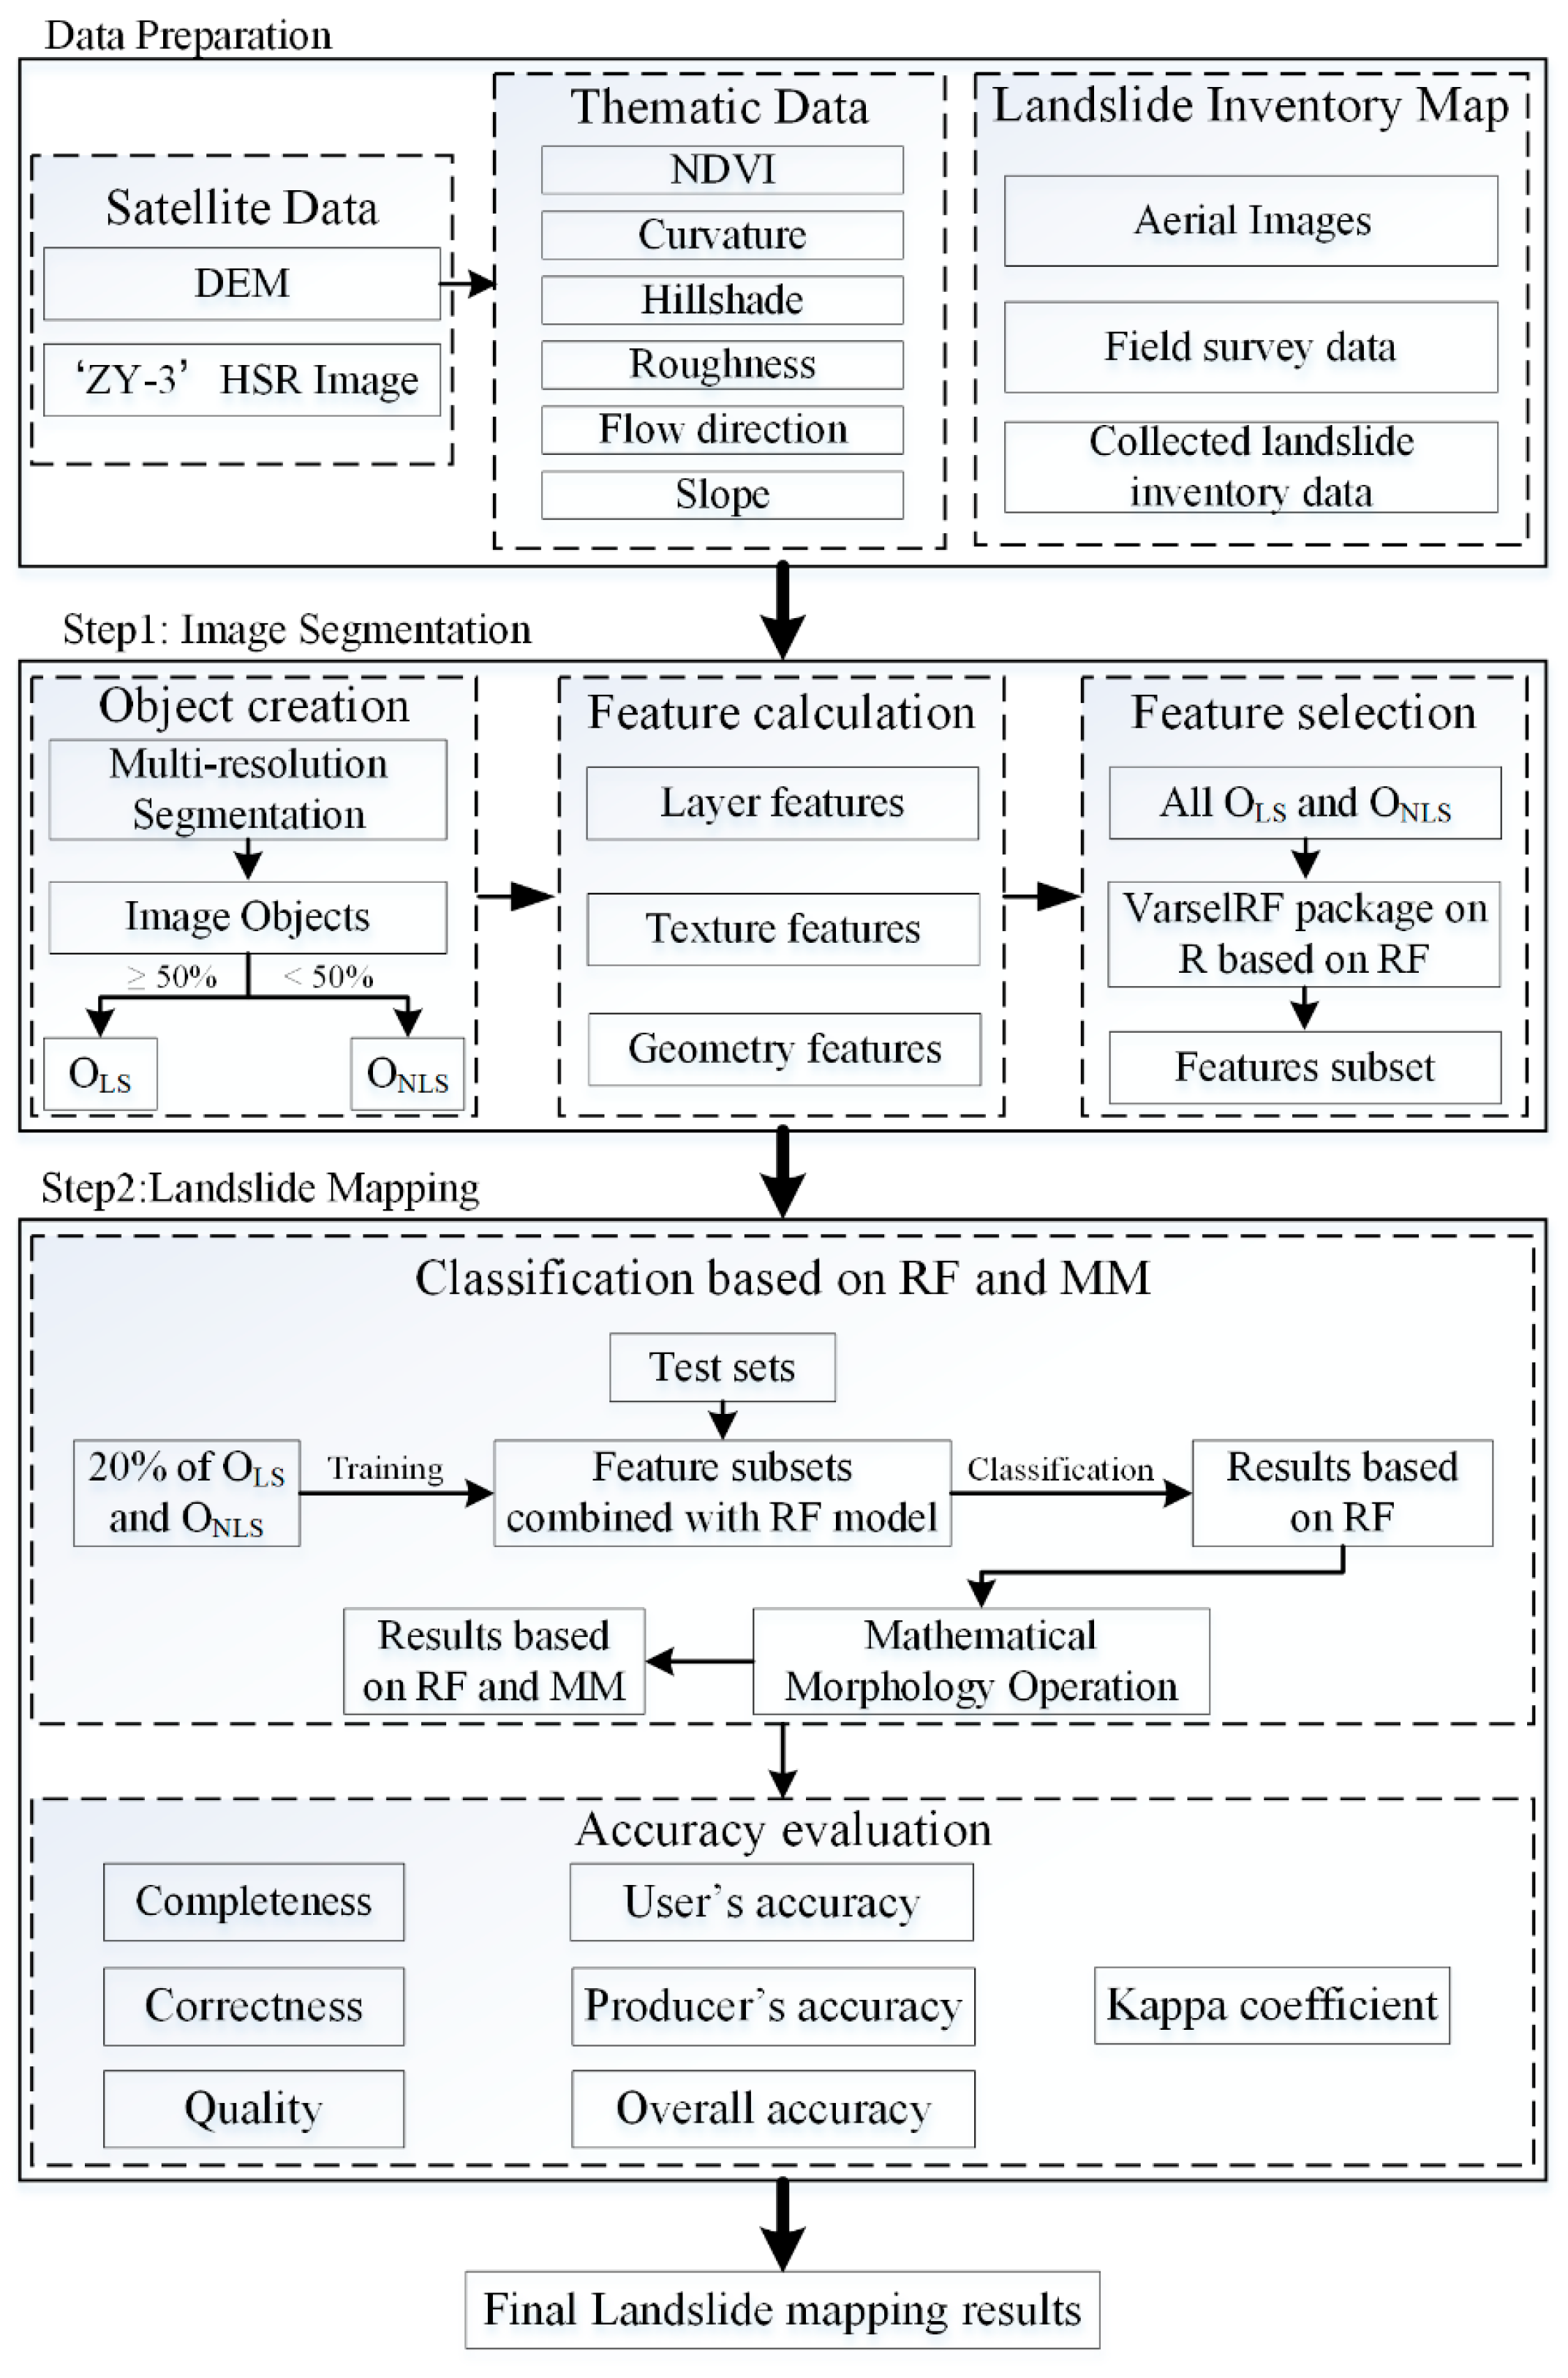
Figure 4.
True color composite (R: 3, G: 2, B: 1) image overlaid by the segments; colors may not be apparent due to the density of the details: examples of the Fanjiaping and Tanjiahe Landslides.
Figure 4.
True color composite (R: 3, G: 2, B: 1) image overlaid by the segments; colors may not be apparent due to the density of the details: examples of the Fanjiaping and Tanjiahe Landslides.
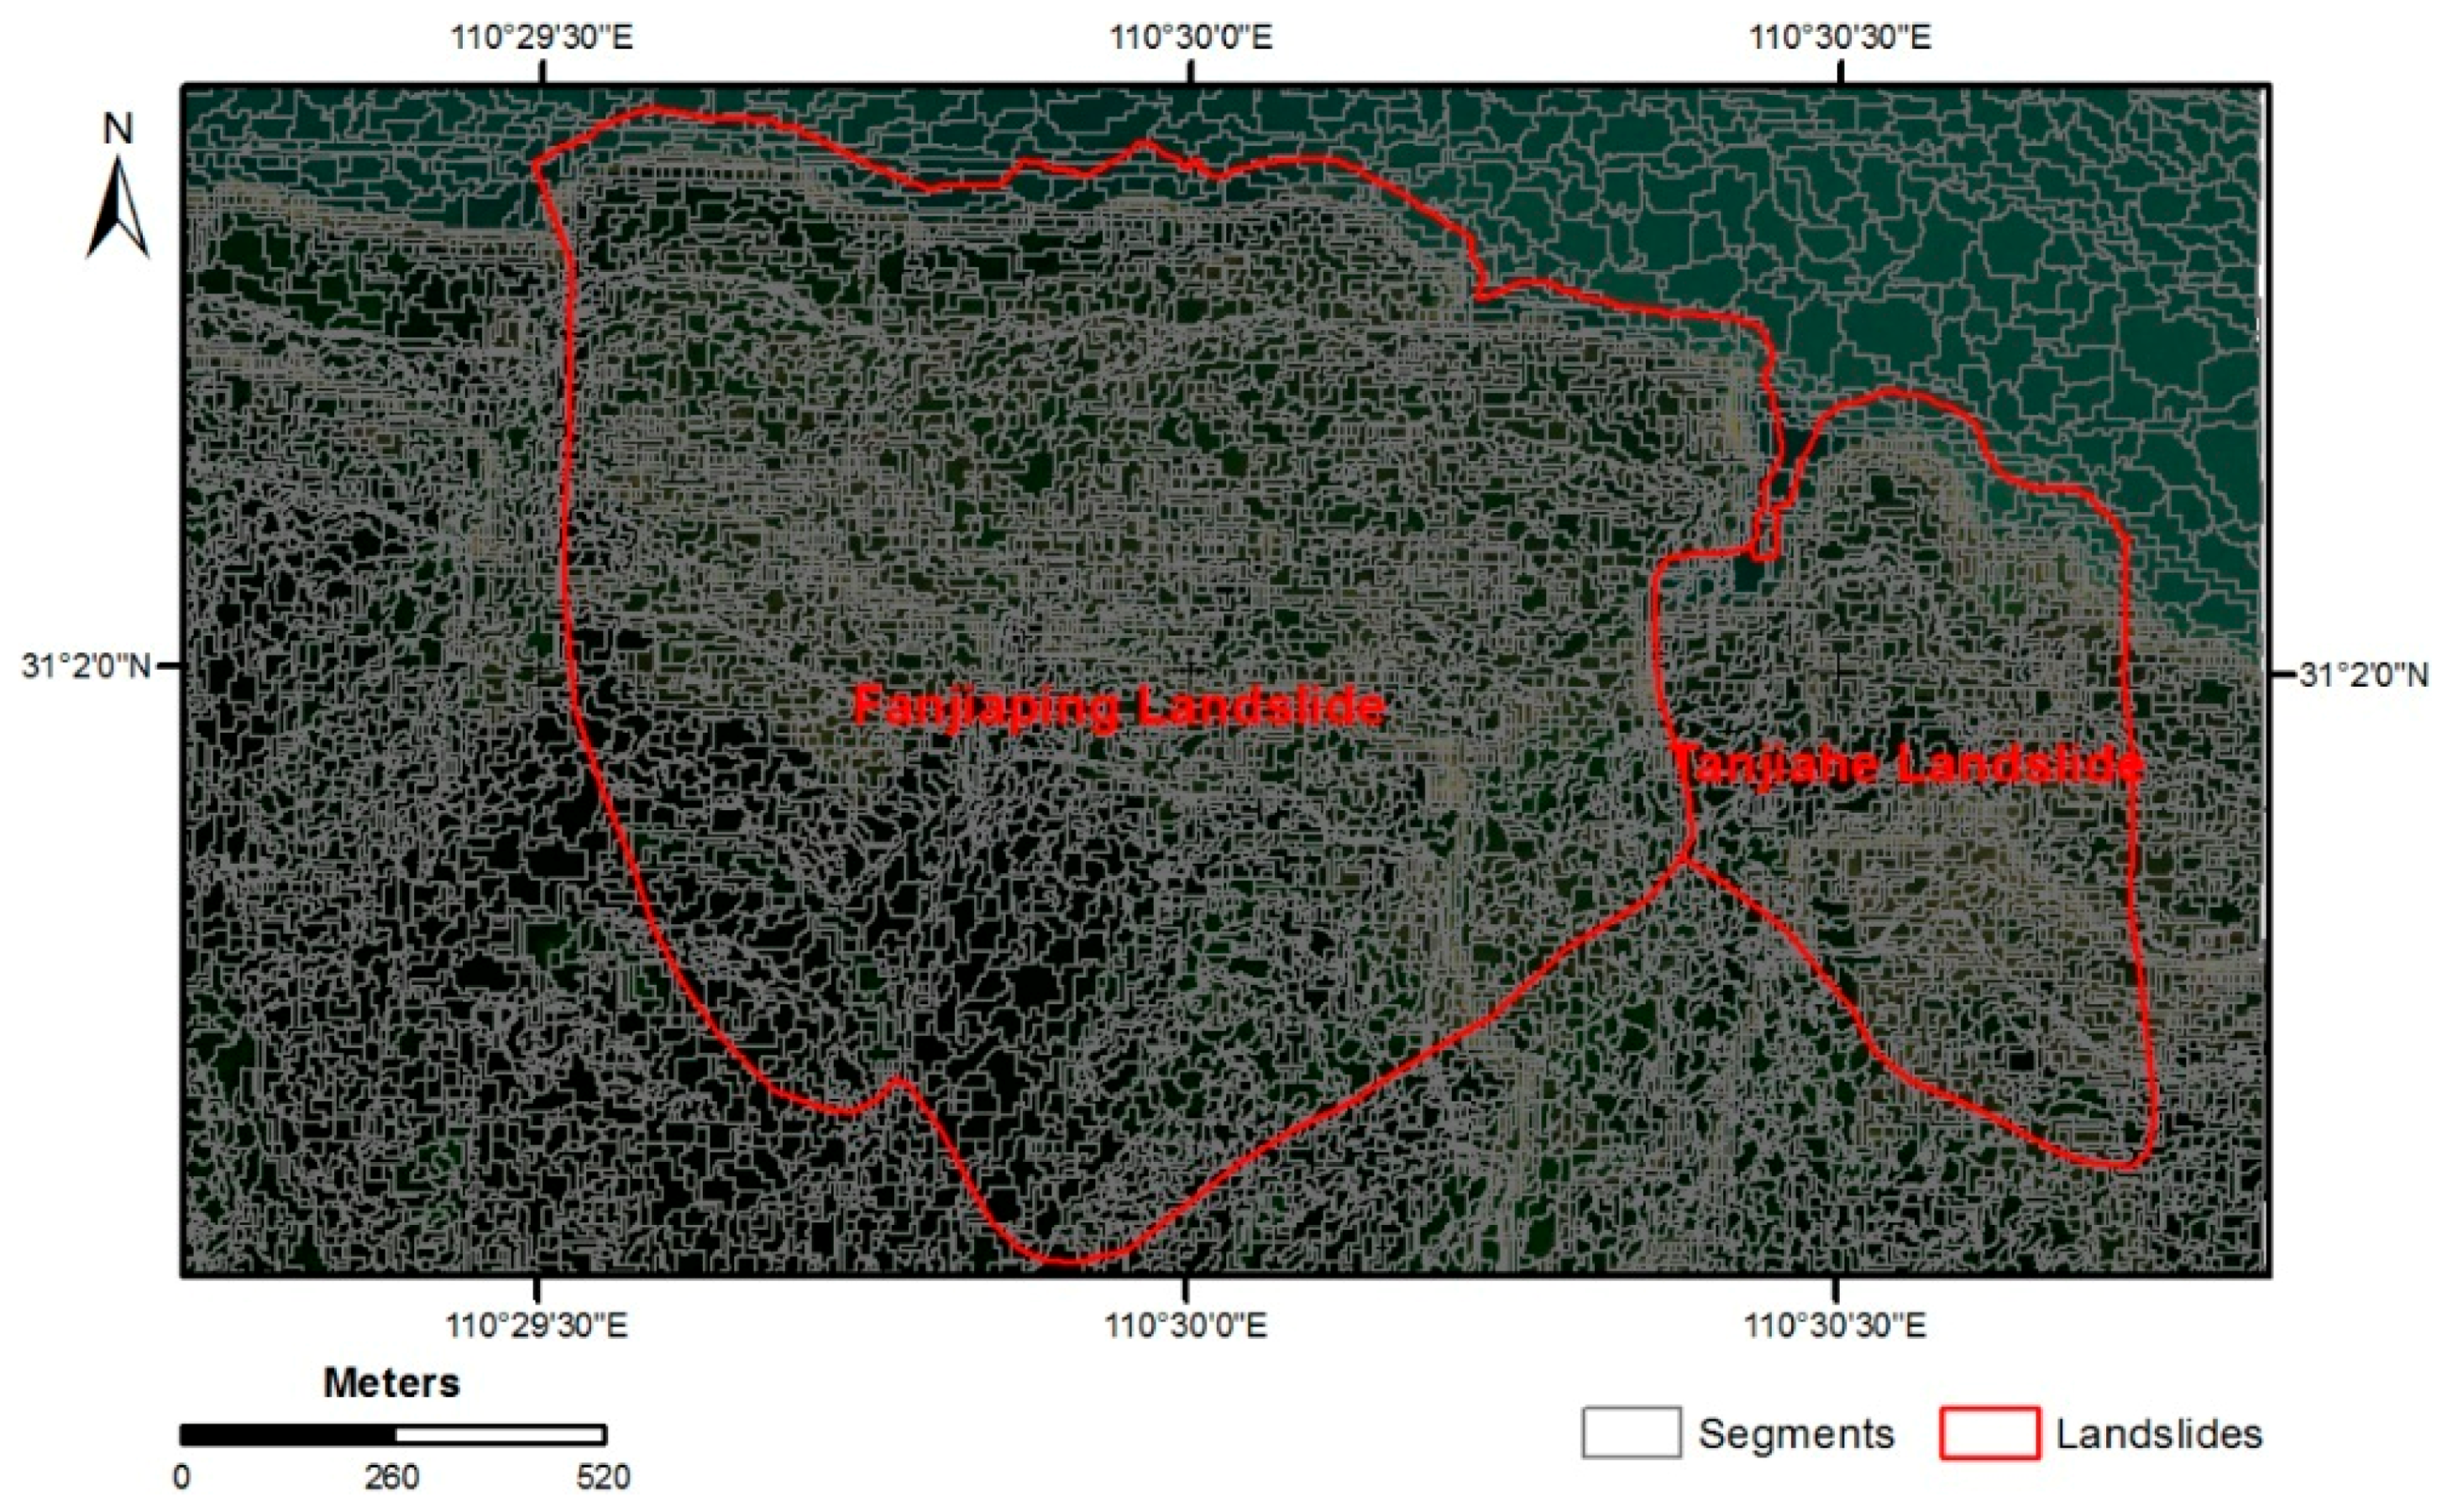
Figure 5.
Landslide mapping results. (a) RFLM. (b) RFCLM. (c) RFOLM. (d) RFOCLM. (e) RFCOLM.


Table 1.
Input layer information in this study.
| Input Layer Derived from Satellite Images (Pixel Size) | Input Layer Derived from Digital Elevation Model (DEM) (Pixel Size) |
|---|---|
| Panchromatic (Pan) (2.1 m) | Curvature (5.8 m) |
| Red (5.8 m) | Hillshade (5.8 m) |
| Green (5.8 m) | Roughness (5.8 m) |
| Blue (5.8 m) | Flow direction (5.8 m) |
| Near Infrared (NIR) (5.8 m) | Slope (5.8 m) |
| Normalized Difference Vegetation Index (NDVI) (5.8 m) |
Table 2.
Object features used in this study.
| Object-Feature Domains (No.) | Features (No.) |
|---|---|
| Layer features (57) | Max (11), Min (11), Stdv (standard deviation) (11), Mean (11), Ratio (11), Brightness (1), MaxDiff (1) |
| Texture features (60) | GLCMall dir. (Ent (12), Mean (12), Cor (12), Con (12), Stdv (12)) |
| Geometry features (7) | Shape index (1), Density (1), Main direction (1), Roundness (1), Length-width ratio (1), Area (1), Number of Pixels (1) |
Table 3.
Selected features used in this study.
| Features (No.) | Layers |
|---|---|
| Mean (7) | Pan, Hillshade, Roughness, Blue, Green, NIR, Flow Direction |
| Min (7) | Pan, Hillshade, Roughness, Blue, Green, NIR, Flow Direction |
| Max (6) | Hillshade, Roughness, Blue, Green, NIR, Flow Direction |
| Ratio (4) | Hillshade, Blue, NIR, Flow Direction |
| Stdv (2) | Roughness, NIR |
Table 4.
Quantitative evaluation of the proposed methods in the study area together with the estimated standard deviations (The bolded number means the highest accuracy in each row).
Table 4.
Quantitative evaluation of the proposed methods in the study area together with the estimated standard deviations (The bolded number means the highest accuracy in each row).
| Methods | Completeness (%) | Correctness (%) | Quality (%) | UA (%) | PA (%) | OA (%) | KAPPA (%) |
|---|---|---|---|---|---|---|---|
| RFLM | 71.9 ± 0.13 | 91.5 ± 0.07 | 67.1 ± 0.45 | 89.7 ± 0.44 | 72.9 ± 0.72 | 95.0 ± 0.08 | 77.6 ± 0.43 |
| RFCLM | 84.1 ± 0.36 | 90.9 ± 0.11 | 77.0 ± 0.48 | 89.2 ± 0.52 | 84.2 ± 0.61 | 96.3 ± 0.09 | 84.4 ± 0.38 |
| RFOLM | 63.8 ± 0.88 | 97.6 ± 0.13 | 61.2 ± 0.56 | 96.9 ± 0.42 | 64.1 ± 0.97 | 94.6 ± 0.13 | 74.3 ± 0.76 |
| RFOCLM | 67.8 ± 0.89 | 97.4 ± 0.12 | 65.9 ± 0.69 | 96.9 ± 0.44 | 67.6 ± 0.97 | 95.1 ± 0.13 | 77.0 ± 0.74 |
| RFCOLM | 81.5 ± 0.47 | 93.5 ± 0.08 | 77.6 ± 0.39 | 92.8 ± 0.53 | 83.0 ± 0.66 | 96.7 ± 0.1 | 85.7 ± 0.44 |
Legend for the abbreviations: RFLM: Landslide mapping based on the RF method; RFCLM: Landslide mapping based on the RF method and Closing operation; RFOLM: Landslide mapping based on the RF method and Opening operation; RFOCLM: Landslide mapping based on the RF method and Opening followed by Closing operation; RFCOLM: Landslide mapping based on the RF method and Closing followed by Opening operation.
© 2017 by the authors. Licensee MDPI, Basel, Switzerland. This article is an open access article distributed under the terms and conditions of the Creative Commons Attribution (CC BY) license (http://creativecommons.org/licenses/by/4.0/).
Share and Cite
MDPI and ACS Style
Chen, T.; Trinder, J.C.; Niu, R. Object-Oriented Landslide Mapping Using ZY-3 Satellite Imagery, Random Forest and Mathematical Morphology, for the Three-Gorges Reservoir, China. Remote Sens. 2017, 9, 333. https://doi.org/10.3390/rs9040333
AMA Style
Chen T, Trinder JC, Niu R. Object-Oriented Landslide Mapping Using ZY-3 Satellite Imagery, Random Forest and Mathematical Morphology, for the Three-Gorges Reservoir, China. Remote Sensing. 2017; 9(4):333. https://doi.org/10.3390/rs9040333
Chicago/Turabian StyleChen, Tao, John C. Trinder, and Ruiqing Niu. 2017. "Object-Oriented Landslide Mapping Using ZY-3 Satellite Imagery, Random Forest and Mathematical Morphology, for the Three-Gorges Reservoir, China" Remote Sensing 9, no. 4: 333. https://doi.org/10.3390/rs9040333
Note that from the first issue of 2016, this journal uses article numbers instead of page numbers. See further details here.