
The Role of Citizen Science in Earth Observation


1
Ecosystems Services and Management Program, International Institute for Applied Systems Analysis (IIASA), A-2361 Laxenburg, Austria
2
Department of Mathematics, University of Coimbra, 3001-501 Coimbra, Portugal
3
Institute for Systems Engineering and Computers at Coimbra (INESC Coimbra), 3030-290 Coimbra, Portugal
*
Author to whom correspondence should be addressed.
Remote Sens. 2017, 9(4), 357; https://doi.org/10.3390/rs9040357
Submission received: 29 March 2017
/
Revised: 29 March 2017
/
Accepted: 29 March 2017
/
Published: 11 April 2017
(This article belongs to the Special Issue Citizen Science and Earth Observation)
Abstract
:Citizen Science (CS) and crowdsourcing are two potentially valuable sources of data for Earth Observation (EO), which have yet to be fully exploited. Research in this area has increased rapidly during the last two decades, and there are now many examples of CS projects that could provide valuable calibration and validation data for EO, yet are not integrated into operational monitoring systems. A special issue on the role of CS in EO has revealed continued trends in applications, covering a diverse set of fields from disaster response to environmental monitoring (land cover, forests, biodiversity and phenology). These papers touch upon many key challenges of CS including data quality and citizen engagement as well as the added value of CS including lower costs, higher temporal frequency and use of the data for calibration and validation of remotely-sensed imagery. Although still in the early stages of development, CS for EO clearly has a promising role to play in the future.
1. Introduction
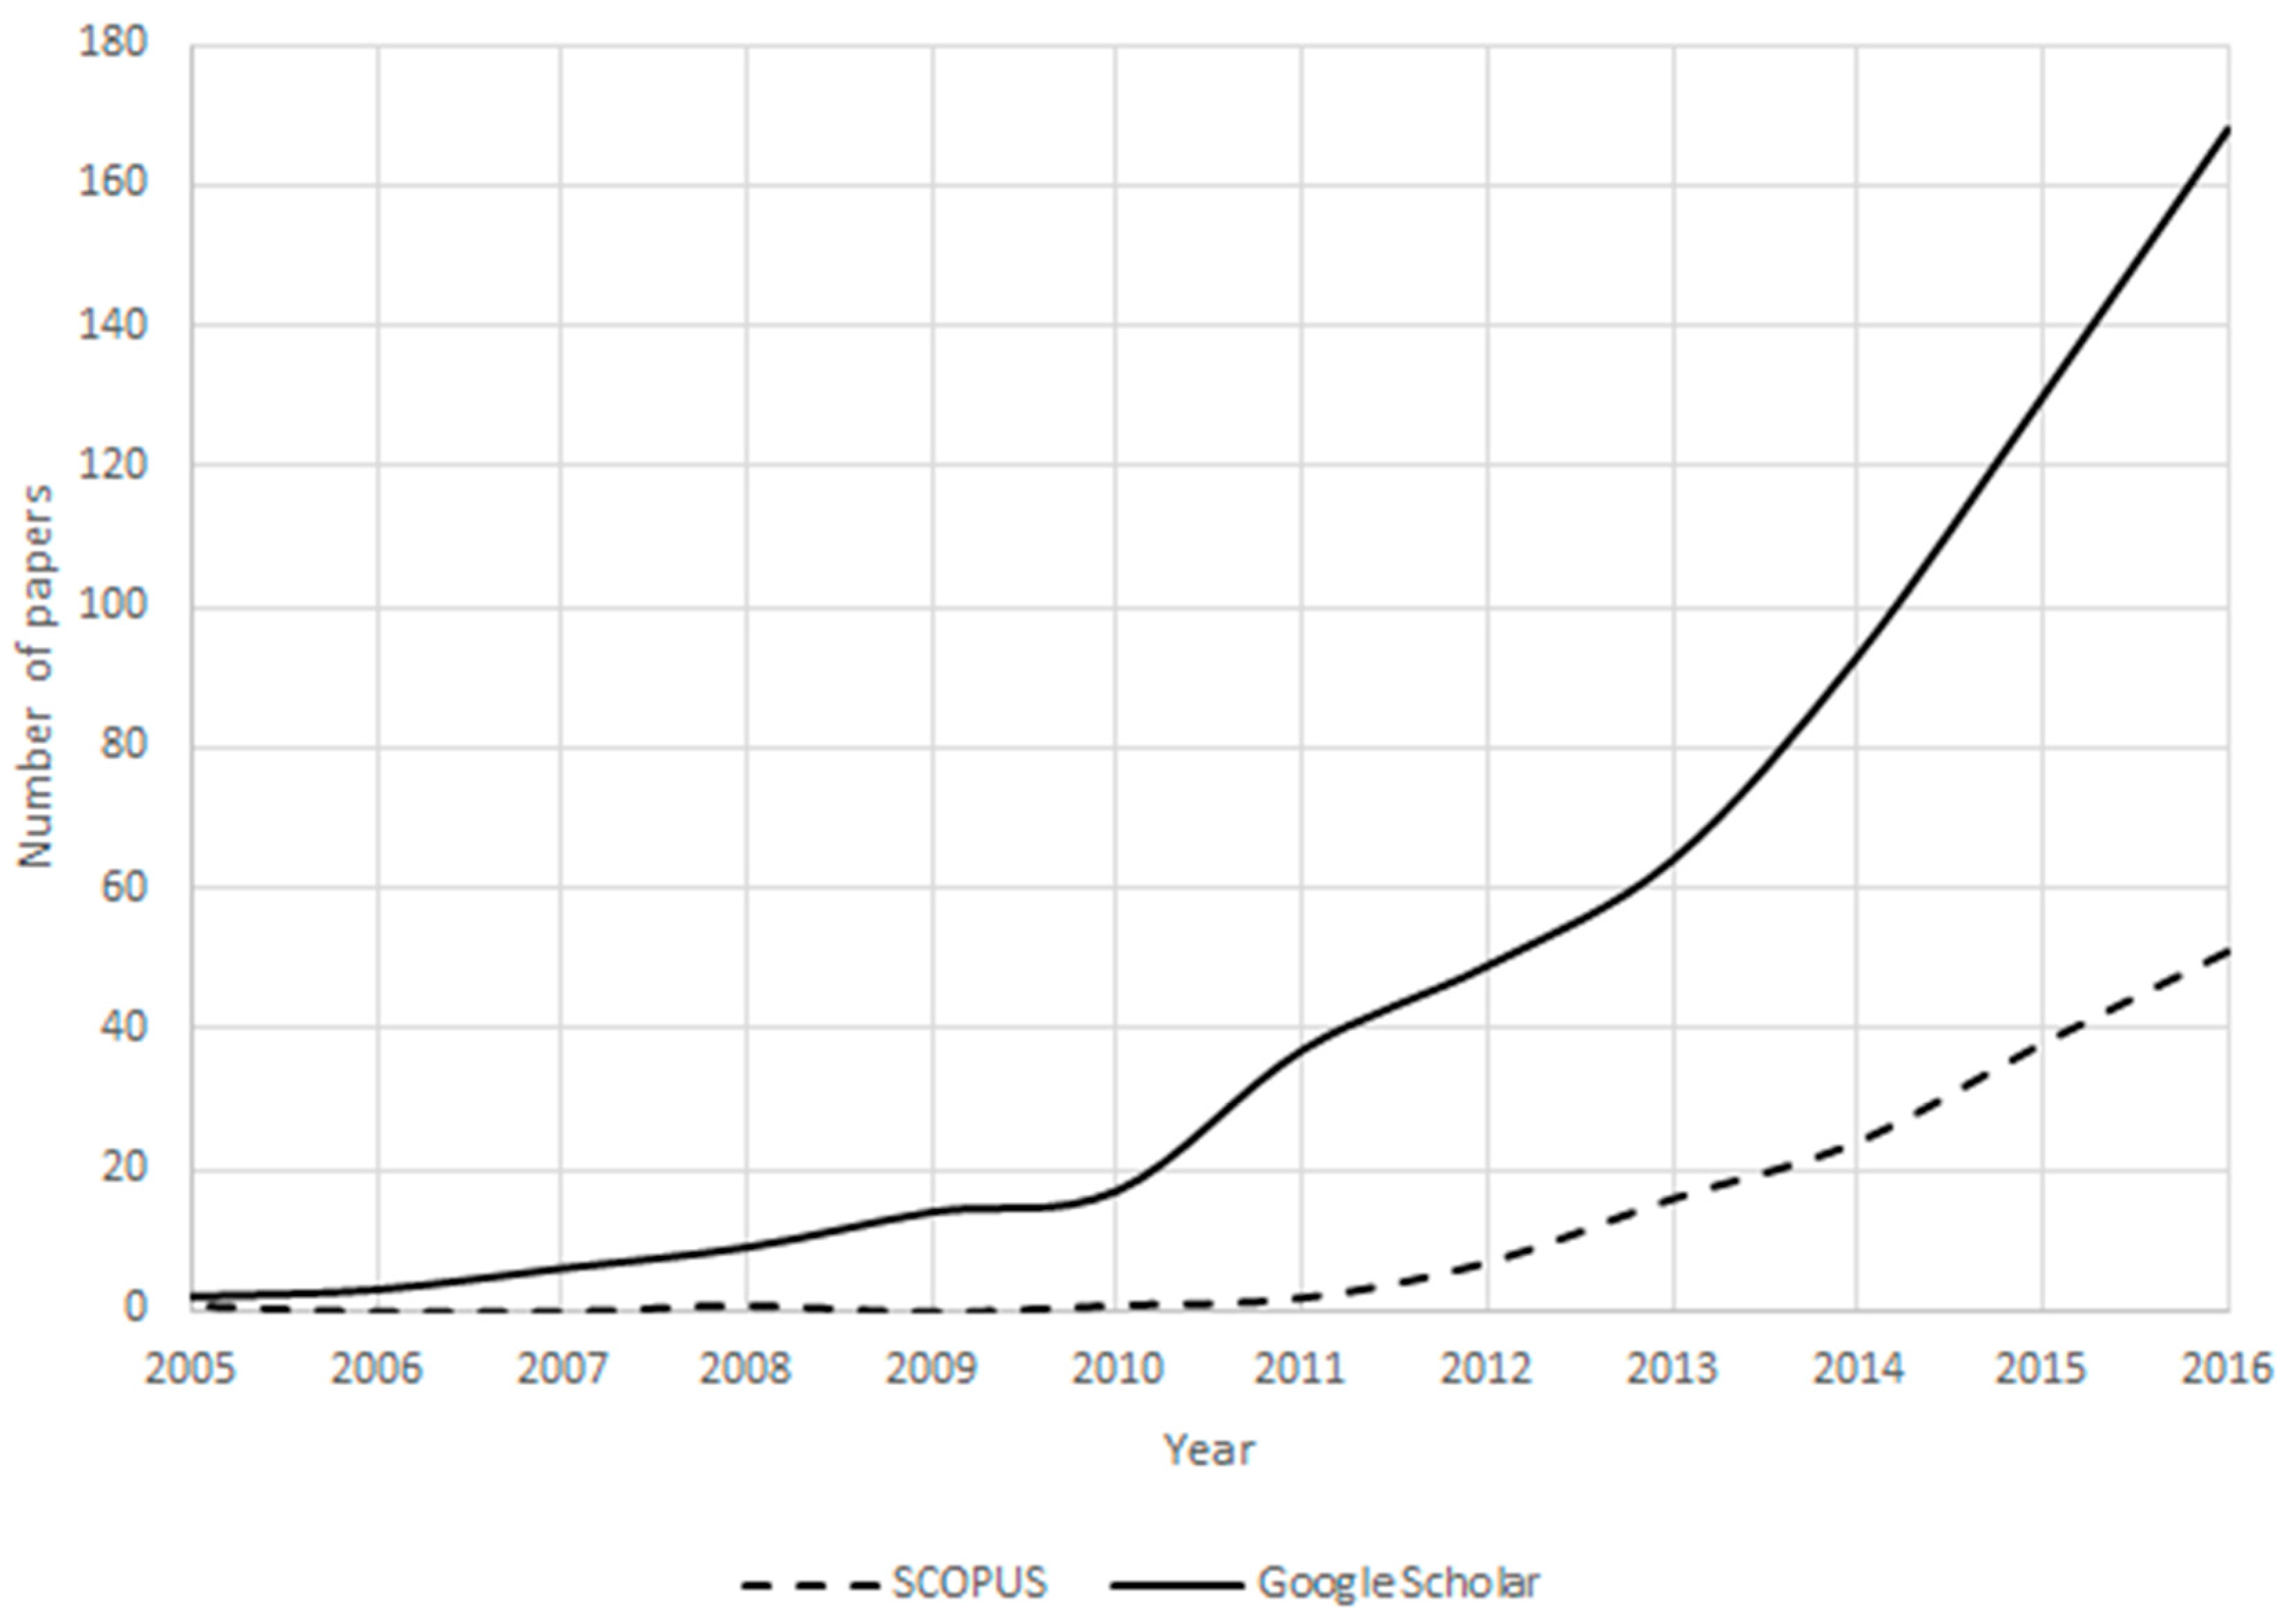
Earth Observation (EO) is the collection of information about the Earth’s surface using remote sensing and in situ surveying on the ground [1]. Hence, it encompasses imagery from a range of satellite sensors, aerial imagery from airplanes and increasingly unmanned aerial vehicles, as well as permanent ground-based sensors and field-based measurements collected using handheld sensors, digital questionnaires or using paper-based formats. Once the domain of only professionals, the field of EO has seen new inputs coming from Citizen Science (CS), which is the involvement of citizens in scientific research, from data collection through to hypothesis generation [2]. This is clearly reflected in the increasing number of publications that have appeared in the area of EO and CS as shown in Figure 1, which is based on a search of the terms ‘Earth Observation’ and ‘Citizen Science’ in both Scopus and Google Scholar.
Citizens generally provide inputs to EO in two main ways, i.e., through image interpretation and through collection of in situ data, both of which are useful for the calibration and validation of remotely-sensed imagery or products derived from EO [3]. Table 1 lists a number of different CS projects that are currently providing data useful for EO, classified by the type of data collected. Although the list is not exhaustive since this field is changing rapidly, it does serve to illustrate the vast breadth of projects that have emerged over more than four decades. Despite the long history of such initiatives, the majority of projects listed in Table 1 are much more recent and were started in the current decade.
We have also indicated whether the data collection is carried out outdoors, i.e., field-based, and which ones are carried out online, i.e., usually indoors. Some projects combine both data collection options. The summary of projects in Table 1 shows that around 58% are field-based only, 25% are online only, while 17% have both a field and online component. This shows that the majority of projects (around 83%) are collecting in situ data, which can help to fill a much needed data gap [4].
CS is used here in the widest sense since most of the CS projects listed in Table 1 involve citizens mainly in data collection rather than in scientific analysis of the data or project design. However, there are documented examples of where citizens are involved in the full sequence or workflow of a CS project, from project design, data collection, methodology development to data analysis and interpretation of results [6].
The increased role that citizens are playing in the field of EO has been driven by a number of factors. The first is the availability of very high resolution satellite imagery through initiatives like Google Maps and Bing Maps, which have brought very high resolution satellite imagery much closer to citizens and made it part of their daily lives. The second is technological, as advances in mobile technology and Web 2.0 have resulted in an environment where citizens can literally map the world, e.g., through OpenStreetMap (OSM) or Google MapMaker, or collect georeferenced data as they move throughout their physical space. At the same time, new satellite sensors have been launched, resulting in new big data streams from the Copernicus Sentinel satellites and through Planet, which will become enablers for many new EO applications in CS in the future.
However, CS remains a challenge in itself due to numerous issues such as quality [7,8,9,10], data interoperability [11,12], the engagement and motivation of citizens [13,14], strategies for retention and sustainability of participation [15,16], and increasingly, legal issues related to privacy, ethics and licensing [17], among others. This special issue includes papers that address some of these issues in relation to the use of CS for EO, while other aspects associated with crowdsourcing, in particular the value of crowdsourced data, are also considered within the different application-oriented papers. In the next section, a summary of the findings presented in the special issue papers is given, which represent some of the latest advances in CS and EO. In the final section, some ideas about the possible future directions for CS and EO are presented.
2. Latest Advances in Citizen Science and Earth Observation
This special issue contains 11 publications that include 10 research papers and one review paper. One of the 10 research papers focuses on the status of CS and is therefore summarized together with the review paper in Section 2.1. The other nine papers of this special issue deal with applications in the fields of disasters, the marine environment, biodiversity (species occurrence and phenology), land cover and forest monitoring, which are summarized in Section 2.2.
2.1. Citizen Observatories and the Status of CS for EO
In the paper by Grainger [18], the author provides a review and analysis of citizen observatories, which are described as a recent development facilitated through top-down funding by the European Commission. The author further points out that citizen observation systems are much more complex than traditional satellite-based observation systems and stresses that communication, the needs of the end user, and their understanding and acceptance of the data are critical. Grainger [18] then proposes a new framework for extending the current remote sensing framework to encompass all EO systems, which includes citizen observatories, and how data collected in these systems can be converted into usable information for decision makers. Finally, Grainger [18] divides the types of citizen contributions into three different categories, namely data collectors, participatory science and co-creation. It should be noted that the application papers in Section 2.2 fall primarily into the category of data collectors rather than having citizens actively participating in or co-creating the scientific project. This is a similar finding to the projects listed in Table 1.
Linking closely to [18], the paper by Mazumdar et al. [19] outlines a stakeholder analysis that was undertaken as part of the ‘Crowdsourcing for observations from Satellites (Crowd4Sat)’ project, which is one of the ESA’s (European Space Agency) current demonstration projects on CS for EO. The stakeholder analysis investigated how CS and crowdsourcing impact the validation, use and enhancement of observations from satellites. Some key findings of the analysis include: (1) the first adopters that make use of CS are academia followed by civil protection agencies, tourism organizations and local authorities; (2) communication to citizens on how and for what their data are used is essential as well as continued feedback, where social media can play an important role; (3) CS and crowdsourcing can potentially verify and improve the spatial and temporal resolution of satellite observations, in particular in the field of disaster response and environmental monitoring, and will play an increasing role in the future; (4) the remaining challenges are data protection, privacy, standardization, clear policies, quality and understanding the true value of CS data; and (5) user experience and the touch and feel of applications play an essential role in engaging citizens.
2.2. Applications of CS and EO
2.2.1. Disaster Response
The paper by Albuquerque et al. [20] explores the value of crowdsourced data for humanitarian mapping. The authors identify a typology of the tasks used in geographic information crowdsourcing, including classification and digitization (both performed by citizens) and conflation (performed in this article by the research team). These were applied to a case study in the area of humanitarian aid, namely the “Map South Kivu” sub-project of the ‘Missing Maps’ project. The difficulty of the tasks was assessed as well as the quality of the results obtained, which were compared with the data available in OSM. The main findings were that: (1) 25% of the volunteers contributed 80% of the data collected, similar to findings in other CS and crowdsourcing projects [16]; (2) tasks that involve the creation of objects proved to be more difficult to execute than tasks that do not involve objects; (3) the agreement between volunteers was shown to be a very good indicator of task difficulty and of the reliability of the results; (4) task design was shown to be important for the performance of the results; and (5) the crowdsourced classification of satellite imagery can produce geographic information about human settlements with a high level of quality, achieving an accuracy of 89%, a sensitivity of 73% and a precision of 89%, where these results are comparable to the use of automated approaches. The advantages of the use of crowdsourced data over automated approaches were larger when mapping small buildings, which were not detected automatically, and, in some cases, these can represent a large percentage of the features. The authors suggest that crowdsourcing may be used in the future to identify training sets and to complement automated classification, tackling difficult situations in particular.
2.2.2. The Marine Environment
The paper by Busch et al. [21] illustrates the added value that citizens can bring when they monitor ocean color, in particular along coastlines. They can fill observational gaps since remote sensing methods are not accurate along coastal zones due to the mixed pixel problem of having land and water. This paper presents tools and methods derived from the EU-funded FP7 Citclops citizen observatory. The tools are attractive to a wide set of different users since they range from stand-alone smartphone apps to devices with Arduino and 3D printing. From the different methods used, the highest number of measurements collected by citizens was 1600 via the EyeOn Water-Color app, which is the simplest method developed. The authors stressed that offering easy-to-use tools with different levels of complexity is fundamental for engaging citizens. The methodologies implemented in the paper enabled high quality data to be collected when compared with standard in situ or laboratory measurements. Automatic quality control procedures were also implemented to guarantee the validity of the contributions.
2.2.3. Biodiversity: Species Occurrence
The article by Heigl et al. [22] compares roadkill data collected by citizens with data collected by hunters for hares killed in Lower Austria. The authors used road network data from OSM, Corine Land Cover products and aerial photography to manually map structural landscape elements. The results showed that hunters and citizens report roadkill in different areas, i.e., hunters report more often in rural areas, which have greater length of secondary roads and agricultural areas, compared with citizens, while citizens report more often in urban land cover, where there is higher coverage of motorways and residential roads. No significant differences in reporting between hunters and citizens were found in relation to the amount of landscape structural elements. Thus, these results showed that hunters and citizens cover different regions so should be viewed as complementary sources of data. The authors plan to scale up the exercise to all of Austria and they recommend the collection of data on the demographic and social background of the participants, since different types of people appear to survey different locations.
2.2.4. Land Cover
The aim of the paper by Laso Bayas et al. [23] was to present results from the FotoQuest Austria campaign, which ran during the summer of 2015 for several months. Data were collected via the FotoQuest Austria mobile app at the same sample locations where EUROSAT commissions the collection of ground data via the Land Use and Cover Area frame Survey (LUCAS) every three years. The mobile app was designed to follow the LUCAS protocol as closely as possible and to make the data collection as simple as possible. When comparing the official land cover and land-use classes collected by LUCAS with those collected by volunteers, there was generally good agreement for level 1 land cover classes (e.g., artificial surfaces and cropland) and at the most aggregated level for land-use (e.g., agriculture), but performance decreased at levels 2 and 3 (e.g., less common crop types). In general, homogeneous areas also showed higher agreement than heterogeneous ones. The first results from this initial campaign show that CS-based land cover collection can complement but not replace the official survey. Other advantages are reduced costs and potentially a more frequent inventory.
The paper by Salk et al. [24] analyzed data from a Geo-Wiki campaign, which was run over the summer with 30 students, and a second campaign using a Geo-Wiki game called Cropland Capture. Cropland Capture is available on desktop or mobile devices where users are asked to identify evidence of cropland from very high-resolution satellite imagery. During the Cropland Capture campaign, more than 4.5 million classifications of cropland and non-cropland were acquired by over 3300 volunteers. The paper focused on examining whether people who lived closer to an image performed better than volunteers who lived further away, i.e., does local knowledge influence performance? The results from the analysis showed that distance from a person’s hometown to the image being classified had no or very little influence on the actual performance of the volunteers or students. For example, one difficulty volunteers faced was to differentiate between managed pasture and cropland, but the results showed little difference in the performance when comparing volunteers who lived in the same country from where the images were sourced compared to those living outside that country. One reason why there was little difference might be that most volunteers were living in cities rather than the countryside and hence there was little local knowledge of the surrounding rural landscapes.
2.2.5. Forests
The article by Molinier et al. [25] presents the Relasphone mobile application (version 1.5, VTT Technical Research Centre of Finland, Espoo, Finland), developed to collect in situ data for forest inventories, namely, basal area and tree species, height, diameter and age, among other data of interest. These data are expensive to obtain with traditional methods, and thus data collection is usually limited to only a small number of samples. The authors describe the application and the data gathered with the app in two study areas (with mixed forest from different biomes) located, respectively, in Finland and Mexico, and then assess the accuracy of the data collected using reference forest inventory data. The results showed a good agreement between the data collected by the Relasphone mobile application and the reference data and also consistency between data collected by different observers. The data collected regarding basal area and stem volume were used as training sets to classify optical satellite imagery in order to create maps of basal area and stem volume. The maps obtained for the two study areas were comparable to the maps obtained using other training areas. The authors also analyze the relevance of the application for CS, as well as its potential for EO and mapping biomass worldwide, in particular for monitoring tropical forests.
2.2.6. Biodiversity: Phenology
The first paper on phenology is by Wallace et al. [26] and provides an example of the use of CS to monitor invasive buffelgrass in Southern Arizona. Since treatment of buffelgrass is only efficient after a 50% greening, both remote sensing and observations on the ground are needed to optimize any interventions. CS was used to gather data on the phenological development of buffelgrass in two different locations and in two different ways: observations made by one observer over several years and observations made at the same place by 10 different citizen recruits for a shorter time period. The crowdsourced data were then used to establish a relationship between greenness and cumulative precipitation from remote sensing in order to determine the cumulative precipitation threshold at which treatment can begin, which differed between the two locations. Moreover, CS was used to validate the MODIS NDVI product, demonstrating a link between field observations and the NDVI profile.
The second paper on phenology [27] describes how citizens contributed to identifying features from images taken from a network of 300 phenology cameras as part of the CS project called ‘Season Spotter’. Zooniverse was used as the platform to run the exercises. The Zooniverse network of volunteers is set up to undertake visual interpretation of images that cannot be done at all or not very well via automatic classification. In three exercises, citizens were asked to identify information on snow and image quality, delineate trees and to identify phenological change between pairs of images when they were a number of days apart. In general, citizens were able to identify the plant phases correctly (except for grass seedheads), they could spot snow and poor quality images, and they were able to demarcate trees as well as phenological changes. The information collected helped to identify the start and end of the growing season, which could be compared with remotely sensed data and serve as a calibration dataset. CS data in this application is particularly useful in complementing remotely sensed data as well as traditional ground-based data collection, in order to validate remotely-sensed vegetation indices and to help improve the phenophase detection algorithms.
The last paper on phenology by Elmore et al. [28] focuses on trees and examines if MODIS resolution data can be used to characterize the phenology of individual trees. The study taps into the Nature’s Notebook project to obtain ground observations on phenological stages of different tree species including Poplar and Lilac. When processing the crowdsourced data, a number of quality control rules were applied, which effectively filtered the data and helped to improve the correlation between the observations on the ground and the time series of the MODIS indices. The findings showed that some species are better suited for phenotyping using MODIS data than others since the MODIS signal always represents the average over the pixel extent. Recommendations were given to target homogeneous forest areas since heterogeneous landscapes influence the overall average tree signal and affect the quality of the phenotyping. The paper showed that the data from citizens can clearly complement data from remote sensing.
2.3. Summary of the Applications
All applications in the special issue show that citizens do have a clear role in EO. They cover a wide range of fields from marine applications to disasters, as well as land monitoring applications in the field of land cover, forestry, phenology and biodiversity. Depending on the application, the added value of citizen observations ranges includes cost savings (S), making data available at a higher frequency (F), contributing to calibration and validation activities (P) and complementing traditional or RS-based methods (C). Table 2 provides a summary of the nine application papers in terms of this added value as well as the type of data used (CS-based and other types of data) and the maturity level of the application. Six applications involve outdoor activities while three could be performed indoors, involving the visual interpretation of very high-resolution images from space or images derived from a ground-based camera. All applications involve citizens in performing data collection tasks, eight use remote sensing data in one way or another and five make use of traditional or authoritative data and compare them to the crowdsourced data. Three applications directly compare remote sensing data with CS data. Most papers are in the initial research phase, with most at a low level of maturity. All applications clearly demonstrate an added value of citizen observations, where the majority complement RS data or traditional in situ data.
3. The Future Outlook for Citizen Science and Earth Observation
In the last decade, we have seen a massive increase in research on CS and EO (see Figure 1) and this trend is expected to continue in the future. Moreover, as we showed in Table 1, there are already many different ongoing CS projects that have relevance for EO, but most are not embedding their data streams into operational EO applications, while others suffer from insufficient citizen participation. One important element needed to make citizen observations an official data stream is legal recognition by governments and local authorities that citizen-based data are a valid source of information and to recognize that citizens are able to deliver data of sufficient quality that can potentially complement, but not necessarily replace, existing observation networks. For example, in the USA, the Crowdsourcing and CS Act, which came into force in January 2017, gives federal agencies clear authorization to use CS and crowdsourced data. This recognition paves the way for the development of truly integrated environmental monitoring systems involving citizens as a key contributor. No such legislation exists in the EU or other countries around the world.
The ubiquitous dispersion of smartphone technology has acted as an enabler and allows citizens, with little effort, using well-designed and user friendly apps, to collect observations of the environment, which can then be stored in a data repository for curation and further analysis. A second enabler of CS and EO is the sheer amount of new and freely available remotely-sensed data. When fully operational, the Sentinel satellites of the European Copernicus program will collect several TB of data per day, where Sentinel-2 images, for example, will be acquired every five days at a 10 m resolution. There are also new commercial providers such as Planet, which will eventually provide daily observations of the globe at a 3 m resolution, improving the chances of obtaining cloud free imagery. This will enable near real-time monitoring of changes occurring on the Earth; such data are becoming increasingly attractive since they can be used to build more applications for citizens that will potentially stimulate their engagement and further mainstream the use of satellite data by citizens in their daily lives.
The two biggest challenges for CS at present are related to the quality of the data and how to engage and retain citizen participation in the longer term. Quality can be improved via training; through the continuous monitoring of data quality with embedded feedback provided to citizens, the volunteers can improve over time. In terms of engagement, Budhathoki and Haythornthwaite [29] showed that there are several reasons why citizens participate, including a range of motivations such as altruism, self-achievement and personal interest, among others. Successful CS or crowdsourcing projects have been those where citizens were able to derive a direct benefit from the data collected by others. One typical example is mountain bike tracks that are recorded at some locations in great detail. For example, a new route entered by one mountain biker can be used directly by another one living close by. Another increasingly popular way of engaging citizens is via gamification and making data collection a fun experience. For the first time, Pokémon Go has managed to engage a massive crowd of players to go outside their homes, sometimes to remote places, to collectively catch 88 billion monsters (as of 1 March 2017). Had Pokémon Go also collected information about real objects found in the environment, e.g., taking a picture of a tree while simultaneously catching a virtual monster, such data could have been very valuable and an initial global database on tree species, health and location could have been derived from such a game. Although the majority of observations would not have been in remote or inaccessible places, this could have been used to document tree health in cities and towns and benefited the CS applications of urban tree monitoring (see Table 1). The data would also have been provided at an incredibly high temporal resolution, i.e., possibly seconds between observations, which would allow for rapid infestations to be clearly identified.
This special issue dedicated to CS and EO includes some review-oriented publications but mainly consists of research papers demonstrating applications in many diverse environmental domains. As with much of CS today, the citizen contributions in the application papers are mainly in the form of data collection and not in project co-design or data analysis. Moreover, many of the most relevant aspects related to CS have been addressed in some way in this compilation of papers, such as the role of citizens in collecting data, the quality of crowdsourced data, data conflation, and the combination of CS with other technologies and methods applied by experts, to name just a few. Even though the use of CS for EO is still at an early stage, the huge potential arising from the combination of both data streams is already very clear.
Acknowledgments
The authors would like to acknowledge partial support from the EU-funded ERC CrowdLand project (No. 617754), the Horizon2020 LandSense project (No. 689812) and FCT project UID/Multi/00308/2013. Thanks also go to Michaela Rossini for providing support in the Scopus and Google Scholar analysis.
Author Contributions
Steffen Fritz conceived the content and structure, Linda See and Cidália Costa Fonte analyzed the content of the articles, Linda See conceived and created the tables and Steffen Fritz, Cidália Costa Fonte and Linda See wrote the paper.
Conflicts of Interest
The authors declare no conflicts of interest.
Abbreviations
The following abbreviations are used in this manuscript:
| CS | Citizen Science |
| EO | Earth Observation |
| LUCAS | Land Use and Cover Area frame Survey |
| MODIS | Moderate Resolution Imaging Spectroradiometer |
| NDVI | Normalized Difference Vegetation Index |
| OSM | OpenStreetMap |
| RS | Remote Sensing |
References
- GEO Implementing GEOSS. Access. Connecting. Users. Available online: https://www.earthobservations.org/geoss.php (accessed on 29 March 2017).
- Bonney, R.; Cooper, C.B.; Dickinson, J.; Kelling, S.; Phillips, T.; Rosenberg, K.V.; Shirk, J. Citizen science: A developing tool for expanding science knowledge and scientific literacy. BioScience 2009, 59, 977–984. [Google Scholar] [CrossRef]
- See, L.; Fritz, S.; Dias, E.; Hendriks, E.; Mijling, B.; Snik, F.; Stammes, P.; Vescovi, F.D.; Zeug, G.; Mathieu, P.P.; et al. Supporting Earth-Observation Calibration and Validation: A new generation of tools for crowdsourcing and citizen science. IEEE Geosci. Remote Sens. Mag. 2016, 4, 38–50. [Google Scholar] [CrossRef]
- EEA. Workshop Report: Monitoring Matters: In–Situ Coordination in Support of Copernicus; EEA: Copenhagen, Denmark, 2013. [Google Scholar]
- Clark, M.L.; Aide, T.M. Virtual Interpretation of Earth Web-Interface Tool (VIEW-IT) for collecting land-use/land-cover reference data. Remote Sens. 2011, 3, 601–620. [Google Scholar] [CrossRef]
- Stevens, M.; Vitos, M.; Altenbuchner, J.; Conquest, G.; Lewis, J.; Haklay, M. Taking Participatory Citizen Science to Extremes. IEEE Pervasive Comput. 2014, 13, 20–29. [Google Scholar]
- Fonte, C.C.; Antoniou, V.; Bastin, L.; Estima, J.; Arsanjani, J.J.; Laso-Bayas, J.-C.; See, L.; Vatseva, R. Assessing VGI data quality. In Mapping and the Citizen Sensor; Foody, G.M., See, L., Fritz, S., Fonte, C.C., Mooney, P., Olteanu-Raimond, A.-M., Antoniou, V., Eds.; Ubiquity Press: London, UK, 2017; in press. [Google Scholar]
- Senaratne, H.; Mobasheri, A.; Ali, A.L.; Capineri, C.; Haklay, M.M. A review of volunteered geographic information quality assessment methods. Int. J. Geogr. Inf. Sci. 2017, 31, 139–167. [Google Scholar] [CrossRef]
- Antoniou, V.; Skopeliti, A. Measures and indicators of VGI quality: An overview. In ISPRS Annals of the Photogrammetry, Remote Sensing and Spatial Information Sciences; ISPRS Annals: La Grande Motte, France, 2015; pp. 345–351. [Google Scholar]
- Ballatore, A.; Zipf, A. A conceptual quality framework for Volunteered Geographic Information. In Spatial Information Theory; Fabrikant, S.I., Raubal, M., Bertolotto, M., Davies, C., Freundschuh, S., Bell, S., Eds.; Springer International Publishing: Cham, Switzerland, 2015; Volume 9368, pp. 89–107. [Google Scholar]
- Bakillah, M.; Liang, S.H.L.; Zipf, A.; Arsanjani, J.J. Semantic Interoperability of Sensor Data with Volunteered Geographic Information: A Unified Model. ISPRS Int. J. Geo Inf. 2013, 2, 766–796. [Google Scholar] [CrossRef]
- Peisheng, Z. Geospatial Web Services: Advances in Information Interoperability: Advances in Information Interoperability; IGI Global: Hershey, PA, USA, 2010. [Google Scholar]
- Coleman, D.J.; Georgiadou, Y.; Labonte, J. Volunteered geographic information: The nature and motivation of produsers. Int. J. Spat. Data Infrastruct. Res. 2009, 4, 332–358. [Google Scholar]
- Iacovides, I.; Jennett, C.; Cornish-Trestrail, C.; Cox, A.L. Do games attract or sustain engagement in citizen science? A study of volunteer motivations. In Proceedings of the CHI’13 Extended Abstracts on Human Factors in Computing Systems, Paris, France, 27 April–2 May 2013; ACM Press: New York, NY, USA, 2013; p. 1101. [Google Scholar]
- Hsu, A.; Malik, O.; Johnson, L.; Esty, D.C. Development: Mobilize citizens to track sustainability. Nature 2014, 508, 33–35. [Google Scholar] [CrossRef] [PubMed]
- Fritz, S.; See, L.; Brovelli, M.A. Motivating and sustaining participation in VGI. In Mapping and the Citizen Sensor; Foody, G.M., See, L., Fritz, S., Fonte, C.C., Mooney, P., Olteanu-Raimond, A.-M., Antoniou, V., Eds.; Ubiquity Press: London, UK, 2017; in press. [Google Scholar]
- Mooney, P.; Olteanu-Raimond, A.-M.; Touya, G.; Juuls, N.; Alvanides, S. Ethics, privacy and legal issues in VGI. In Mapping and the Citizen Sensor; Foody, G.M., See, L., Fritz, S., Fonte, C.C., Mooney, P., Olteanu-Raimond, A.-M., Antoniou, V., Eds.; Ubiquity Press: London, UK, 2017; in press. [Google Scholar]
- Grainger, A. Citizen Observatories and the New Earth Observation Science. Remote Sens. 2017, 9, 153. [Google Scholar] [CrossRef]
- Mazumdar, S.; Wrigley, S.; Ciravegna, F. Citizen Science and Crowdsourcing for Earth Observations: An Analysis of Stakeholder Opinions on the Present and Future. Remote Sens. 2017, 9, 87. [Google Scholar] [CrossRef]
- Albuquerque, J.; Herfort, B.; Eckle, M. The Tasks of the Crowd: A Typology of Tasks in Geographic Information Crowdsourcing and a Case Study in Humanitarian Mapping. Remote Sens. 2016, 8, 859. [Google Scholar] [CrossRef]
- Busch, J.; Bardaji, R.; Ceccaroni, L.; Friedrichs, A.; Piera, J.; Simon, C.; Thijsse, P.; Wernand, M.; van der Woerd, H.; Zielinski, O. Citizen Bio-Optical Observations from Coast- and Ocean and Their Compatibility with Ocean Colour Satellite Measurements. Remote Sens. 2016, 8, 879. [Google Scholar] [CrossRef]
- Heigl, F.; Stretz, C.; Steiner, W.; Suppan, F.; Bauer, T.; Laaha, G.; Zaller, J. Comparing Road-Kill Datasets from Hunters and Citizen Scientists in a Landscape Context. Remote Sens. 2016, 8, 832. [Google Scholar] [CrossRef]
- Laso Bayas, J.; See, L.; Fritz, S.; Sturn, T.; Perger, C.; Dürauer, M.; Karner, M.; Moorthy, I.; Schepaschenko, D.; Domian, D.; et al. Crowdsourcing In-Situ Data on Land Cover and Land Use Using Gamification and Mobile Technology. Remote Sens. 2016, 8, 905. [Google Scholar] [CrossRef]
- Salk, C.; Sturn, T.; See, L.; Fritz, S. Local Knowledge and Professional Background Have a Minimal Impact on Volunteer Citizen Science Performance in a Land-Cover Classification Task. Remote Sens. 2016, 8, 774. [Google Scholar] [CrossRef]
- Molinier, M.; López-Sánchez, C.; Toivanen, T.; Korpela, I.; Corral-Rivas, J.; Tergujeff, R.; Häme, T. Relasphone—Mobile and Participative In Situ Forest Biomass Measurements Supporting Satellite Image Mapping. Remote Sens. 2016, 8, 869. [Google Scholar] [CrossRef]
- Wallace, C.; Walker, J.; Skirvin, S.; Patrick-Birdwell, C.; Weltzin, J.; Raichle, H. Mapping Presence and Predicting Phenological Status of Invasive Buffelgrass in Southern Arizona Using MODIS, Climate and Citizen Science Observation Data. Remote Sens. 2016, 8, 524. [Google Scholar] [CrossRef]
- Kosmala, M.; Crall, A.; Cheng, R.; Hufkens, K.; Henderson, S.; Richardson, A. Season Spotter: Using Citizen Science to Validate and Scale Plant Phenology from Near-Surface Remote Sensing. Remote Sens. 2016, 8, 726. [Google Scholar] [CrossRef]
- Elmore, A.; Stylinski, C.; Pradhan, K. Synergistic Use of Citizen Science and Remote Sensing for Continental-Scale Measurements of Forest Tree Phenology. Remote Sens. 2016, 8, 502. [Google Scholar] [CrossRef]
- Budhathoki, N.R.; Haythornthwaite, C. Motivation for open collaboration: Crowd and community models and the case of OpenStreetMap. Am. Behav. Sci. 2012, 57, 548–575. [Google Scholar] [CrossRef]
Figure 1.
Number of publications in SCOPUS and Google Scholar over time addressing ‘Earth Observation’ and ‘Citizen Science’.
Figure 1.
Number of publications in SCOPUS and Google Scholar over time addressing ‘Earth Observation’ and ‘Citizen Science’.


Table 1.
Examples of crowdsourcing and citizen science initiatives relevant to Earth Observation.
| Data Collected | Crowdsourcing and CS Projects and Initiatives | Year Project Started, Launch Date or Earliest Date found on the Website or in Publications | Field-Based or Online Participation |
|---|---|---|---|
| Aerial imagery | Public Laboratory Balloon and Kite Mapping (http://publiclaboratory.org/tool/balloon-mapping) | 2010 | Field-based |
| Air pollution/quality, aerosols, noise pollution | CITI-SENSE (http://www.citi-sense.eu/) | 2012 | Field-based |
| Omniscientis (http://www.omniscientis.eu/) | 2012 | Field-based | |
| iSpex (http://ispex.nl/en/) | 2012 | Field-based | |
| Noise Tube (http://noisetube.net/) | 2008 | Field-based | |
| Clouds, sunspots, solar flares | The NOVA Labs: Cloud Lab and Sun Lab (http://www.pbs.org/wgbh/nova/labs) | None given | Field-based |
| Students’ Cloud Observations Online (S’COOL) (https://www.nasa.gov/content/s-cool-students-cloud-observation-online) | 1997 | Field-based | |
| SatCam (http://satcam.ssec.wisc.edu/) | 2012 | Online | |
| Environmental data | Cobweb (Citizen Observatory Web) (http://cobwebproject.eu) | 2012 | Field-based |
| Global Learning and Observations to Benefit the Environment (GLOBE) (http://globe.gov) | 1995 | Field-based | |
| FieldScope (http://education.nationalgeographic.com/education/programs/fieldscope) | 2008 | Field-based | |
| Extreme events, hurricanes, earthquakes, climate change | iSeeChange (https://www.iseechange.org/) | 2012 | Field-based |
| SkyWarn (http://www.skywarn.org/) | 1970s | Field-based and online | |
| Did You Feel It? (http://earthquake.usgs.gov/earthquakes/dyfi/) | 2007 | Field-based | |
| Flood levels and extent | WeSenseIt (http://www.wesenseit.eu/) | 2012 | Field-based and online |
| Forest fires | Mount Diablo Fire Monitoring (http://nerdsfornature.org/monitor-change/diablo.html) | 2013 | Field-based |
| Fracking | Frack Finder (http://crowd.skytruth.org/) | 2013 | Online |
| Geotagged photographs of landscapes | Field Photo Library (http://www.eomf.ou.edu/photos/) | 2013 | Field-based |
| Degree Confluence Project (http://www.confluence.org/) | 2008 | Field-based | |
| Humanitarian and crisis response, disaster mapping | Humanitarian OpenStreetMap (http://hot.openstreetmap.org/) | 2010 | Field-based and online |
| MicroMappers (http://www.micromappers.com/) | 2013 | Online | |
| International Network of Crisis Mappers (http://crisismappers.net/) | 2009 | Field-based and online | |
| Ushahidi (http://www.ushahidi.com/) | 2008 | Field-based and online | |
| TOMNOD (http://www.tomnod.com/) | 2010 | Online | |
| The Digital Humanitarian Network (http://digitalhumanitarians.com/) | 2012 | Field-based and online | |
| Land cover, land use and land change | Geo-Wiki (http://www.geo-wiki.org) | 2009 | Field-based and online |
| VIEW-IT (Clark and Aide [5]) | 2011 | Online | |
| LACO-Wiki (http://www.laco-wiki.net) | 2014 | Online | |
| LandSense Citizen Observatory (http://www.landsense.eu) | 2016 | Field-based and online | |
| GroundTruth2.0 Citizen Observatory (http://gt20.eu/) | 2016 | Field-based and online | |
| SCENT Citizen Observatory (https://scent-project.eu/) | 2016 | Field-based | |
| Light pollution | Dark Sky Meter (http://www.darkskymeter.com/) | 2013 | Field-based |
| Dark Skies ISS (http://crowdcrafting.org/app/darkskies/, http://www.citiesatnight.org/) | 2014 | Online | |
| Mapped features (buildings, roads, POIs, land cover, land use, etc.) | OpenStreetMap (http://www.openstreetmap.org) | 2006 | Field-based and online |
| Google Map Maker (http://www.google.com/mapmaker) | 2008 | Online | |
| The National Map Corps (http://nationalmap.gov/TheNationalMapCorps/) | At least 2006 | Online | |
| Wikimapia (http://wikimapia.org/) | 2006 | Online | |
| Northern lights | Aurorasaurus (http://aurorasaurus.org/) | 2014 | Field-based |
| Ocean water colour | Citclops (http://www.citclops.eu/) | 2012 | Field-based |
| Phenology | USA National Phenology Network (https://www.usanpn.org/) | 2005 | Field-based |
| Photosynthesis | Public Laboratory Infrared Camera (http://publiclaboratory.org/tool/near-infrared-camera) | 2010 | Field-based |
| Precipitation/snow depth | CoCoRaHS: Rain, Hail, Snow Network (http://cocorahs.org/) | 1998 | Field-based |
| Rainlog.org (http://rainlog.org) | 2005 | Field-based | |
| Tracking Climate in Your Backyard (http://www.priweb.org/outreach.php?page=citizenscienceed/TCYIB) | 2008 | Field-based | |
| Precipitation ID Near the Ground (PING) (http://www.nssl.noaa.gov/projects/ping/) | 2013 | Field-based | |
| Snow Tweets (http://www.snowtweets.org/) | 2011 | Field-based | |
| Radioactivity of the oceans | Our Radioactive Ocean (http://ourradioactiveocean.org/helpus.html) | 2011 | Field-based |
| Soil moisture (and land cover) | GROW citizen observatory (http://growobservatory.org/) | 2016 | Field-based |
| Tree/forest cover, deforestation, biomass | Deforestation Mapping in Canada (https://cfsnet.nfis.org/deforestation/) | No date provided | Field-based |
| Forest Watchers (http://forestwatchers.net/) | 2012 | Online | |
| Treezilla (http://treezilla.org/) | 2013 | Online | |
| Urban Forest Map (http://urbanforestmap.org) | 2010 | Online | |
| EarthWatchers (http://dfa.tigweb.org/) | 2012 | Online | |
| Water quality and biodiversity | FieldScope (http://education.nationalgeographic.com/education/programs/fieldscope) | 2008 | Field-based |
| Weather | Weather Underground (http://www.wunderground.com/) | 1995 | Field-based |
| WOW (http://wow.metoffice.gov.uk/) | 2011 | Field-based | |
| Citizen Weather Observer Program (http://www.wxqa.com/) | 1990s | Field-based |
Table 2.
Summary of applications presented in the special issue.
| Author | Theme | Place | Data Used in Paper Is Derived From | Analysis of CS Data in the Paper Is | Maturity Level | Added Value of CS | |||
|---|---|---|---|---|---|---|---|---|---|
| Citizen Science | Traditional Authoritative | Remote Sensing | Comparative RS vs. CS | Comparative Traditional vs. CS | |||||
| Albuquerque el al. [20] | Disaster | Online | ** | - | ** | - | - | * | F, C |
| Busch el al. [21] | Marine | Field-based | ** | ** | * | + | + | * | F, P, C |
| Elmore et al. [28] | Phenology | Field-based | *** | ** | + | - | * | C | |
| Heigl et al. [22] | Biodiversity | Field-based | *** | *** | ** | C | |||
| Kosmala el al. [27] | Phenology | Online | *** | ** | * | - | + | ** | P, C |
| Laso Bayas et al. [23] | Land Cover | Field-based | ** | ** | * | - | + | * | S, F, P, C |
| Molinier el al. [25] | Forestry | Field-based | *** | *** | - | - | + | * | S, P |
| Salk et al. [24] | Land Cover | Online | *** | - | ** | - | - | * | C |
| Wallace el al. [26] | Phenology | Field-based | * | - | *** | + | - | * | P |
*** high ** medium * low + applies – does not apply; S = cost savings, F = higher frequency, P = potential Cal/Val dataset, C = complements RS data or traditional in situ observations.
© 2017 by the authors. Licensee MDPI, Basel, Switzerland. This article is an open access article distributed under the terms and conditions of the Creative Commons Attribution (CC BY) license (http://creativecommons.org/licenses/by/4.0/).
Share and Cite
MDPI and ACS Style
Fritz, S.; Fonte, C.C.; See, L. The Role of Citizen Science in Earth Observation. Remote Sens. 2017, 9, 357. https://doi.org/10.3390/rs9040357
AMA Style
Fritz S, Fonte CC, See L. The Role of Citizen Science in Earth Observation. Remote Sensing. 2017; 9(4):357. https://doi.org/10.3390/rs9040357
Chicago/Turabian StyleFritz, Steffen, Cidália Costa Fonte, and Linda See. 2017. "The Role of Citizen Science in Earth Observation" Remote Sensing 9, no. 4: 357. https://doi.org/10.3390/rs9040357
Note that from the first issue of 2016, this journal uses article numbers instead of page numbers. See further details here.