
Scrubbing Up: Multi-Scale Investigation of Woody Encroachment in a Southern African Savannah
by
 , , and
Christopher G. Marston
1,* ,
,
Paul Aplin
1,
David M. Wilkinson
2,3,
Richard Field
4 and
Hannah J. O’Regan
5 1
Department of Geography, Edge Hill University, Ormskirk L39 4QP, UK
2
Natural Science and Psychology, Liverpool John Moores University, Byrom Street, Liverpool L3 3AF, UK
3
School of Life Sciences, University of Lincoln, Joseph Banks Laboratories, Green Lane, Lincoln LN6 7DL, UK
4
School of Geography, University of Nottingham, University Park, Nottingham NG7 2RD, UK
5
Department of Archaeology, University of Nottingham, University Park, Nottingham NG7 2RD, UK
*
Author to whom correspondence should be addressed.
Remote Sens. 2017, 9(5), 419; https://doi.org/10.3390/rs9050419
Submission received: 2 February 2017
/
Revised: 14 April 2017
/
Accepted: 22 April 2017
/
Published: 29 April 2017
Abstract
:Changes in the extent of woody vegetation represent a major conservation question in many savannah systems around the globe. To address the problem of the current lack of broad-scale cost-effective tools for land cover monitoring in complex savannah environments, we use a multi-scale approach to quantifying vegetation change in Kruger National Park (KNP), South Africa. We test whether medium spatial resolution satellite data (Landsat, existing back to the 1970s), which have pixel sizes larger than typical vegetation patches, can nevertheless capture the thematic detail required to detect woody encroachment in savannahs. We quantify vegetation change over a 13-year period in KNP, examine the changes that have occurred, assess the drivers of these changes, and compare appropriate remote sensing data sources for monitoring change. We generate land cover maps for three areas of southern KNP using very high resolution (VHR) and medium resolution satellite sensor imagery from February 2001 to 2014. Considerable land cover change has occurred, with large increases in shrubs replacing both trees and grassland. Examination of exclosure areas and potential environmental driver data suggests two mechanisms: elephant herbivory removing trees and at least one separate mechanism responsible for conversion of grassland to shrubs, theorised to be increasing atmospheric CO2. Thus, the combination of these mechanisms causes the novel two-directional shrub encroachment that we observe (tree loss and grassland conversion). Multi-scale comparison of classifications indicates that although spatial detail is lost when using medium resolution rather than VHR imagery for land cover classification (e.g., Landsat imagery cannot readily distinguish between tree and shrub classes, while VHR imagery can), the thematic detail contained within both VHR and medium resolution classifications is remarkably congruent. This suggests that medium resolution imagery contains sufficient thematic information for most broad-scale land cover monitoring requirements in heterogeneous savannahs, while having the benefits of being cost-free and providing a longer historical archive of data than VHR sources. We conclude that monitoring of broad-scale land cover change using remote sensing has considerable potential as a cost-effective tool for both better informing land management practitioners, and for monitoring the future landscape-scale impacts of management policies in savannahs.
1. Introduction
Savannah extends over approximately 20% of the Earth’s land surface, making it the largest terrestrial biome [1,2]. In Africa, savannahs still support extensive large mammal communities (at least within some protected areas), which are of substantial conservation interest and economic importance via their key role in tourism. They are dynamic systems, with the potential for considerable change over time, at scales that cannot be easily covered by conventional fieldwork techniques. Here we take a remote sensing approach to monitoring change, investigating spatial, temporal and thematic aspects of classification in a mixed and dynamic savannah environment in the southern part of Kruger National Park (KNP) in South Africa, over a decadal time scale.
Savannahs are characterised by the co-occurrence of a grass layer with an overstorey tree layer of variable density [2,3,4], and savannah tree cover levels strongly affect ecosystem function [4,5]. The tree–grass mix of savannahs exists in a dynamic state, with changes in the balance of these vegetation types potentially resulting in switches between alternate states of forest or grassland [6,7,8]. A range of variables are suggested as potential drivers of change in the tree-grass balance, falling broadly into local and global categories [9], with the mechanisms of change in the tree–grass balance dependent on whether the savanna is a wet or dry system [9]. One such driver is precipitation [10,11], with mean annual precipitation determining a potential maximum cover for woody plants [12,13,14,15] although this level is rarely reached due to other local and regional influences such as fire and herbivory [9]. Savannahs with mean annual precipitation levels of around 650mm or below are reasonably stable, but tend to change towards forest above this level (unless other disturbance processes allow a mix of grass and trees to be maintained) [1,14]. Other potential drivers include fire [16,17,18,19,20,21,22,23], disturbance by megaherbivores, particularly elephant (Loxodonta africana) [4,19,24,25,26,27], grazing by domestic herbivores [28], scale-dependent interactions between climate, fire and herbivory [17,29,30,31,32], and increasing CO2 fertilization [5,9,10,17,33,34,35,36,37,38,39,40,41,42,43]. The vulnerability of a region to changes in the tree-grass balance of savannas will likely depend on the prevailing land use history, the environmental setting, and the functional traits of woody plants that govern their responsiveness to both local and global drivers [12].
Within savannah environments, the relative dominance of herbs and grasses versus woody plants is important for biodiversity [4]. This impacts on the abundance and distribution of animal populations [44,45], including trophic interactions, by modulating the degree of concealment versus visibility for predators and prey [4,46,47], spatial patterns of soil fertility [32] and soil moisture via shading and evapotranspiration [48]. The tree–grass mix also has consequences for ecosystem services including carbon sequestration [49], along with regional-scale feedbacks to the Earth system due to changes in gas exchange and albedo [50]. Understanding changes in the tree–grass balance of savannah communities is therefore of wide interest, and with African savannahs coming under increasing anthropogenic pressures more emphasis is being placed on the preservation of ecologically important areas.
Woody encroachment within savannahs is recognised as a global phenomenon [5,9,50], and is of increasing concern because of its potential impacts on biodiversity and ecosystem processes [4]. Such changes have been extensive in both farmed and protected savannahs globally over the last century [50], and have knock-on effects for conservation efforts. In Africa, woody encroachment occurs across multiple land uses, and is accelerating over time [12]. Woody encroachment also has potential economic impacts for African national parks, with decreases in tourism possible if the iconic African savannah mammal species become more difficult to observe because of reduced visibility. Mega-herbivores and carnivores are especially popular with overseas and first-time visitors [51], and habitat changes increasing the difficulty of viewing these species may mean tourists are less likely to visit [50]. Most important in reduced visibility is encroachment of shrubs (rather than increases in tree cover). Therefore, the ability to monitor woody cover is fundamental to understanding savanna dynamics [13].
Monitoring woody encroachment in savannahs, especially by shrubs, is difficult due to the large areas involved and the relatively slow nature of this process occurring within a temporally dynamic environment. Therefore, to evaluate the change that is occurring, land cover monitoring is increasingly used for better informing environmental management and conservation practices. In KNP, changes to vegetation such as large tree removal by elephants, and the recently hypothesized ‘scrubbing-up’ of the Skukuza thorn thickets (dominated by acacias such as delagoa (Acacia welwitschii), knob-thorn (Acacia nigrescens), scented-pod (Acacia nilotica), umbrella (Acacia tortilis) and brack thorn (Acacia robusta), plus sickle-bush (Dichrostachys cinerea), magic guarri (Euclea divinorum) and buffalo thorn (Ziziphus mucronata)), are of particular interest, with implications for animal distributions, food resource and habitat availability for key species. Management practices within KNP take a strategic adaptive management approach which aims to maintain biodiversity and vegetation heterogeneity [13,25], and monitoring the spatio-temporal variability in woody cover is helpful for park managers when supporting management priorities relating to the maintenance of this structural and biotic heterogeneity [52]. Ground-based monitoring of complex ecosystem responses to these management actions is costly, time consuming and limited in temporal and spatial coverage [53]. Although valuable for providing localised insights, this costly activity cannot monitor changes at a regional scale, nor be extended back in time beyond the start of the monitoring. There is currently a need for a cost-effective mechanism to monitor landscape change, to better understand past changes, and inform future land management practices. Remote sensing offers a valuable, efficient tool for vegetation monitoring at broad geographical scales, which is complementary to ground-based monitoring [53]. In particular, if freely available satellite imagery such as the Landsat archive, which dates back to the 1970s, can be used for this purpose, then there are great potential benefits.
Savannahs are often highly heterogeneous habitats [54], with mosaics of tree, shrub and grassland patches occurring at various levels of spatial complexity, which, along with the spectral similarity of compositionally different vegetation types, makes land cover classification of these areas challenging [55,56]. Very high resolution (VHR) satellite imagery and airborne photographic and LiDAR (light detection and ranging) surveys can identify and discriminate between features such as individual trees (e.g., [26]), large shrubs and patches of grassland. However, they typically have high data collection and subsequent processing costs when applied over large areas, preventing their use by many land managers. Also, VHR and aerial datasets almost always have limited historical data coverage, creating difficulties in studying historical landscape changes over relatively long time-periods. In the case of multispectral satellite data, VHR imagery has been available for a much shorter time period than medium resolution imagery, with IKONOS, the first commercially available VHR satellite, only launched in 1999 [57].
Medium spatial resolution imagery, such as from Landsat Operational Land Imager (OLI) or Sentinel-2, although of lower spatial and thematic detail than VHR imagery, is available cost-free and is well established for broad-scale land cover monitoring. Landsat has an extensive imagery archive dating back to 1972, enabling assessment of longer-term landscape change over greater spatial extents, than VHR imagery. However, although it offers improved spatial detail over coarse resolution datasets, the capability of medium-resolution imagery to discriminate small habitat patches is much lower than VHR imagery, typically because pixels are mixed, constituting multiple land cover types. Previous studies have also successfully mapped woody cover in the KNP using a combination of Landsat ETM+ optical and JERS-1 L-band synthetic aperture radar data [13,52], and applied data fusion techniques using Landsat TM and LiDAR imagery to estimate sub-pixel Juniper cover [58]. The latter study noted that the LiDAR and Landsat TM-LiDAR fused datasets generated stronger correlations between remote sensing derived and field measurements than was achieved using Landsat TM data alone. It is, therefore, important to quantitatively compare the capabilities of differing spatial resolution data sources in monitoring changes in savannahs, and establish whether medium-resolution imagery (particularly Landsat OLI) can provide useful information on phenomena that reflect the aggregation of patches smaller than the pixels, such as woody encroachment. If so, then cost-effective monitoring of land cover change via freely available medium-resolution imagery could become standard practice for informing land management decisions in many parts of the world.
Vegetation in African savannahs exhibits highly seasonal trends in growth and senescence, with huge contrasts in vegetation states during wet and dry seasons [55]. These trends are principally driven by water availability, however phenological patterns can differ for woody and herbaceous vegetation. For example, whereas herbaceous plants are generally only green during the rainy season with senescence occurring shortly afterwards, most woody plants remain photosynthetically active over large parts of the year [59]. The deeper root systems of trees and shrubs enables access to soil moisture at greater depths below ground, where moisture is more consistently available and seasonal fluctuations are dampened [60]. Outside of the wet season, herbaceous vegetation will wilt and die, and remain photosynthetically inactive until new germination with the onset of the rainy season [59]. Several studies investigating savanna change have used coarse resolution time-series satellite imagery such as from Moderate Resolution Imaging Spectroradiometer (MODIS), Advanced Very High Resolution Radiometer (AVHRR) and SPOT-Vegetation (VGT) to characterize woody and herbaceous vegetation based on these differing phenological characteristics [53,59,60,61,62,63,64]. These methods are typically based on the differences in the phenophases of woody vegetation compared to that of herbaceous plants. For example [59], illustrated that in the Sahel, annual herbaceous plants are green during the rainy season from June to October, with senescence occurring after flowering in September towards the last rain events of the season. Conversely, the leafing of most trees and shrubs is longer with many woody species greening-up ahead of the rains in the last month of the dry season. By using a time series of Absorbed Photosynthetically Active Radiation (FAPAR) from MODIS and SPOT-VGT, a series of phenological metrics were generated which were in turn used to model the total canopy of woody plants. Although these methods have successfully used dry season green foliage density as a proxy for woody cover [61], these datasets are ultimately limited in the level of spatial detail that they can provide due to the coarse imagery resolution (typically 250 m–1 km).
To monitor woody cover at a higher level of spatial detail via satellite remote sensing, medium or VHR imagery is required. However, image acquisition opportunities are often more limited due to satellite repeat cycle (16 days for Landsat) and cloud cover. This can limit analysis to using a single-date image, with timing of this image acquisition influential in its ability to discriminate between woody and herbaceous vegetation at different times of year. The wet season represents the peak of the growing season, with well-developed vegetation conditions and high photosynthesis rates in leaf-on conditions potentially confusing the spectral differences between vegetation types [55]. Dry season imagery, in contrast, is more often cloud-free, and as previously been used for studies of woody cover change to maximize discrimination of woody vegetation which is still photosynthetically active, from the herbaceous vegetation which is dormant [52,55,61].
While phenology-based studies have successfully estimated woody plant cover, here we utilize an alternative approach using medium resolution and VHR imagery to monitor woody cover and woody cover change at a higher level of spatial detail. Our methods also look not just to discriminate between woody and herbaceous material, but also to separate the woody classes of tree and shrub. We assess land cover change in the Skukuza area of KNP from February 2001 to 2014, using a combination of medium-resolution (Landsat Enhanced Thematic Mapper ETM+ and OLI) and VHR (QuickBird, IKONOS and WorldView-2) imagery, coupled with field survey data. VHR imagery has the potential to provide better spatiotemporal sampling of the complex vegetation structure in the KNP to improve upscaling of remote sensing models [13], and here we use multi-scale observation of the landscape to examine vegetation change with a particular focus on grassland and woodland mosaic areas and the theorised woody and shrub encroachment. We address three specific research questions: (1) How has land cover in southern KNP changed over the last decade, and can shrub encroachment be observed? (2) What are the drivers of the observed changes? (3) What thematic information is lost when using medium rather than high spatial resolution imagery for land cover classification as a monitoring tool? Our research findings are likely to contribute towards the ongoing savannah woody encroachment debate (e.g., [4,65,66]), while our multi-scale comparison of land cover change data, derived from both medium-resolution and VHR imagery, will be of value for identifying appropriate cost-effective datasets for development of woody encroachment monitoring protocols. We conduct a detailed thematic inter-comparison between medium resolution and VHR imagery, showing how the necessarily different thematic classes relate across varying spatial scales.
2. Materials and Methods
2.1. Study Area
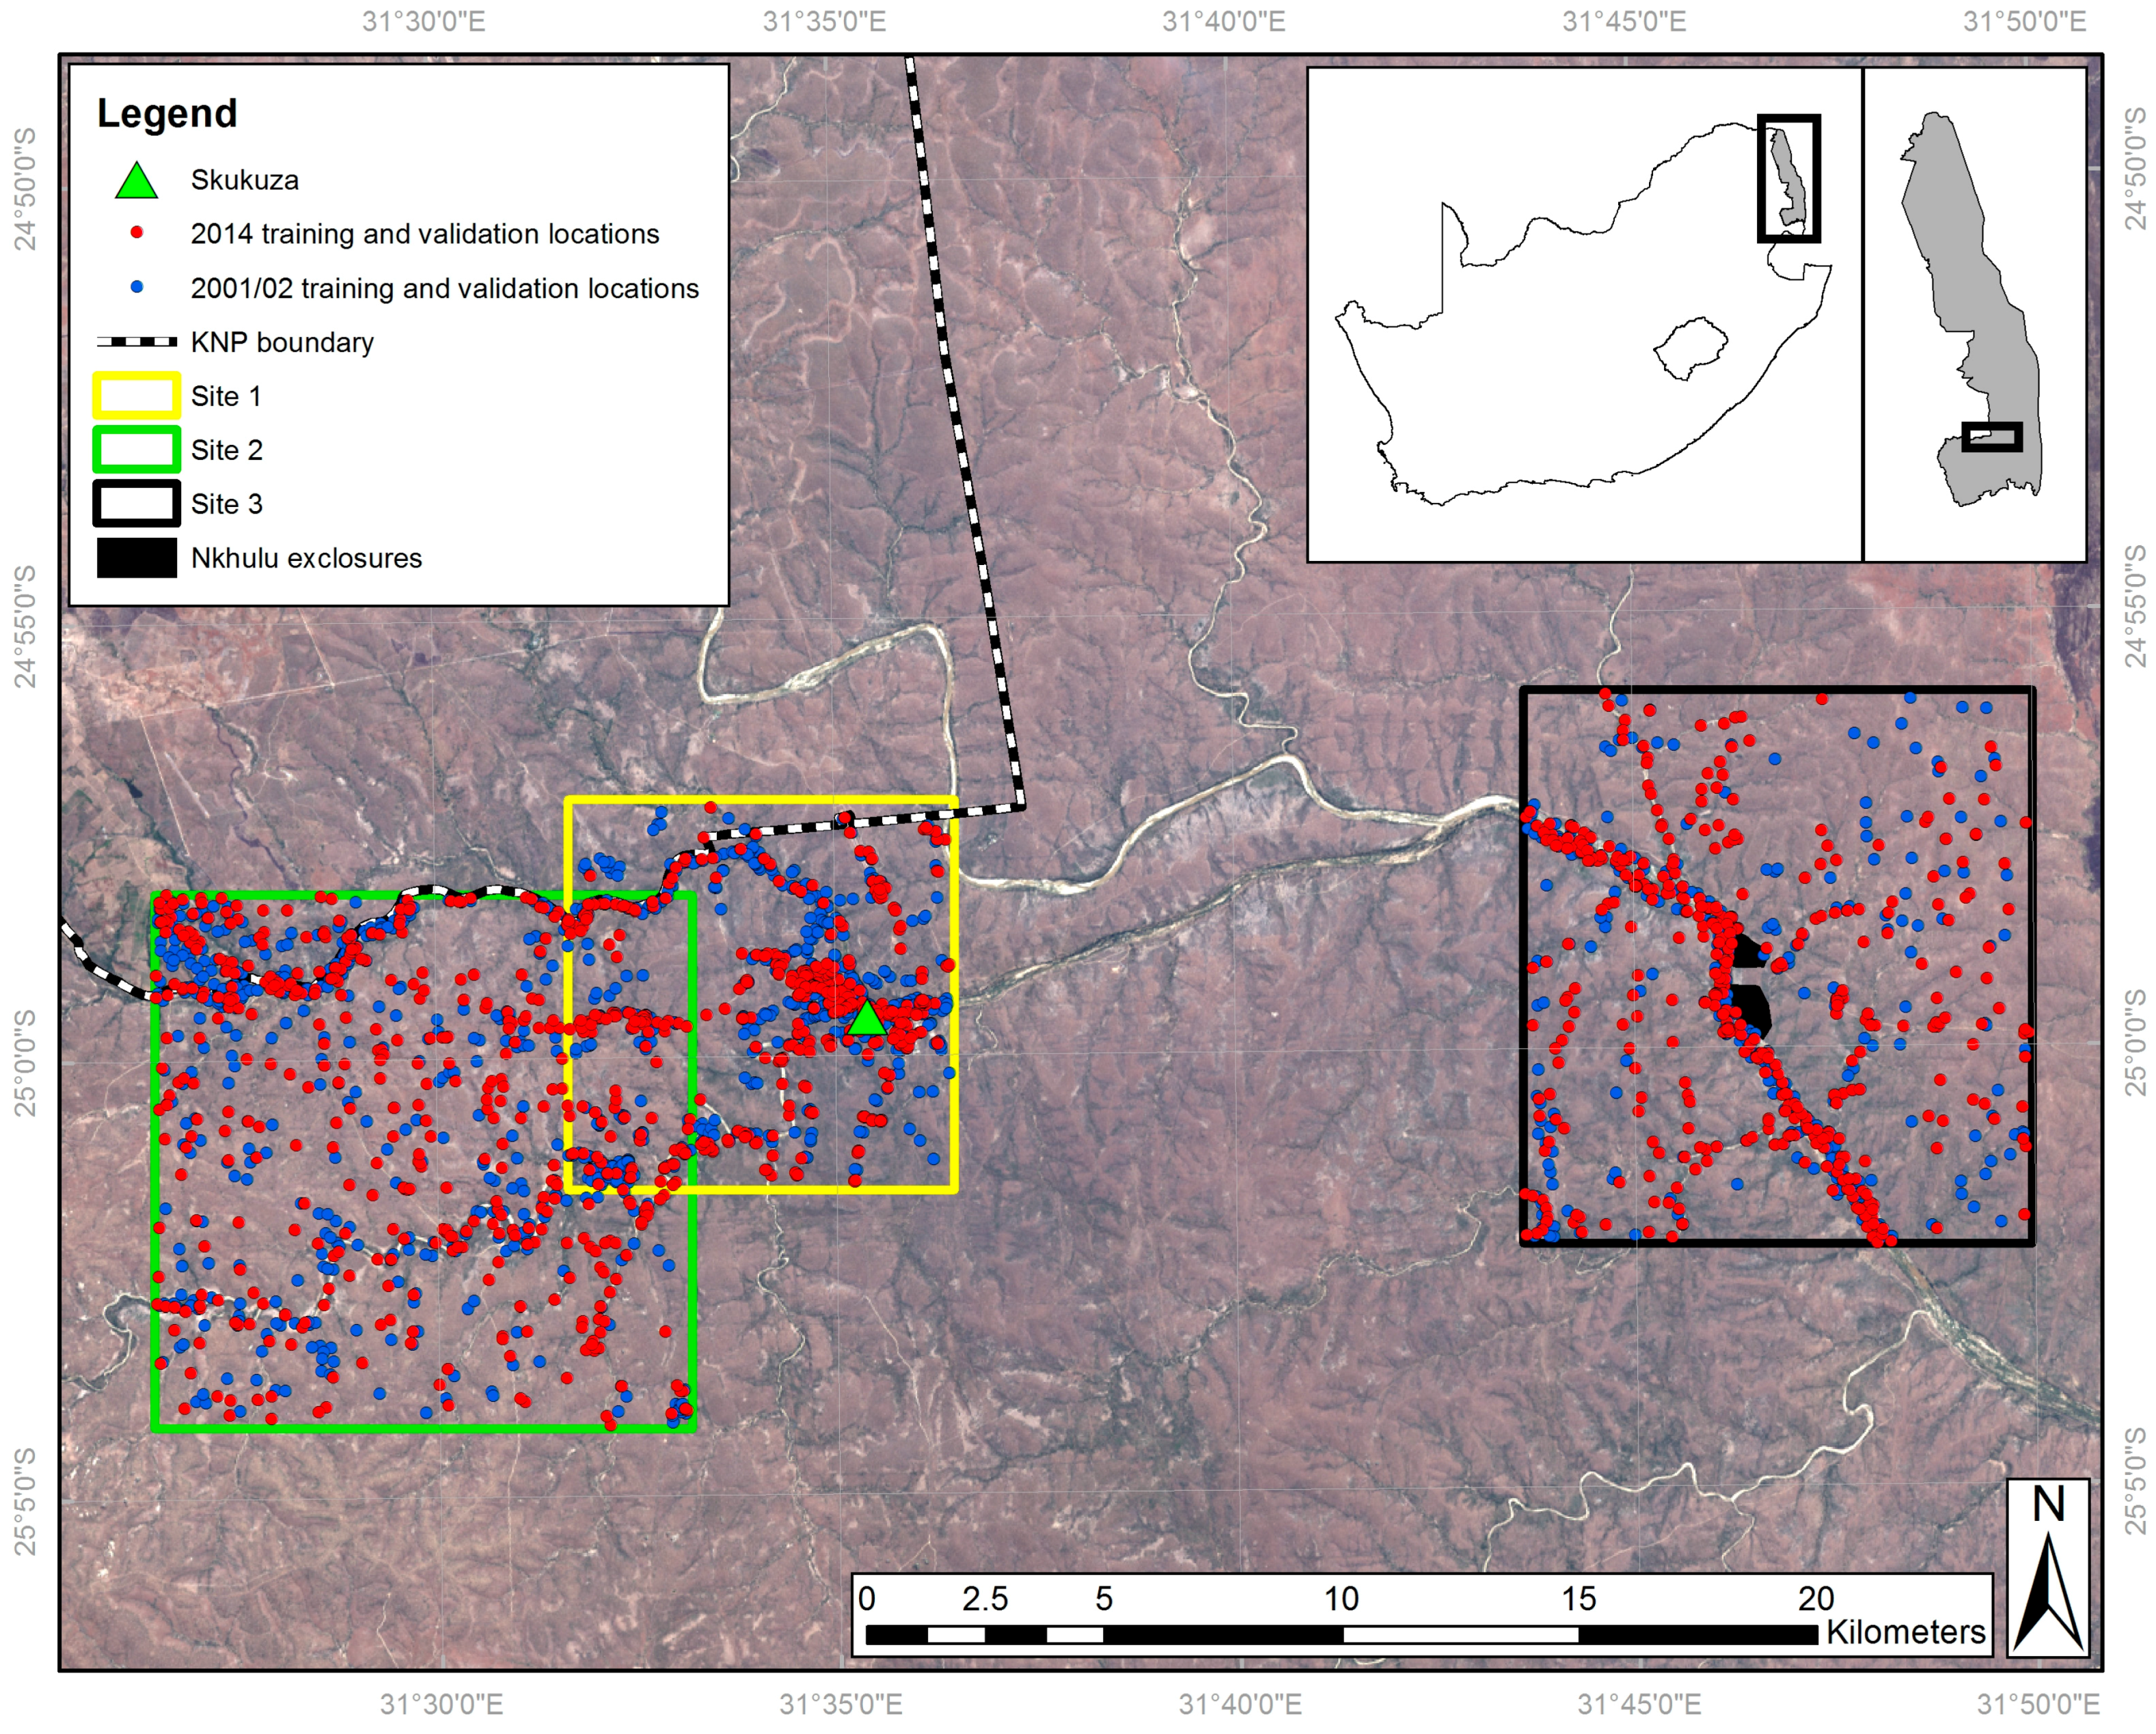
Kruger National Park (KNP) is a globally important site in terms of its diverse ecology and the application of advanced environmental management techniques. Covering 20,000 km2, KNP was declared a National Park in 1926. It has at least 147 mammal and 1980 plant species [67], and is a globally significant site for studying the role of heterogeneity in ecosystems [68]. KNP has also been shown to have experienced a trebling of woody cover over a 60 years period [5]). Three study sites were used, located in the Skukuza region of southern KNP, and one of these includes the Nkhulu exclosure (Figure 1). This exclosure was established in 2002 [26], and designed to exclude mammalian herbivores: part of the exclosure excludes all herbivores larger than hares while the remainder excludes only elephants (Loxodonta africana) and giraffes (Giraffa camelopardalis). Therefore, this exclosure offers a controlled area over an equivalent timescale to the image acquisition periods enabling assessment of the impact of large herbivores, especially elephants, on vegetation. Skukuza has an underlying granite geology and with an average annual rainfall of 572 mm, is considered to be ‘dry’ savannah [1], below the 650 mm precipitation threshold suggested as being important for savannah transition [14].
2.2. Land Cover Field Survey
Field surveys were conducted in November 2002 and July 2014. A total of 285 points were surveyed during the 2002 fieldwork, with 188 surveyed in 2014 including revisits to 66 of the 2002 points. These points were selected to be representative of the range of vegetation types, eco-zones and land cover types across the study areas. The location of each point was recorded using a GPS, with cardinal photographs (north, east, south, west) taken from the survey point. A land cover class was also assigned, with woody canopy cover estimated visually. Site descriptions and other surrounding land cover patches of interest were also noted, including compass bearings to the patches in question, enabling further reference points to be identified within the satellite imagery.
2.3. Classification Nomenclature
Separate classification nomenclatures were employed for the VHR and medium spatial resolution imagery (details below) due to their respective abilities to discriminate particular land cover features (Table 1). For example, individual trees and grass patches are identifiable in VHR imagery; however the same location observed using medium resolution imagery would often constitute a mixed pixel. Therefore, while separate tree and grass classes were appropriate for the VHR classifications, alternative class labels representing the gradient from woody to herbaceous vegetation were used for the medium resolution classification nomenclature. These are closed woodland (canopy cover >75%), open woodland (50–75% canopy cover), discontinuous grassland (25–50% canopy cover) and continuous grassland (<25% canopy cover), where the canopy may be trees or shrubs (not distinguishable at medium resolution) and ‘grassland’ includes all herbaceous vegetation. This best represented the mixed pixels resulting from the sub-pixel habitat heterogeneity present at the study sites. The classification nomenclatures employed were based on a modified version of the Global Land Cover 2000 Land Cover Map of Africa classification system [69]. It also follows a previous approach which stratifies the woody-herbaceous gradient into five woodland to grassland categories at 25% intervals, with the final interval being grassland with 0–5% woody canopy cover [3], although here this 0–5% woody cover class is merged within a 0–25% canopy cover class. The VHR tree and shrub classes were separated in the field on the basis of their trunk being >7 cm diameter (tree) or <7 cm (shrub) [70], with examples shown in Figure 2.
2.4. Image Analysis
Dry season VHR and medium spatial resolution images were acquired (Table 2), with the WorldView-2 image resampled to 2.8 m resolution for consistency with the earlier QuickBird imagery for site 1. Dry season images have previously been used for studies of woody cover change [52,61] to maximize discrimination of woody vegetation, which is still photosynthetically active, from the senescent herbaceous vegetation which is dormant [13,52,59] (see also Figure 2). This is also consistent with field data collection, which was conducted during the dry season.
Image pre-processing steps included cloud and cloud shadow masking and image geometric correction. Cloud was present only in the 2002 site 1 and 2 images, with band thresholding used to delineate cloud-covered areas. A cloud shadow mask was created through replication of the cloud mask, and application of a geographical offset to this mask to cover areas of cloud shadow. Any areas of cloud or cloud shadow not captured in these masks were digitized manually. These masks were then merged to create a combined cloud and cloud shadow mask to enable exclusion of these areas from further analysis. Landsat ETM+ and OLI images (path 168, row 77) were acquired from the EarthExplorer data access portal as atmospherically corrected surface reflectance products. Areas of no data, cloud, cloud shadow and burn scar were excluded from further study prior to land cover change analysis.
The highly heterogeneous nature of the study area, and scarcity of suitable spectrally pure training areas made supervised land cover classification approaches challenging. Instead, we adopted an unsupervised approach, where image pixels were grouped into spectrally similar classes, with these classes then assigned a land cover class based on the reference data. For both the VHR and medium resolution imagery, land cover maps were generated using 150 unsupervised classes using the ISODATA technique [71], with subsequent grouping and labelling of classes, post-classification refinement and accuracy assessment. Unsupervised classification methods are well established for land cover mapping applications [72,73], and this large number of classes was used to minimise the problem of split land cover class spectral clusters [74]. Indeed, many-class unsupervised classification followed by land cover class grouping has been demonstrated as effective for mapping semi-natural environments [75,76].
Reference locations of known land cover types were used for assigning specific land cover class labels and accuracy assessment respectively. These data were generated from four sources; (1) field-collected land cover survey locations; (2) reference locations derived from field photos; (3) reference locations derived from Google Street View imagery (2014 images only); and (4) expert knowledge and direct interpretation of reference locations of obvious VHR imagery features (for example, water). For each land cover class, these data points were then allocated on an alternating basis as reference training or validation locations, creating two equal sized reference training and validation datasets with, for each location, land cover class labels for both medium and VHR classification nomenclatures (Table 1) assigned. At the study sites visited, the shrub class consisted of species such as Acacia spp. and Albizia cf. petersiana. while the larger trees included Sclerocarya birrea, Combretum apiculatum subsp apiculatum, Diospyrus mespiliformis, Terminalia sericea and Philenoptera violacea.
The reference training locations were used to generate reference polygons where spectral homogeneity allowed. Each of the 150 unsupervised spectral classes were examined in relation to the pixels contained within the reference polygons, with the land cover class comprising the majority of pixels being assigned to that unsupervised class. On occasions, where no reference pixels corresponded to an unsupervised class, visual assessment and expert knowledge were used to assign a land cover class to the unsupervised class in question. For areas of obvious error in the classifications, manual knowledge-based refinements were performed post-classification to split these classes into single-category sub-classes [72], with subsequent re-labelling of misclassified land cover patches. The labelled unsupervised classes (150 classes plus those split during post-classification refinement) were then aggregated until a single merged class existed for each land cover class [77]. Accuracy assessment for each land cover classification was conducted using the reference validation data. Summary results are presented in Table 2, with error matrices contained in the supplementary information. Error tolerances associated with probability estimates of overall classification accuracies were also calculated [78] and are presented in the supplementary information.
To determine the level of land cover change between February 2001 and 2014, the total area of each land cover class was calculated for both the VHR and medium resolution imagery. Then, the change in areal coverage (as a percentage change of the respective study site total area–excluding areas of cloud, shadow and burn scar) was calculated for each individual site, and for all sites combined. Sites 1 and 2 contained some overlap, so when calculating combined values for all three sites, the site 2 classification was used in the overlap area as this was least cloud affected. An additional land cover change analysis was conducted specifically for the Nkhulu exclosure within site 3.
2.5. Multi-Scale Comparison
To assess the degree of thematic information lost when using medium resolution rather than VHR imagery for land cover monitoring, the thematic consistency between medium and VHR classifications was determined. A randomly selected sample of 100 pixels was selected for each of the four medium resolution woodland/grassland classes (closed woodland, open woodland, discontinuous grassland, continuous grassland). Then, within these medium resolution pixel samples, class distributions of the classified VHR pixels falling within the footprints of medium resolution pixels were calculated. This analysis was used to indicate the proportional composition of VHR classes within each of the medium resolution woodland/grassland classes.
2.6. Environmental Drivers of Land Cover Change
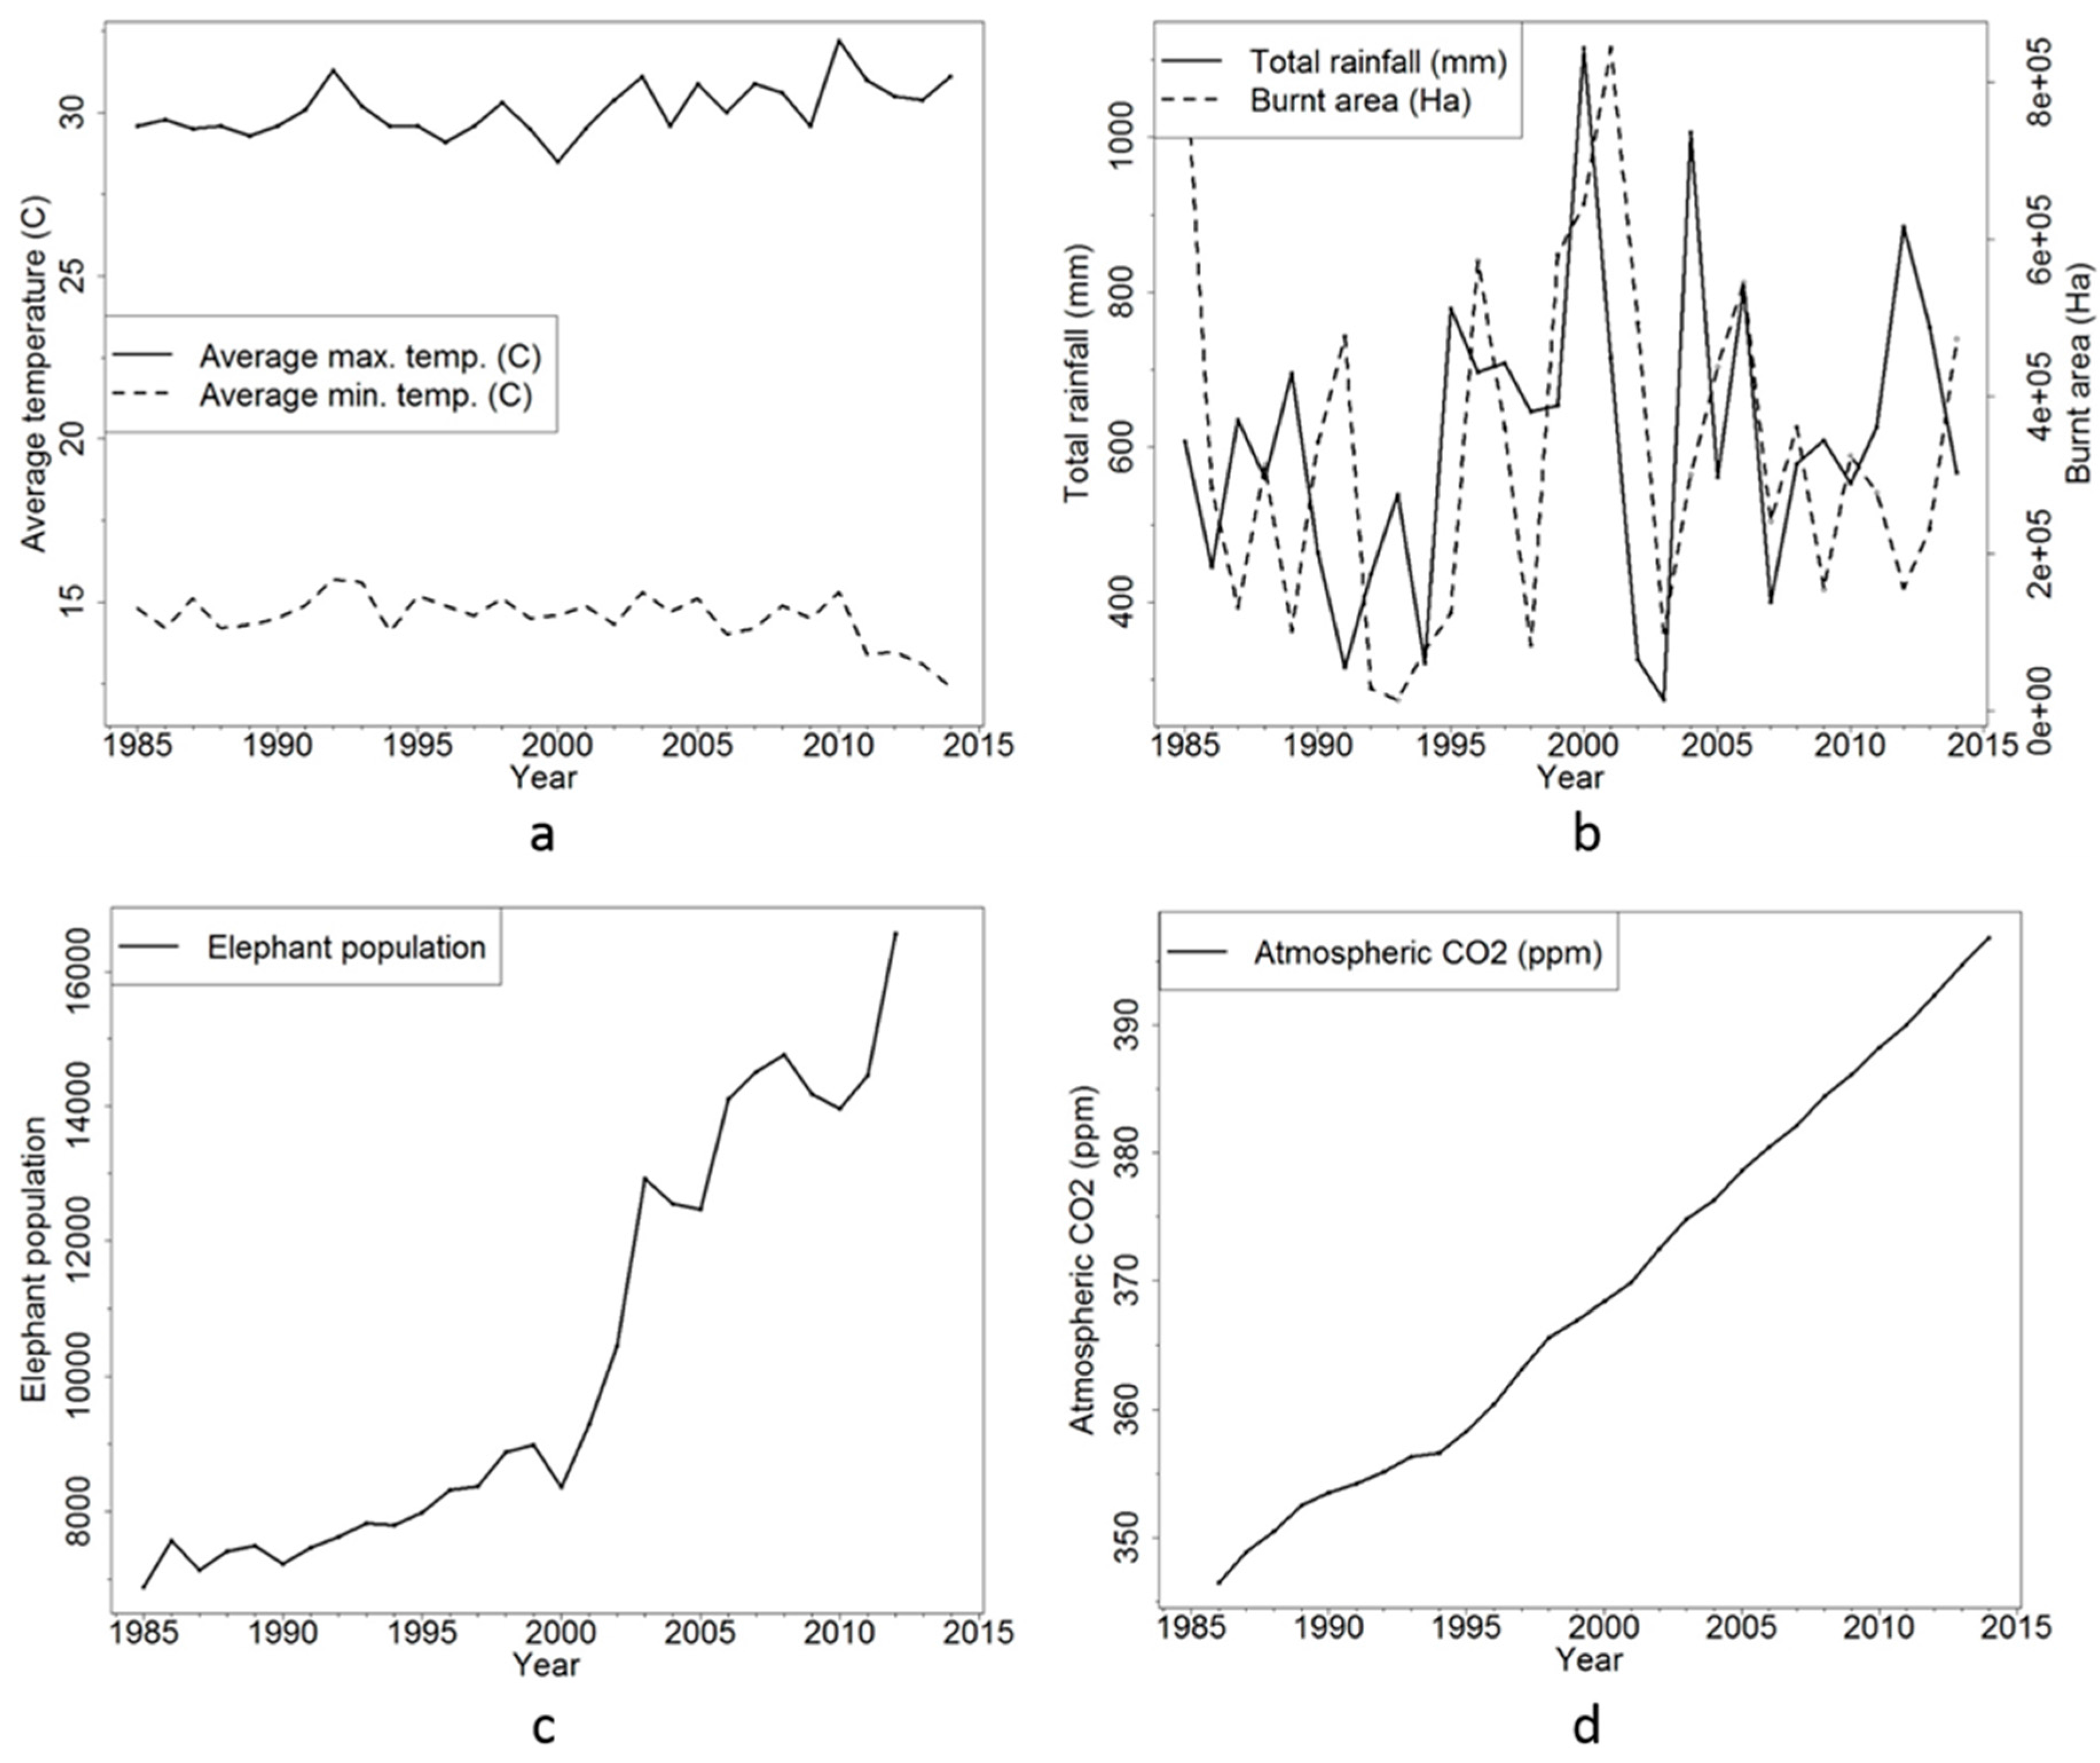
To explore the causes of land cover change, we used data relating to a series of hypothesised drivers of change. These included annual average maximum and minimum temperatures and total rainfall at Skukuza (1985–2014); total burnt area per year (1985–2014); and total elephant population (1985–2012) for the full KNP. These datasets have been kindly provided by South African National Parks Scientific Services. Also, mean annual atmospheric CO2 records were acquired from the National Oceanic and Atmospheric Administration (NOAA) Earth System Research Laboratory sampling site on Mahe Island, Seychelles (1986–2014) [79], which is the nearest sampling site to our study areas with continual records for the time period of interest. These data sets are compared to the classification results as an indication of their respective potential influence on the observed land cover change patterns.
3. Results
3.1. Land Cover Change
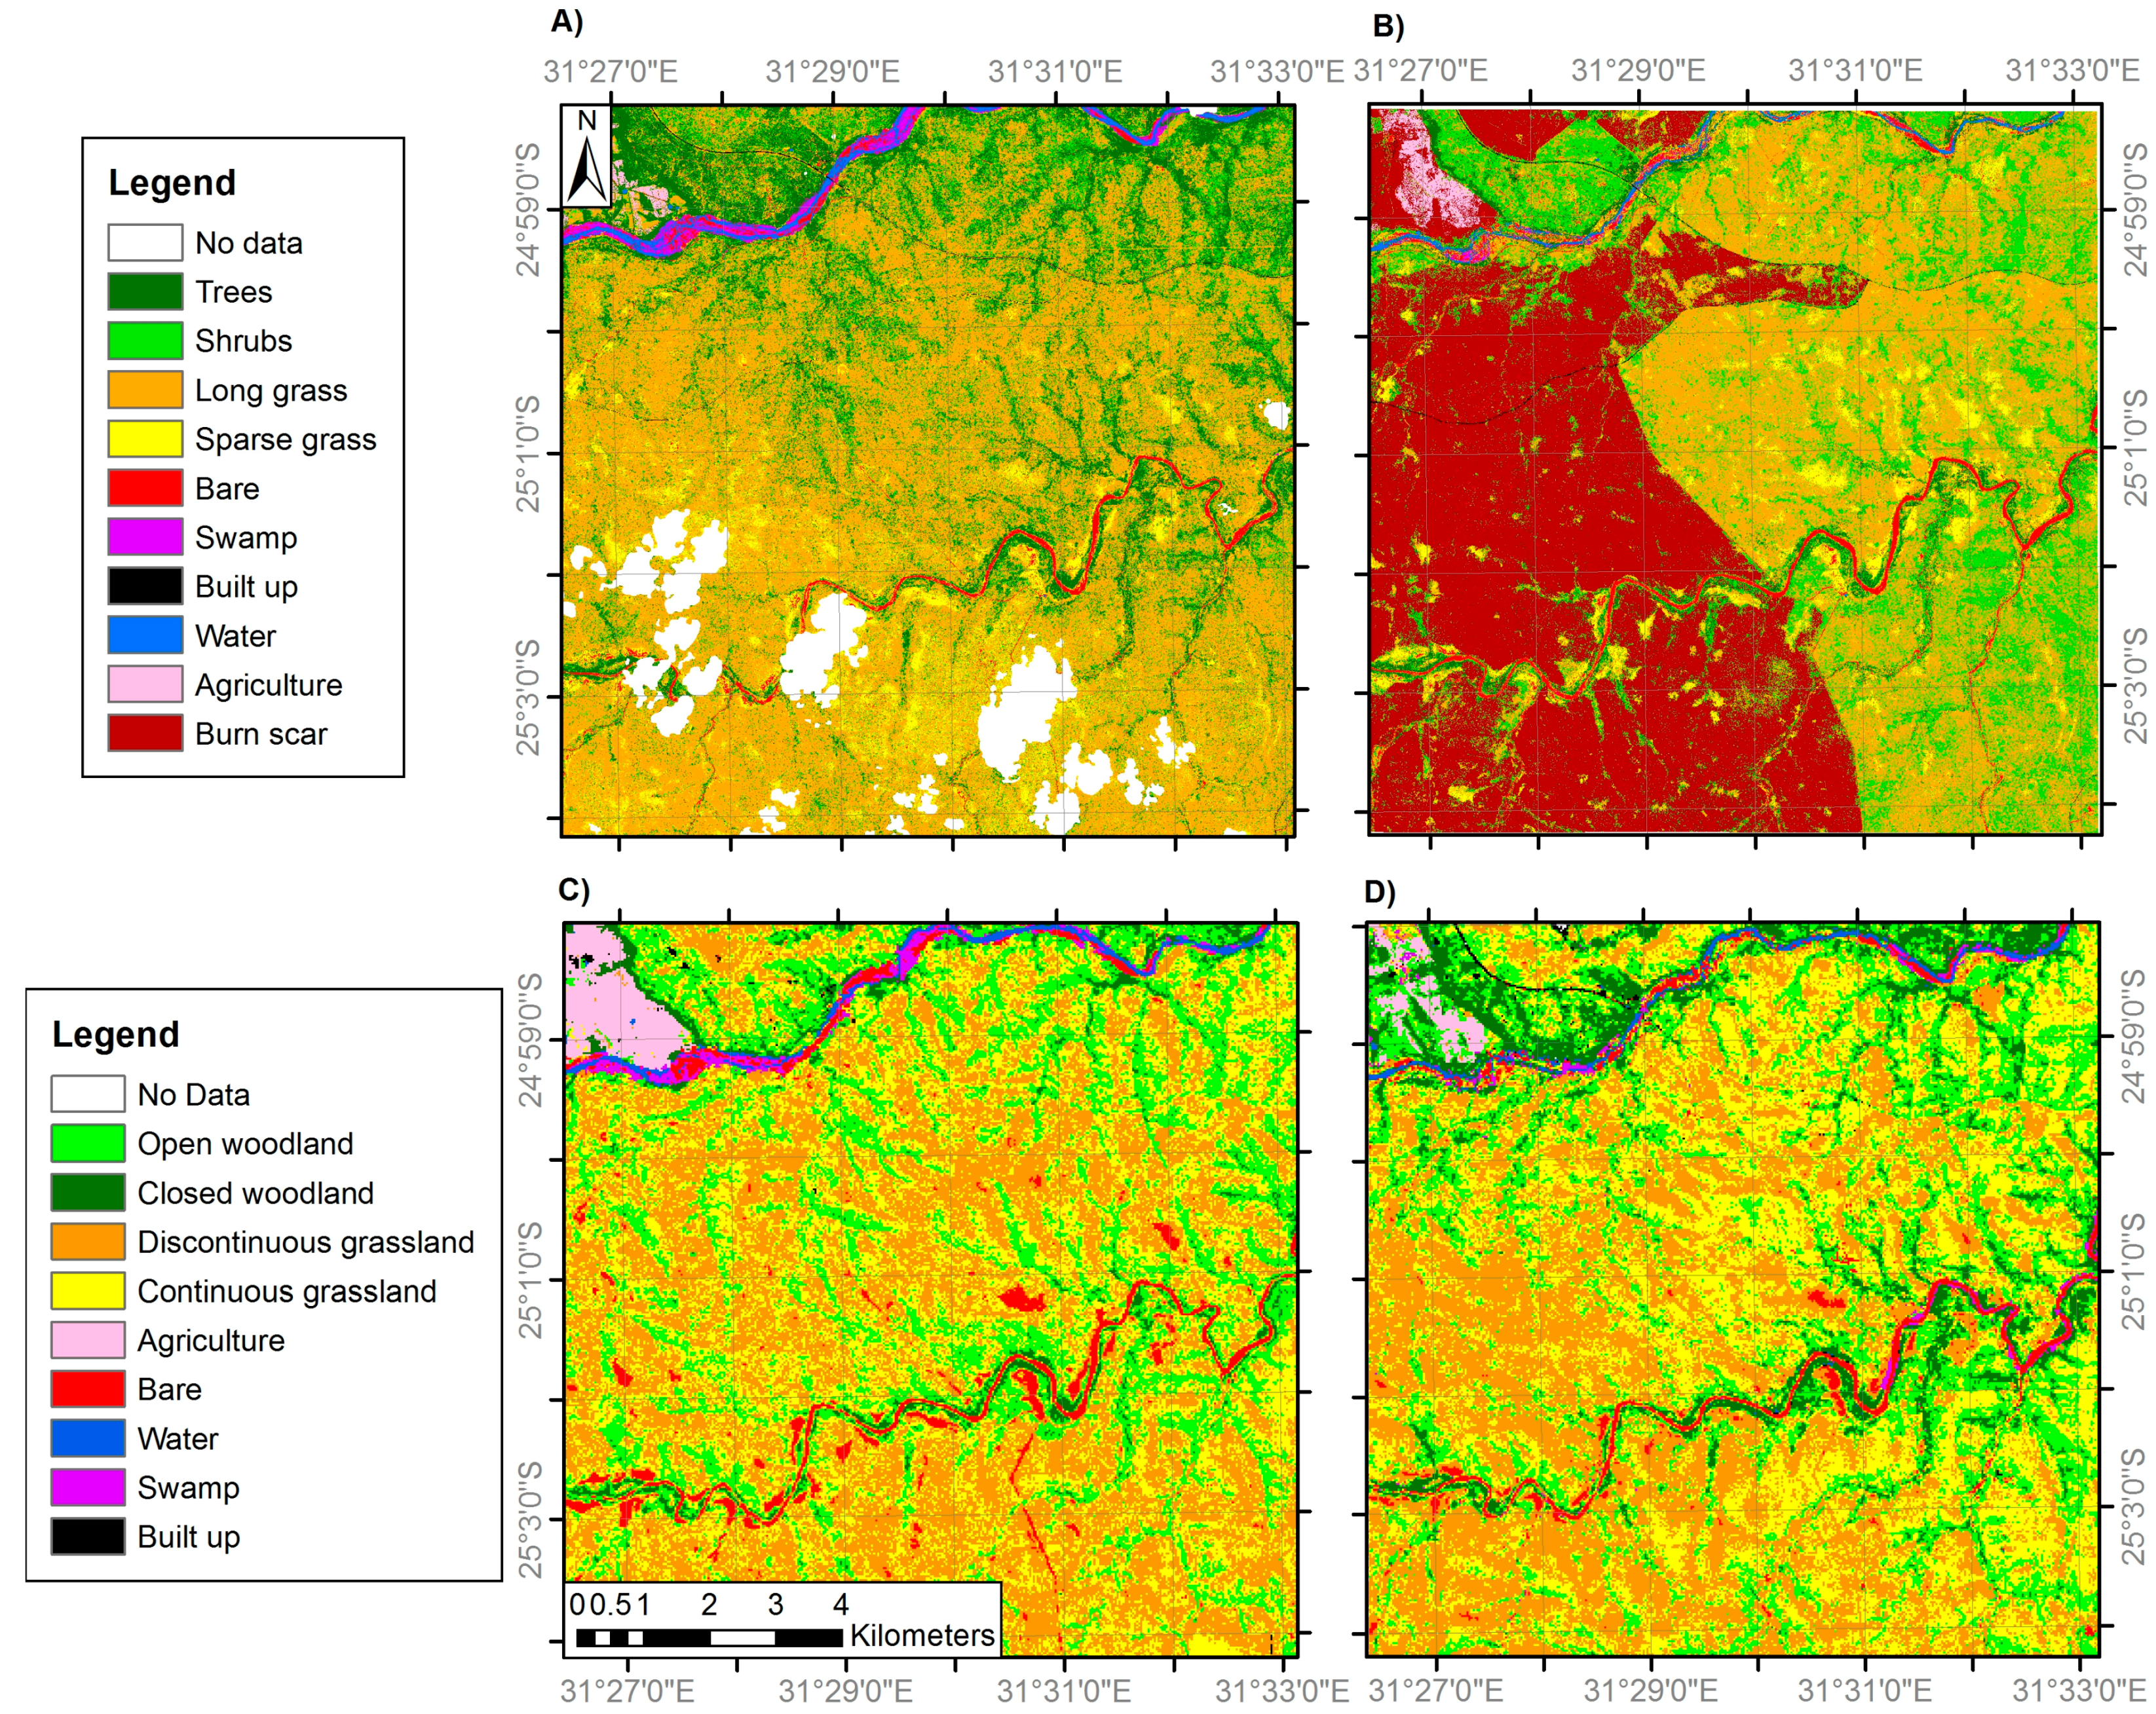
The land cover classifications generated for the three study areas (both VHR and medium resolution images for February 2001 and 2014 respectively) are presented in Figure 3, Figure 4 and Figure 5, with accuracy values are presented in Table 2. Land cover change between February 2001 and 2014 was calculated separately for the VHR (Table 3) and medium resolution classifications (Table 4).
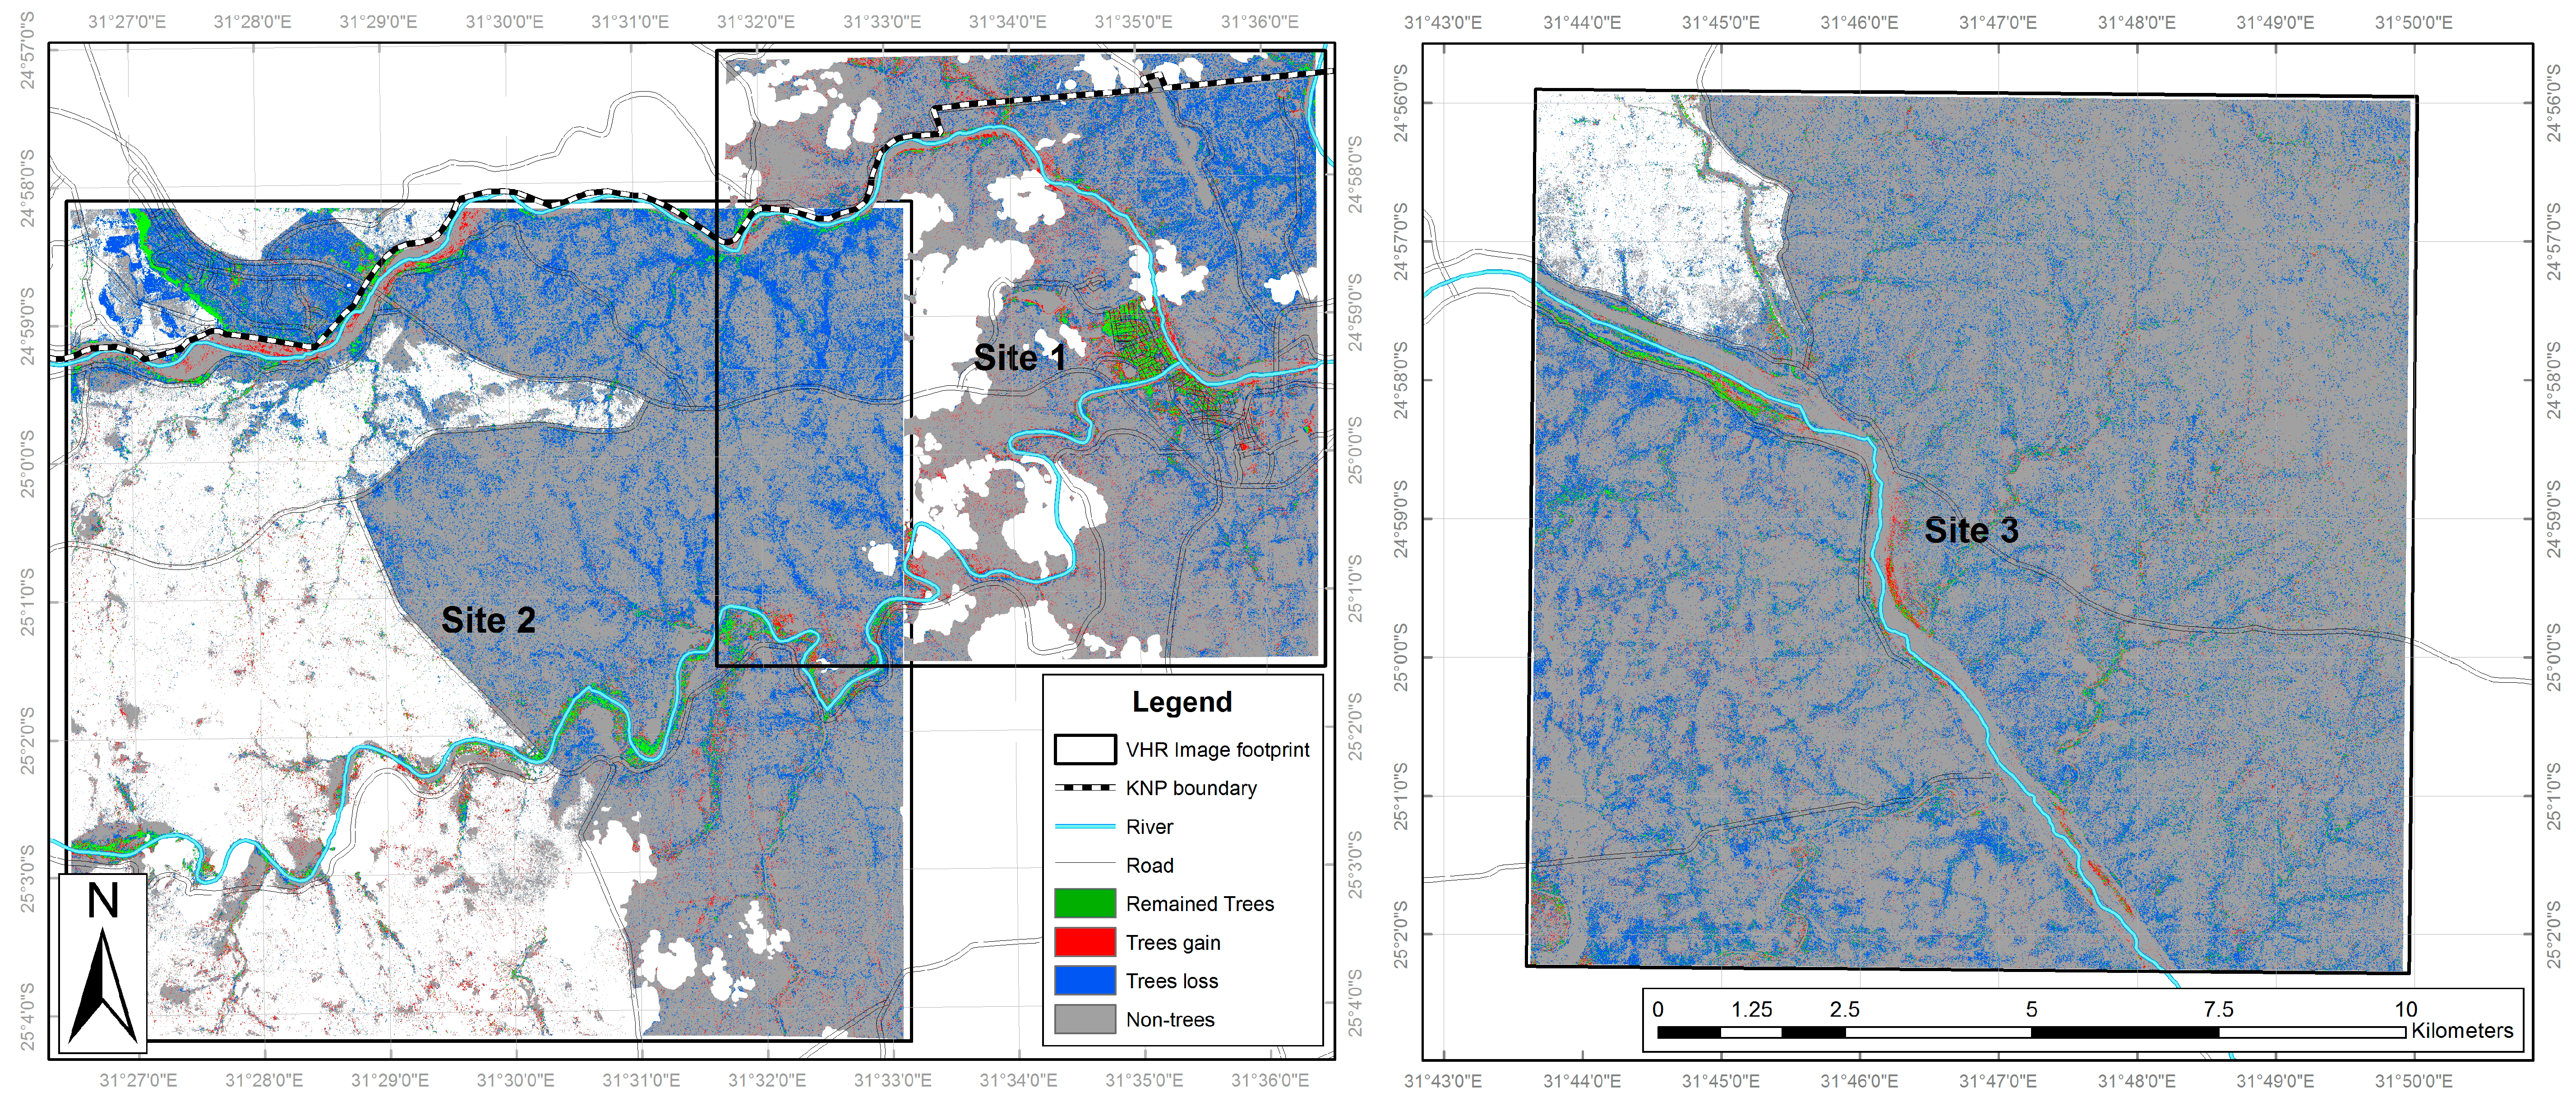
According to the VHR classifications the most common land cover class in February 2001 across all three sites was long grass (12,738.1 ha), followed by trees (4421.8 ha) and shrubs (4029.7 ha) (Table 3). In 2014, long grass was again commonest (11,556.8 ha) but by a much smaller margin, while the shrubs area had doubled (to 8222.7 ha) and that of trees reduced by more than two thirds (to 1299.3 ha). All other land cover types exhibited much lower coverage levels, with the agriculture at site 2 corresponding to an area where the imagery extended beyond the KNP boundary. Clear patterns in land cover change emerge, with shrubs consistently experiencing large and geographically widespread increases across all sites (increasing by 18.1% of the full study area; Table 3, See also Figure 6). This is coupled with a general decrease in long grass (−5.1%) and a widespread reduction in trees of −13.5% (Figure 7), indicating that the shrub increase is coming from two sources: replacement of trees by shrubs and conversion of grass to shrubs. All other land cover classes exhibited lower levels of change, with further details relating to the directions and level of the various land cover changes observed in the VHR classifications are available in supplementary information (Table S9).
According to the medium resolution classifications, the commonest land cover classes in 2002 across all three sites were discontinuous grassland (11,106.5 ha), continuous grassland (8720.6 ha) and open woodland (7820.4 ha), with much lower coverage of the other land cover classes (Table 4). The same classes were the three most common in 2014, but the grassland classes had reduced in coverage and the two ‘woodland’ categories (i.e., that represent shrubs, and also trees) had increased–the fourfold increase in ‘closed woodland’ being by far the larger of the two. The other land cover classes all experienced smaller scale changes (Table 4). This is consistent with the general increase in shrub cover observed in the VHR classifications, though as described above this medium resolution classification does not explicitly distinguish between trees and shrubs. Further details relating to the directions and level of the various land cover changes observed in the medium resolution classifications are available in supplementary information (Table S10).
3.2. Nkhulu Exclosure Area
To examine elephant herbivory impacts, land cover change both within and outside the Nkhulu exclosure was examined using the VHR imagery. The results are clear. Land cover change within the exclosure differs strongly from that outside the exclosure where grazing is unrestricted (Table 5). While outside the exclosure trees decreased by more than two thirds between 2001 and 2014 (from 1839.7 to 465.4 ha), within the exclosure tree cover actually increased (from 21.6 to 24.8 ha). Shrub encroachment occurred both within and outside the exclosure, with the area covered by shrubs trebling within the exclosure, a slightly greater proportional increase than outside; while the area covered by grass nearly halved, a much larger reduction than outside. It should be noted that South African National Parks Scientific Services retain annual records of the spatial extent of fires and burnt areas within KNP (see further discussion of fire as a potential driver of land cover change below). Importantly, in the case of the Nkhulu exclosure, these records confirm that there have been no fires in the exclosure area between 2000 and 2014, the time-period of interest in this study.
3.3. Multi-Scale Comparison
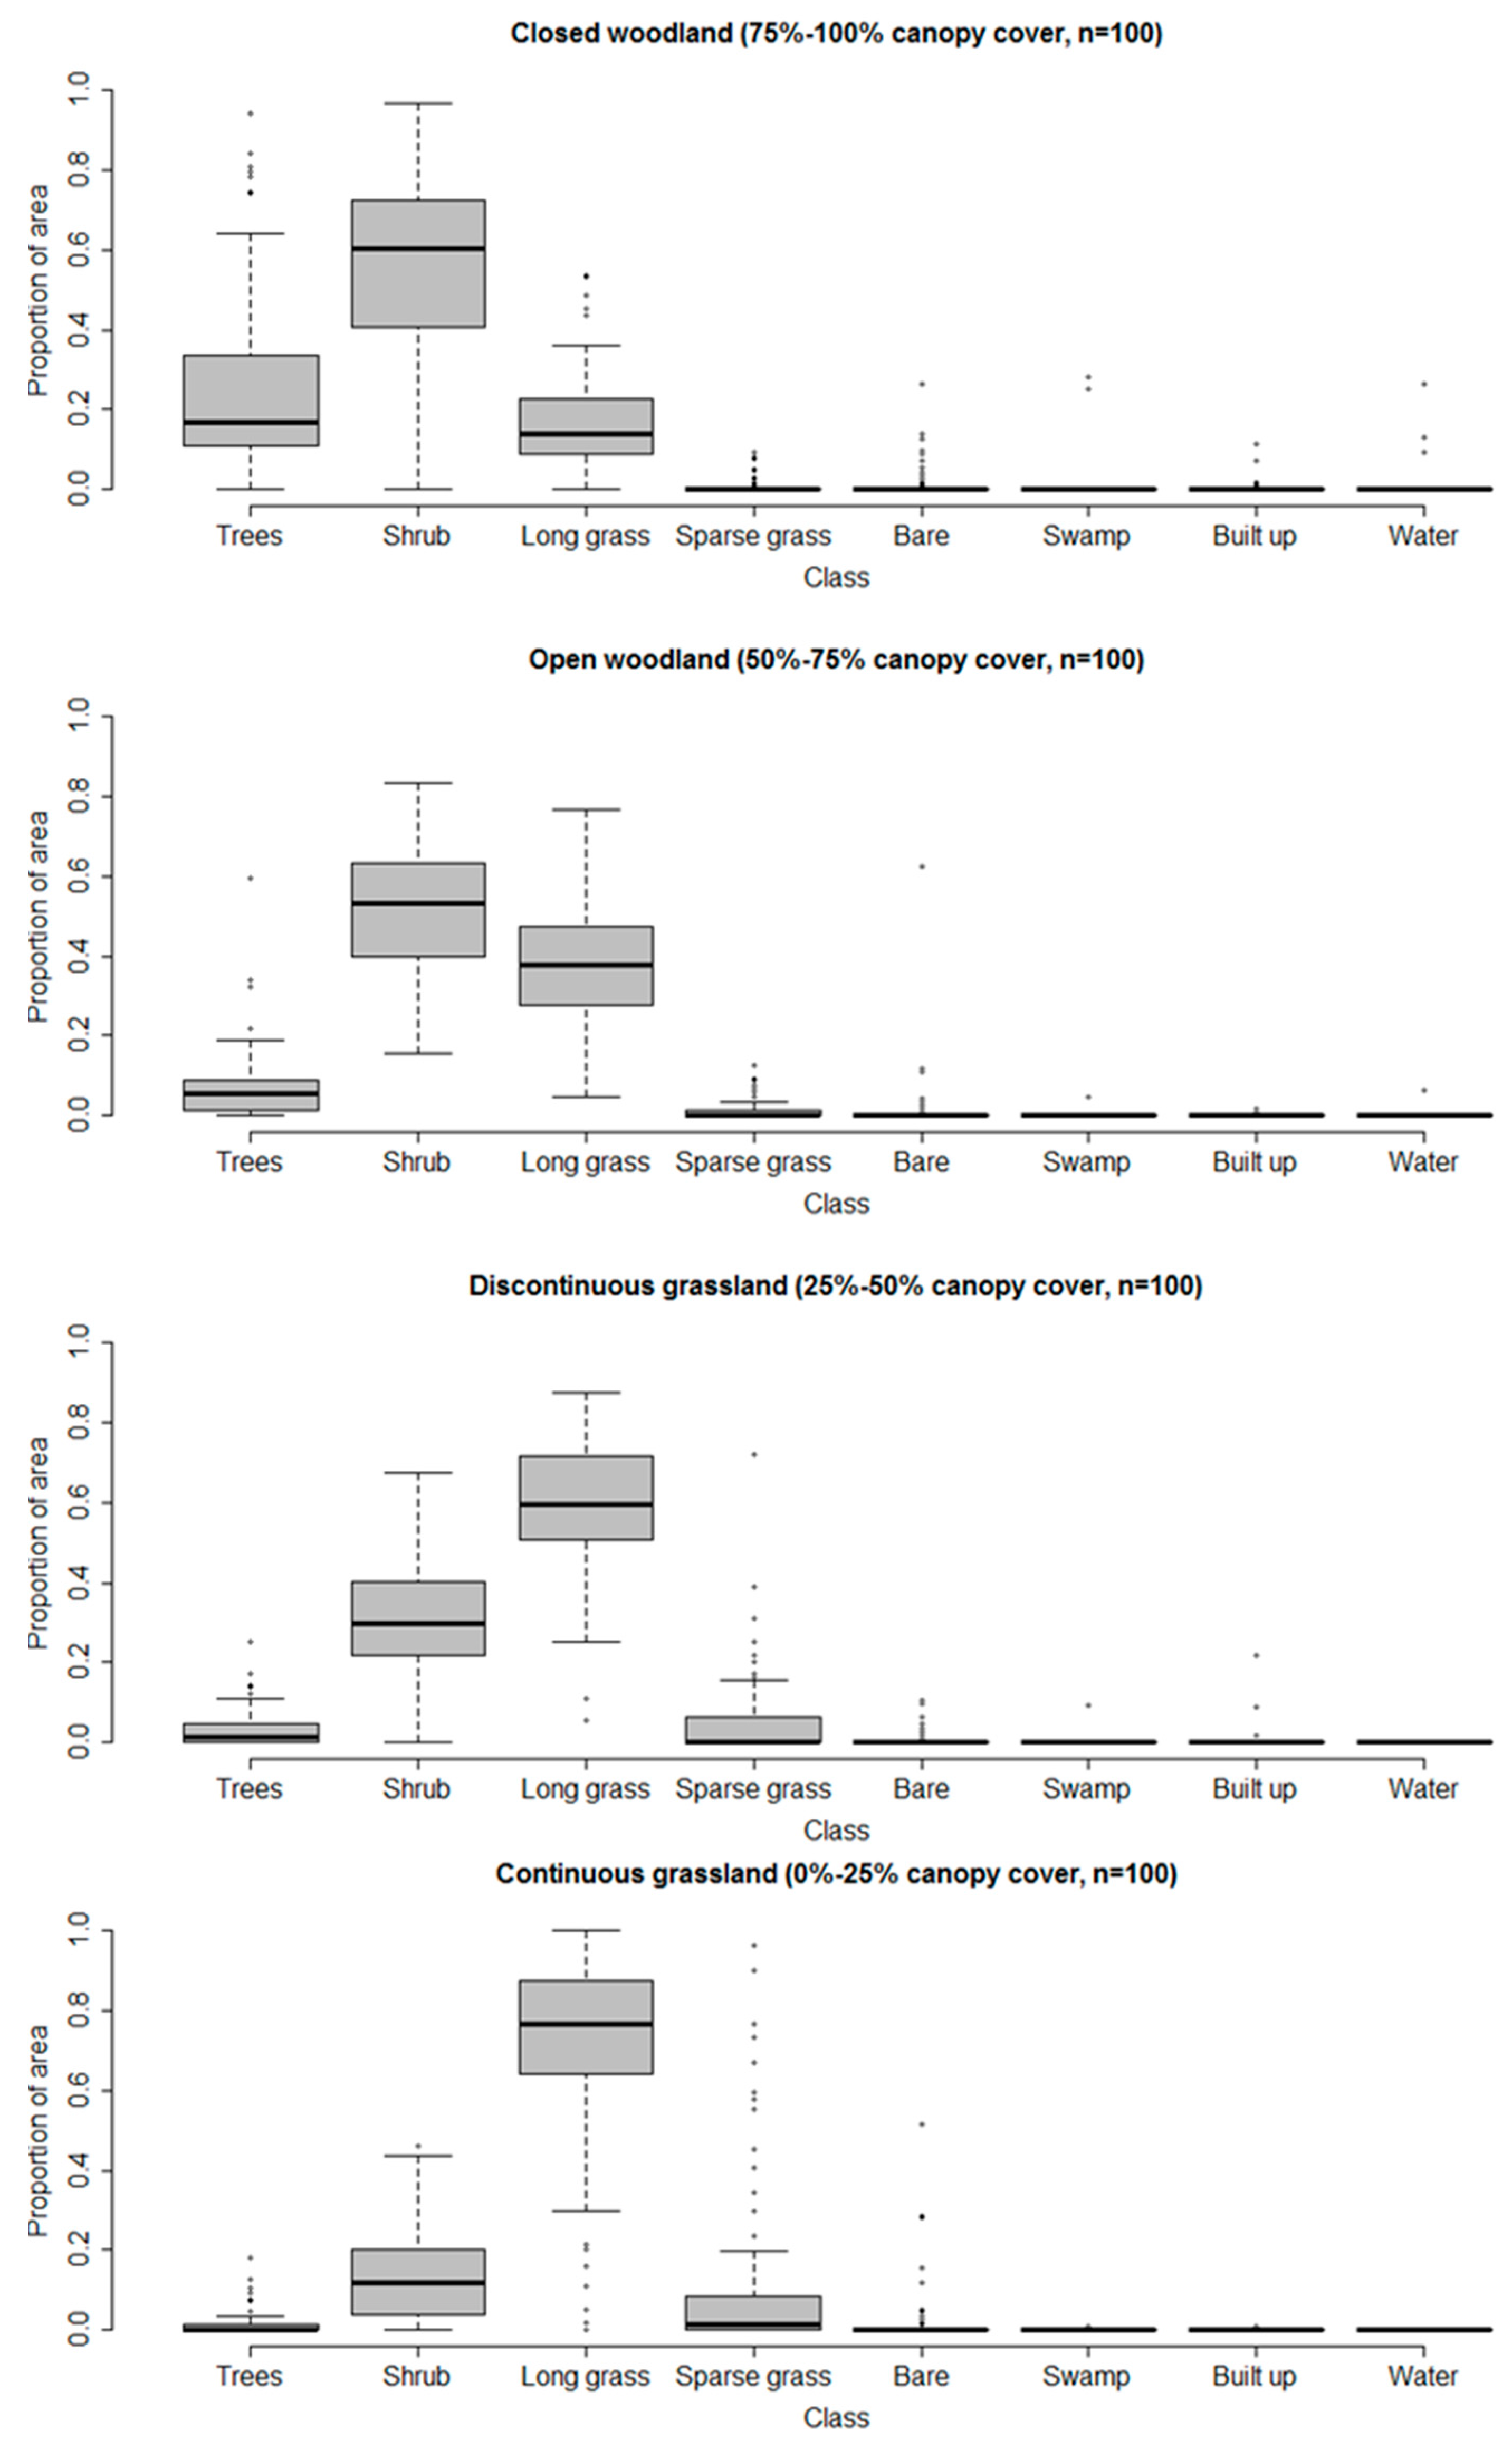
To examine the relative information content of the VHR and medium spatial resolution classifications, as relevant to shrub and woody encroachment, we directly compare the two. Given that medium resolution imagery is most likely to be used by practitioners (see Introduction), this comparison focused on the four medium resolution land cover classes representing the woody–grassland transition (Table 1). To determine the VHR class composition of the classified Landsat sample pixels, boxplots showing the proportion of VHR class coverage present in each of the four Landsat woodland/grassland classes were generated (Figure 8).
The Landsat classification thematic classes, which do not distinguish trees from shrubs, correspond well nevertheless with the land cover observed at finer spatial resolution in the VHR classification, which does distinguish trees and shrubs. Using fine resolution pixels as a proxy for percent cover within the coarser-resolution classification, closed woodland would be expected to have 75–100% of the VHR pixels classified as woody (either trees or shrubs), most likely somewhere towards the middle of that range. Indeed the distributions of values in the boxplots (Figure 8) indicate 80–85% of pixels classified as either trees or shrubs. Similarly, one would expect the corresponding totals for open woodland, discontinuous grassland and continuous grassland to be near the middle of the ranges 50–75%, 25–50% and 0–25%, and indeed we get values of approximately 60%, 35% and 15%, respectively (Figure 8). Furthermore, the proportion of VHR pixels classified as trees drops from around 20% in closed woodland to 5%, 2% and <1% in open woodland, discontinuous grassland and continuous grassland, respectively. Thus, the medium resolution classification, which does not directly distinguish between trees and shrubs, nevertheless contains proxy information about the relative proportions of trees and shrubs through its representation of woody cover in the four woodland/grassland transition classes.
The medium resolution classification also contains considerable information about the abundance of shrubs and grasses within the pixel. The proportions of finer resolution pixels classified as shrubs decline consistently from woodland, through discontinuous grassland to continuous grassland, and the proportions of grass (mainly long grass) increase as almost a mirror image of the shrubs.
Therefore, although spatial detail is lost in the medium resolution classification, the classifications at the two resolutions can be considered congruent, even with respect to some distinctions that cannot be made using the coarser resolution pixels. In other words, even though we cannot tell trees and shrubs apart in the Landsat imagery, classification of that imagery gives us reasonably accurate proxies of the coverage of trees, shrubs and grass.
3.4. Environmental Drivers of Land Cover Change
Time-series data for postulated drivers of vegetation change in African savannahs (see Introduction) are plotted in Figure 9. Mean maximum and minimum annual temperatures, total burnt area and total rainfall fluctuate across the duration of the time-series, and illustrate no obvious trend to explain the observed directional land cover changes. Elephant population and atmospheric CO2 have, however, both increased substantially over the last few decades. Elephant populations across KNP increased from 6881 in 1985 to 16,573 in 2012, while atmospheric CO2 has increased from 346.5 ppm in 1986 to 396.8 ppm in 2014, increasing potential levels of CO2 fertilisation.
4. Discussion
There are two key aspects of woody encroachment in savannahs: increase in woody plants in general at the expense of herbaceous vegetation, and increase specifically of shrubs (rather than trees). Each presents problems for monitoring and understanding change, and our research makes a contribution with respect to both. A key problem for monitoring general woody encroachment is that savannahs tend to be characterised by patches smaller than the pixel size of medium spatial resolution imagery, yet this is the imagery that is freely available with a 40+ years archive. Our multi-scale analysis suggests that the land cover classes that can be derived from medium resolution imagery are highly congruent, with respect to woody plant cover, with classes derived from very high-resolution (VHR) imagery with pixel sizes smaller than individual patches. If these findings hold in other areas, then quantifying woody encroachment over large areas and relatively long time-periods may be more achievable than previously thought. We also found increases of shrubs at the cost of both trees and grassland, and the control provided by the exclosure strongly implicates different causes for these two changes. We now discuss these key findings in more detail, in the context of the research questions outlined in the Introduction.
Our first research question was how has land cover in southern KNP changed over the last decade; can woody encroachment be observed? Across the three study sites in the period February 2001 to 2014, we found widespread woody encroachment, with considerable increases in shrub cover levels alongside smaller reductions in tree cover and grassland. Although there is localised variability (Figure 6 and Figure 7), the overall trend is consistent across all three study areas, with shrub increase occurring from two directions: loss of trees and conversion from grass (refer to supplementary information, Tables S9 and S10). To our knowledge, this dual-directional change is a wholly novel finding.
Our second research question was what are the drivers of the land cover change? Although we cannot provide a definitive answer, the exclosure results are key to understanding the potential mechanisms of change impacting the vegetation structure in the study area. The Nhkulu exclosure, created around the time of our first survey and excluding large herbivores such as elephants, allows us to move beyond mere description and correlations, harnessing this experimental setup to make progress towards understanding mechanism. The strongly contrasting vegetational changes inside and outside the exclosure (Table 5) are evidence that large-scale tree removal is linked to elephant activity [65]. While the increases in shrub, and reduction in grassland occur both inside and outside the exclosure, the loss of trees across the whole study area outside the exclosure contrasts strongly with the increase in tree cover within. Coupled with the large increase in elephant population between 1985 and 2014, this suggests that conversion of tree cover to shrub is being caused by elephant activity.
The pattern of increasing tree cover within the Nkhulu exclosure area is consistent with previous findings where airborne LiDAR surveys determined that the 3D structure of woody vegetation differed significantly between protected and accessible landscapes, with up to 11-fold greater woody canopy cover in areas without herbivores after more than 20 years [25]. This also found that, in KNP, areas excluding herbivores over the short term (6 years) contained 38–80% less bare ground compared to with sites exposed to mammalian herbivory. Previous studies also concluded that elephants are reducing tree numbers in KNP based on data from exclosures [26], with elephants suggested to be a major woody vegetation change driver throughout the KNP in the second half of the twentieth century [19]. In addition [80], determined that elephant number, alongside interactions with fire, were the principal drivers of decreases in large trees in sampled transects between 1940 and 1988 in the KNP. This is also supported by other studies identifying increases in tree cover following the exclusion of large mammalian herbivores (for example [46,81]). A reduction of large mammalian herbivores was also shown to be associated with a large increase (+34%) in tree cover in the Gorongosa National Park, Mozambique, following the near-extirpation of large herbivores during the Mozambican Civil War (1977–1992) [4], with elephant activities also been shown to be the dominant driver of over-storey tree mortality across gradients of rainfall and fire frequency in the Serengeti [27]. However these effects of mega-herbivores are context-dependent, as interactions with geology, fire and climate are also influential [26,65,66].
Elephants can also be expected to have a negative effect on shrubs in many situations by damaging them when feeding [65], although there is evidence for complex interactions with rainfall. In our data, shrubs expanding more inside the exclosure than outside (Table 5) suggest a negative role for elephants on shrubs in this system. That is, we suggest that elephants may cause net loss of shrubs, not gain. This is supported by previous studies which found that elephant numbers were positively associated with increased treefall rates across all woody canopy height classes, with their greatest impact in canopies taller than 5 m [26].
Given that shrubs are increasing strongly despite the negative effect of elephants, there must also be other factors driving shrub encroachment, most likely causing conversion of grassland to shrubs. Various hypotheses have been proposed (see Introduction), and while we do not have the replication or control to firmly support them, the clear lack of correspondence between trends in several of the putative drivers and the large increase in shrub suggests that they are unlikely to be the cause in our study area. Considering both the secondary environmental data and previous research, we speculate that increases in atmospheric CO2 are having a positive effect on woody vegetation. We suggest that while larger trees are being killed by elephants, overall woody vegetation (comprising both tree and shrub classes) is increasing, with the larger increases in shrub coverage as a result of increasing carbon fertilisation from higher levels of atmospheric CO2, more than offsetting this loss of trees. This is consistent with previous evidence for CO2 fertilisation contributing to woody thickening [5,9,10,35,36,37,38,39,40,41,42,43] over the past few decades, and growing evidence that elevated CO2 may promote conversion of savannahs to closed forests [34]. Increasing atmospheric CO2 concentrations are thought to increase the woody biomass in savannahs through the enhancement of the physiological advantage of C3 trees relative to C4 grasses [17], and through accelerating the escape of woody saplings from fire [4]. It is acknowledged, however, that drivers of woody cover change in tropical savannahs are often difficult to isolate because of the complex and dynamic interactions involved [27].
4.1. Multi-Scale Monitoring of Land Cover Change
Our third research question investigated the relative merits of land cover maps derived from VHR and medium spatial resolution imagery as monitoring tools for land cover change, focusing on what thematic information is lost when using medium resolution imagery. Results indicate that land cover maps generated from VHR imagery are remarkably congruent with those generated from Landsat imagery. Although we cannot discriminate between trees and shrubs using medium resolution imagery, and therefore cannot detect replacement of trees by shrubs, we can say that only pixels classed as closed woodland are likely to contain many trees in our study area. Thus, while the Landsat imagery is unlikely to be helpful in determining whether trees are converting to shrubs, it is a potentially very useful management tool with respect not only to woody encroachment generally, but also shrub encroachment into grassland specifically. Given our results for the exclosure area, we suggest that conversion of trees to shrubland is most likely to occur where elephants are increasing; in such areas, finer resolution imagery or field surveys will be needed to determine whether shrub encroachment is occurring at the expense of both trees and grassland, or only grassland.
Overall, we suggest that woody encroachment can be successfully observed and monitored using both VHR and medium resolution imagery. This has major implications for conducting land cover monitoring at broad geographical scales, because although LiDAR (for example [26]) and VHR data are well suited to studies of this nature, they are not widely available and often prohibitively expensive, whereas medium resolution imagery is freely available. Unlike VHR imagery, there is also a large historical archive of Landsat imagery.
4.2. Land Management and Ecological Impacts of Land Cover Change
In terms of practical land management applications, monitoring land cover change via remote sensing can better inform land managers about potential ecological consequences and impacts for particular species of conservation interest [82]. Large overstorey trees play disproportionately important roles in the long-term dynamics and functioning of savannahs [27], and their removal will have a knock-on effect which could be negative or positive depending on the species in question. The removal of trees by elephants affects habitat availability for other species, creating and maintaining open savannah landscapes [4,24], and influencing the species composition and structure of the herbaceous layer affecting other grazing species [83]. This greater canopy structural diversity enhances the habitat available for a wide range of organisms [25]. Species such as steenbok (Raphicerus campestris) and impala (Aepyceros melampus), have been shown to modify their microhabitat selection to utilise preferentially elephant-damaged areas [84]. Equally, woody encroachment will reduce spatial heterogeneity in vegetation structure, which will impact on species assemblages, distributions and densities, with the direction of change depending on the feeding preferences of the species concerned [50]. By quantifying the spatial patterns of this change over time using remote sensing, the ecological consequences can be better observed over larger geographical areas than would be possible using ground-based monitoring. As shown here, this has considerable potential for land managers as a means of informing environmental conservation practices. Different study areas will have different management histories and environmental settings, and different relationships may apply between scales in a multi-scale approach. However, the consistency of our results between sites suggests that, for a relatively modest outlay (perhaps acquisition of just one or a few recent VHR images to verify recent medium resolution classes, or targeted field surveys), large areas can be monitored for both woody encroachment generally and shrub encroachment more specifically.
5. Conclusions
We have three main conclusions. First, we find large increases in shrubs across all our sites over a period of little more than a decade. Importantly, this clear case of shrub encroachment in Kruger National Park has been at the cost of both trees and grass, and is therefore to the detriment of key tourist activities such as game viewing. Second, the exclosure data allow us to conclude that elephant activity is the main driver of tree loss, with trees increasing where large herbivores are excluded and decreasing strongly where they are not excluded. Shrubs also increase at a higher rate within the exclosure, indicating a negative effect of elephants on shrubs. Thus, at least one additional mechanism is causing shrub increase, the most likely single driver being an increase in atmospheric CO2. In such a complex system, however, the observed changes are unlikely to result from a single mechanism. Third, although medium spatial resolution imagery gives us little information about conversion of trees to shrubs, in other respects the thematic information (regarding land cover classification) captured by the medium-resolution is remarkably congruent with that derived from the VHR imagery. Therefore, despite the (medium resolution) sub-pixel scale of typical patch sizes in savannahs, we conclude that medium resolution imagery is nonetheless useful for examining land cover change in heterogeneous African savannahs across large areas, with the advantages of being cost-free and having a longer historical archive of data than is available for VHR sources.
Supplementary Materials
The following are available online at www.mdpi.com/2072-4292/9/5/419/s1, Table S1: Confusion matrix for the site 1 2002 (QuickBird) land cover classification. Table S2: Confusion matrix for the site 1 2014 (WorldView-2) land cover classification. Table S3: Confusion matrix for the site 2 2002 (IKONOS) land cover classification. Table S4: Confusion matrix for the site 2 2014 (IKONOS) land cover classification. Table S5: Confusion matrix for the site 3 2001 (IKONOS) land cover classification. Table S6: Confusion matrix for the site 3 2014 (IKONOS) land cover classification. Table S7: Confusion matrix for the sites 1, 2 and 3 2002 medium spatial resolution (Landsat ETM+) land cover classification. Table S8: Confusion matrix for the sites 1, 2 and 3 2014 medium spatial resolution (Landsat OLI) land cover classification. Table S9. Cross-tabulation results between VHR land cover classifications for sites 1 to 3 combined, illustrating land cover change vectors (as a percentage of total area). Table S10. Cross-tabulation results between medium resolution land cover classifications for sites 1 to 3 combined, illustrating land cover change vectors (as a percentage of total area).
Acknowledgments
This work was supported by the Leverhulme Trust (grant number RPG-2012-472), the Nuffield Foundation (grant number NAL/00400/G), and the University of Nottingham (Discipline Bridging Award ‘Remote sensing the past’). Publishing costs are supported by the Edge Hill University Research Investment Fund. We also thank SANParks and the staff at the Kruger National Park for our research permit, facilitating our field data collection (especially our game guard Kumekani Masinga), and SANP Scientific Services for providing the environmental drivers data sets. We thank the five anonymous reviewers for their valuable comments on the manuscript.
Author Contributions
Christopher Marston, David Wilkinson, Hannah O’Regan and Paul Aplin conceived and designed the project. Christopher Marston analysed the data. All authors contributed to performing the field work and writing the paper.
Conflicts of Interest
The authors declare no conflict of interest. The funding sponsors had no role in the design of the study; in the collection, analyses, or interpretation of data; in the writing of the manuscript, and in the decision to publish the results.
References
- Devine, A.P.; Stott, I.; McDonald, R.A.; Maclean, I.M.D. Woody cover in wet and dry African savannas after six decades of experimental fires. J. Ecol. 2015, 103, 473–478. [Google Scholar] [CrossRef]
- Shorrocks, B.; Bates, W. The Biology of African Savannahs, 2nd ed.; Oxford University Press: Oxford, UK, 2015. [Google Scholar]
- Torello-Raventos, M.; Feldpausch, T.R.; Veenendaal, E.; Schrodt, F.; Saiz, G.; Domingues, T.F.; Djagbletey, G.; Ford, A.; Kemp, J.; Marimon, B.S.; et al. On the delineation of tropical vegetation types with an emphasis on forest/savannah transitions. Plant Ecol. Divers. 2013, 6, 101–137. [Google Scholar] [CrossRef]
- Daskin, J.H.; Stalmans, M.; Pringle, R.M. Ecological legacies of civil war: 35-year increase in savanna tree cover following wholesale large-mammal declines. J. Ecol. 2016, 104, 79–89. [Google Scholar] [CrossRef]
- Buitenwerf, R.; Bond, W.J.; Stevens, N.; Trollope, W.S.W. Increased tree densities in South African savannahs: >50 years of data suggests CO2 as a driver. Glob. Chang. Biol. 2012, 18, 675–684. [Google Scholar] [CrossRef]
- Hirota, M.; Holmgren, M.; Nes, E.H.V.; Scheffer, M. Global resilience of tropical forest and savanna to critical transitions. Science 2011, 334, 232–235. [Google Scholar] [CrossRef] [PubMed]
- Anadon, J.D.; Sala, O.E.; Maestre, F.T. Climate change will increase savannas at the expense of forests and treeless vegetation in tropical and subtropical Americas. J. Ecol. 2014, 102, 1363–1373. [Google Scholar] [CrossRef]
- Zelazowski, P.; Malhi, Y.; Huntingford, C.; Sitch, S.; Fisher, J.B. Changes in the potential distribution of humid tropical forests on a warmer planet. Philos. Trans. R. Soc. A 2011, 369, 137–160. [Google Scholar] [CrossRef] [PubMed]
- Devine, A.P.; McDonald, R.A.; Quaife, T.; Maclean, I.M.D. Determinants of woody encroachment and cover in African savannas. Oecologia 2017, 183, 939–951. [Google Scholar] [CrossRef] [PubMed]
- Bowman, D.M.J.S.; Murphy, B.; Banfai, D.S. Has global environmental change caused monsoon rainforests to expand in the Australian monsoon tropics? Landsc. Ecol. 2010, 25, 1247–1260. [Google Scholar] [CrossRef]
- Fensham, R.J.; Fairfax, R.J. Preliminary assessment of gidgee (Acacia cambagei) woodland thickening in the Longreach district, Queensland. Rangeland J. 2005, 27, 159–168. [Google Scholar] [CrossRef]
- Stevens, N.; Lehmann, C.E.R.; Murphy, B.P.; Durigan, G. Savanna woody encroachment is widespread across three continents. Glob. Chang. Biol. 2017, 23, 235–244. [Google Scholar] [CrossRef] [PubMed]
- Bucini, G.; Hanan, N.P.; Boone, R.B.; Smit, I.P.J.; Saatchi, S.; Lefsky, M.A.; Asner, G.P. Woody fractional cover in Kruger National Park, South Africa: Remote-sensing-based maps and ecological insights. In Ecosystem Function in Savannas: Measurement and Modeling at Landscape to Global Scales; Hill, M.J., Hanan, N.P., Eds.; CRC Press: Boca Raton, FL, USA, 2010; pp. 219–238. [Google Scholar]
- Sankaran, M.; Hanan, N.P.; Scholes, R.J.; Ratnam, J.; Augustine, D.J.; Cade, B.S.; Gignoux, J.; Higgins, S.I.; Le Roux, X.; Ludwig, F.; et al. Determinants of woody cover in African savannas. Nature 2005, 438, 846–849. [Google Scholar] [CrossRef] [PubMed]
- Bucini, G.; Hanan, N.P. A continental-scale analysis of tree cover in African savannas. Glob. Ecol. Biogeogr. 2007, 16, 593–605. [Google Scholar] [CrossRef]
- Trollope, W.S.W.; Tainton, N.M. Effect of fire intensity on the grass and bush components of the Eastern Cape Thornveld. J. Grassl. Soc. S. Afr. 1986, 3, 37–42. [Google Scholar] [CrossRef]
- Bond, W.J. What limits trees in C4 grasslands and savannas? Annu. Rev. Ecol. Evol. Syst. 2008, 39, 641–659. [Google Scholar] [CrossRef]
- Bond, W.; Zaloumis, N.P. The deforestation story: Testing for anthropogenic origins of Africa’s flammable grassy biomes. Philos. Trans. R. Soc. B 2016, 371, 20150170. [Google Scholar] [CrossRef] [PubMed]
- Munyati, C.; Sinthumule, N.I. Change in woody cover at representative sites in the Kruger National Park, South Africa, based on historical imagery. SpringerPlus 2016, 5, 1417. [Google Scholar] [CrossRef] [PubMed]
- Smit, I.P.J.; Asner, G.P.; Govender, N.; Vaughn, N.R.; van Wilgen, B.W. An examination of the potential efficacy of high-intensity fires for reversing woody encroachment in savannas. J. Appl. Ecol. 2016, 53, 1623–1633. [Google Scholar] [CrossRef]
- Trollope, W.S.W. Fire in savanna. In Ecological Effects of Fire in South African Ecosystems; Booysen, P.V., Tainton, N.M., Eds.; Springer: Berlin, Germany, 1984; pp. 151–175. [Google Scholar]
- Higgins, S.I.; Bond, W.J.; Trollope, W.S.W. Fire, resprouting and variability: A recipe for grass-tree coexistence in savanna. J. Ecol. 2000, 88, 213–229. [Google Scholar] [CrossRef]
- O’Connor, T.G.; Puttick, J.R.; Hoffman, M.T. Bush encroachment in southern Africa: Changes and causes. Afr. J. Range Forage Sci. 2014, 31, 67–88. [Google Scholar] [CrossRef]
- Laws, R.M. Elephants as agents of habitat and landscape change in East Africa. Oikos 1970, 21, 1–15. [Google Scholar] [CrossRef]
- Asner, G.P.; Levick, S.R.; Kennedy-Bowdoin, T.; Knapp, D.E.; Emerson, R.; Jacobson, J.; Colgan, M.S.; Martin, R.E. Large-scale impacts of herbivores on the structural diversity of African savannas. Proc. Natl. Acad. Sci. USA 2009, 106, 4947–4952. [Google Scholar] [CrossRef] [PubMed]
- Asner, G.P.; Levick, S.R. Landscape-scale effects of herbivores on treefall in African savannas. Ecol. Lett. 2012, 15, 1211–1217. [Google Scholar] [CrossRef] [PubMed]
- Morrison, T.A.; Holdo, R.M.; Anderson, T.M. Elephant damage, not rain or rainfall, explains mortality of overstorey trees in Serengeti. J. Ecol. 2016, 104, 409–418. [Google Scholar] [CrossRef]
- Asner, G.P.; Elmore, A.J.; Olander, L.P.; Martin, R.E.; Harris, A.T. Grazing systems, ecosystem responses, and global change. Annu. Rev. Environ. Resour. 2004, 29, 261–299. [Google Scholar] [CrossRef]
- Midgley, J.J.; Lawes, M.J.; Chamaillé-Jammes, S. Savanna woody plant dynamics: The role of fire and herbivory, separately and together. Aust. J. Bot. 2010, 58, 1–11. [Google Scholar] [CrossRef]
- Staver, A.C.; Archibald, S.; Levin, S. Tree cover in sub-Saharan Africa: Rainfall and fire constrain forest and savanna as alternative stable states. Ecology 2011, 92, 1063–1072. [Google Scholar] [CrossRef] [PubMed]
- Sankaran, M.; Ratnam, J.; Hanan, N.P. Woody cover in African savannas: The role of resources, fire and herbivory. Glob. Ecol. Biogeogr. 2008, 17, 236–245. [Google Scholar] [CrossRef]
- Scholes, R.J.; Archer, S.R. Tree–Grass Interactions in Savannas. Annu. Rev. Ecol. Syst. 1997, 28, 517–544. [Google Scholar] [CrossRef]
- Archer, S.; Schimel, D.S.; Holland, E.A. Mechanisms of shrubland expansion: Land use change, climate or CO2? Clim. Chang. 1995, 29, 91–99. [Google Scholar] [CrossRef]
- Bond, W.J.; Midgley, G.F. Carbon dioxide and the uneasy interactions of trees and savannah grasses. Philos. Trans. R. Soc. B 2012, 367, 601–612. [Google Scholar] [CrossRef] [PubMed]
- Bond, W.J.; Midgley, G.F. A proposed CO2-controlled mechanism of woody plant invasion in grasslands and savannas. Glob. Chang. Biol. 2000, 6, 865–869. [Google Scholar] [CrossRef]
- Donohue, R.J.; Roderick, M.L.; McVicar, T.R.; Farquhar, G.D. Impact of CO2 fertilization on maximum foliage cover across the globe’s warm, arid environments. Geophys. Res. Lett. 2013, 40, 3031–3035. [Google Scholar] [CrossRef]
- Stevens, N.; Erasmus, B.F.N.; Archibald, S.; Bond, W.J. Woody encroachment over 70 years in South African savannahs: Overgrazing, global change or extinction aftershock? Philos. Trans. R. Soc. B 2016, 371, 20150437. [Google Scholar] [CrossRef] [PubMed]
- Ward, D.; Hoffman, M.T.; Collocott, S.J. A century of woody plant encroachment in the dry Kimberley savanna of South Africa. Afr. J. Range Forage Sci. 2014, 31, 107–121. [Google Scholar] [CrossRef]
- Ainsworth, E.A.; Rogers, A. The response of photosynthesis and stomatal conductance to rising [CO2]: Mechanisms and environmental interactions. Plant Cell Environ. 2007, 30, 258–270. [Google Scholar] [CrossRef] [PubMed]
- Polley, H.W. Implications of rising atmospheric carbon dioxide concentration for rangelands. J. Range Manag. 1997, 50, 562–577. [Google Scholar] [CrossRef]
- Idso, K.E.; Idso, S.B. Plant responses to atmospheric CO2 enrichment in the face of environmental constraints: A review of the past 10 years’ research. Agr. For. Meteorol. 1994, 69, 153–203. [Google Scholar] [CrossRef]
- Idso, S.B. Shrubland expansion in the American southwest. Clim. Chang. 1992, 22, 85–86. [Google Scholar] [CrossRef]
- Brandt, M.; Rasmussen, K.; Peñuelas, J.; Tian, F.; Schurgers, G.; Verger, A.; Mertz, O.; Palmer, J.R.B.; Fensholt, R. Human population growth offsets climate-driven increase in woody vegetation in sub-Saharan Africa. Nat. Ecol. Evol. 2017, 1, 0081. [Google Scholar] [CrossRef]
- Parr, C.L.; Gray, E.F.; Bond, W.J. Cascading biodiversity and functional consequences of a global change–induced biome switch. Divers. Distrib. 2012, 18, 493–503. [Google Scholar] [CrossRef]
- Sirami, C.; Monadjem, A. Changes in bird communities in Swaziland savannas between 1998 and 2008 owing to shrub encroachment. Divers. Distrib. 2012, 18, 390–400. [Google Scholar] [CrossRef]
- Tambling, C.J.; Minnie, L.; Adendorff, J.; Kerley, G.I. Elephants facilitate impact of large predators on small ungulate prey species. Basic Appl. Ecol. 2013, 14, 694–701. [Google Scholar] [CrossRef]
- Ford, A.T.; Goheen, J.R.; Otieno, T.O.; Bidner, L.; Isbell, L.A.; Palmer, T.M.; Ward, D.; Woodroffe, R.; Pringle, R.M. Large carnivores make savanna tree communities less thorny. Science 2014, 346, 346–349. [Google Scholar] [CrossRef] [PubMed]
- Joffre, R.; Rambal, S. How tree cover influences the water balance of Mediterranean rangelands. Ecology 1993, 74, 570–582. [Google Scholar] [CrossRef]
- Coetsee, C.; Gray, E.F.; Wakeling, J.; Wigley, B.J.; Bond, W.J. Low gains in ecosystem carbon with woody plant encroachment in a South African savanna. J. Trop. Ecol. 2013, 29, 49–60. [Google Scholar] [CrossRef]
- Gray, E.F.; Bond, W.J. Will woody plant encroachment impact on the visitor experience and economy of conservation areas? Koedoe 2013, 55, 9. [Google Scholar] [CrossRef]
- Lindsey, P.A.; Alexander, R.; Mills, M.G.L.; Romañach, S.; Woodroffe, R. Wildlife viewing preferences of visitors to protected areas in South Africa: Implications for the role of ecotourism in conservation. J. Ecotour. 2007, 6, 19–33. [Google Scholar] [CrossRef]
- Bucini, G.; Saatchi, S.; Hanan, N.; Boone, R.B.; Smit, I. Woody cover and heterogeneity in the Savannas of the Kruger National Park, South Africa. In Proceedings of the 2009 IEEE International Geoscience and Remote Sensing Symposium, Cape Town, South Africa, 12–17 July 2009; Volume 4, pp. 334–337. [Google Scholar]
- Helman, D.; Lensky, I.M.; Tessler, N.; Osem, Y. A phenology-based method for monitoring woody and herbaceous vegetation in Mediterranean forests from NDVI time series. Remote Sens. 2015, 7, 12314–12335. [Google Scholar] [CrossRef]
- Holdo, R.M.; Mack, M.C. Functional attributes of savanna soils: Contrasting effects of tree canopies and herbivores on bulk density, nutrients and moisture dynamics. J. Ecol. 2014, 102, 1171–1182. [Google Scholar] [CrossRef]
- Kaszta, Z.; Van De Kerchove, R.; Ramoelo, A.; Cho, M.A.; Madonsela, S.; Mathieu, R.; Wolff, E. Seasonal separation of African savanna components using Worldview-2 imagery: A comparison of pixel and object-based approaches and selected classification algorithms. Remote Sens. 2016, 8, 763. [Google Scholar] [CrossRef]
- Whiteside, T.G.; Boggs, G.S.; Maier, S.W. Comparing object-based and pixel-based classifications for mapping savannas. Int. J. Appl. Earth Obs. Geoinf. 2011, 13, 884–893. [Google Scholar] [CrossRef]
- Aplin, P. Remote sensing: Base mapping. Prog. Phys. Geog. 2003, 27, 275–283. [Google Scholar] [CrossRef]
- Sankey, T.; Glenn, N. Landsat-5 TM and Lidar Fusion for Sub-pixel Juniper Tree Cover Estimates in a Western Rangeland. Photogramm. Eng. Remote Sens. 2011, 12, 1241–1248. [Google Scholar] [CrossRef]
- Brandt, M.; Hiernaux, P.; Tagesson, T.; Verger, A.; Rasmussen, K.; Diouf, A.A.; Mbow, C.; Mougin, E.; Fensholt, R. Woody plant cover estimation in drylands from Earth Observation based seasonal metrics. Remote Sens. Environ. 2016, 172, 28–38. [Google Scholar] [CrossRef]
- Dye, D.G.; Middleton, B.R.; Vogel, J.M.; Wu, Z.; Velasco, M. Exploiting differential vegetation phenology for satellite-based mapping of semiarid grass vegetation in the Southwestern United States and Northern Mexico. Remote Sens. 2016, 8, 889. [Google Scholar] [CrossRef]
- Brandt, M.; Tappan, G.; Diouf, A.A.; Beye, G.; Mbow, C.; Fensholt, R. Woody Vegetation Die off and Regeneration in Response to Rainfall Variability in the West African Sahel. Remote Sens. 2017, 9, 39. [Google Scholar] [CrossRef]
- Kaptué, A.T.; Prihodko, L.; Hanan, N.P. On regreening and degradation in Sahelian watersheds. Proc. Natl. Acad. Sci. USA 2015, 112, 12133–12138. [Google Scholar] [CrossRef] [PubMed]
- Gessner, U.; Klein, D.; Conrad, C.; Schmidt, M.; Dech, S. Towards an automated estimation of vegetation cover fractions on multiple scales: Examples of Eastern and Southern Africa. In Proceedings of the 33rd International Symposium on Remote Sensing of Environment, Stresa, Italy, 4–8 May 2009. [Google Scholar]
- Scanlon, T.M.; Albertson, J.D.; Caylor, K.K.; Williams, C.A. Determining land surface fractional cover from NDVI and rainfall time series for a savanna ecosystem. Remote Sens. Environ. 2002, 82, 376–388. [Google Scholar] [CrossRef]
- Guldemond, R.; Van Aarde, R. A meta-analysis of the impact of African elephants on savannah vegetation. J. Wildl. Manag. 2008, 72, 892–899. [Google Scholar] [CrossRef]
- Wigley, B.J.; Fritz, H.; Coetsee, C.; Bond, W.J. Herbivores shape woody plant communities in the Kruger National Park: Lessons from three long-term exclosures. Koedoe 2014, 56, 12. [Google Scholar] [CrossRef]
- Du Toit, J.T.; Rogers, K.H.; Biggs, H.C. The Kruger Experience; Ecology and Management of Savanna Heterogeneity; Island Press: Washington, DC, USA, 2003. [Google Scholar]
- Pickett, S.T.A.; Cadenasso, M.L.; Benning, T.A. Biotic and abiotic variability as key determinants of savanna heterogeneity at multiple spatiotemporal scales. In The Kruger Experience; Ecology and Management of Savanna Heterogeneity; Du Toit, J.T., Rogers, K.H., Biggs, H.C., Eds.; Island Press: Washington, DC, USA, 2003; pp. 22–40. [Google Scholar]
- Mayaux, P.; Bartholom, E.; Cabral, A.; Cherlet, M.; Defourny, P.; Di Gregorio, A.; Diallo, O.; Massart, M.; Nonguierma, A.; Pekel, J.F.; et al. The Land Cover Map for Africa in the Year 2000. GLC2000 Database, European Commission Joint Research Centre, 2003. Available online: http://www-gem.jrc.it/glc2000 (accessed on 18 April 2015).
- Jenkins, T.A.R.; Mackie, E.D.; Matthews, R.W.; Miller, G.; Randle, T.J.; White, M.E. FC Woodland Carbon Code: Carbon Assessment Protocol. Forestry Commission; 2011. Available online: http://www.forestry.gov.uk/pdf/Carbon_Assessment_Protocol_v1_0_main_22Jul2011.pdf/$file/Carbon_Assessment_Protocol_v1_0_main_22Jul2011.pdf (accessed on 18 April 2015).
- Bezdek, J.C. Fuzzy Mathematics in Pattern Classification. Ph.D. Thesis, Cornell University, Ithaca, NY, USA, 1973. [Google Scholar]
- Loveland, T.R.; Reed, B.C.; Brown, J.F.; Ohlen, D.O.; Zhu, Z.; Yang, L.; Merchant, J.W. Development of a global land cover characteristics database and IGBP DISCover from 1 km AVHRR data. Int. J. Remote Sens. 2000, 21, 1303–1330. [Google Scholar] [CrossRef]
- O’Regan, H.J.; Wilkinson, D.M.; Marston, C.G. Hominin home ranges and habitat variability: Exploring modern African analogues using remote sensing. J. Archaeol. Sci. Rep. 2016, 9, 238–248. [Google Scholar] [CrossRef]
- Wayman, J.P.; Wynne, R.H.; Scrivani, J.A.; Reams, G.A. Landsat TM-based forest area estimation using iterative guided spectral class rejection. Photogramm. Eng. Remote. Sens. 2001, 67, 1155–1166. [Google Scholar]
- Ozesmi, S.L.; Bauer, M.E. Satellite remote sensing of wetlands. Wetl. Ecol. Manag. 2002, 10, 381–402. [Google Scholar] [CrossRef]
- Martin, R.; Brabyn, L.; Beard, C. Effects of class granularity and cofactors on the performance of unsupervised classification of wetlands using multi-spectral aerial photography. J. Spat. Sci. 2014, 59, 269–282. [Google Scholar] [CrossRef]
- Jiang, H.; Strittholt, J.R.; Frost, P.A.; Slosser, N.C. The classification of seral forest in the Pacific Northwest USA using Landsat ETM+ imagery. Remote Sens. Environ. 2004, 91, 320–331. [Google Scholar] [CrossRef]
- Baraldi, A.; Puzzolo, V.; Blonda, P.; Bruzzone, L.; Tarantino, C. Automatic spectral rule-based preliminary mapping of calibrated Landsat TM and ETM+ images. IEEE Trans. Geosci. Remote Sens. 2006, 44, 2563–2586. [Google Scholar] [CrossRef]
- Dlugokencky, E.J.; Lang, P.M.; Masarie, K.A.; Crotwell, A.M.; Crotwell, M.J. Atmospheric Carbon Dioxide Dry Air Mole Fractions from the NOAA ESRL Carbon Cycle Cooperative Global Air Sampling Network, 1968–2014. 2015. Available online: ftp://aftp.cmdl.noaa.gov/data/trace_gases/co2/flask/surface/ (accessed on 18 December 2015).
- Eckhardt, H.C.; van Wilgen, B.W.; Biggs, H.C. Trends in woody vegetation cover in the Kruger National Park, South Africa, between 1940 and 1998. Afr. J. Ecol. 2000, 38, 108–115. [Google Scholar] [CrossRef]
- Sankaran, M.; Augustine, D.J.; Ratnam, J. Native ungulates of diverse body sizes collectively regulate long-term woody plant demography and structure of a semi-arid savanna. J. Ecol. 2013, 101, 1389–1399. [Google Scholar] [CrossRef]
- Altamirano, A.; Field, R.; Cayuela, L.; Aplin, P.; Lara, A.; Rey-Benayas, J.M. Woody species diversity in temperate Andean forests: The need for new conservation strategies. Biol. Conserv. 2010, 143, 2080–2091. [Google Scholar] [CrossRef]
- Belsky, A.J.; Canham, C.D. Forest gaps and isolated savanna trees. Bioscience 1994, 44, 77–84. [Google Scholar] [CrossRef]
- Valeix, M.; Fritz, H.; Sabatier, R.; Murindagomo, F.; Cumming, D.; Duncan, P. Elephant-induced structural changes in the vegetation and habitat selection by large herbivores in an African savanna. Biol. Conserv. 2011, 144, 902–912. [Google Scholar] [CrossRef]
Figure 1.
Study site locations overlaid on a 2014 Landsat Operational Land Imager image. Inset maps show the location of the KNP within South Africa, and the location of the study area within the KNP.
Figure 1.
Study site locations overlaid on a 2014 Landsat Operational Land Imager image. Inset maps show the location of the KNP within South Africa, and the location of the study area within the KNP.

Figure 2.
Examples of woodland and grassland VHR land cover classes: (a) trees; (b) shrubs; (c) long grass and (d) sparse grass.
Figure 2.
Examples of woodland and grassland VHR land cover classes: (a) trees; (b) shrubs; (c) long grass and (d) sparse grass.
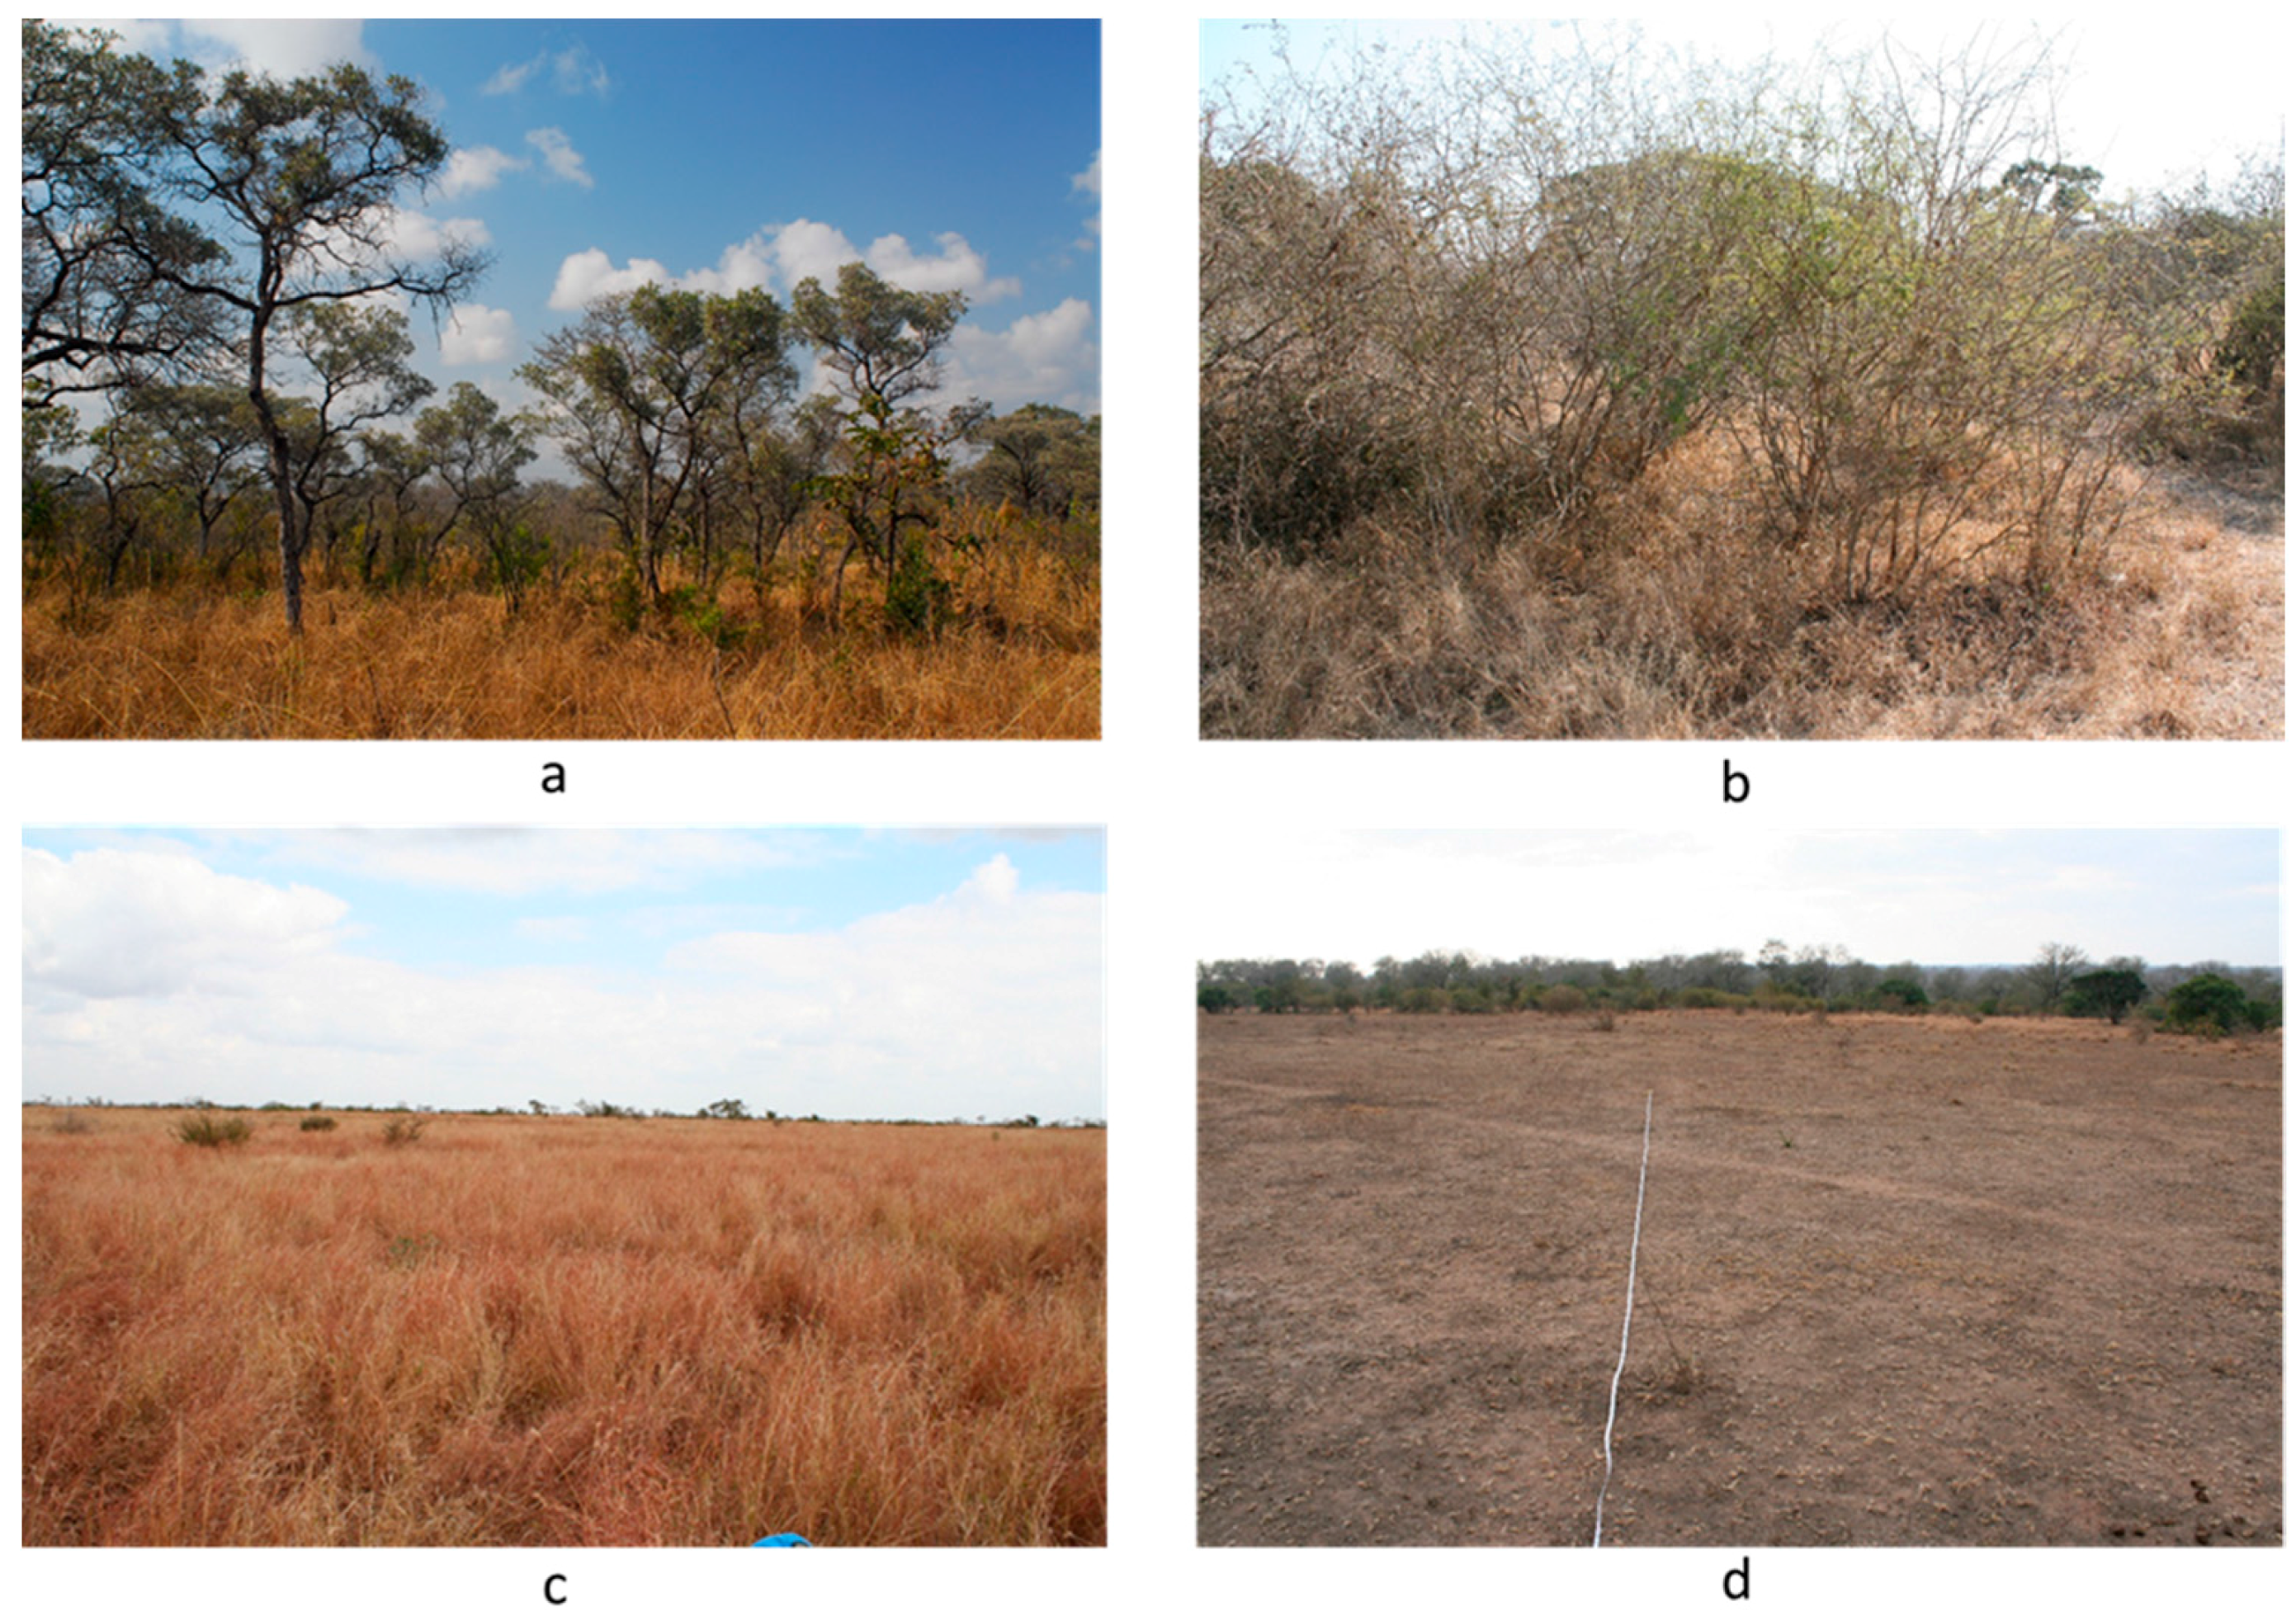
Figure 3.
Land cover classifications of site 1 generated from: (A) VHR QuickBird imagery (2.8 m resolution) in 2002; (B) VHR WorldView-2 imagery (resampled to 2.8 m) in 2014; (C) medium resolution Landsat ETM+ imagery (30 m) in 2002; and (D) medium resolution Landsat OLI imagery (30 m) in 2014. Areas of ‘No Data’ correspond to areas of cloud cover and cloud shadow. Note the woodland and grassland class definitions differ between the fine and medium resolution classifications (Table 2).
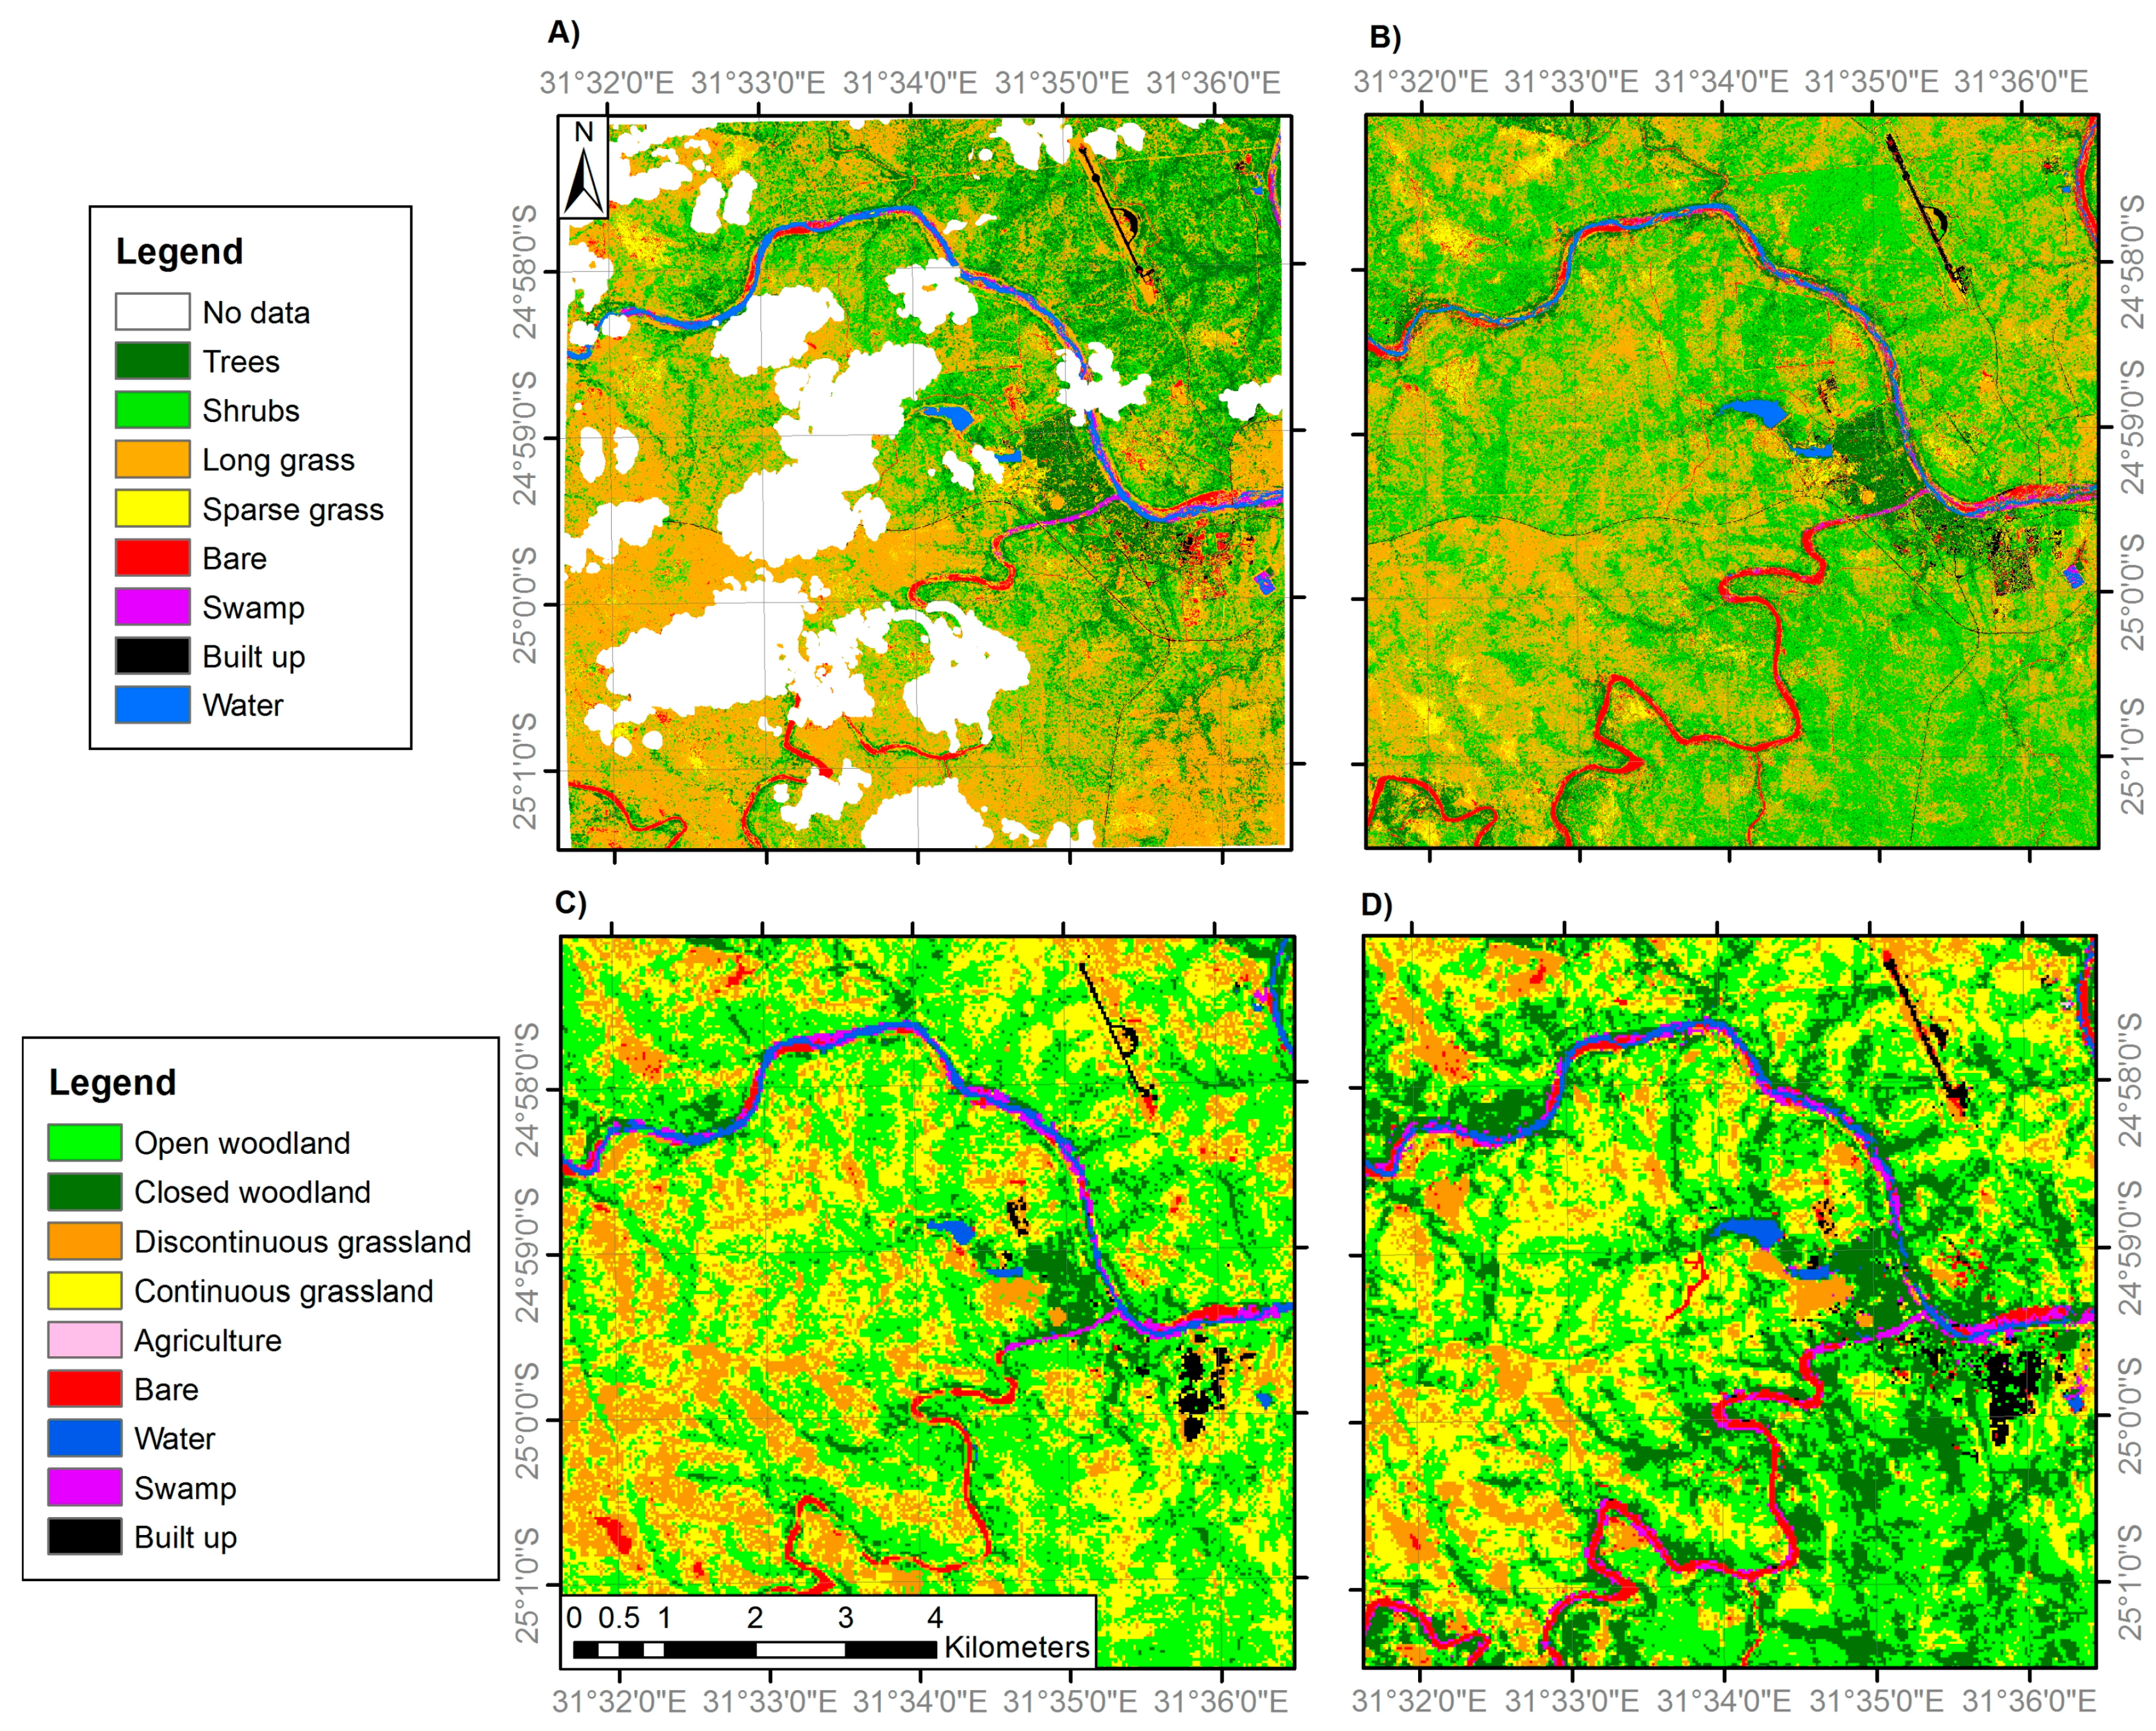
Figure 4.
Land cover classifications of site 2 generated from: (A) VHR IKONOS imagery (4 m resolution) in 2002; (B) VHR IKONOS imagery (4 m resolution) in 2014; (C) medium resolution Landsat ETM+ imagery (30 m) in 2002; and (D) medium resolution Landsat OLI imagery (30 m) in 2014. Areas of ‘No Data’ correspond to areas of cloud cover and cloud shadow. Note the woodland and grassland class definitions differ between the fine and medium resolution classifications (Table 2).

Figure 5.
Land cover classifications of site 3 generated from: (A) VHR IKONOS imagery (4 m resolution) in 2001; (B) VHR IKONOS imagery (4 m resolution) in 2014; (C) medium resolution Landsat ETM+ imagery (30 m) in 2002; and (D) medium resolution Landsat OLI imagery (30 m) in 2014. Areas of ‘No Data’ correspond to areas of cloud cover and cloud shadow. Note the woodland and grassland class definitions differ between the fine and medium resolution classifications (Table 2).
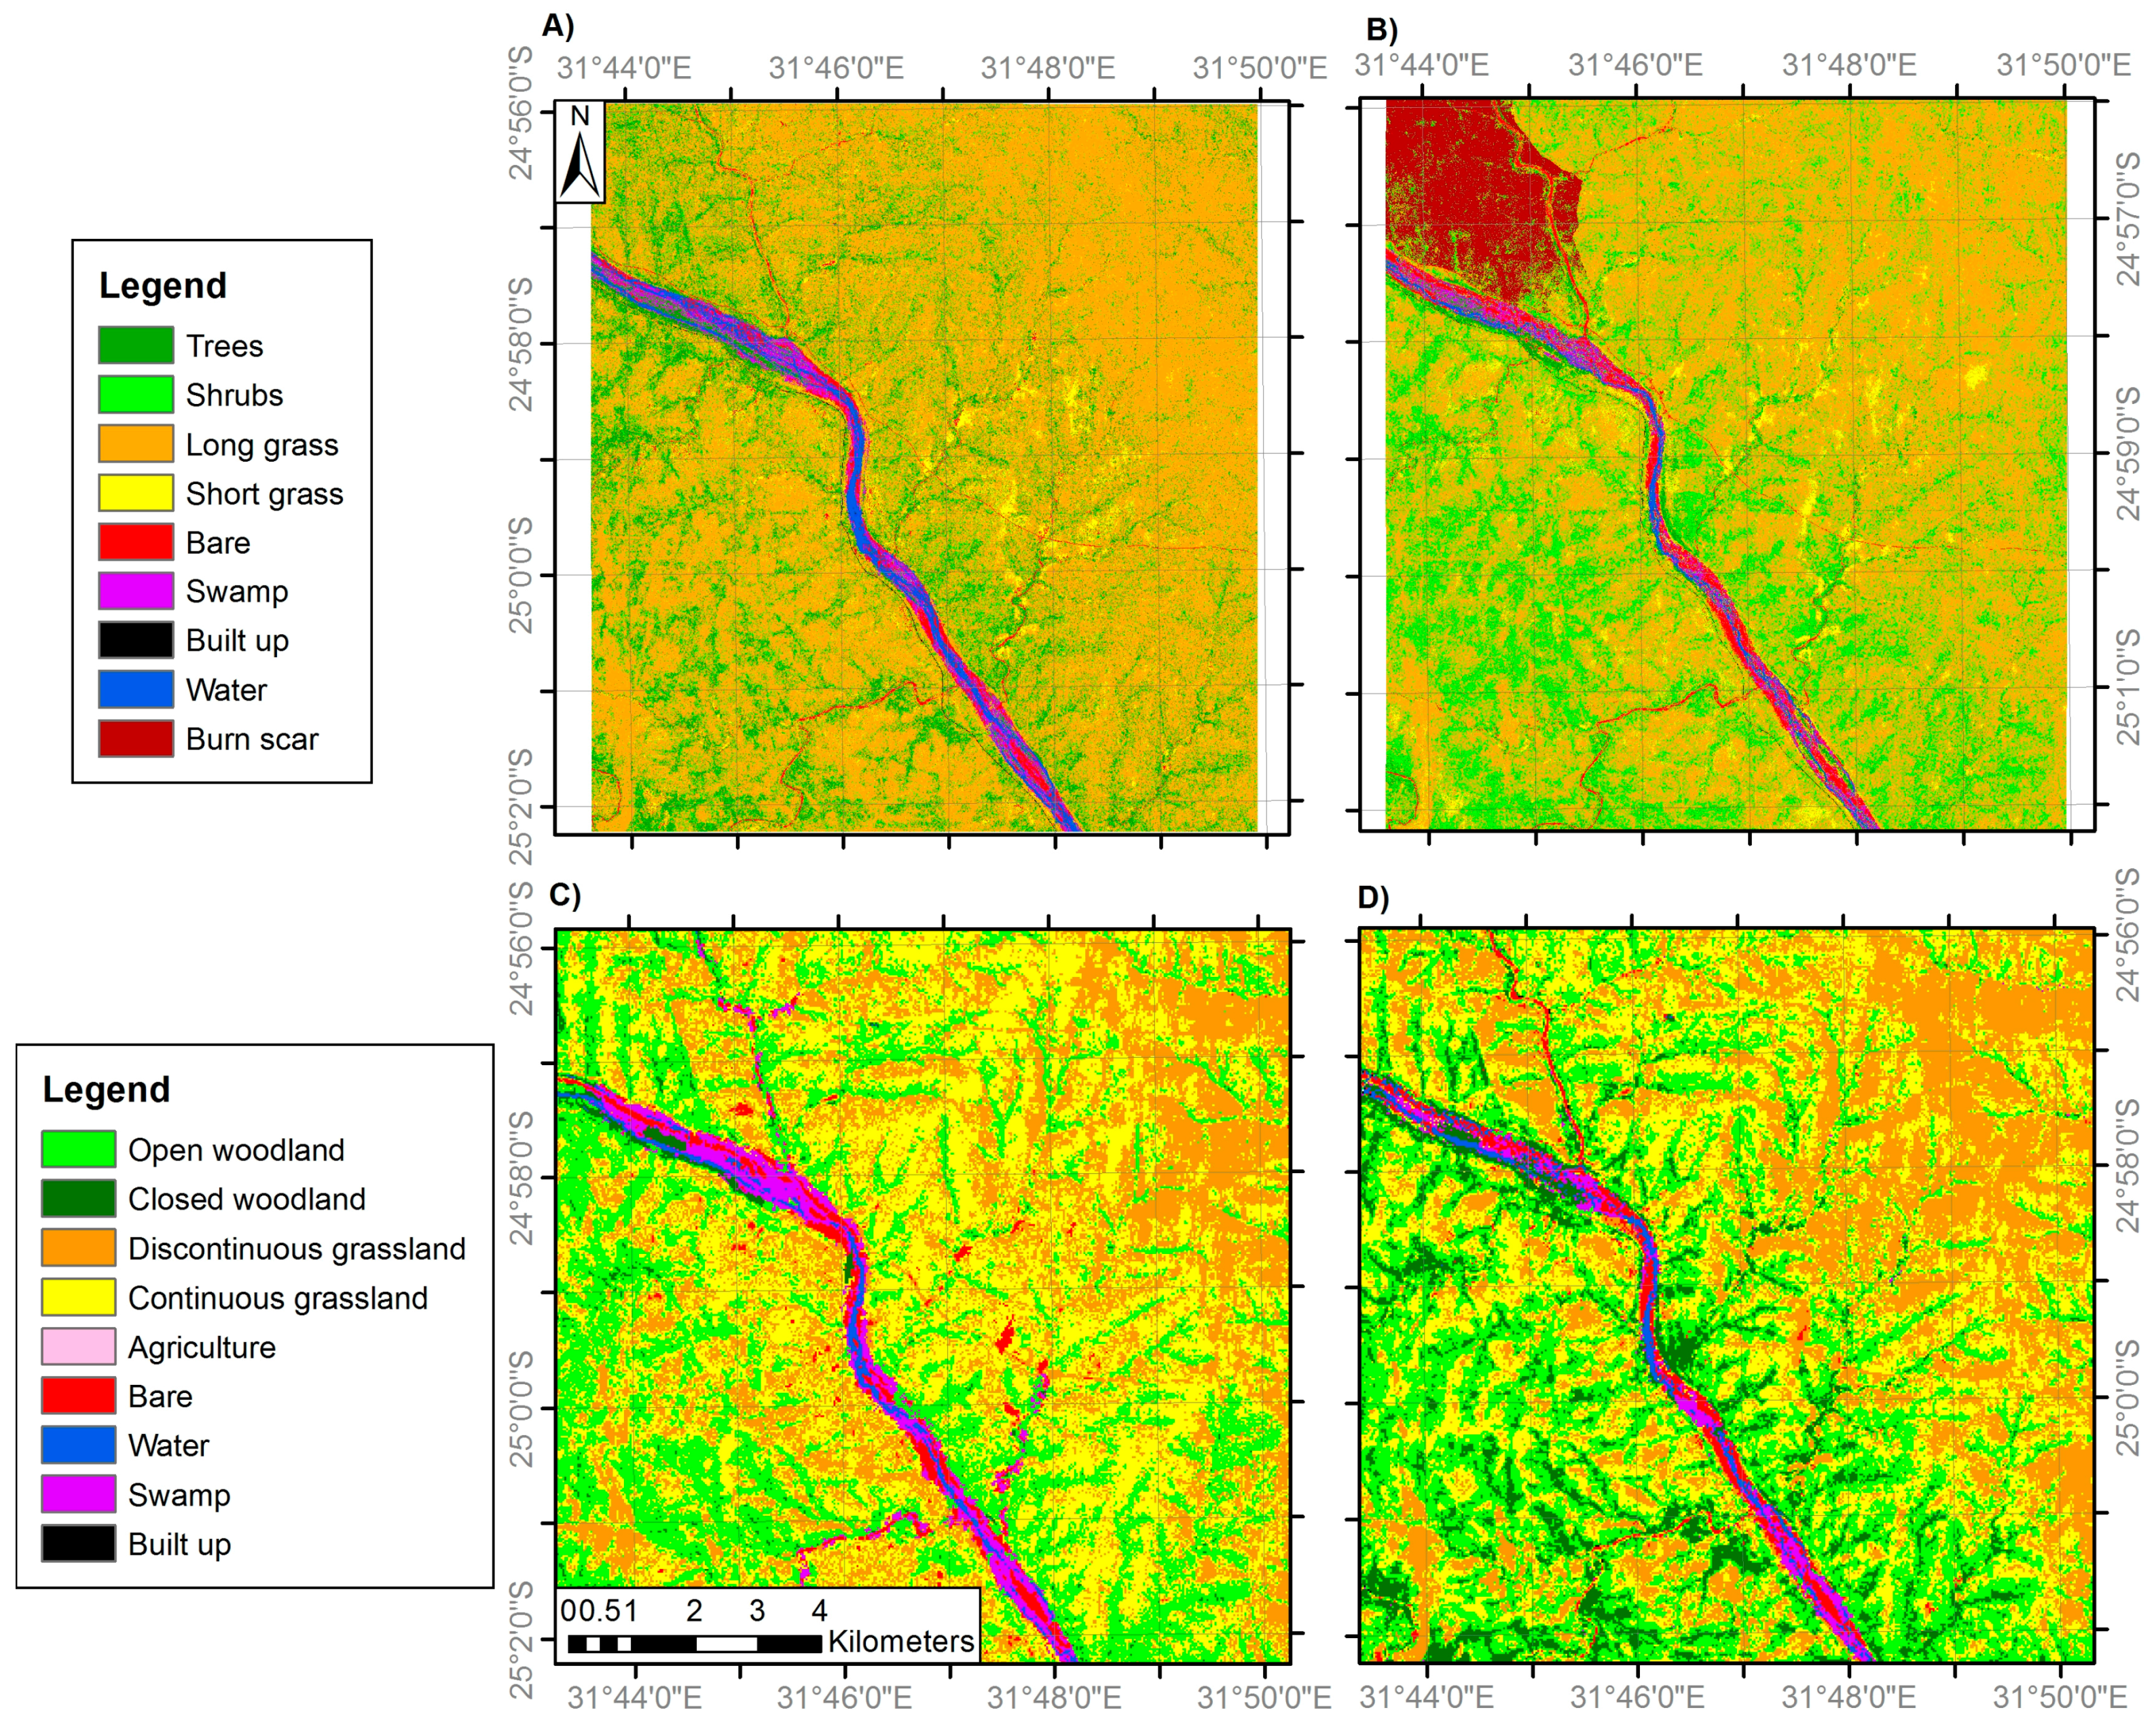
Figure 6.
Shrub change map illustrating areas of shrub increase, decrease, continued presence and absence.
Figure 6.
Shrub change map illustrating areas of shrub increase, decrease, continued presence and absence.
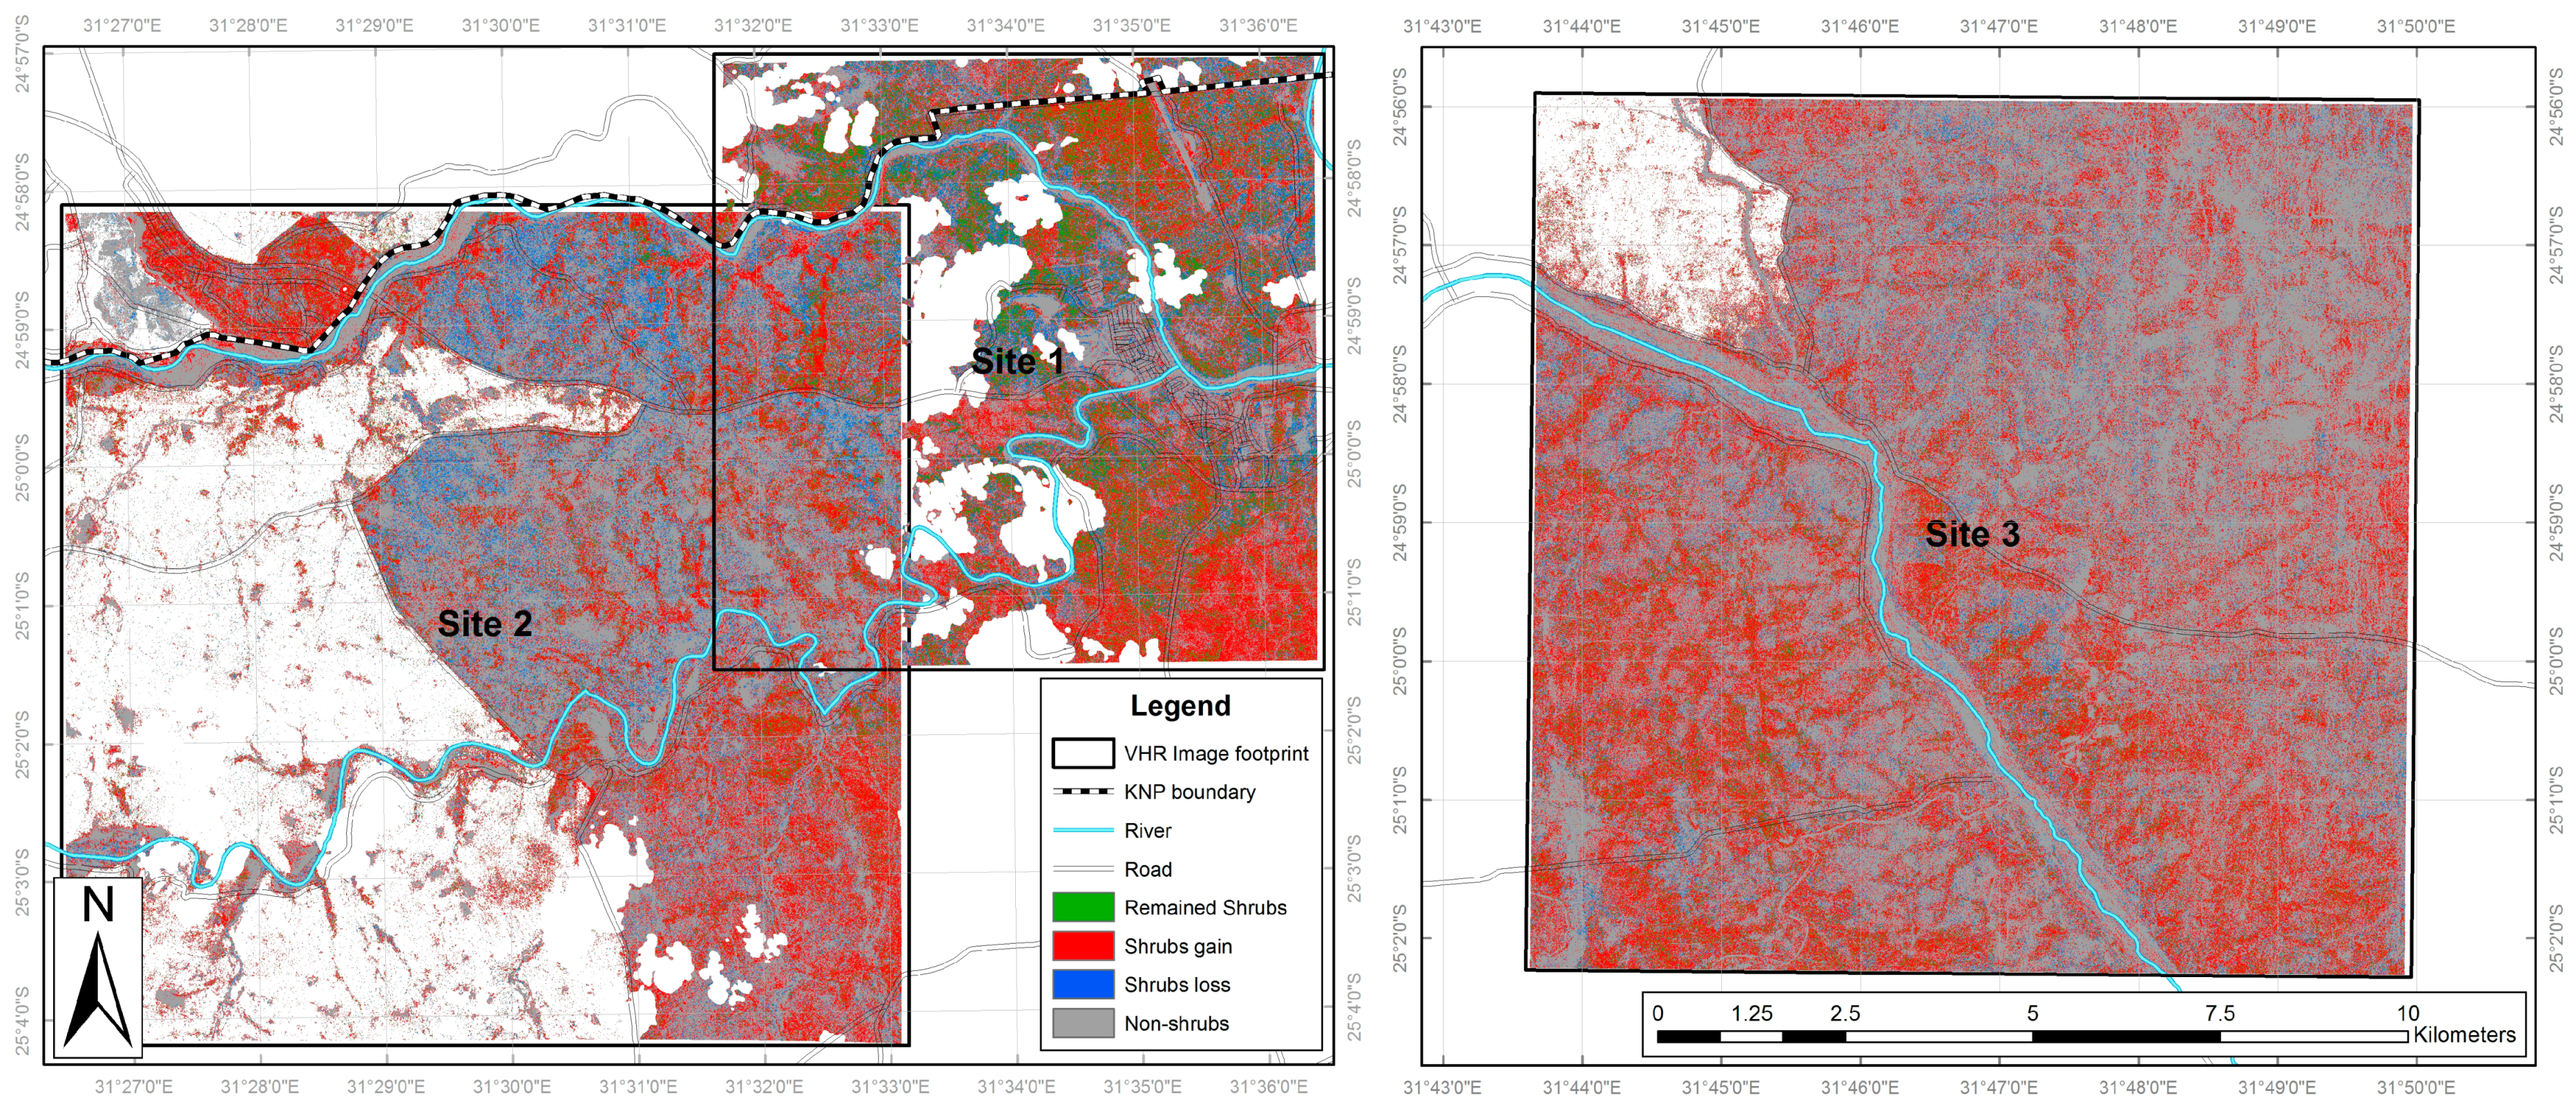
Figure 7.
Trees change map illustrating areas of tree increase, decrease, continued presence and absence.
Figure 7.
Trees change map illustrating areas of tree increase, decrease, continued presence and absence.

Figure 8.
Correspondence between VHR land cover classes and the four Landsat woodland and grassland classes for the 2014 imagery.
Figure 8.
Correspondence between VHR land cover classes and the four Landsat woodland and grassland classes for the 2014 imagery.

Figure 9.
Potential environmental drivers of land cover change and woody encroachment: (a) mean annual maximum and minimum temperature; (b) total rainfall and total burnt area; (c) elephant population; and (d) mean annual atmospheric CO2 (ppm) from the Mahe Island (Seychelles) recording site [79].
Figure 9.
Potential environmental drivers of land cover change and woody encroachment: (a) mean annual maximum and minimum temperature; (b) total rainfall and total burnt area; (c) elephant population; and (d) mean annual atmospheric CO2 (ppm) from the Mahe Island (Seychelles) recording site [79].

Table 1.
Classification nomenclatures for medium and VHR imagery derived land cover maps.
| General Habitat | Medium Resolution Land Cover Classes | VHR Land Cover Classes |
|---|---|---|
| Woodland | 1. Closed woodland (75–100% canopy cover) | 1. Trees (main trunk >7 cm diameter) |
| 2. Open woodland (50–75% canopy cover) | 2. Shrubs (main trunk <7 cm diameter) | |
| Grassland | 3. Discontinuous grassland (25–50% canopy cover) | 3. Long grass |
| 4. Continuous grassland (0–25% canopy cover) | 4. Sparse grass | |
| Anthropogenic classes | 5. Agriculture | 5. Agriculture |
| 6. Built-up | 6. Built-up | |
| Bare | 7. Bare | 7. Bare |
| Water | 8. Water | 8. Water |
| 9. Swamp | 9. Swamp |
Table 2.
Satellite sensor imagery used for generation of land cover maps (spectral band B = blue, C = cirrus, CA = coastal aerosol, CB = coastal blue, G = green, NIR = near infra-red, R = red, RE = red edge, SWIR = short-wave infrared, Y = yellow), land cover classification accuracy, and number of accuracy assessment locations used.
| Sensor | Image Acquisition Date | Sites | Spatial Resolution (m) | Spectral Bands | Overall Classification Accuracy (%) |
|---|---|---|---|---|---|
| QuickBird | 9 December 2002 | 1 | 2.8 | B, G, R, NIR | 91.0 |
| IKONOS | 7 March 2002 | 2 | 4 | B, G, R, NIR | 90.6 |
| IKONOS | 28 April 2001 | 3 | 4 | B, G, R, NIR | 87.7 |
| WorldView-2 | 14 October 2014 | 1 | Resampled to 2.8 | CB, B, G, Y, R, RE, NIR1, NIR2 | 90.2 |
| IKONOS | 27 September 2014 | 2 | 4 | B, G, R, NIR | 92.5 |
| IKONOS | 27 September 2014 | 3 | 4 | B, G, R, NIR | 90.6 |
| Landsat ETM+ | 18 June 2002 | 1, 2 and 3 | 30 | B, G, R, NIR, SWIR1, SWIR2 | 75.2 |
| Landsat OLI | 27 June 2014 | 1, 2 and 3 | 30 | CA, B, G, R, NIR, SWIR1, SWIR2, C | 75.2 |
Table 3.
Land cover change between February 2001 and 2014 calculated using VHR imagery. To ensure that the overlap between sites 1 and 2 was not double-counted in the ‘total’ area calculations, the part of site 1 in the overlap area (more affected by cloud) was excluded when the ‘total’ columns were calculated. Cover change % corresponds to percentage of the full site area.
| Class | Site 1 | Site 2 | Site 3 | Sites 1–3 Total | ||||||||
|---|---|---|---|---|---|---|---|---|---|---|---|---|
| 2002 cover (Ha) | 2014 cover (Ha) | Cover change (%) | 2002 cover (Ha) | 2014 cover (Ha) | Cover change (%) | 2001 cover (Ha) | 2014 cover (Ha) | Cover change (%) | February 2001 cover (Ha) | 2014 cover (Ha) | Cover change (%) | |
| Trees | 814.3 | 550.4 | −5.3 | 1801.5 | 502.6 | −17.1 | 1864.3 | 482.3 | −11.8 | 4421.8 | 1299.3 | −13.5 |
| Shrubs | 1440.8 | 2238.7 | +16.1 | 1380.0 | 2652.0 | +16.7 | 1436.6 | 3609.6 | +18.6 | 4029.7 | 8222.7 | +18.1 |
| Long grass | 2272.4 | 1637.4 | −12.8 | 3629.1 | 3585.0 | −0.6 | 7496.9 | 6751.2 | −6.4 | 12,738.1 | 11,556.8 | −5.1 |
| Sparse grass | 164.7 | 215.1 | +1.0 | 424.7 | 466.9 | +0.6 | 400.3 | 426.2 | +0.2 | 955.9 | 1057.1 | +0.4 |
| Bare | 127.3 | 174.7 | +1.0 | 170.2 | 240.8 | +0.9 | 172.2 | 221.4 | +0.4 | 440.7 | 600.0 | +0.7 |
| Swamp | 29.4 | 21.7 | −0.2 | 79.9 | 19.2 | −0.8 | 142.2 | 106.5 | −0.3 | 249.2 | 148.4 | −0.4 |
| Built up | 37.6 | 60.8 | +0.5 | 17.5 | 18.4 | 0.0 | 7.8 | 6.4 | 0.0 | 62.2 | 85.2 | +0.1 |
| Water | 68.6 | 56.4 | −0.3 | 77.3 | 41.5 | −0.5 | 153.0 | 69.6 | −0.7 | 287.0 | 160.0 | −0.5 |
| Agriculture | - | - | - | 29.1 | 84.3 | +0.7 | - | - | - | 29.1 | 84.3 | +0.2 |
Table 4.
Land cover change between 2002 and 2014 calculated using medium spatial resolution imagery. Note there is some overlap between sites 1 and 2. To ensure that the overlap between sites 1 and 2 was not double-counted in the ‘total’ area calculations, the part of site 1 in the overlap area (more affected by cloud) was excluded when the ‘total’ columns were calculated. Cover change % corresponds to percentage of the full site areas.
| Class | Site 1 | Site 2 | Site 3 | Sites 1–3 Total | ||||||||
|---|---|---|---|---|---|---|---|---|---|---|---|---|
| 2002 cover (Ha) | 2014 cover (Ha) | Cover change (%) | 2002 cover (Ha) | 2014 cover (Ha) | Cover change (%) | 2002 cover (Ha) | 2014 cover (Ha) | Cover change (%) | 2002 cover (Ha) | 2014 cover (Ha) | Cover change (%) | |
| Closed woodland | 370.3 | 1250.7 | +13.6 | 300.1 | 918.0 | +4.9 | 114.2 | 979.6 | +7.0 | 730.4 | 2960.9 | +7.4 |
| Open woodland | 2713.0 | 2477.4 | −3.6 | 2446.2 | 2605.5 | +1.3 | 3107.2 | 3684.3 | +4.6 | 7820.4 | 8301.7 | +1.6 |
| Discontinuous grassland | 2065.8 | 1696.4 | −5.7 | 4331.7 | 4275.2 | −0.4 | 5249.2 | 3961.8 | −10.4 | 11,106.5 | 9390.9 | −5.7 |
| Continuous grassland | 1044.2 | 651.5 | −6.0 | 4794.9 | 4327.7 | −3.7 | 3299.2 | 3335.2 | +0.3 | 8720.6 | 8074.2 | −2.1 |
| Bare | 107.6 | 154.0 | +0.7 | 390.1 | 273.8 | −0.9 | 244.3 | 216.3 | −0.2 | 705.2 | 608.7 | −0.3 |
| Swamp | 56.8 | 99.8 | +0.7 | 86.8 | 72.1 | −0.1 | 328.6 | 142.0 | −1.5 | 466.6 | 292.5 | −0.6 |
| Built up | 50.2 | 78.3 | 0.4 | 10.7 | 21.8 | +0.1 | 0.1 | 1.1 | 0.0 | 61.1 | 101.3 | +0.1 |
| Water | 85.0 | 84.3 | 0.0 | 67.5 | 67.6 | 0.0 | 85.9 | 108.3 | +0.2 | 226.3 | 245.9 | +0.1 |
| Agriculture | - | - | - | 228.2 | 94.3 | −1.1 | - | - | - | 234.5 | 95.0 | −0.5 |
Table 5.
Land cover change between 2001 and 2014 within and outside the Nkhulu exclosure area. Cover change % corresponds to the percentage of the full exclosure area, or site 3 image footprint excluding the exclosure area correspondingly.
Table 5.
Land cover change between 2001 and 2014 within and outside the Nkhulu exclosure area. Cover change % corresponds to the percentage of the full exclosure area, or site 3 image footprint excluding the exclosure area correspondingly.
| Class | Nkhulu Exclosure | Site 3 Excluding Nkhulu Exclosure | ||||
|---|---|---|---|---|---|---|
| 2001 Cover (Ha) | 2014 Cover (Ha) | Cover Change (%) | 2001 Cover (Ha) | 2014 Cover (Ha) | Cover Change (%) | |
| Trees | 21.6 | 24.8 | +2.8 | 1839.7 | 465.4 | −11.9 |
| Shrubs | 16.7 | 48.2 | +27.4 | 1420.3 | 3552.7 | +18.4 |
| Long grass | 61.1 | 36.7 | −21.2 | 7438.2 | 6715.1 | −6.3 |
| Sparse grass | 10.5 | 4.4 | −5.3 | 389.9 | 421.9 | +0.3 |
| Bare | 3.0 | 0.6 | −2.2 | 169.2 | 220.8 | +0.4 |
| Swamp | 1.5 | 0.0 | −1.3 | 140.7 | 106.5 | −0.3 |
| Built up | 0.0 | 0.0 | 0.0 | 7.8 | 6.4 | 0.0 |
| Water | 0.3 | 0.0 | −0.3 | 152.7 | 69.6 | −0.7 |
© 2017 by the authors. Licensee MDPI, Basel, Switzerland. This article is an open access article distributed under the terms and conditions of the Creative Commons Attribution (CC BY) license (http://creativecommons.org/licenses/by/4.0/).
Share and Cite
MDPI and ACS Style
Marston, C.G.; Aplin, P.; Wilkinson, D.M.; Field, R.; O’Regan, H.J. Scrubbing Up: Multi-Scale Investigation of Woody Encroachment in a Southern African Savannah. Remote Sens. 2017, 9, 419. https://doi.org/10.3390/rs9050419
AMA Style
Marston CG, Aplin P, Wilkinson DM, Field R, O’Regan HJ. Scrubbing Up: Multi-Scale Investigation of Woody Encroachment in a Southern African Savannah. Remote Sensing. 2017; 9(5):419. https://doi.org/10.3390/rs9050419
Chicago/Turabian StyleMarston, Christopher G., Paul Aplin, David M. Wilkinson, Richard Field, and Hannah J. O’Regan. 2017. "Scrubbing Up: Multi-Scale Investigation of Woody Encroachment in a Southern African Savannah" Remote Sensing 9, no. 5: 419. https://doi.org/10.3390/rs9050419
Note that from the first issue of 2016, this journal uses article numbers instead of page numbers. See further details here.