Article

Estimating FAPAR of Rice Growth Period Using Radiation Transfer Model Coupled with the WOFOST Model for Analyzing Heavy Metal Stress

School of Information Engineering, China University of Geoscience, Beijing 100083, China
*
Author to whom correspondence should be addressed.
Remote Sens. 2017, 9(5), 424; https://doi.org/10.3390/rs9050424
Submission received: 10 March 2017 / Revised: 21 April 2017 / Accepted: 27 April 2017 / Published: 29 April 2017
(This article belongs to the Special Issue Ecophysiological Remote Sensing)

Abstract

:
Timely assessment of crop growth conditions under heavy metal pollution is of great significance for agricultural decision-making and estimation of crop productivity. The object of this study is to assess the effects of heavy metal stress on physiological functions of rice through the spatial-temporal analysis of the fraction of absorbed photosynthetically active radiation (FAPAR). The calculation of daily FAPAR is conducted based on a coupled model consisting of the leaf-canopy radiative transfer model and World Food Study Model (WOFOST). These two models are connected by leaf area index (LAI) and a fraction of diffused incoming solar radiation (SKYL) in the rice growth period. The input parameters of the coupled model are obtained from measured data and GF-1 images. Meanwhile, in order to improve accuracy of FAPAR, the crop growth model is optimized by data assimilation. The validation result shows that the correlation between the simulated FAPAR and the measured data is strong in the rice growth period, with the correlation coefficients being above 7.5 for two areas. The discrepancy of FAPAR between two areas of different stress levels is visualized by spatial-temporal analysis. FAPAR discrepancy starts to appear in the jointing-booting period and experiences a gradual rise, reaching its maximum in the heading-flowering stage. This study suggests that the coupled model, consisting of the leaf-canopy radiative transfer model and the WOFOST model, is able to accurately simulate daily FAPAR during crop growth period and FAPAR can be used as a potential indicator to reflect the impact of heavy metal stress on crop growth.

Graphical Abstract

1. Introduction

The pressures on agro-ecosystems are increasing with the rapid industrial, economic development and environmental problems, such as drought and heavy metal contamination. One of the major problems is heavy metal pollution of paddy fields, which is the widely cultivated crop in China and provided approximately 42% of the national grain reserves [1,2,3,4]. The accumulation of heavy metal ions in rice can threaten food security and harm human health. According to incomplete statistics, there are more than 12 million tons of grains contaminated by heavy metals in China every year [5]. Some studies show that the heavy metal ions can influence the cell structure of plants and cause changes in physiological function, affecting the normal growth of crops [6,7]. Significantly, these changes can impair crop photosynthesis by affecting activity of photosynthetic enzymes and pigment content (chlorophyll) [8,9,10,11]. The fraction of absorbed photosynthetically active radiation (FAPAR), defined as the fraction of photosynthetically active radiation (PAR) absorbed by a green canopy in the 0.4–0.7 μm spectral range, has been proven to be effective for quantitative estimation of canopy photosynthetic capacity as it constrains the photosynthesis rate through the energy absorbed by the vegetation [12,13,14]. It is well known as a significant biophysical variable in characterizing energy conversion of leaf physiological processes. It is also widely used for monitoring the health status of crop growth [15,16]. However, the impact of heavy metal contamination is long-term, concealed and irreversible [17]. It is difficult to predict the long-term effects of heavy metals on rice growth from the short-term change in FAPAR. Therefore, seasonal simulations of FAPAR are needed by the agricultural sector to properly assess the consequences of heavy metal stress on rice.
Most studies show the estimation of FAPAR from optical remote sensing is based on empirical or physical models [18,19,20]. The main methods are focused on established empirical relationships (linear or nonlinear) between field-measured FAPAR and satellite-derived vegetation indices by regression analysis, without knowing the underlying physical mechanism in the radiative transfer (RT) process [21]. Therefore, the functional analysis needs to be simple and computationally efficient to operate over large scales [22]. However, the relationship between FAPAR and vegetation indices cannot be applied in all conditions because canopy reflectance is also affected by other factors, such as observation time and spatial resolution [22]. Additionally, some studies show the vegetation growth period and reflectance of background may seriously affect the stability of the relationship between FAPAR and the vegetation index, such as the normalized difference vegetation index (NDVI)[23]. However, physical models can be applied to most conditions, including different land covers and time periods, because the physical models analyze the interactions between solar radiation and vegetation canopies to reveal cause–effect relationships[20]. Meanwhile, a considerable number of studies have pointed out that increasing the fraction of diffuse radiation could improve light use efficiency (LUE), although total PAR reaching the top of the canopy would be decreased [24,25]. Therefore, we consider the effects of diffuse radiation on vegetation conditions in order to increase the accuracy of FAPAR. We decided to divide FAPAR into direct FAPAR (FAPARdir) and diffuse FAPAR (FAPARdif), which represents the total canopy absorbed efficiency from both direct and diffuse PAR [26,27].
In addition, some literature has assessed the contribution of driving factors on FAPAR variation by sensitivity analyses using different scales. In Asner and Wessman studies [13], the geometrical optical radiative transfer model was utilized to assess the factors driving FAPAR variation from the landscape views, canopy and leaf scales. Li et al. [28] conducted a sensitivity analysis and found that both FAPAR and FAPARdif at the early growing stage were more affected by leaf area index (LAI), leaf angle distribution (LAD) and solar zenith angle (SZA) than those at other growing stages. These results showed that the effect of LAI varies with the change of landscape scale, while LAI played a more significant role in FAPAR than leaf biochemical variables at the canopy scale. This study also concluded that LAI accuracy directly influences performance of the retrieval physical model. Therefore, the LAI can be used as an important connecting variable in combining physical and other models. On the other hand, our previous studies focused on heavy metal stress monitoring by representative variables, such as LAI and weight of root (WRT), which was simulated by the World Food Study Model (WOFOST) and the data assimilation method [29,30]. The results showed that the method of assimilating LAI into the WOFOST model can simulate seasonal LAI accurately during rice growth period and can be used to calculate daily fraction of diffused incoming solar radiation (SKYL), which present the proportion of scattered radiation in solar incident radiation. However, our previous studies neglected to examine the variation of rice physiological functions, such as photosynthesis, which are affected by heavy metal stress. Hence, coupling the physical and WOFOST models was considered as a potential methodology to simulate seasonal FAPAR for assessing rice photosynthesis variation under heavy metal stress.
In this study, a coupling growth-canopy radiative transfer model based on the Leaf Optical Properties Spectra (PROSPECT) [31,32], Scattering by Arbitrarily Inclined Leaves Model (SAIL) [32] and the World Food Study Model (WOFOST) [30], was employed to calculate daily FAPAR during the rice growth period and described spatial-temporal variation in FAPAR under different levels of heavy metal stress. The connection between models was based on LAI and SKYL, which determined accuracy of retrieved FAPAR by the PROSAIL model. The objective of this study is to comprehensively analyze spatial-temporal variation in FAPAR based on the coupled model under different heavy metal conditions.

2. Materials and Methods

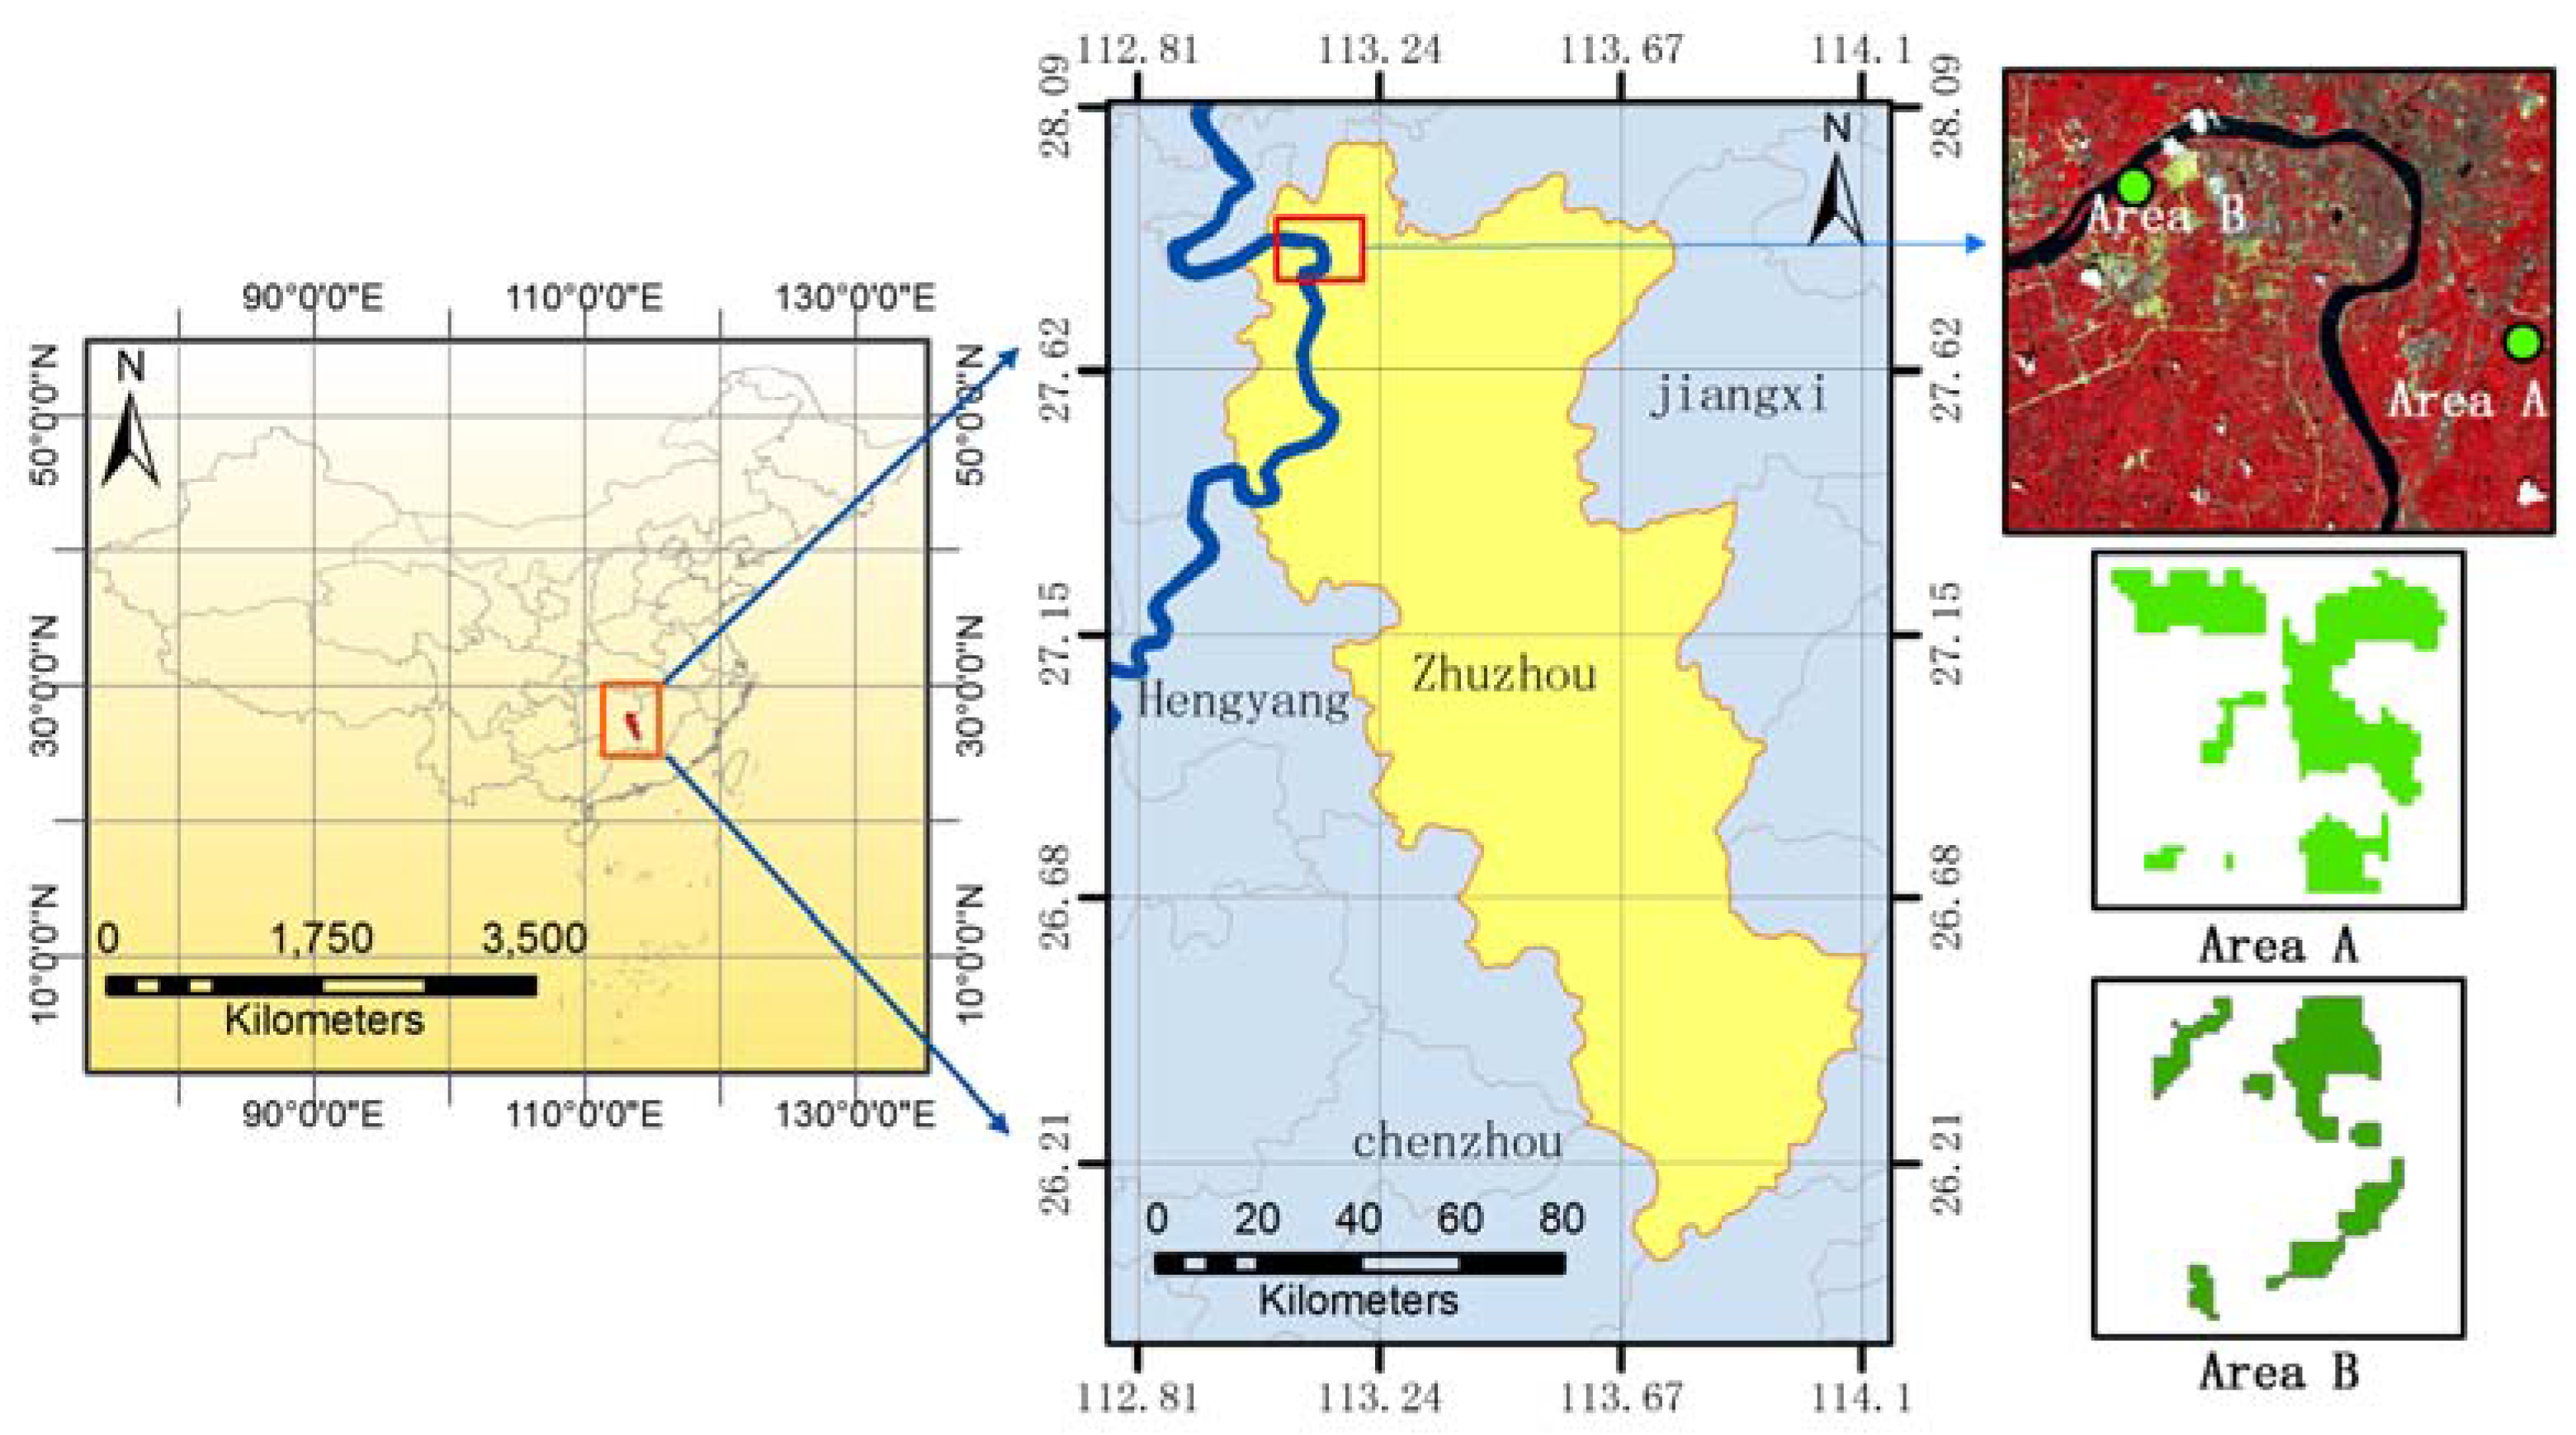
2.1. Study Area and Data

2.1.1. Study Area

The study area is located in Zhuzhou (112°17′–114°07′ E, 26°03′–28°01′ N), a city in Hunan Province of China, which is an old industrial base and important grain production region. The climate here is mostly humid, and there is sufficient sunshine for growing paddy rice from May to September. The annual average temperature is 16–18 °C and the average precipitation is about 1500 mm. The dominant soil texture is red soil with sufficient organic matter (2–3%). Rice and related varieties form the majority of crops grown in most of the farmland and are normally transplanted in early June and reaped in late September. However, the existence of several heavy industries, including metallurgy, machinery, electronics and chemical factories, has caused serious pollution by heavy metals in the Xiangjiang River basin. Accordingly, the Xiangjiang River and its tributaries have long been contaminated by industrial pollutants. Rice is susceptible to heavy metal pollution due to being river-irrigated. In this study, two large rice-growing areas (labeled A and B) were selected (Figure 1). Table 1 depicts the concentrations of major heavy metal types in soil and rice in the study areas. As shown in Table 1, the concentrations of heavy metals Cd, Hg, Pb and, as in area B, were higher than the background values. In correlation with these concentrations, the concentrations of heavy metal in rice tissues were at higher levels. According to the study area location and soil heavy metal concentrations measured using sampling tests, area A and B are classified as being at the “safe level” and “stress level”, respectively. Due to only small changes in topography and agricultural management, two rice-growing areas have similar climates, soil textures and water in the study area. Under normal circumstances, local farmers would provide sufficient nutrients, manure and irrigation water to ensure normal growth of rice without the impact of other environmental factors. Therefore, an assumption of this study is that the study area is subject to only heavy metal stress without other unintended stress caused by other environment factors.

2.1.2. Data Preparation
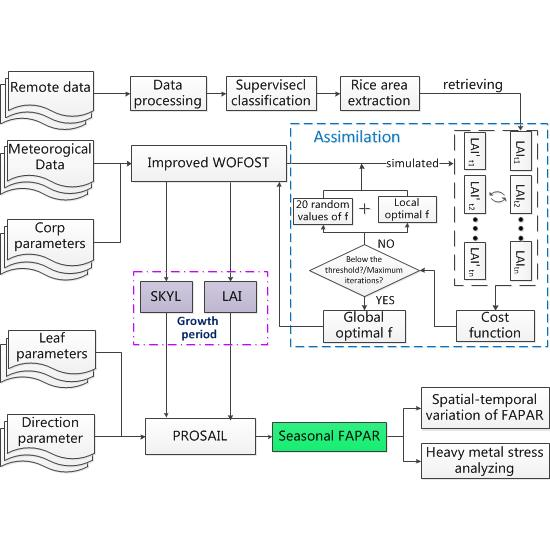
The experimental datasets included remote-sensing, meteorological and field-measured data. Remote-sensing images were used to retrieve LAI and meteorological data were used as input parameters for the crop growth model, while field measured data, including weight of rice tissue and content of heavy metals in soil and rice tissue, served as validation data.
To capture rice growth conditions during different growth periods, four 16 m multispectral GF-1 images (The first series of Chinese High Resolution Earth Observation System, GaoFen-1) were obtained from China Center For Resources Satellite Data and Application (http://218.247.138.121/DSSPlatform/index.html) and acquired on 27 June, 14 July, 3 August, 9 September, which corresponded to day 177, 194, 214, 251 of the year (DOY). These images were selected as remote-sensing data in this study. The GF-1 satellite is equipped with two 2 M panchromatic/8 M multispectral cameras and four 16 M wide-field imagers (WFI). The 16 M wide-field imagers have four bands of blue, green, red and near-infrared spectral wavelengths (B1: 0.45–0.52 μm, B2: 0.52–0.59 μm, B3: 0.63–0.69 μm, B4: 0.77–0.89 μm). For the GF-1 images, the digital values were converted into sensor radiance using calibration coefficients provided by the China Center for Resources Satellite Data and Application and using the radiometric calibration tool in ENVI5.3. Surface reflectance was retrieved using the Fast Line-of-Sight Atmospheric Analysis of Spectral Hyper-cubes (FLAASH) model. The tropical atmospheric model was selected by study area and flight time was used in atmospheric correction of GF-1 images. After radiometric calibration, geometric correction was completed to generate orthorectified images through the rational polynomial coefficient (RPC) ortho-rectification tool with a digital elevation model (DEM) file in ENVI5.3. The two rice fields in the study area were extracted by visual interpretation and supervised classification.
Three field campaigns were carried out in 2015 during the entire rice growth season on 17 July, 5 August and 25 August, which corresponded to the jointing-booting, heading-flowering and ripening stages of rice growth, respectively. In each area, 20 randomly distributed sample plots were selected for field measurement, which were located using the global positioning system (GPS). The field campaign acquired soil and rice parameters, including non-destructive measurements and destructive sampling. For destructive sampling, 5–10 plants and a handful of soil were randomly selected around the sample plots. The organs of rice plants (including roots) were completely dried at room temperature to obtain dry weight. The rice root and aboveground parts were then separated to measure weight and heavy metal content. Meanwhile, the soil samples were dried for measurement of heavy metal content. The concentrations of heavy metals in rice and soil were estimated using an atomic absorption spectrophotometer (AAS, spectr AA 110/220, Varian, City, CA, USA) at the Chinese Academy of Agricultural Sciences. Non-destructive LAI in two study areas were measured using a botanical canopy analyzer (AccuPAR model LP-80, Manufacturer, City, US State abbrev. if applicable, Country) at five random positions in each sample plot. Leaf chlorophyll was determined using a SPAD-502 portable chlorophyll meter (Minolta Corporation, Ramsey, NJ, USA). In the meantime, the photosynthetically active radiation (PAR) was measured above and below the canopies.
In the field, FAPAR is usually substituted with the fraction of intercepted photosynthetically active radiation (FIPAR), which is calculated from PAR measurements above and below the canopy as follows [33,34,35]:
FIPAR = PAR above PAR below PAR above
Generally, assuming 5% of intercepted light is reflected or absorbed by non-photosynthetic tissues when the canopy is completely green, FAPAR was calculated using field FIPAR [35].
The meteorological data, including daily maximum temperature, minimum temperature, early morning vapour pressure, mean daily windspeed at 10 m and hours of sunshine, were obtained from the China Meteorological Data Sharing Service System.

2.2. Methods

In this study, we combined the PROSAIL and WOFOST models to obtain reliable and actual FAPARs during the growth season of rice through the crucial variable LAI, SKYL. Meanwhile, in the simulation of the rice growth process under heavy metal stress, we used particle swarm optimization algorithm (PSO) to assimilate LAI into the WOFOST model to ensure the LAI simulations were close to the actual LAI. Figure 2 shows process of estimating daily FAPAR of the rice growth season.

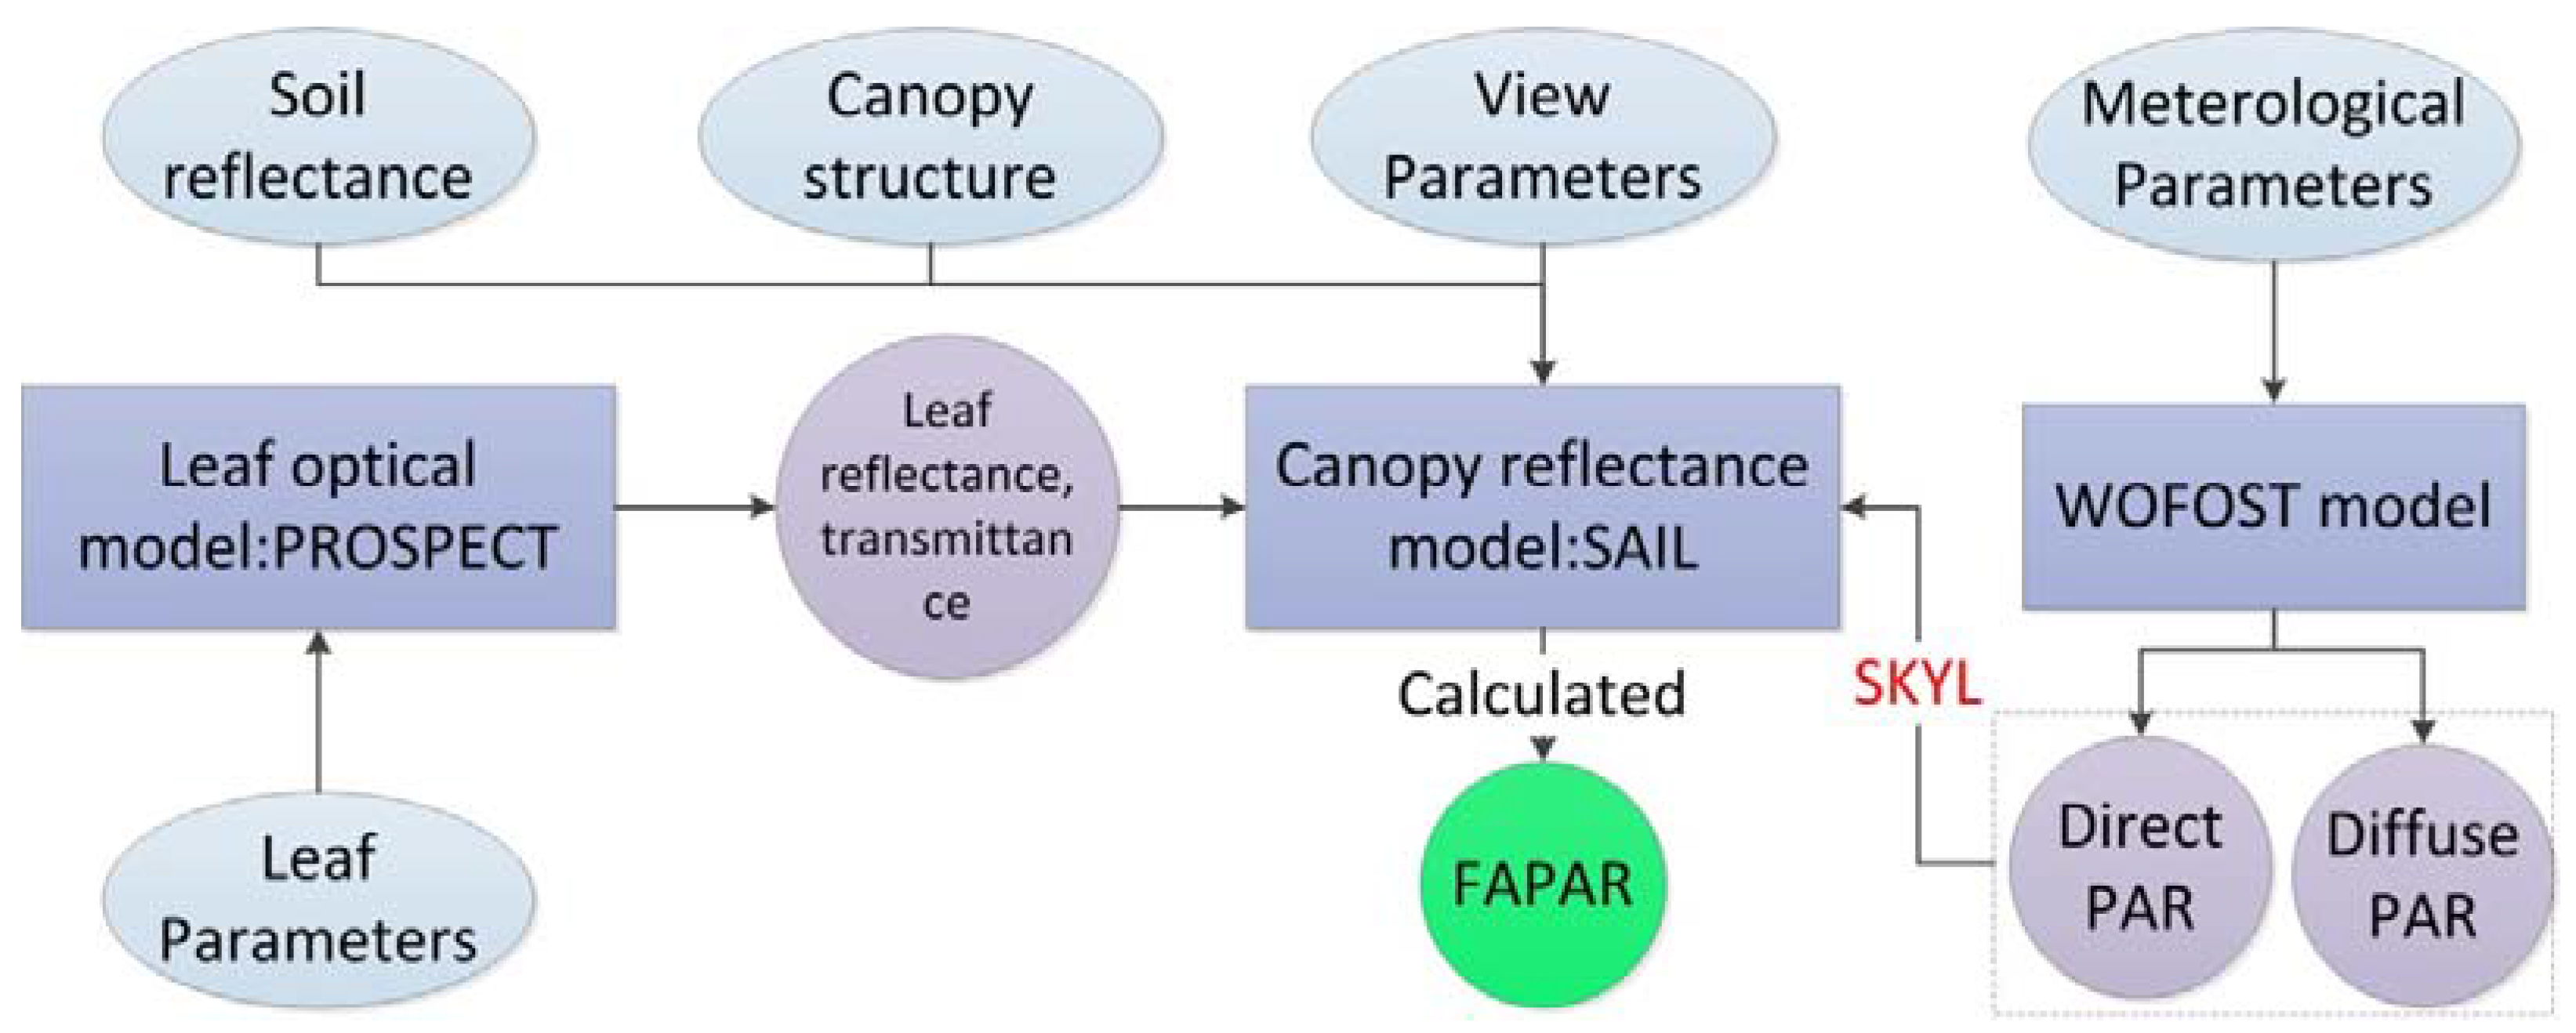
2.2.1. FAPAR Calculation Based on PROSAIL Model

The PROSAIL model is a coupled model of the PROSPECT leaf optical properties model and the 4SAIL canopy bi-directional reflectance model, which is widely applied to simulated canopy reflectance for a range of biochemical and biophysical variables. This model uses the output parameters of the PROSPECT model as input parameters for the 4SAIL model. The PROSPECT model simulates the direction of hemispherical reflectance and transmittance on the leaf scale at a wavelength range of 400–2500 nm. The model was developed based on the generalized plate model from Allen and requires six input parameters, including the leaf mesophyll structure parameter (Ns), leaf chlorophyll a and b content (Cab), leaf equivalent water thickness(Cw), dry matter content(Cm), leaf brown pigment content (Cbr) and carotenoid content (Car) [31]. The 4SAIL model inputs canopy and external parameters and simulates bi-directional reflectance at the canopy scale. The canopy parameters include LAI, average leaf angle (ALA), hotspot parameters (hotspot) and soil brightness parameters (Psoil). The external parameters consist of the fraction of diffused incoming solar radiation (SKYL), sun zenith angle (SZA), sensor zenith angles (VZA) and azimuth angle between the sun and the sensor (RAA), respectively [32].
FAPAR is the fraction of PAR absorbed by a green canopy and is derived from PROSAIL by the law of conservation of energy [36]. Based on the Four-Stream Radiative Transfer theory developed by Verhoef and Bach [37], the FAPAR, FAPARdir and FAPARdif are calculated from PROSAIL simulations in this study (Figure 3). The direct and diffuse directional transmittance and reflectance calculated by PROSAIL are first considered in order to assess the absorption efficiency of light by the canopy. Meanwhile, multiple scattering effects caused by the interaction between the canopy and background soil need to be considered in the calculation. The equations for calculating the FAPAR, FAPARdir and FAPARdif are as follows [37]:
α s * = α s + τ ss γ sd + τ sd γ dd 1 γ dd ρ dd b α d ,
α d * = α d + τ dd γ dd 1 γ dd ρ dd b α d ,
α s = 1 ρ sd τ sd τ ss ,
α d = 1 ρ dd τ dd ,
FAPAR = λ 400 λ = 700 ( α s * E d i r t + α d * E d i f t ) λ 400 λ = 700 ( E d i r t + E d i f t ) = FAPAR d i r + FAPAR d i f ,
where α s * and α d * are canopy absorptance for direct solar incident flux ( E d i r t ) and hemispherical diffuse incident flux( E d i f t ), respectively; α s and α d represent absorbance of the isolated canopy layer for solar and hemispherical diffuse incident flux, respectively; γ dd and γ sd are the bi-hemispherical factor and the directional–hemispherical factor over the surroundings, respectively; τ ss and τ sd are the direct transmittance and directional-hemispherical transmittance for solar flux, respectively; ρ dd and ρ sd represent the bi-hemispherical reflectance at top-of-canopy and directional–hemispherical reflectance for solar flux, respectively; ρ dd b is the bi-hemispherical reflectance at the bottom-of-canopy.

2.2.2. LAI Assimilation into the WOFOST Model

The LAI is a crucial output parameter in the WOFOST model as it represents the crop’s growth status and ability to absorb light. The LAI retrieved from GF-1 images were assimilated into the improved WOFOST model in order to simulate the actual LAI of rice growth period (Figure 2). In previous studies, a variety of methods were developed for retrieving LAI from remote sensing data, among which the most widely and earliest used method is the normalized difference vegetation index (NDVI) [5,38]. Although some studies suggest that NDVI will be saturated when the LAI is high, our study chose NDVI to retrieve the rice LAI as the LAI of our study area is no higher than 7 according to prior knowledge [39]. Using the field data, the exponential function calculating the relationship between measured LAI and NDVI was determined as follows:
LAI = 0.361 × e 3.69 NDVI
The determination coefficient (R2) of the exponential function is 0.84 and the mean square of residual is 0.06. The NDVI spatial distributions were obtained on three separate occasions through GF-1 images and the LAI spatial distribution of all acquired data was calculated using Equation (7). When the empirical model was calculated, the other land-use regions were excluded in the study area during the processing of remote sensing data.
The WOFOST model is a dynamic and interpretative model that simulates the annual growth of crop at a daily time-step under specific soil and climate conditions. The model can be implemented under three levels: (1) the potential productivity level, in which the solar radiation and temperature are the main factors limiting the crop growth; (2) the water-limited level; and (3) the nutrients-limited level. In this study, we used the improved WOFOST model under the potential productivity level, which embedded the parameter of “stress factor” to simulate the daily LAI over the course of the season at different levels of heavy metal stress [40]. The improved WOFOST has better performance than the normal version without the ‘stress factor’ in reliably simulating rice LAI under heavy metal pollution [5,38]. Based on our previous studies, the stress factor corresponds to the daily total gross assimilation of CO2 and the range of the stress factor is from 0.7 to 1, which represents serious heavy metal stress and no stress, respectively. However, the stress factor is difficult to acquire and we selected the method of assimilating LAI into the WOFOST model to obtain the optimal stress factor [40]. The assimilation processes for adjusting the stress factor were implemented using a particle swarm optimization algorithm (PSO), which continued until the difference between simulated and retrieved LAI was minimized. The difference was calculated using a cost function as follows:
C = 1 N i = 1 N ( LAI Ri LAI Si ) 2 ,
where N is the number of images in the entire growing season,   LAI Si is the simulated LAI by WOFOST model at the time of image acquisition, and LAI Ri is the retrieved LAI from GF-1 data. The process of assimilated LAI into WOFOST can be roughly divided into four steps. Firstly, LAI was retrieved by remote sensing images, which is corresponded to different rice growth periods. Secondly, the WOFOST model was initialized to simulate the LAI in the whole growth season, with a step size of one day. Then, the cost function was calculated based on inversed and estimated LAI values at the corresponding time. Finally, if the cost function does not meet the condition, the initial stress factor is continually adjusted until the simulated LAI reached the best agreement with inversed LAI. The improved WOFOST model and assimilation is described in detail with reference to previous studies [3,5,40].

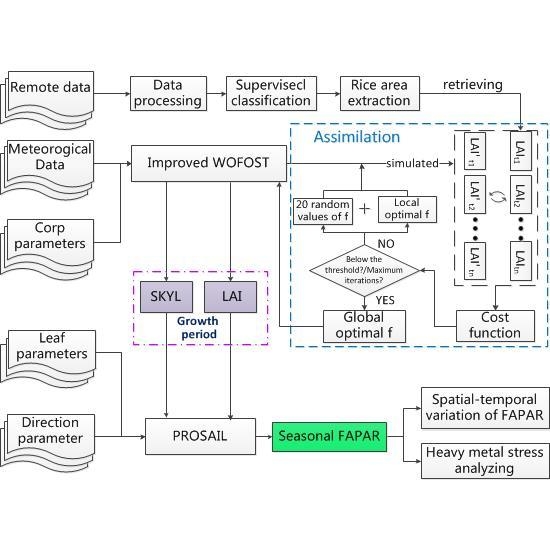
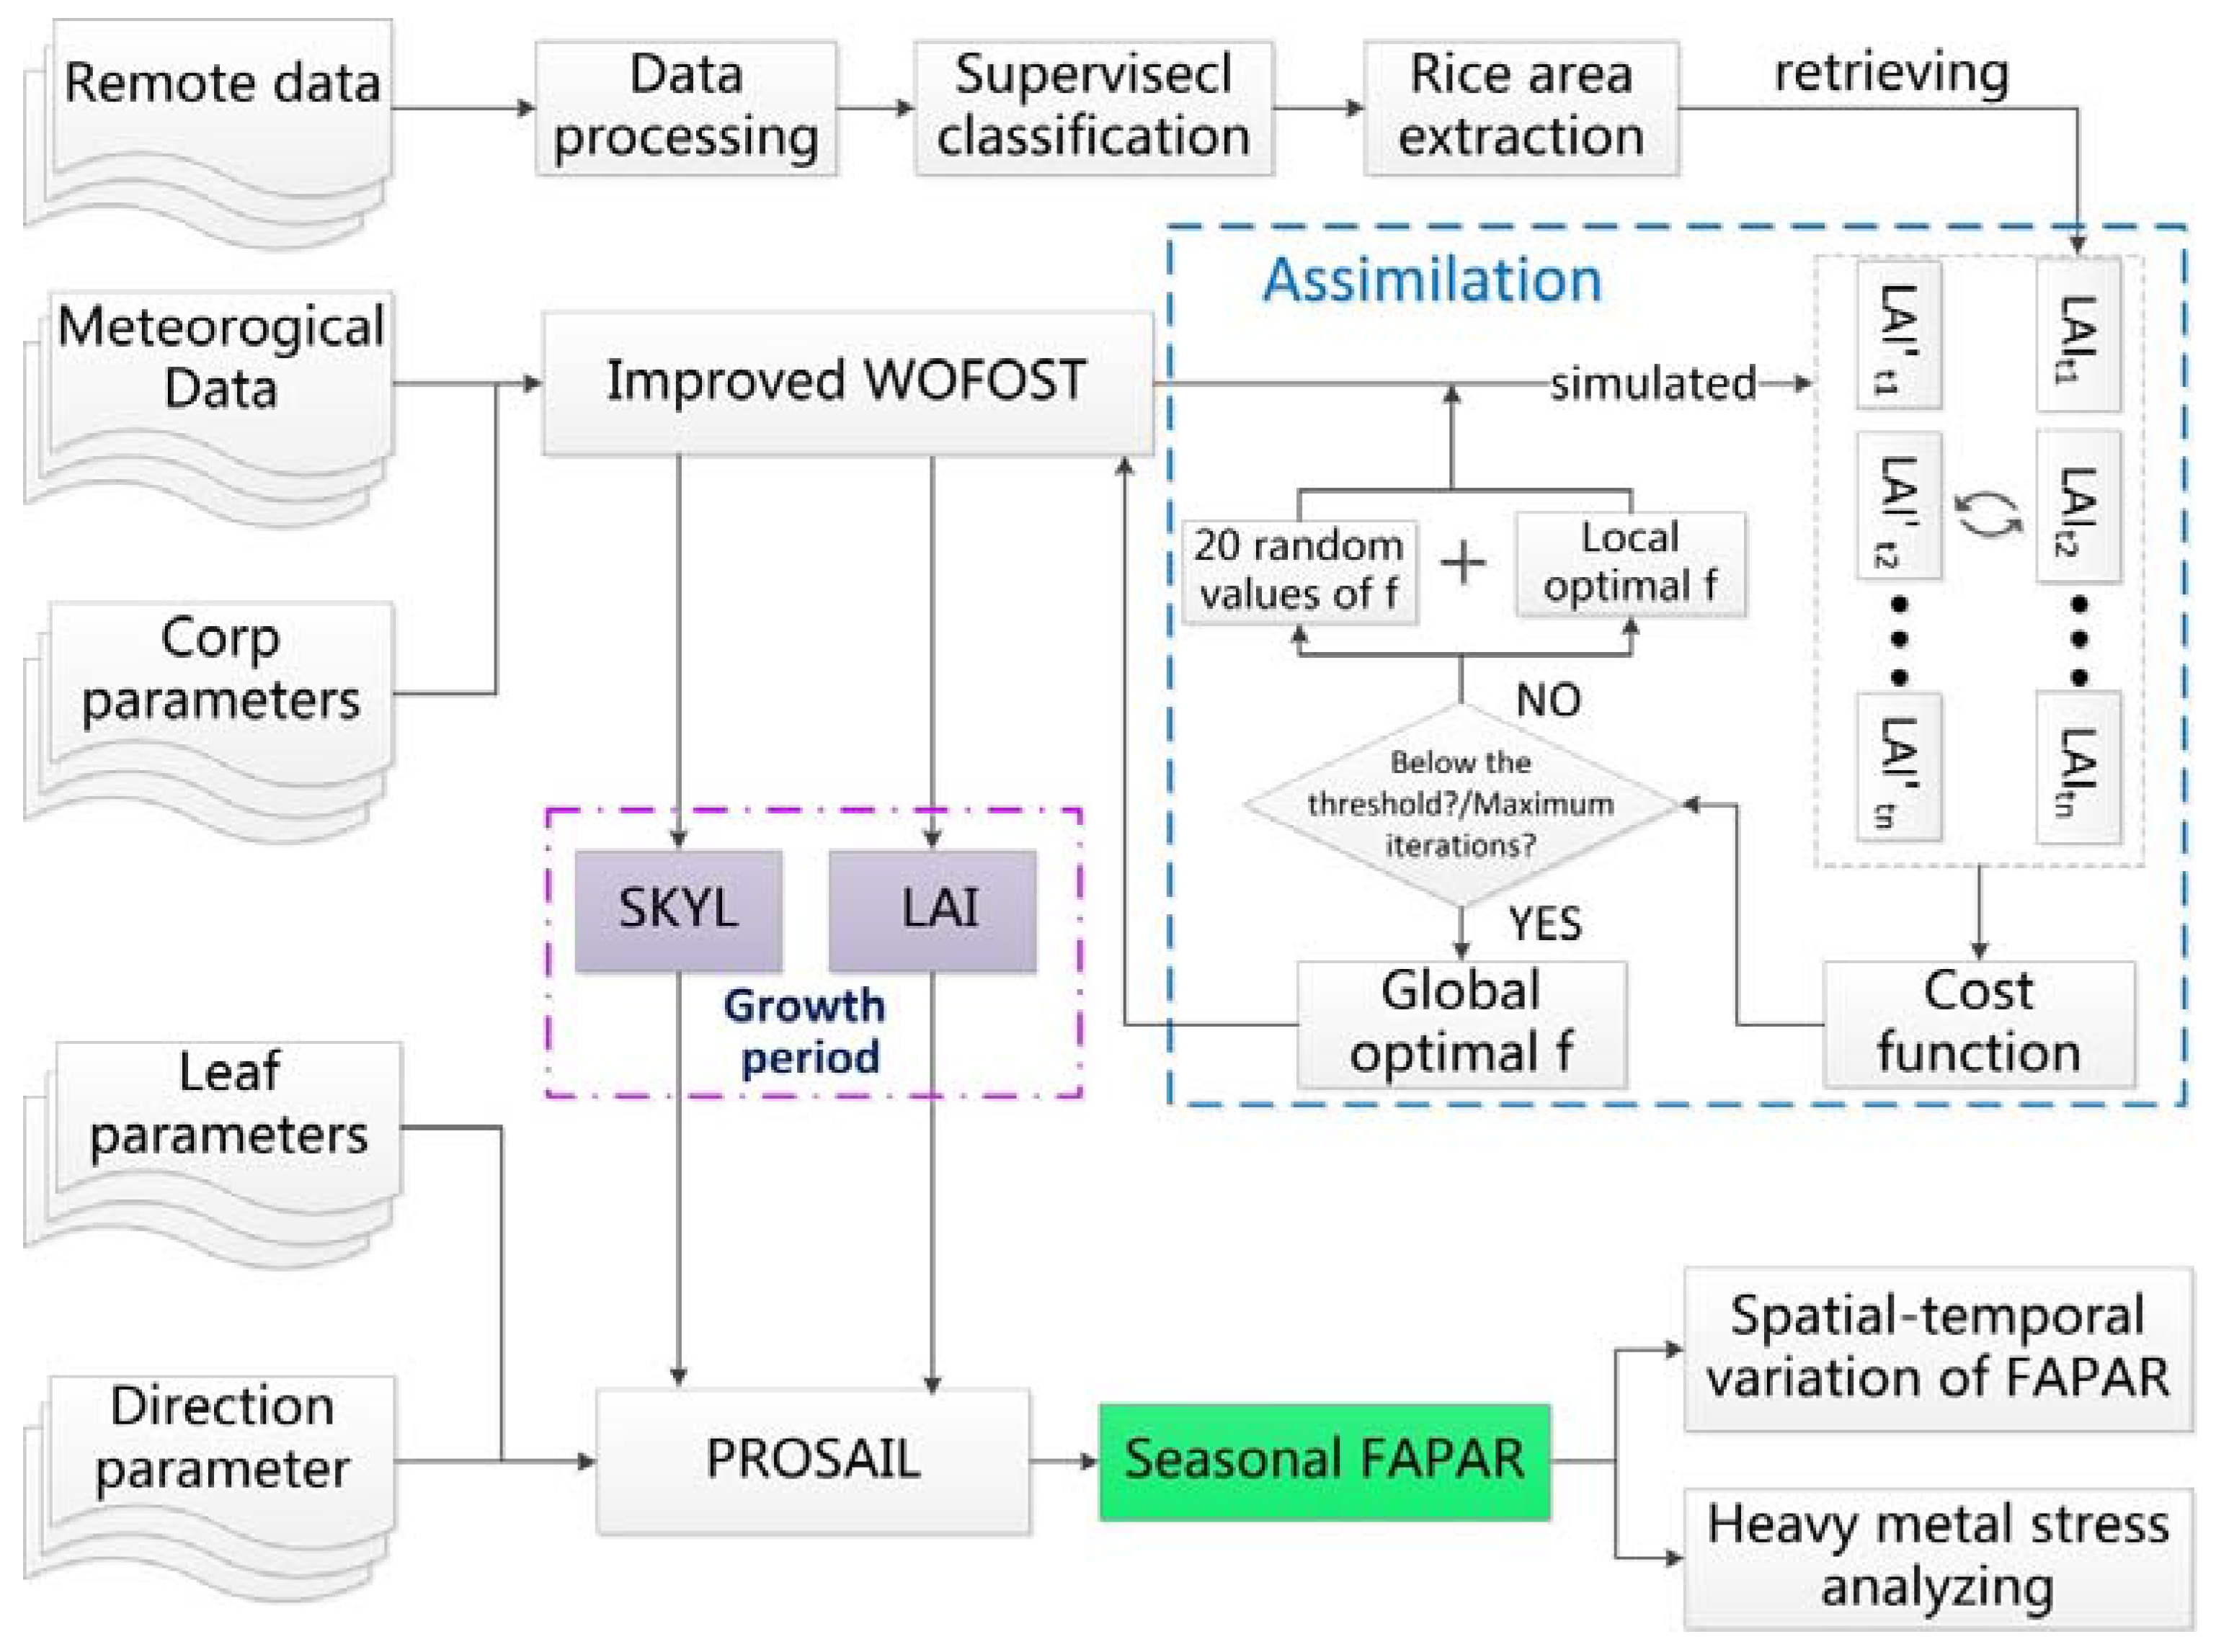
2.2.3. Simulation of Seasonal Dynamics of FAPAR

To obtain the daily FAPAR of the rice growth period, we established a connection between the PROSAIL and WOFOST model. Namely, the LAI and SKYL, which are simulated from the WOFOST model, input into the PROSAIL model (Figure 2). In this study, the LAI during the rice growing season and daily SKYL were simulated by the WOFOST model and meteorological data. The input parameters of the WOFOST model were set according to previous literature [5,38,40,41], and the primary parameters are shown in Table 2. In the input parameters of the PROSAIL model, the sun zenith angle (SZA), sensor zenith angles (VZA) and azimuth angle between the sun and the sensor (RAA) were consistent with remote sensing data acquired in rice growth period. Aside from the daily LAI and SKYL, the setting of other parameters was fixed according to the LOPEX93 and previous studies [42,43,44]. Detailed information about the setting of parameters is shown in Table 3. FAPAR simulations during rice growing season were obtained from the coupled model, which consisted of PROSAIL and WOFOST models (Figure 2). In the experimental area, each pixel represents a sample point where the LAI and SKYL during rice growth period was simulated by the WOFOST model and the FAPAR was calculated by the coupled model.

3. Results

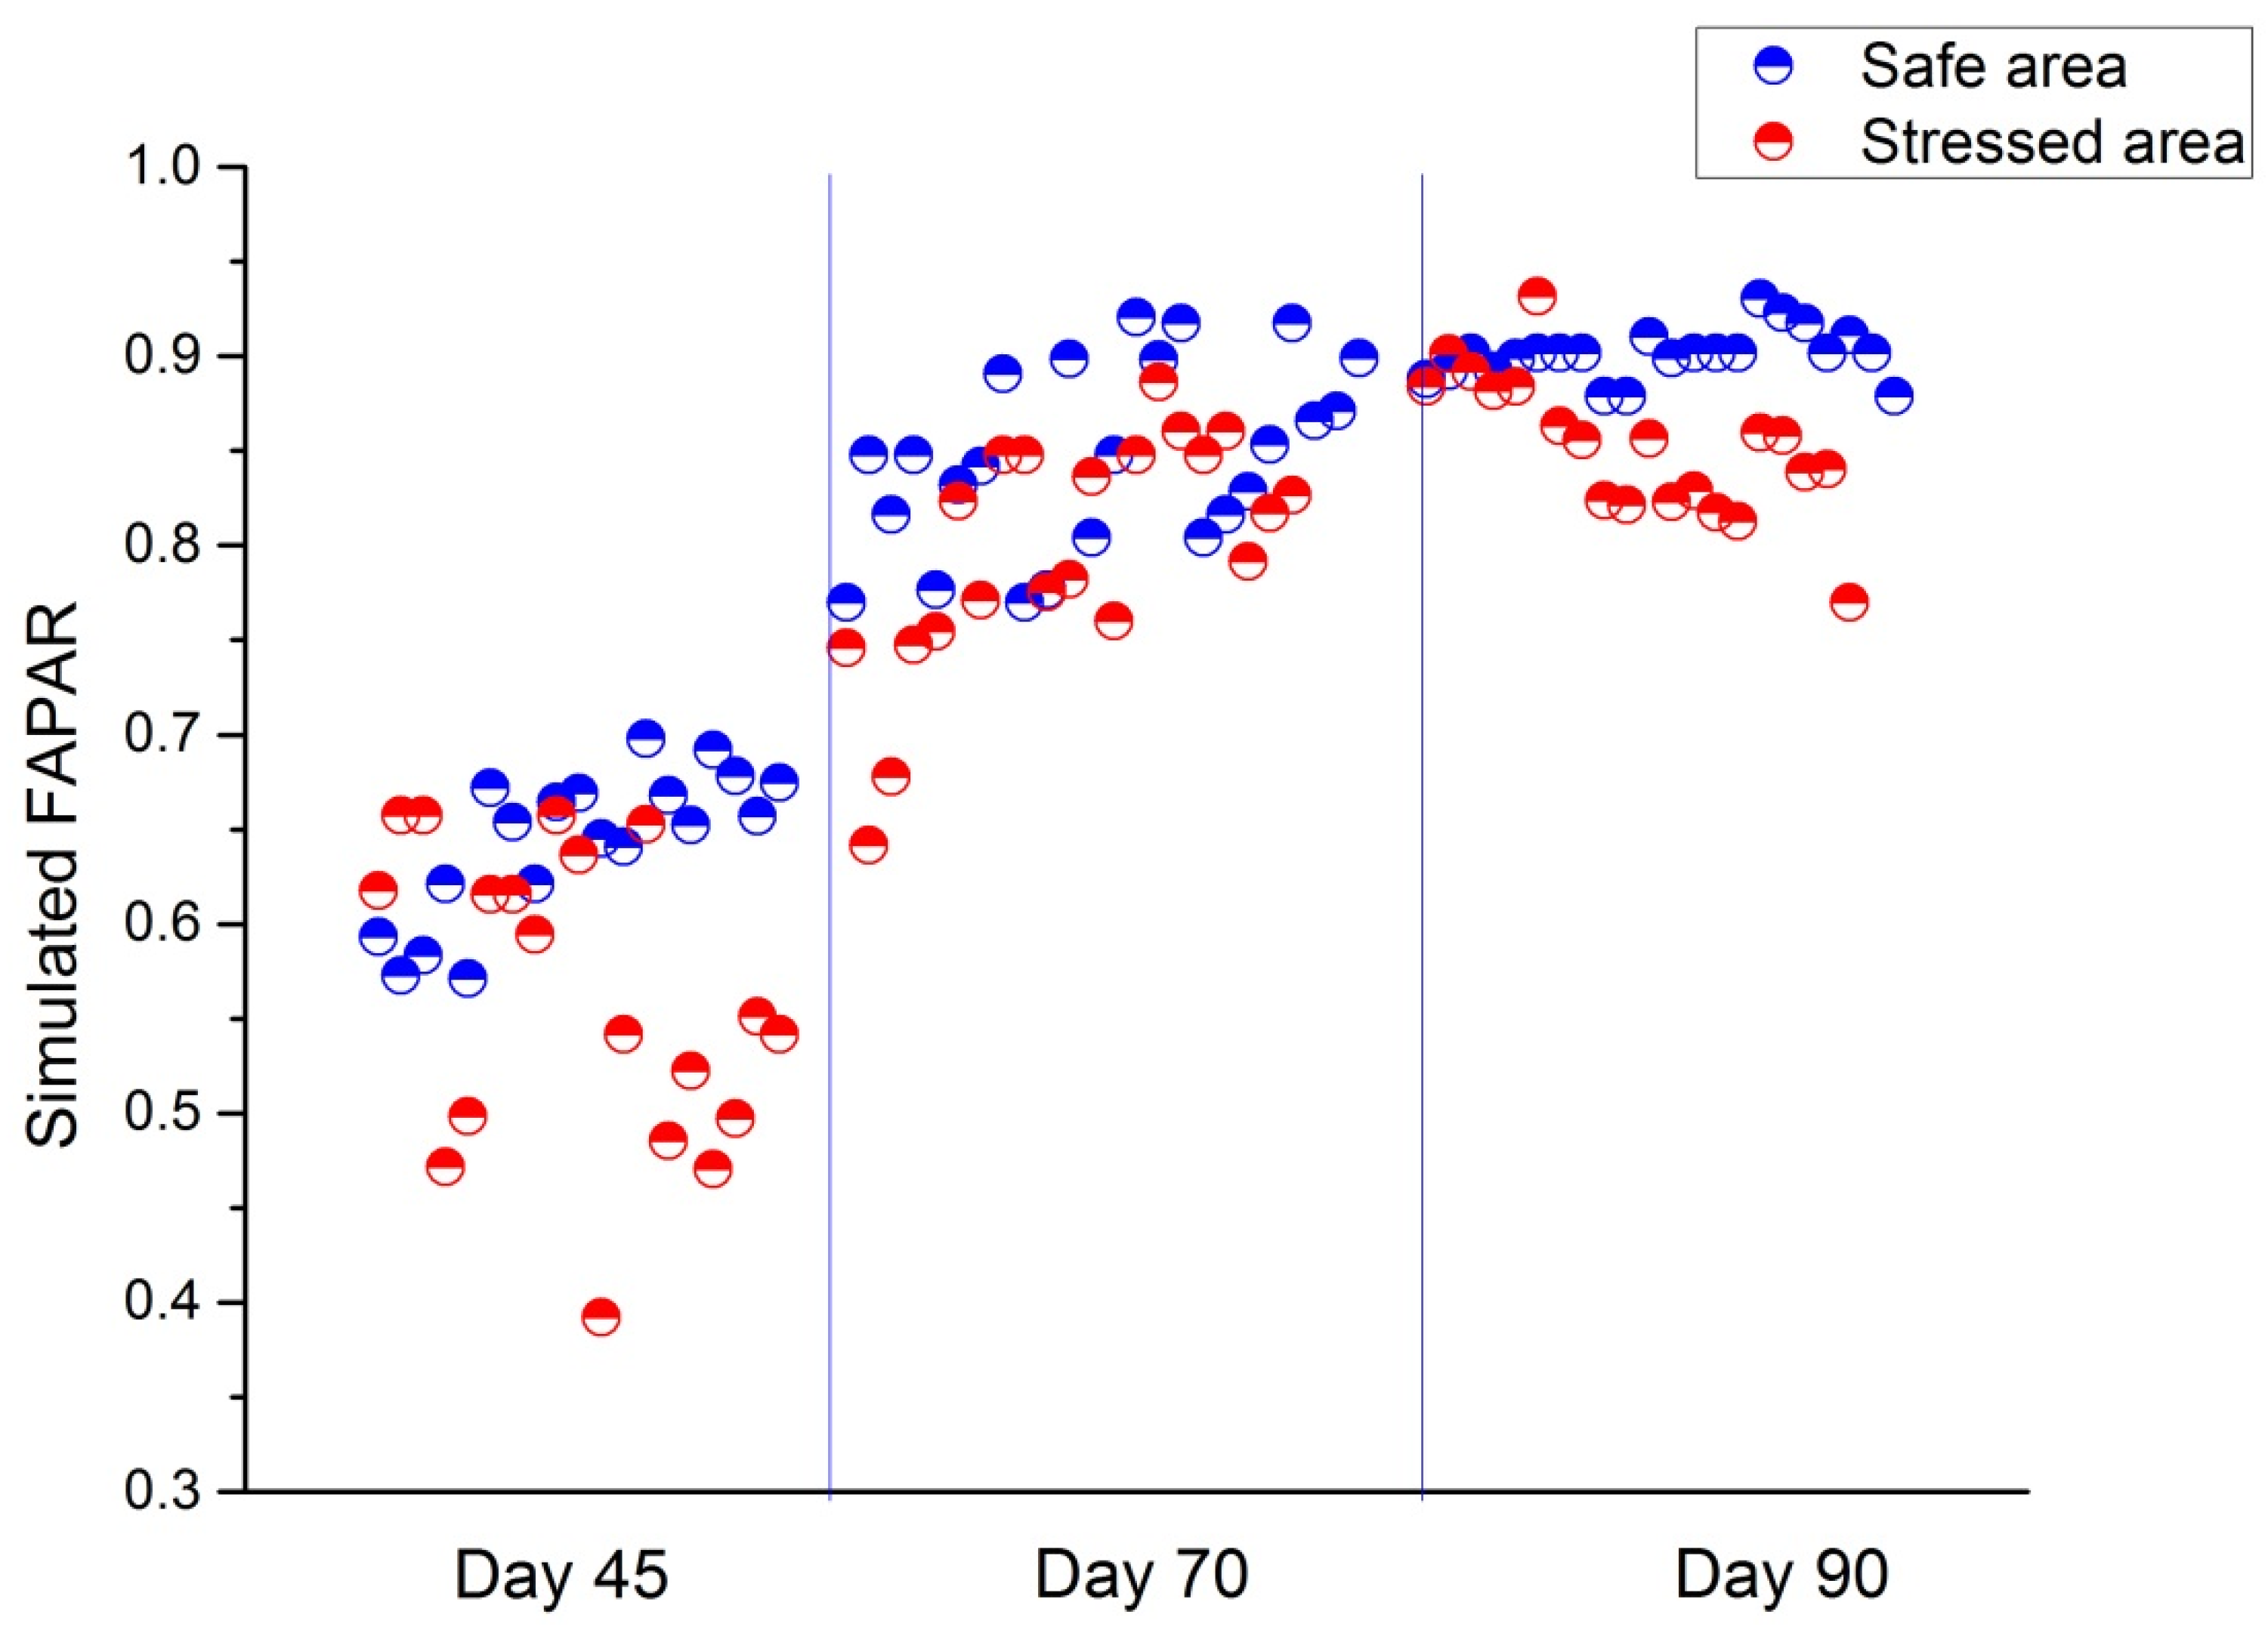
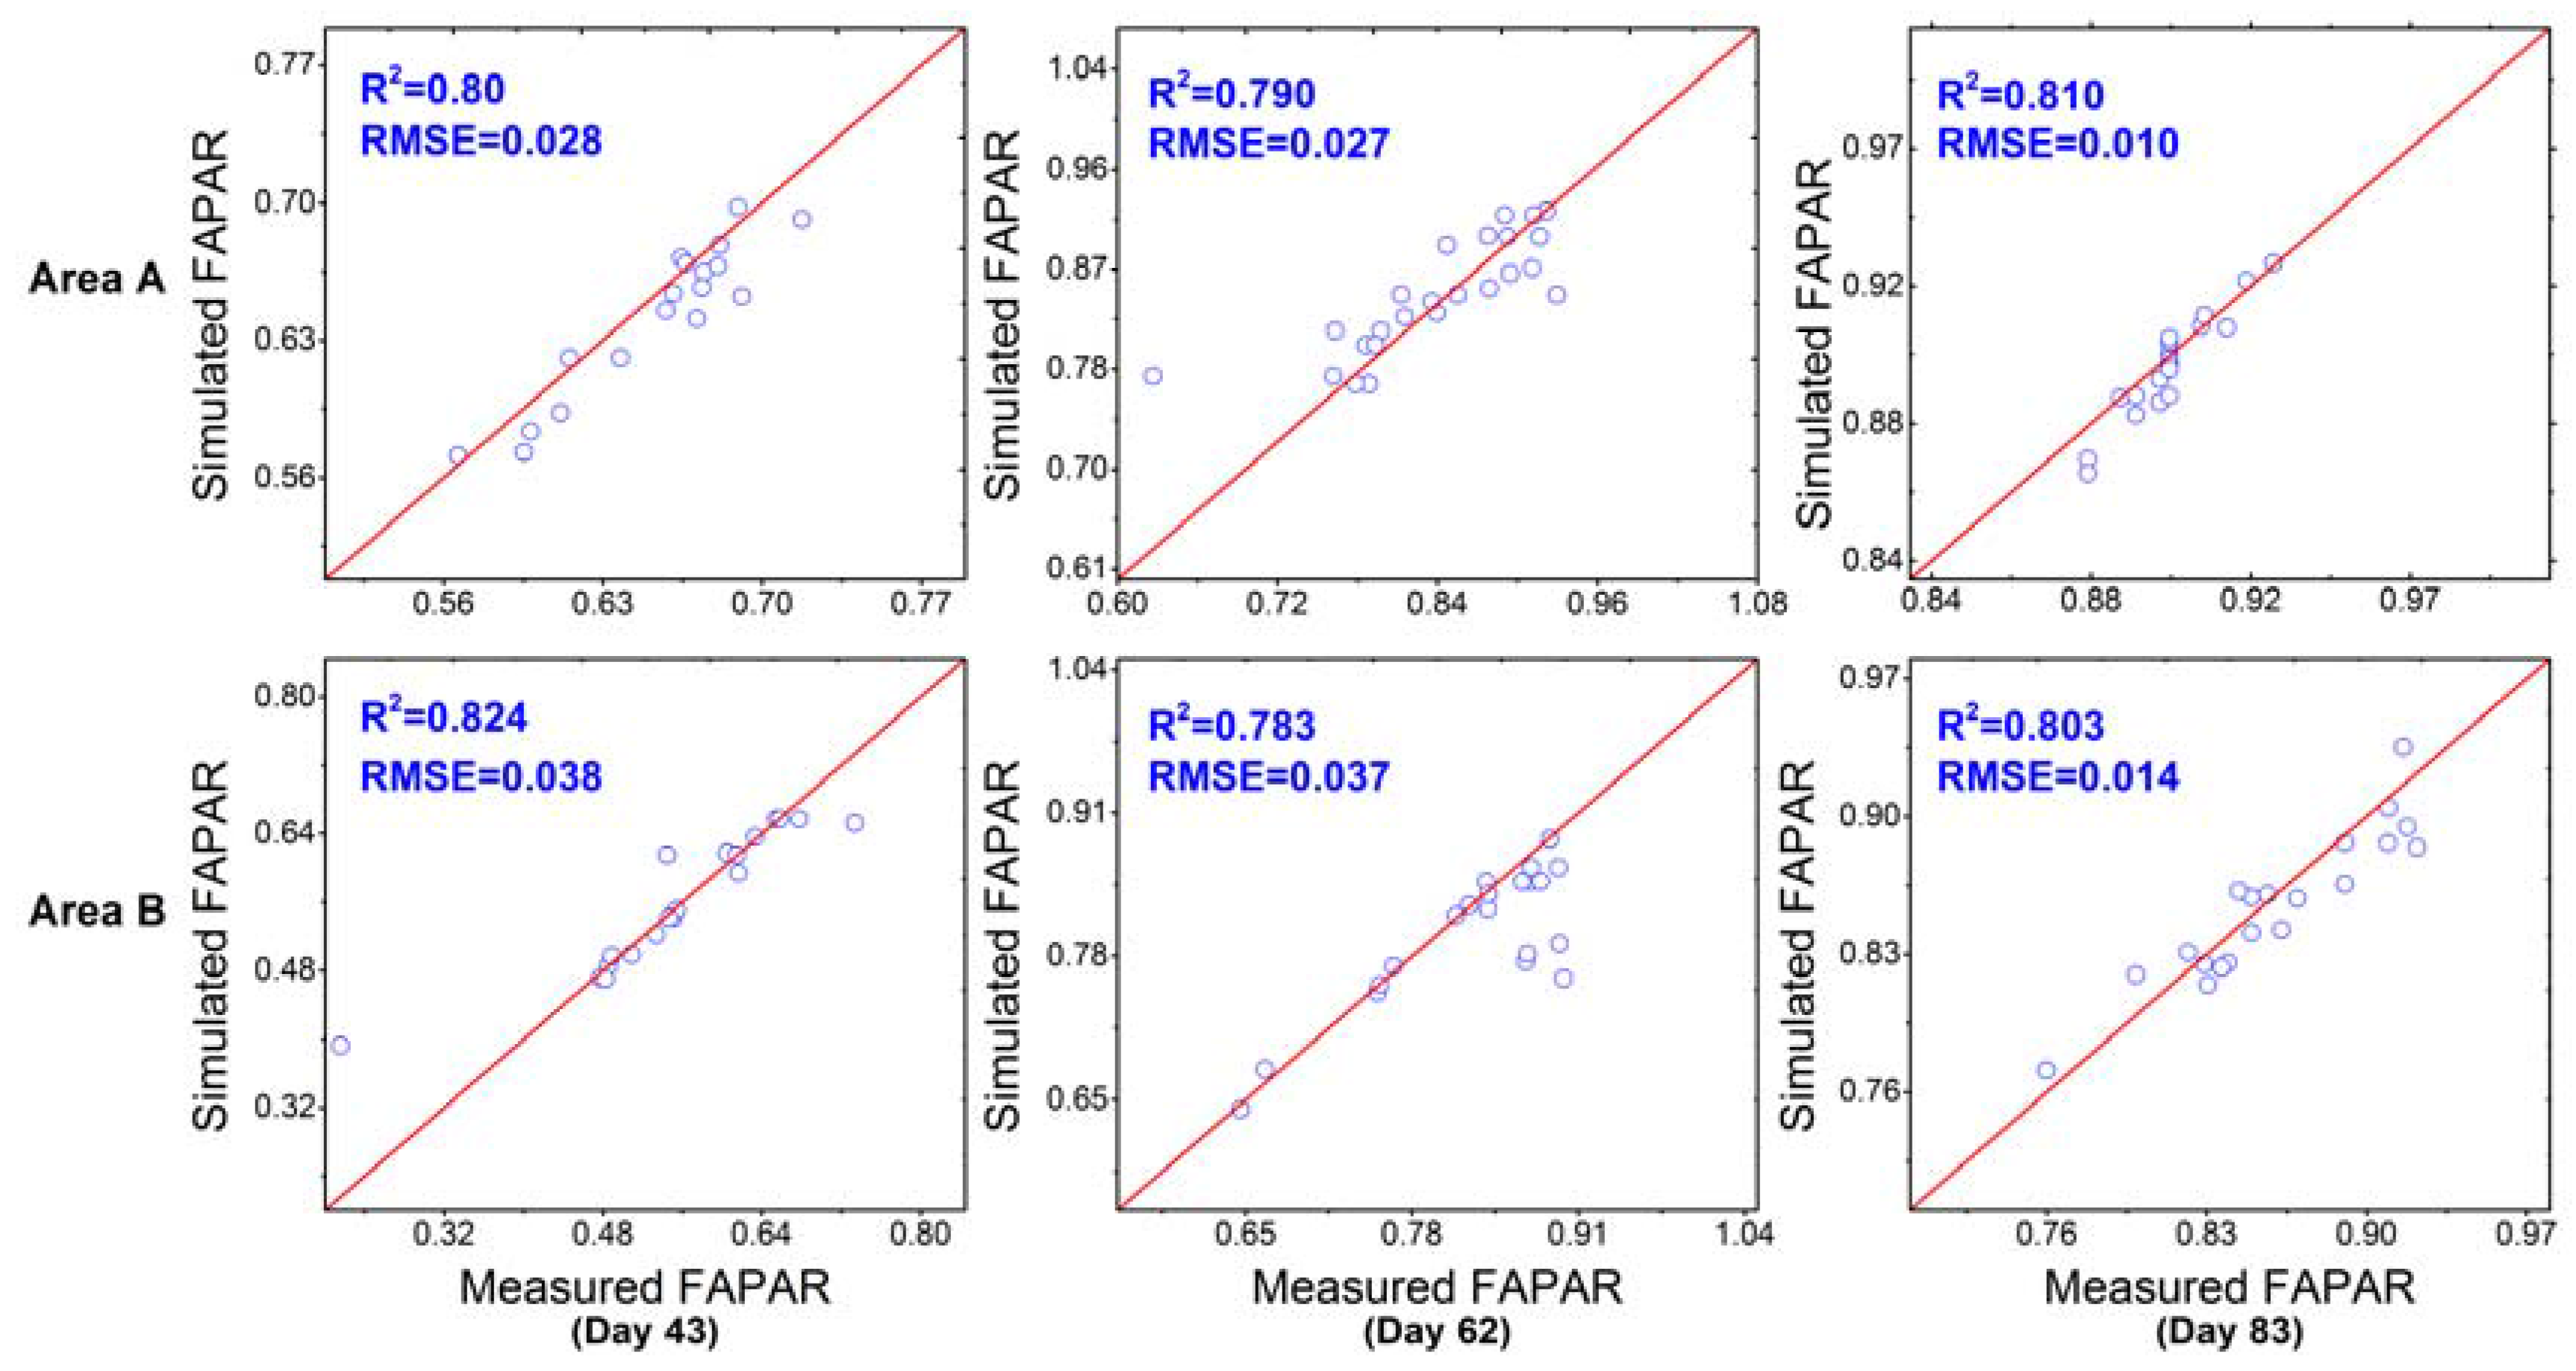
3.1. Validation of FAPAR

In three field campaigns, 20 sampling points were randomly selected for measuring the FAPAR of rice at each experimental area. According to the time measured in the field, the simulated value was selected as the FAPAR of the pixel whose position was approximately consistent with the sampling point using the PROSAIL model. An obvious distinction is observed between the two pollution levels (Figure 4). The correlation between the simulated and measured values was analyzed. With the growth of rice, the relationship between simulated and measured values has a similar pattern under different levels of heavy metal stress. In study area A, the R2 at three corresponding dates were 0.800, 0.790 and 0.810, respectively. The R2 in study area B were 0.824, 0.783 and 0.803 (Figure 5). All root mean square error (RMSE) values are less than 0.05.
Based on the above analysis, the simulated and measured values have a high correlation. This suggests that the coupled model consisting of PROSAIL and WOFOST is an effective tool for FAPAR calculation.

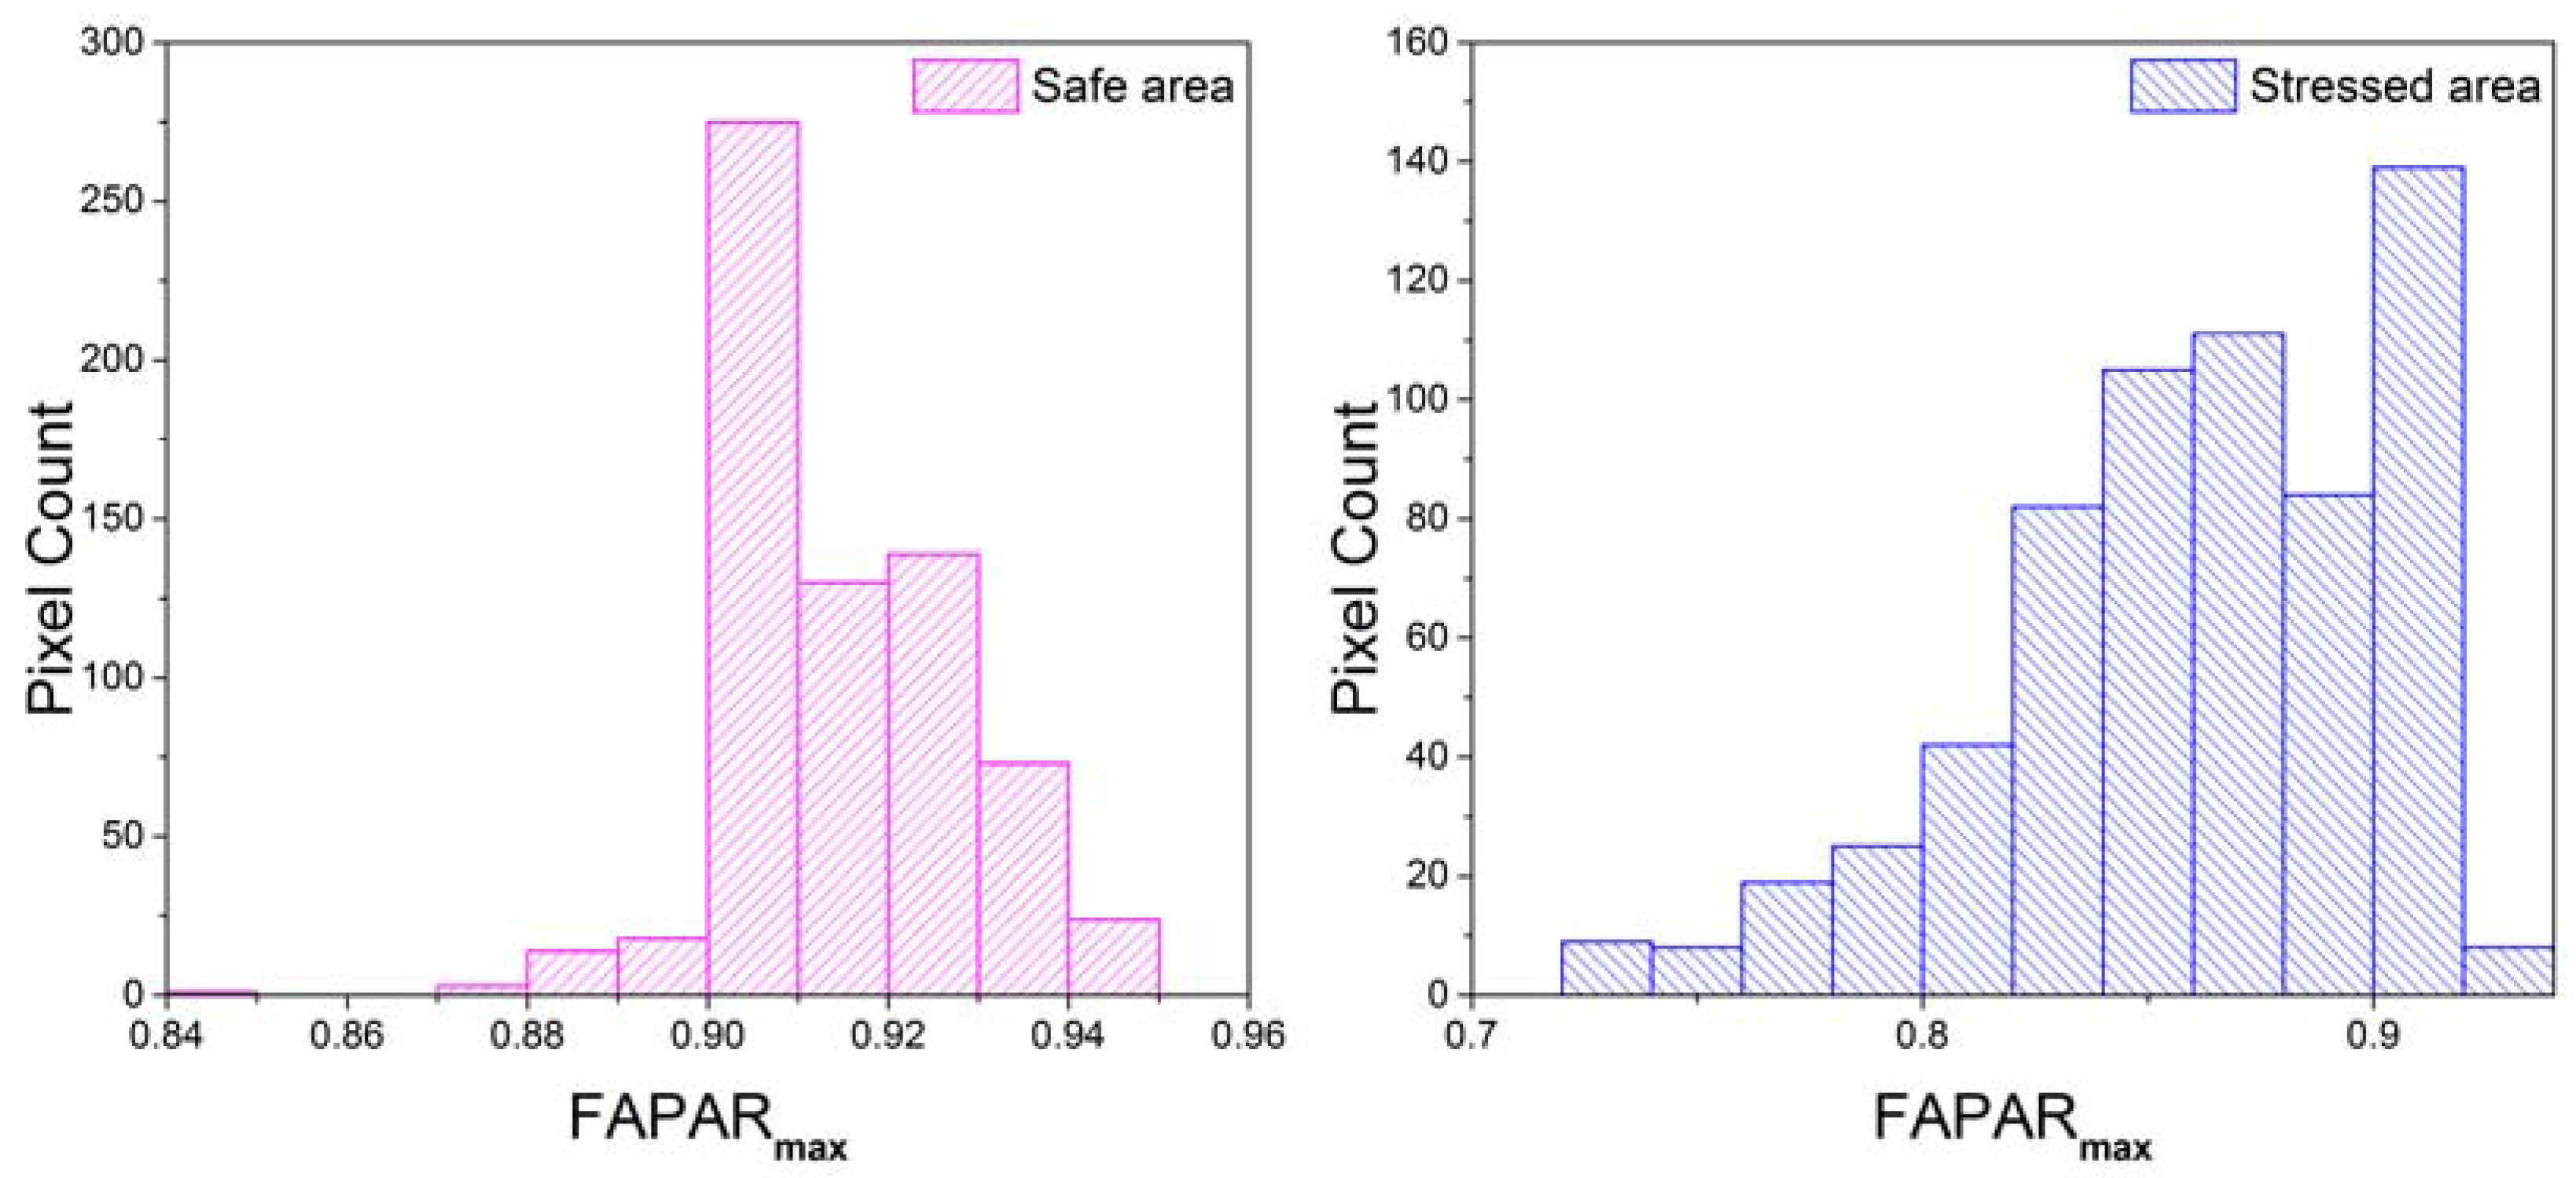
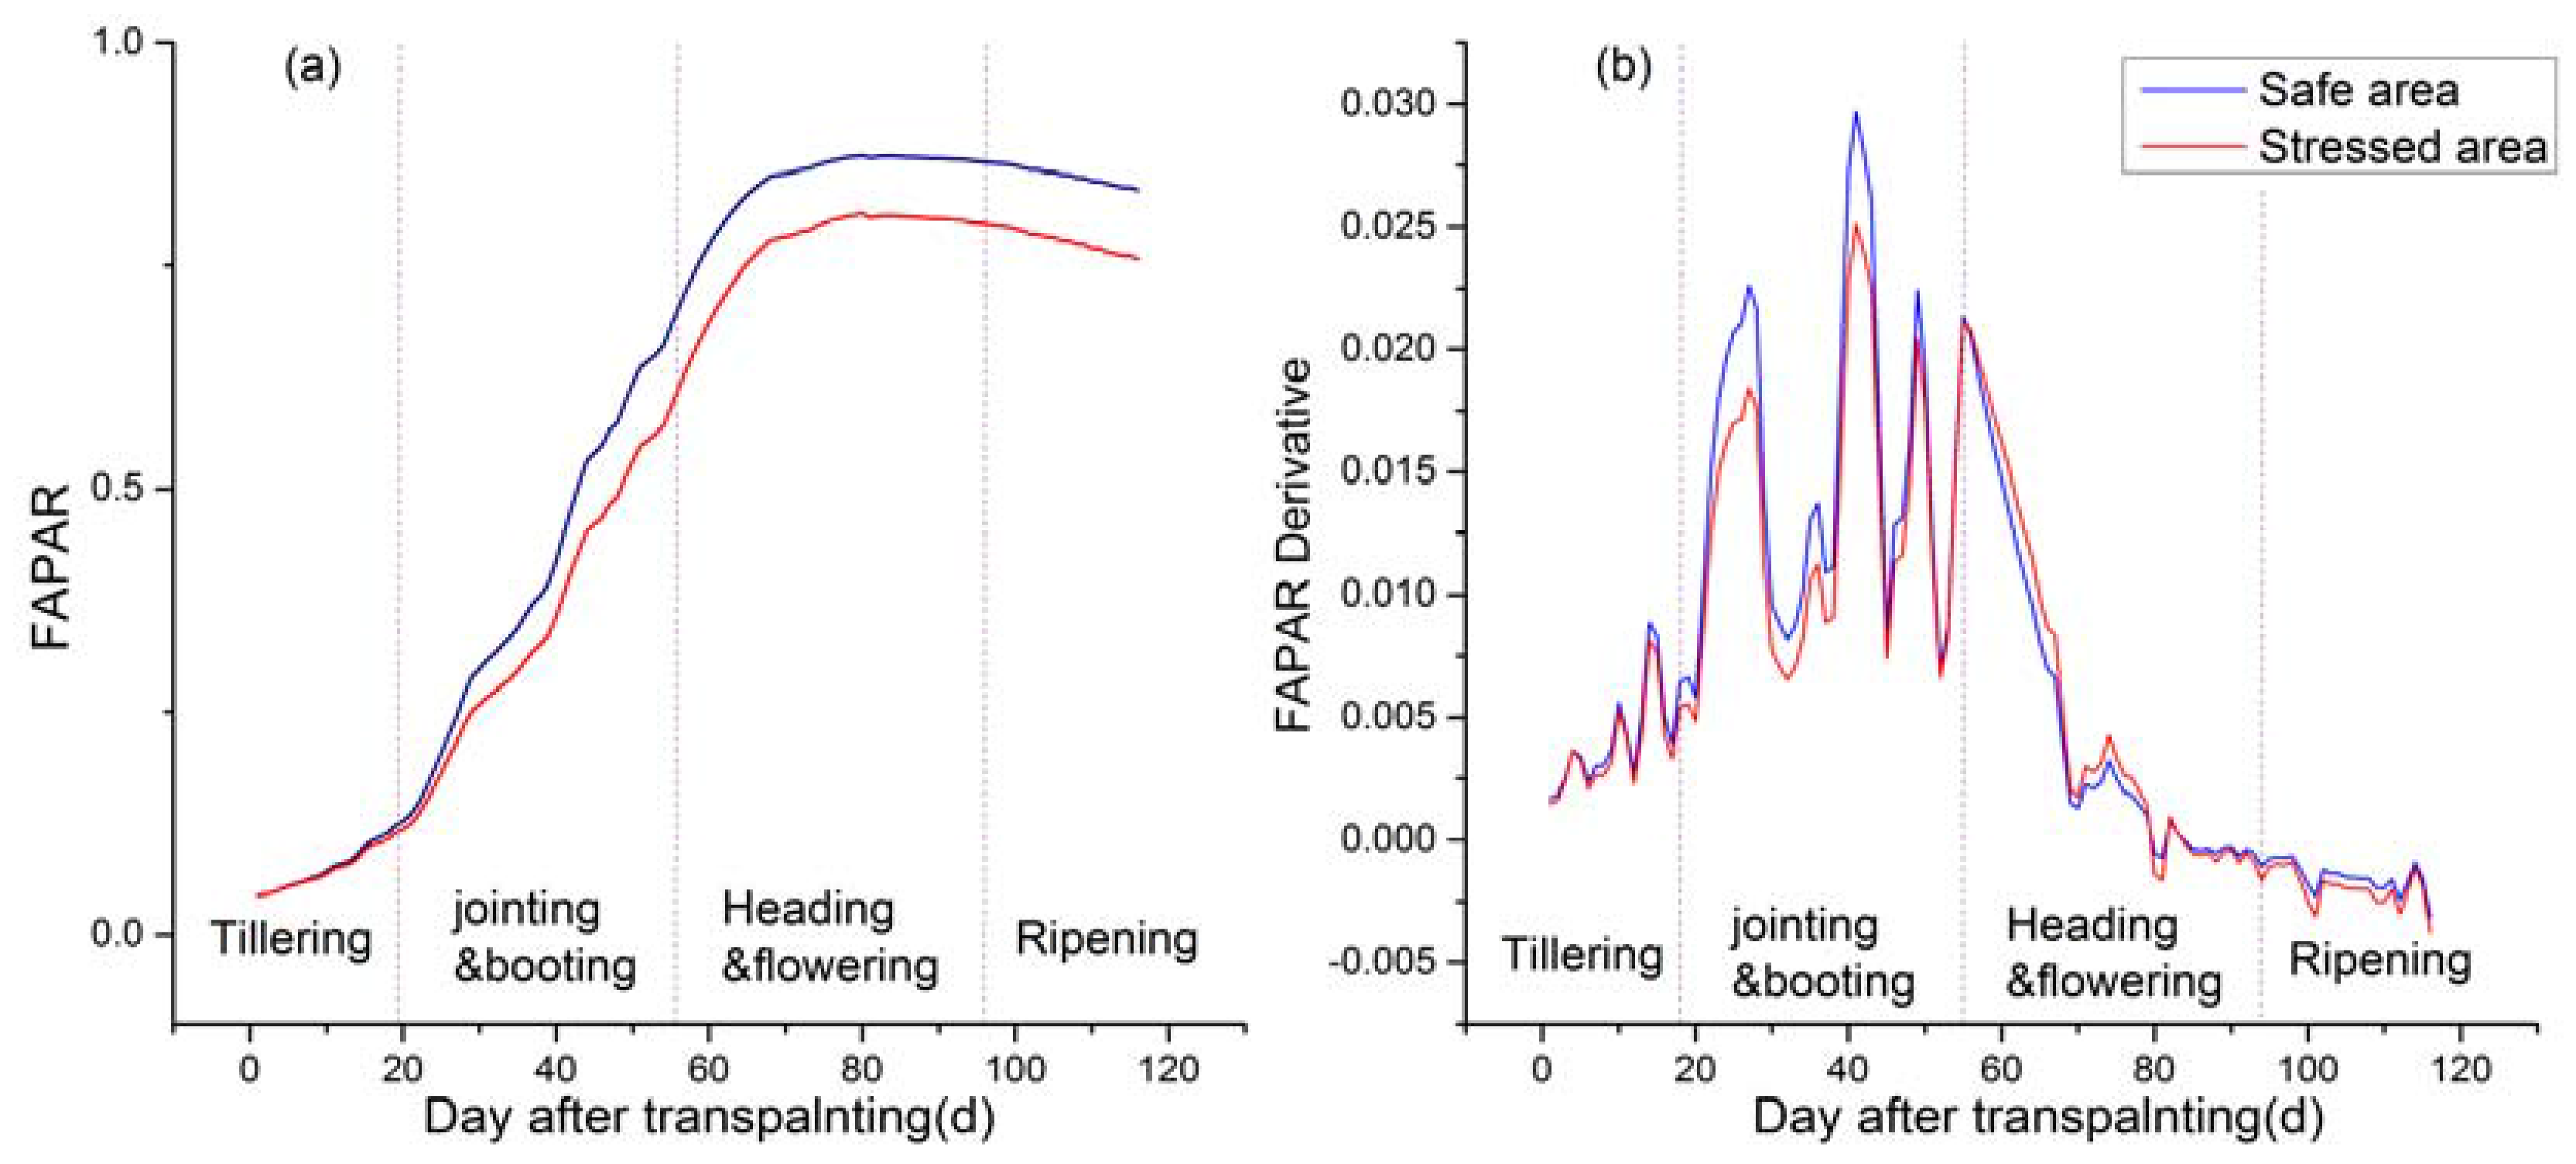
3.2. Seasonal Changes in FAPAR in Response to Heavy Metal Stress

The effective validation in the previous section demonstrates that the coupled model had a better performance to simulate rice FAPAR under heavy metal stress. Seasonal time courses for daily FAPAR in the two experimental areas were exhibited in Figure 6. We found that FAPAR in stressed area were significantly lower than the safe areas during the vegetative growth stage, which occurs after the jointing-booting stage. The FAPAR values increased slowly at the tilling stage (0–25 days) and increased rapidly at jointing-booting (25–70 days). FAPAR reached its maximum at the heading-flowering stage (70–100 days) and finally began to decline gradually at the ripening stage (100–116 days). The peak FAPAR in the region under serious stress was significantly lower by 12% when compared with the safe area.
In order to explore the seasonal changes in FAPAR further, the growth rate of FAPAR was calculated to analyze the influence of heavy metal stress on rice (Figure 6b). During the tilling stage, FAPAR growth rate in the two experimental regions were approximately equal. A remarkable discrepancy appeared at the jointing-booting stage, with FAPAR growth rate in safe areas being significantly higher than stressed areas. In the heading-flowering stage, the pattern of FAPAR growth rate in the two regions has reversed, with the growth rate of FAPAR in safe area being slightly lower compared to stressed area during 60 to 80 days. Subsequently, the variation trends of growth rate of FAPAR were similar to the tilling stage.
Based on the response mechanism of crops to heavy metals and the seasonal FAPAR of the safe area, the normal photosynthesis process of rice was obviously restrained by the poisonous nature of heavy metals during the jointing-booting stage (Figure 6b). However, the heavy metal ion slightly promoted the photosynthesis process of rice during the heading-flowering stage (60–80 days) (Figure 6b). Finally, the effect gradually stabilized at the end of the growing season. In conclusion, the jointing-flowering stage was the optimal observation time to monitor heavy metal stress levels and the FAPAR can also be used as an indicator to study the seasonal changes of photosynthesis and other physiological functions of rice under heavy metal stress.

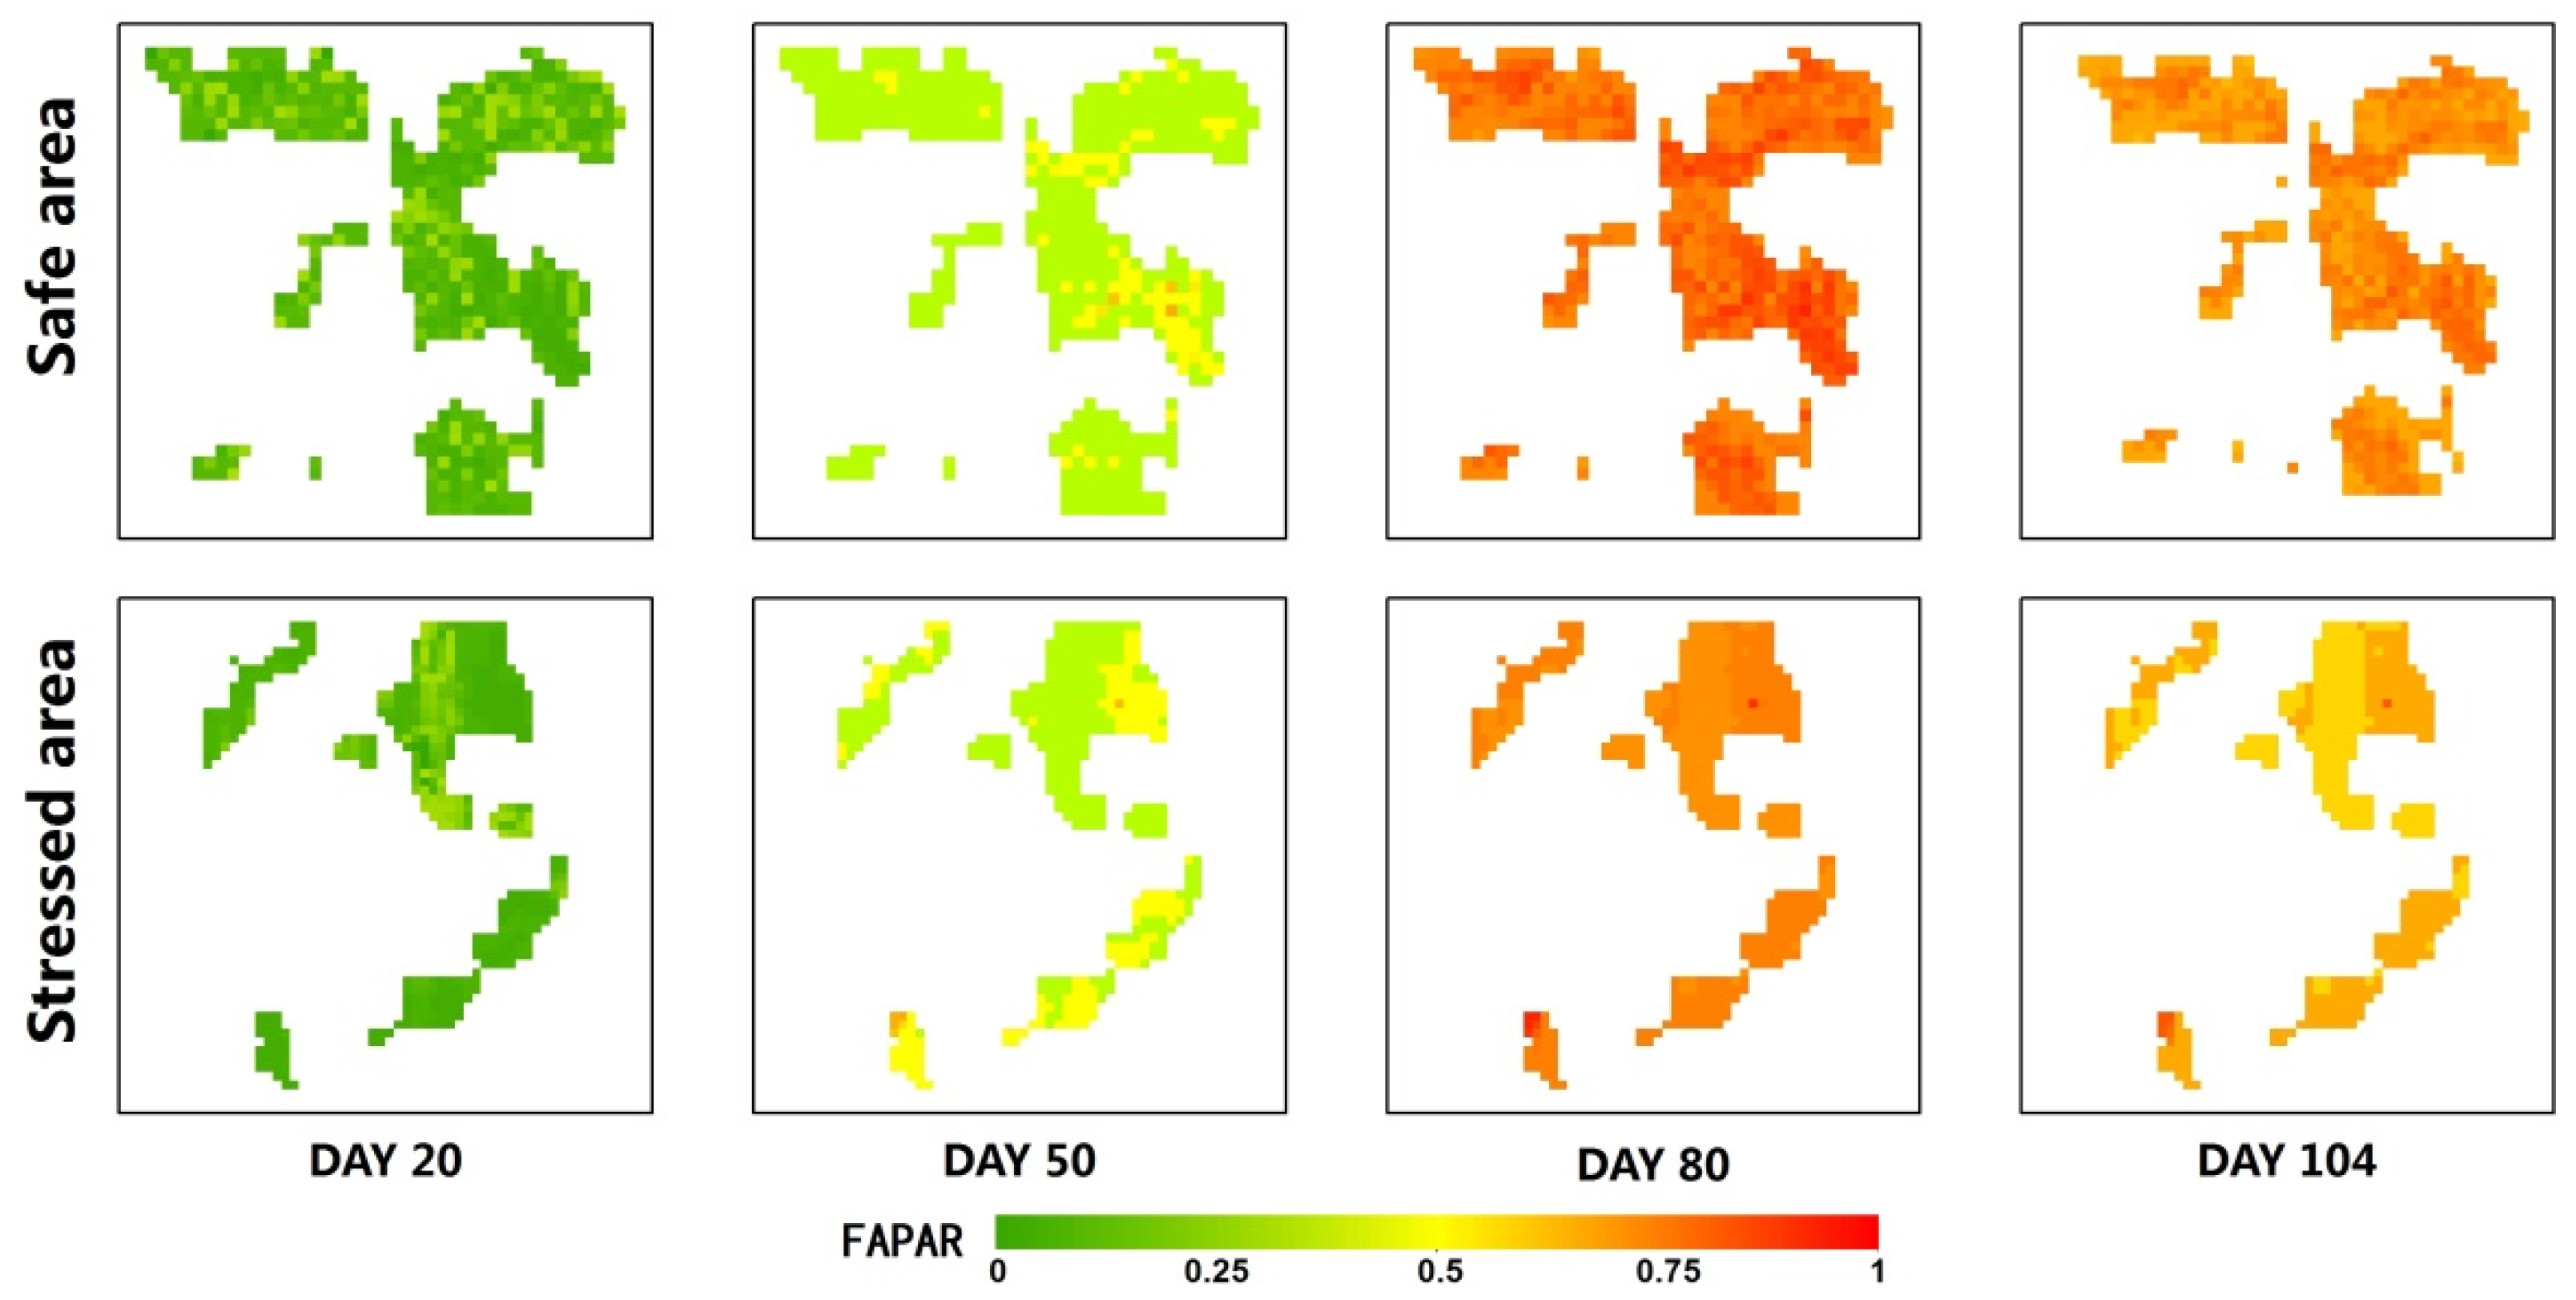
3.3. Spatial-Temporal Analysis of FAPAR

In two study areas, the levels of heavy metal stress were homogeneous, but the effect of heavy metal stress was heterogeneous [5]. Consequently, the FAPAR of each study area has shown different spatial distribution during different periods. Figure 7 shows the variation of FAPAR simulation values during the rice growing season by combining remote sensing images and a coupled model in two study areas. In area A, the values of FAPARmax had a range of 0.9–0.95 and accounted for 82% of the total pixels. In comparison, the FAPARmax of 0.8–0.9 in area B accounted for 81% and the proportion of 0.6–0.7 accounted for 28%. This difference indicates that the spatial distribution of FAPAR is inhomogeneous. In order to show the spatial differences of FAPAR more clearly, the spatial distribution of FAPAR in the two study areas were exhibited in Figure 8 during four crucial growing stages of rice. Overall, the distribution of FAPAR in two regions is generally consistent, but in the east of the stress area (Area B), the FAPAR values were slightly higher because this area is closer to the Xiangjiang River. In addition, during the tilling (Day 20) and jointing-booting (Day 50) periods, the discrepancy between the FAPAR of the two regions is very small. However, there were obvious differences shown as the values of the area under stress (Area B) were less than the safe area (Area A) during the heading-flowering (Day 80) and ripening periods (Day 104).
There are many explanations for these differences. After collecting the data from transplanting, the roots were not completely developed and the ability of absorbing water and nutrition was weakened, which consequently affected the photosynthesis of rice and resulted in a relatively low FAPAR (Figure 6b). As rice growth entered the jointing-booting stage, the growth of rice is mainly concentrated in the stem and leaf, which is a process requiring abundant water and nutrients. Meanwhile, rice begins to absorb heavy metal ions, which inhibited the photosynthesis of rice. Hence, there appeared significant differences between the FAPAR values of the two study areas (Figure 6a,b). During the heading-flowering stage, the rice growth rate and cumulative heavy metal content reached their maximums, leading to the emergence of the largest difference in FAPAR value (Figure 6a,b). Finally, after entering the ripening stage, there was a slow decline in FAPAR values because chlorophyll content decreased and the photosynthetic capacity of the canopy declined after leaf senescence.

4. Discussion

The increase of heavy metal pollution has caused long-term damage to rice growth due to the decline of light absorption capacity in canopies, which has had a significant impact on rice photosynthesis. Hence, it is necessary to explore the effects of heavy metals on the photosynthesis of rice canopies by simulating the changes and spatial distribution of FAPAR during the rice growing season. In this study, PROSAIL and WOFOST models were coupled by LAI and SKYL, in which the WOFOST model was optimized by data assimilation. This allowed us to simulate and analyze the seasonal change and spatial distribution of FAPAR in the study area. Previous studies have focused on establishing an empirical model between remote sensing data and measured FAPAR in addition to retrieving the instantaneous FAPAR. Compared with previous studies, the method of coupling the PROSAIL and WOFOST models using the law of conservation of energy can accurately simulate the daily FAPAR and spatial distribution of rice during the growing season. Therefore, the method proposed in this paper not only can study the changes in photosynthetic capacity of rice canopies, but also suggests a new concept for crop yield estimation, growth health monitoring and heavy metal stress monitoring. The change of canopy structure is an important factor to be considered when the PROSAIL model was used to calculate FAPAR. As the growing season changes, the canopy structure of most crops constantly changes and the extent of some of these changes is significant. However, variations of leaf and canopy structure during rice growth were moderate, making the simulation of FAPAR feasible. Therefore, it is necessary to consider the change of leaf and canopy structure at different growth stages and adjust the parameters if the method is applied to other crops.
In this study, the connection between the two models mainly depended on LAI and SKYL and some input parameters lacking verification of the measured data. For a more accurate simulation of FAPAR, more connection between the two models need to be established and more time-varying parameters need to be measured in the future, such as SZA, VZA and RAA. Meanwhile, LAI retrieved from remote sensing data was considered as the actual observed values and assimilated into the WOFOST model. Therefore, the error of LAI inversion need to be discussed and the source of error include the measurement error, model error and remote sensing image quality. The uncertainty of LAI will affect the assimilation results and thus affect the simulation accuracy of the coupled model. In addition, the proposed approach can be employed to other crop types or regions and the parameters of coupled model need to be re-localized. Meanwhile, the meteorological parameters should be regionalized according to the practical situation at large scales.

5. Conclusions

In this study, the daily FAPAR was simulated by a coupled model, which consisted of the PROSAIL and WOFOST models. Meanwhile, the crop growth model is optimized by data assimilation. The effects of heavy metal pollution on the capacity of light absorption of rice canopy at different growth stages were assessed by analyzing the seasonal dynamic change and spatial distribution of FAPAR under different stress levels. First, the strong correlation between simulated and measured FAPAR at different growth stages indicated that the coupled model with the applied assimilation method had higher feasibility and availability. Secondly, comparing the spatial-temporal variations of FAPAR under different stress levels, we found that heavy metal stress had no significant effect on the capacity of light absorption of rice canopies at the tilling stage. Upon entering the jointing-booting stage, the effect of heavy metal stress began to increase and reached its maximum at the heading-flowering stage, with FAPARmax of the safe area being 13% higher than the stressed area. Subsequently, this influence tended to be stable until rice is fully mature.
In conclusion, the effects of heavy metal stress on the canopy capacity of light absorption were obvious when rice growth entered the jointing-booting stage, which can also be used as the optimal time to monitor heavy metal stress and the changes of canopy photosynthesis. In addition, the method of coupling the PROSAIL and WOFOST models can successfully simulate FAPAR and has strong potential applications in environmental monitoring.

Acknowledgments

This research was supported by the National Natural Science Foundation of China (No.: 41371407)

Author Contributions

Gaoxiang Zhou conceived and designed the experiments, analyzed the data and wrote the paper, Xiangnan Liu supervised the research and provided significant suggestions, Ming Liu and Shuang Zhao were involved in the data processing and the manuscript reviewing, and Ling Wu wrote the main programs for the crop growth model and assimilation algorithm.

Conflicts of Interest

The authors declare no conflict of interest.

References

  1. Gitelson, A.A.; Vina, A.; Arkebauer, T.J.; Rundquist, D.C.; Keydan, G.; Leavitt, B. Remote estimation of leaf area index and green leaf biomass in maize canopies. Geophys. Res. Lett. 2003, 30. [Google Scholar] [CrossRef]
  2. Song, W.; Chen, B.; Liu, L. Soil heavy metal pollution of cultivated land in China. Res. Soil Water Conserv. 2013, 20, 293–298. [Google Scholar]
  3. Wu, L.; Liu, X.; Wang, P.; Zhou, B.; Liu, M.; Li, X. The assimilation of spectral sensing and the wofost model for the dynamic simulation of cadmium accumulation in rice tissues. Int. J. Appl. Earth Obs. Geoinfor. 2013, 25, 66–75. [Google Scholar] [CrossRef]
  4. Song, Q.; Li, J. Environmental effects of heavy metals derived from the e-waste recycling activities in China: A systematic review. Waste Manag. 2014, 34, 2587–2594. [Google Scholar] [CrossRef] [PubMed]
  5. Jin, M.; Liu, X.N.; Wu, L.; Liu, M.L. An improved assimilation method with stress factors incorporated in the wofost model for the efficient assessment of heavy metal stress levels in rice. Int. J. Appl. Earth Obs. Geoinf. 2015, 41, 118–129. [Google Scholar] [CrossRef]
  6. Kastori, R.; Plesnicar, M.; Sakac, Z.; Pankovic, D.; Arsenijevic-Maksimovic, I. Effect of excess lead on sunflower growth and photosynthesis. J. Plant Nutr. 1998, 21, 75–85. [Google Scholar] [CrossRef]
  7. Rahman, M.A.; Hasegawa, H.; Rahman, M.M.; Islam, M.N.; Miah, M.A.M.; Tasmen, A. Effect of arsenic on photosynthesis, growth and yield of five widely cultivated rice (Oryza sativa L.) varieties in Bangladesh. Chemosphere 2007, 67, 1072–1079. [Google Scholar] [CrossRef] [PubMed]
  8. Cheng, S.P. Effects of heavy metals on plants and resistance mechanisms. Environ. Sci. Pollut. Res. 2003, 10, 256–264. [Google Scholar] [CrossRef]
  9. Schuerger, A.C.; Capelle, G.A.; Di Benedetto, J.A.; Mao, C.Y.; Thai, C.N.; Evans, M.D.; Richards, J.T.; Blank, T.A.; Stryjewski, E.C. Comparison of two hyperspectral imaging and two laser-induced fluorescence instruments for the detection of zinc stress and chlorophyll concentration in bahia grass (paspalum notatum flugge). Remote Sens. Environ. 2003, 84, 572–588. [Google Scholar] [CrossRef]
  10. Rosso, P.H.; Pushnik, J.C.; Lay, M.; Ustin, S.L. Reflectance properties and physiological responses of salicornia virginica to heavy metal and petroleum contamination. Environ. Pollut. 2005, 137, 241–252. [Google Scholar] [CrossRef] [PubMed]
  11. Sridhar, B.B.M.; Vincent, R.K.; Roberts, S.J.; Czajkowski, K. Remote sensing of soybean stress as an indicator of chemical concentration of biosolid amended surface soils. Int. J. Appl. Earth Obs. Geoinfor. 2011, 13, 676–681. [Google Scholar] [CrossRef]
  12. Chen, J.M. Canopy architecture and remote sensing of the fraction of photosynthetically active radiation absorbed by boreal conifer forests. IEEE Trans. Geosci. Remote Sens. 1996, 34, 1353–1368. [Google Scholar] [CrossRef]
  13. Asner, G.P.; Wessman, C.A. Scaling par absorption from the leaf to landscape level in spatially heterogeneous ecosystems. Ecol. Model. 1997, 103, 81–97. [Google Scholar] [CrossRef]
  14. Zhu, Z.; Bi, J.; Pan, Y.; Ganguly, S.; Anav, A.; Xu, L.; Samanta, A.; Piao, S.; Nemani, R.; Myneni, R. Global data sets of vegetation leaf area index (lai)3g and Fraction of Photosynthetically Active Radiation (FPAR)3G derived from Global Inventory Modeling and Mapping Studies (GIMMS) Normalized Difference Vegetation Index (NDVI3G) for the period 1981 to 2011. Remote Sens. 2013, 5, 927–948. [Google Scholar]
  15. Liu, J.; Pattey, E.; Miller, J.R.; McNairn, H.; Smith, A.; Hu, B. Estimating crop stresses, aboveground dry biomass and yield of corn using multi-temporal optical data combined with a radiation use efficiency model. Remote Sens. Environ. 2010, 114, 1167–1177. [Google Scholar] [CrossRef]
  16. Dong, T.; Wu, B.; Meng, J.; Du, X.; Shang, J. Sensitivity analysis of retrieving Fraction of Absorbed Photosynthetically Active Radiation (FPAR) using remote sensing data. Acta Ecol. Sin. 2016, 36, 1–7. [Google Scholar] [CrossRef]
  17. Liu, M.; Liu, X.; Zhang, B.; Ding, C. Regional heavy metal pollution in crops by integrating physiological function variability with spatio-temporal stability using multi-temporal thermal remote sensing. Int. J. Appl. Earth Obs. Geoinfor. 2016, 51, 91–102. [Google Scholar] [CrossRef]
  18. Liang, S. Recent developments in estimating land surface biogeophysical variables from optical remote sensing. Prog. Phys. Geogr. 2007, 31, 501–516. [Google Scholar] [CrossRef]
  19. Yuan, H.; Ma, R.; Atzberger, C.; Li, F.; Loiselle, S.; Luo, J. Estimating forest fapar from multispectral landsat-8 data using the invertible forest reflectance model inform. Remote Sens. 2015, 7, 7425–7446. [Google Scholar] [CrossRef]
  20. Tao, X.; Liang, S.; He, T.; Jin, H. Estimation of fraction of absorbed photosynthetically active radiation from multiple satellite data: Model development and validation. Remote Sens. Environ. 2016, 184, 539–557. [Google Scholar] [CrossRef]
  21. Steinberg, D.C.; Goetz, S.J.; Hyer, E.J. Validation of modis f-par products in boreal forests of Alaska. IEEE Trans. Geosci. Remote Sens. 2006, 44, 1818–1828. [Google Scholar] [CrossRef]
  22. Verger, A.; Baret, F.; Camacho, F. Optimal modalities for radiative transfer-neural network estimation of canopy biophysical characteristics: Evaluation over an agricultural area with chris/proba observations. Remote Sens. Environ. 2011, 115, 415–426. [Google Scholar] [CrossRef]
  23. Oliphant, A.; Susan, C.; Grimmond, B.; Schmid, H.P.; Wayson, C.A. Local-scale heterogeneity of Photosynthetically Active Radiation (PAR), absorbed par and net radiation as a function of topography, sky conditions and leaf area index. Remote Sens. Environ. 2006, 103, 324–337. [Google Scholar] [CrossRef]
  24. Zhang, Q.; Middleton, E.M.; Margolis, H.A.; Drolet, G.G.; Barr, A.A.; Black, T.A. Can a satellite-derived estimate of the Fraction of PAR Absorbed by Chlorophyll (FAPAR(CHL)) improve predictions of light-use efficiency and ecosystem photosynthesis for a boreal aspen forest? Remote Sens. Environ. 2009, 113, 880–888. [Google Scholar] [CrossRef]
  25. Cheng, S.J.; Bohrer, G.; Steiner, A.L.; Hollinger, D.Y.; Suyker, A.; Phillips, R.P.; Nadelhoffer, K.J. Variations in the influence of diffuse light on gross primary productivity in temperate ecosystems. Agric. For. Meteorol. 2015, 201, 98–110. [Google Scholar] [CrossRef]
  26. Li, W.; Fang, H. Estimation of direct, diffuse, and total fpars from landsat surface reflectance data and ground-based estimates over six fluxnet sites. J. Geophys. Res. Biogeosci. 2015, 120, 96–112. [Google Scholar] [CrossRef]
  27. Xue, W.; Lindner, S.; Nay-Htoon, B.; Dubbert, M.; Otieno, D.; Ko, J.; Muraoka, H.; Werner, C.; Tenhunen, J.; Harley, P. Nutritional and developmental influences on components of rice crop light use efficiency. Agric. For. Meteorol. 2016, 223, 1–16. [Google Scholar] [CrossRef]
  28. Li, L.; Du, Y.; Tang, Y.; Liu, Q. A study of fraction of absorbed photosynthetically active radiation characteristics based on SAIL model simulation. Proc. SPIE 2012. [Google Scholar] [CrossRef]
  29. Liu, F.; Liu, X.N.; Wu, L.; Xu, Z.; Gong, L. Optimizing the temporal scale in the assimilation of remote sensing and wofost model for dynamically monitoring heavy metal stress in rice. IEEE J. Sel. Top. Appl. Earth Obs. Remote Sens. 2016, 9, 1685–1695. [Google Scholar] [CrossRef]
  30. Jin, M.; Liu, X.N.; Wu, L.; Liu, M.L. Distinguishing heavy-metal stress levels in rice using synthetic spectral index responses to physiological function variations. IEEE J. Sel. Top. Appl. Earth Obs. Remote Sens. 2017, 10, 75–86. [Google Scholar] [CrossRef]
  31. Feret, J.-B.; Francois, C.; Asner, G.P.; Gitelson, A.A.; Martin, R.E.; Bidel, L.P.R.; Ustin, S.L.; le Maire, G.; Jacquemoud, S. Prospect-4 and 5: Advances in the leaf optical properties model separating photosynthetic pigments. Remote Sens. Environ. 2008, 112, 3030–3043. [Google Scholar] [CrossRef]
  32. Jacquemoud, S.; Verhoef, W.; Baret, F.; Bacour, C.; Zarco-Tejada, P.J.; Asner, G.P.; Francois, C.; Ustin, S.L. Prospect plus sail models: A review of use for vegetation characterization. Remote Sens. Environ. 2009, 113, S56–S66. [Google Scholar] [CrossRef]
  33. Asner, G.P.; Wessman, C.A.; Archer, S. Scale dependence of absorption of photosynthetically active radiation in terrestrial ecosystems. Ecol. Appl. 1998, 8, 1003. [Google Scholar] [CrossRef]
  34. Asner, G.P.; Townsend, A.R.; Riley, W.J.; Matson, P.A.; Neff, J.C.; Cleveland, C.C. Physical and biogeochemical controls over terrestrial ecosystem responses to nitrogen deposition. Biogeochemistry 2001, 54, 1–39. [Google Scholar] [CrossRef]
  35. Lobell, D.B.; Asner, G.P.; Ortiz-Monasterio, J.I.; Benning, T.L. Remote sensing of regional crop production in the yaqui valley, mexico: Estimates and uncertainties. Agric. Ecosyst. Environ. 2003, 94, 205–220. [Google Scholar] [CrossRef]
  36. Dong, T.; Meng, J.; Wu, B. Overview on methods of deriving fraction of absorbed Photosynthetically Active Radiation (FPAR) using remote sensing. Acta Ecol. Sin. 2012, 32, 7190–7201. [Google Scholar] [CrossRef]
  37. Verhoef, W.; Bach, H. Coupled soil–leaf-canopy and atmosphere radiative transfer modeling to simulate hyperspectral multi-angular surface reflectance and toa radiance data. Remote Sens. Environ. 2007, 109, 166–182. [Google Scholar] [CrossRef]
  38. Huang, Z.; Liu, X.N.; Jin, M.; Ding, C.; Jiang, J.L.; Wu, L. Deriving the characteristic scale for effectively monitoring heavy metal stress in rice by assimilation of gf-1 data with the wofost model. Sensors 2016. [Google Scholar] [CrossRef] [PubMed]
  39. Zhaohui, G.U.O.; Xiyuan, X.; Tongbin, C.; Xiaoyong, L.; Jie, S.; Bin, W.U. Heavy metal pollution of soils and vegetables from midstream and downstream of xiangjiang river. Acta Geogr. Sin. 2008, 63, 3–11. [Google Scholar]
  40. Liu, F.; Liu, X.; Zhao, L.; Ding, C.; Jiang, J.; Wu, L. The dynamic assessment model for monitoring cadmium stress levels in rice based on the assimilation of remote sensing and the wofost model. IEEE J. Sel. Top. Appl. Earth Obs. Remote Sens. 2015, 8, 1330–1338. [Google Scholar] [CrossRef]
  41. Liu, M.; Liu, X.; Liu, M.; Liu, F.; Jin, M.; Wu, L. Root mass ratio: Index derived by assimilation of synthetic aperture radar and the improved world food study model for heavy metal stress monitoring in rice. J. Appl. Remote Sens. 2016, 10, 026038. [Google Scholar] [CrossRef]
  42. Hosgood, B.; Jacquemoud, S.; Andreoli, G.; Verdebout, J.; Pedrini, G.; Schmuck, G. Leaf optical properties experiment 93 (lopex93). Available online: http://data.ecosis.org/dataset/13aef0ce-dd6f-4b35-91d9-28932e506c41/resource/4029b5d3-2b84-46e3-8fd8-c801d86cf6f1/download/leaf-optical-properties-experiment-93-lopex93.pdf (accessed on 10 March 2017).
  43. Ceccato, P.; Flasse, S.; Tarantola, S.; Jacquemoud, S.; Grégoire, J.-M. Detecting vegetation leaf water content using reflectance in the optical domain. Remote Sens. Environ. 2001, 77, 22–33. [Google Scholar] [CrossRef]
  44. Fang, M.H.; Ju, W.M. A inversion model for remote sensing of leaf water content based on the leaf optical property. Spectrosc. Spectr. Anal. 2015, 35, 167–171. [Google Scholar]
Figure 1. Location of the study areas in the city of Zhuzhou, Hunan Province, China.
Remotesensing 09 00424 g001
Figure 2. Flowchart for estimating daily fraction of absorbed photosynthetically active radiation (FAPAR) of rice growth season for analyzing heavy metal stress.
Remotesensing 09 00424 g002
Figure 3. A flowchart of the coupled growth-canopy model for describing the process of the FAPARsimulation; PROSPECT is the Leaf Optical Properties Spectra model, SAIL is the Scattering by Arbitrarily Inclined Leaves Model, WOFOST is world food study model, PAR is the photosynthetically active radiation, and FAPAR is the fraction of absorbed photosynthetically active radiation.
Remotesensing 09 00424 g003
Figure 4. Distribution of simulated FAPAR at different times in different regions. Note that all days mean days after transplanting.
Remotesensing 09 00424 g004
Figure 5. Validation of simulated FAPAR against measured FAPAR at different times in different regions. Day 43 represents the jointing-booting stage of rice, Day 62 represents heading-the flowering stage of rice and Day 83 represents the ending of flowering stage of rice. Note that all days means day after transplanting.
Remotesensing 09 00424 g005
Figure 6. (a,b) Seasonal variations of FAPAR in paddy rice growth period under different heavy metal stress area.
Remotesensing 09 00424 g006
Figure 7. Frequency distribution of FAPARmax in the two areas. All pixels covered with rice are extracted by visual interpretation and supervised classification.
Remotesensing 09 00424 g007
Figure 8. Spatial-temporal distri9bution of FAPAR in the two areas. Note that all days mean day after transplanting and non-rice pixels are shown in white.
Remotesensing 09 00424 g008
Table 1. Average heavy metal concentrations in the study areas.
Study AreaCoordinatesTypeCdHgPbAsPollution Level
Background Value (mg/kg)1.430.2082.7819.11
A27°47.5′N 113°12.5′ESoil (mg/kg)0.840.8278.3210.22Safe Level
Rice Tissues (mg/kg)0.820.0410.605.39
B27°50.4′N 113°2.6′ESoil (mg/kg)3.280.51120.7518.15Stress level
Rice Tissues (mg/kg)2.970.0636.737.04
Note: Heavy metal background values were used as threshold values to indicate pollution. They were derived from the Hunan Institute of Geophysical and Geochemical Exploration, City, China.
Table 2. The main initialization parameters used in the World Food Study Model.
Parameter (Unit)DescriptionValueSource
Phenological ParametersIDEM (day)Day of transplanting154Field measurements
TSUM1 (°C)Cumulative temperature from emergence to anthesis1800Field measurements
TSUM2 (°C)Cumulative temperature from anthesis to maturity620Field measurements
DVSIDevelopment stage of transplanting0.25Field calibration
Crop initial Condition ParametersTDWI (kg∙ha1)Initial total crop dry weight65Field measurements
LAIEM (ha∙ha1)Leaf area index at emergence0.1Field measurements
Green Area ParameterSPAN (day)Life span of leaves growing at 35 °C50From previous studies
TBASE (°C)Lower threshold temperature for aging of leaves15From previous studies
Table 3. The parameters used in the PROSAIL model for simulated seasonal FAPAR of rice.
ParameterDefault ValueUnitNote and Reference
Illumination ParameterSKYLCalculated by WOFOST modelfraction of diffused incoming solar radiation
SZAConsistent with remote sensing data°Sun zenith angle
VZAConsistent with remote sensing data°View zenith angle
RAAConsistent with remote sensing data°Relative azimuth angle
Leaf ParameterNs1.5Leaf mesophyll structure parameter
Cab40.194μg∙cm−2Leaf chlorophyll content
Cw0.0g∙cm−2Leaf water content
Cm0.0064g∙cm−2Leaf dry matter content
Car0.0036μg∙cm−2Leaf carotenoid content
Canopy ParameterALA70°Averaged leaf angle
LAICalculated by WOFOST modelLeaf area index
Hotspot0.05Hotspot size parameter
Psoil0Soil bright index

