Article

Evapotranspiration Estimate over an Almond Orchard Using Landsat Satellite Observations

1
College of Geoscience and Surveying Engineering, China University of Mining & Technology (Beijing), Beijing 100086, China
2
Department of Land, Air and Water Resources, University of California, Davis, CA 95616, USA
3
Department of Crop and Soil Science, Oregon State University, Corvallis, OR 97331, USA
4
University of California Cooperative Extension, Bakersfield, CA 93307, USA
*
Author to whom correspondence should be addressed.
Remote Sens. 2017, 9(5), 436; https://doi.org/10.3390/rs9050436
Submission received: 7 March 2017 / Revised: 21 April 2017 / Accepted: 1 May 2017 / Published: 5 May 2017

Abstract

:
California growers face challenges with water shortages and there is a strong need to use the least amount of water while optimizing yield. Timely information on evapotranspiration (ET), a dominant component of crop consumptive water use, is critical for growers to tailor irrigation management based on in-field spatial variability and in-season variations. We evaluated the performance of a remote sensing-based approach, Mapping Evapotranspiration at high Resolution with Internalized Calibration (METRIC), in mapping ET over an almond orchard in California, driven by Landsat satellite observations. Reference ET from a network of weather stations over well-watered grass (ETo) was used for the internal calibration and for deriving ET at daily and extended time period, instead of alfalfa based reference evapotranspiration (ETr). Our study showed that METRIC daily ET estimates during Landsat overpass dates agreed well with the field measurements. During 2009–2012, a root mean square error (RMSE) of 0.53 mm/day and a coefficient of determination (R2) of 0.87 were found between METRIC versus observed daily ET. Monthly ET estimates had a higher accuracy, with a RMSE of 12.08 mm/month, a R2 of 0.90, and a relatively small relative mean difference (RMD) of 9.68% during 2009–2012 growing seasons. Net radiation and Normalized Difference Vegetation Index (NDVI) from remote sensing observations were highly correlated with spatial and temporal ET estimates. An empirical model was developed to estimate daily ET using NDVI, net radiation (Rn), and vapor pressure deficit (VPD). The validation showed that the accuracy of this easy-to-use empirical method was slightly lower than that of METRIC but still reasonable, with a RMSE of 0.71 mm/day when compared to ground measurements. The remote sensing based ET estimate will support a variety of State and local interests in water use and irrigation management, for both planning and regulatory/compliance purposes, and it provides the farmers observation-based guidance for site-specific and time-sensitive irrigation management.

Graphical Abstract

1. Introduction

Almond has become the first leading revenue-generating crop commodity in California, with a total value of annual production over 5.9 billion dollars in 2014. California’s almond acreage has been rapidly growing, from 700,000 acres (bearing acreage: 590,000 acres) in 2005 to 1,020,000 acres (bearing acreage: 870,000 acres) in 2014, according to the California Department of Food and Agriculture (CDFA) [1]. On the other hand, almond growers face water supply challenges due to the increasing frequency and severity of recurring droughts. Water use by almond orchards has not been well studied, especially under various cropping conditions, and this knowledge gap limits the capacity for growers to achieve resource-efficient water management.
Agricultural consumptive water use consists of water removed by evapotranspiration (ET), via soil evaporation (E) and plant transpiration (T). Accurate estimation and mapping of crop ET across space and time are essential for improving field-scale irrigation management and for watershed and regional water planning and management. Ground-based flux measurement methods such as eddy covariance (EC) [2], Bowen ratio (BR) [3], and most recently surface renewal (SR) [4], can provide half-hourly, hourly, and daily ET measurements and thus offer guidance to growers for time sensitive irrigation scheduling. However, these measurements are limited by the small scale of the footprint area of the measurement stations and they cannot capture heterogeneity within each agriculture field, and sometimes cannot represent the entire field or orchard conditions. The equipment for measuring field ET through ground methods is usually expensive, while their installation and maintenance could also be labor-intensive.
In agricultural production areas, ET has been traditionally estimated as a product of the weather-based ET of a hypothetical reference surface, such as alfalfa (ETr) or grass (ETo) under well-watered condition, and crop coefficient (Kc) [5,6]. Kc is often generalized for each crop type and over a few growth stages from limited field measurements, and thus does not capture the detailed temporal dynamics of crop growth and spatial variability of crops within and across the field blocks. For example, values of almond Kc of 0.40 at initial stage, 0.90 at mid-season and 0.65 at the end of the season are usually considered for irrigation management in all almond orchards [5]. Near real time values of ETo are readily accessible to growers throughout the State of California from the California Irrigation Management Information System (CIMIS) network of more than 150 weather stations, and they are used extensively for irrigation management in California. However, spatially-explicit seasonal Kc values for estimating water use by almond orchards are not yet available in the literature. Updating the almond water use information is particularly important for California’s almond growers to improve their on-farm irrigation management, since almond production industry experienced major changes in cultivars, rootstocks, planting density, canopy management practices, and irrigation technology and methods during the past 15 to 20 years.
New approaches to take advantage of remote sensing observations to map ET have been developed, especially in recent decades, due to increasingly available free satellite observations from multiple sensors [7,8,9,10]. Empirical algorithms were built to relate ET to remotely sensed vegetation indices and weather data [11,12,13,14]. These algorithms typically perform well in areas where they are calibrated, but the uncertainty usually increases when applied to other areas. The semi-empirical Priestley–Taylor equation, calibrated with ET measurements, has also shown promising results for estimating ET at continental to global scale [7,8]. A suite of algorithms that were based on surface residual of the energy balance (REB) data, using both optical and thermal remote sensing observations, has also provided estimates of ET. One-source REB models include Surface Energy Balance Algorithm for Land (SEBAL) [15], Surface Energy Balance System (SEBS) [16], Mapping Evapotranspiration at high Resolution with Internalized Calibration (METRIC) [17], and Simplified Surface Energy Balance (SSEB) [18,19]. Two-source models, such as the Two-Source Model (TSM) [20,21] and the Disaggregated Atmosphere-Land Exchange Inverse (DisALEXI) [22,23,24,25], integrate the biophysical processes and remote sensing data to estimate the plant transpiration and evaporation from non-vegetated surfaces separately.
METRIC estimates the near surface temperature gradient (dT) as an indexed function of radiometric surface temperature, and thus does not rely on accurate estimate of land surface temperature from thermal imagery [17,26,27]. It also uses hourly reference ET to auto-calibrate the sensible heat calculation for each satellite image. This internal calibration makes ET estimates more robust. METRIC has been widely used to estimate agricultural water use in Idaho, California, and New Mexico for management of water rights, irrigation scheduling, and water resource planning [28,29]. Regional scale ET mapping has also been done in the Texas High plains [30], in the mountainous areas of northern Portugal [31], and in the oasis area in Heibe River Basin in China [32], and the results showed reasonable accuracy. The METRIC method was used to provide good estimates of ET over olive orchards [33,34,35] and over cotton fields [36]. It tends to outperform TSEB when sufficient ancillary data are not available [36]. To our knowledge, however, there are no studies on almond ET estimation by METRIC, and it is not clear how remote sensing-based ET approaches perform in almond orchard with the complex canopy structure of almond trees.
In this paper, we aim to: (1) assess the accuracy of ET estimates at the field scale in an almond orchard using the METRIC approach, driven by Landsat satellite observations and ETo from CIMIS; (2) examine the dominant drivers for temporal and spatial variation in crop water use; and (3) develop and assess empirical methods that are easy to use for ET estimation at the farm scale.

2. Study Area and Datasets
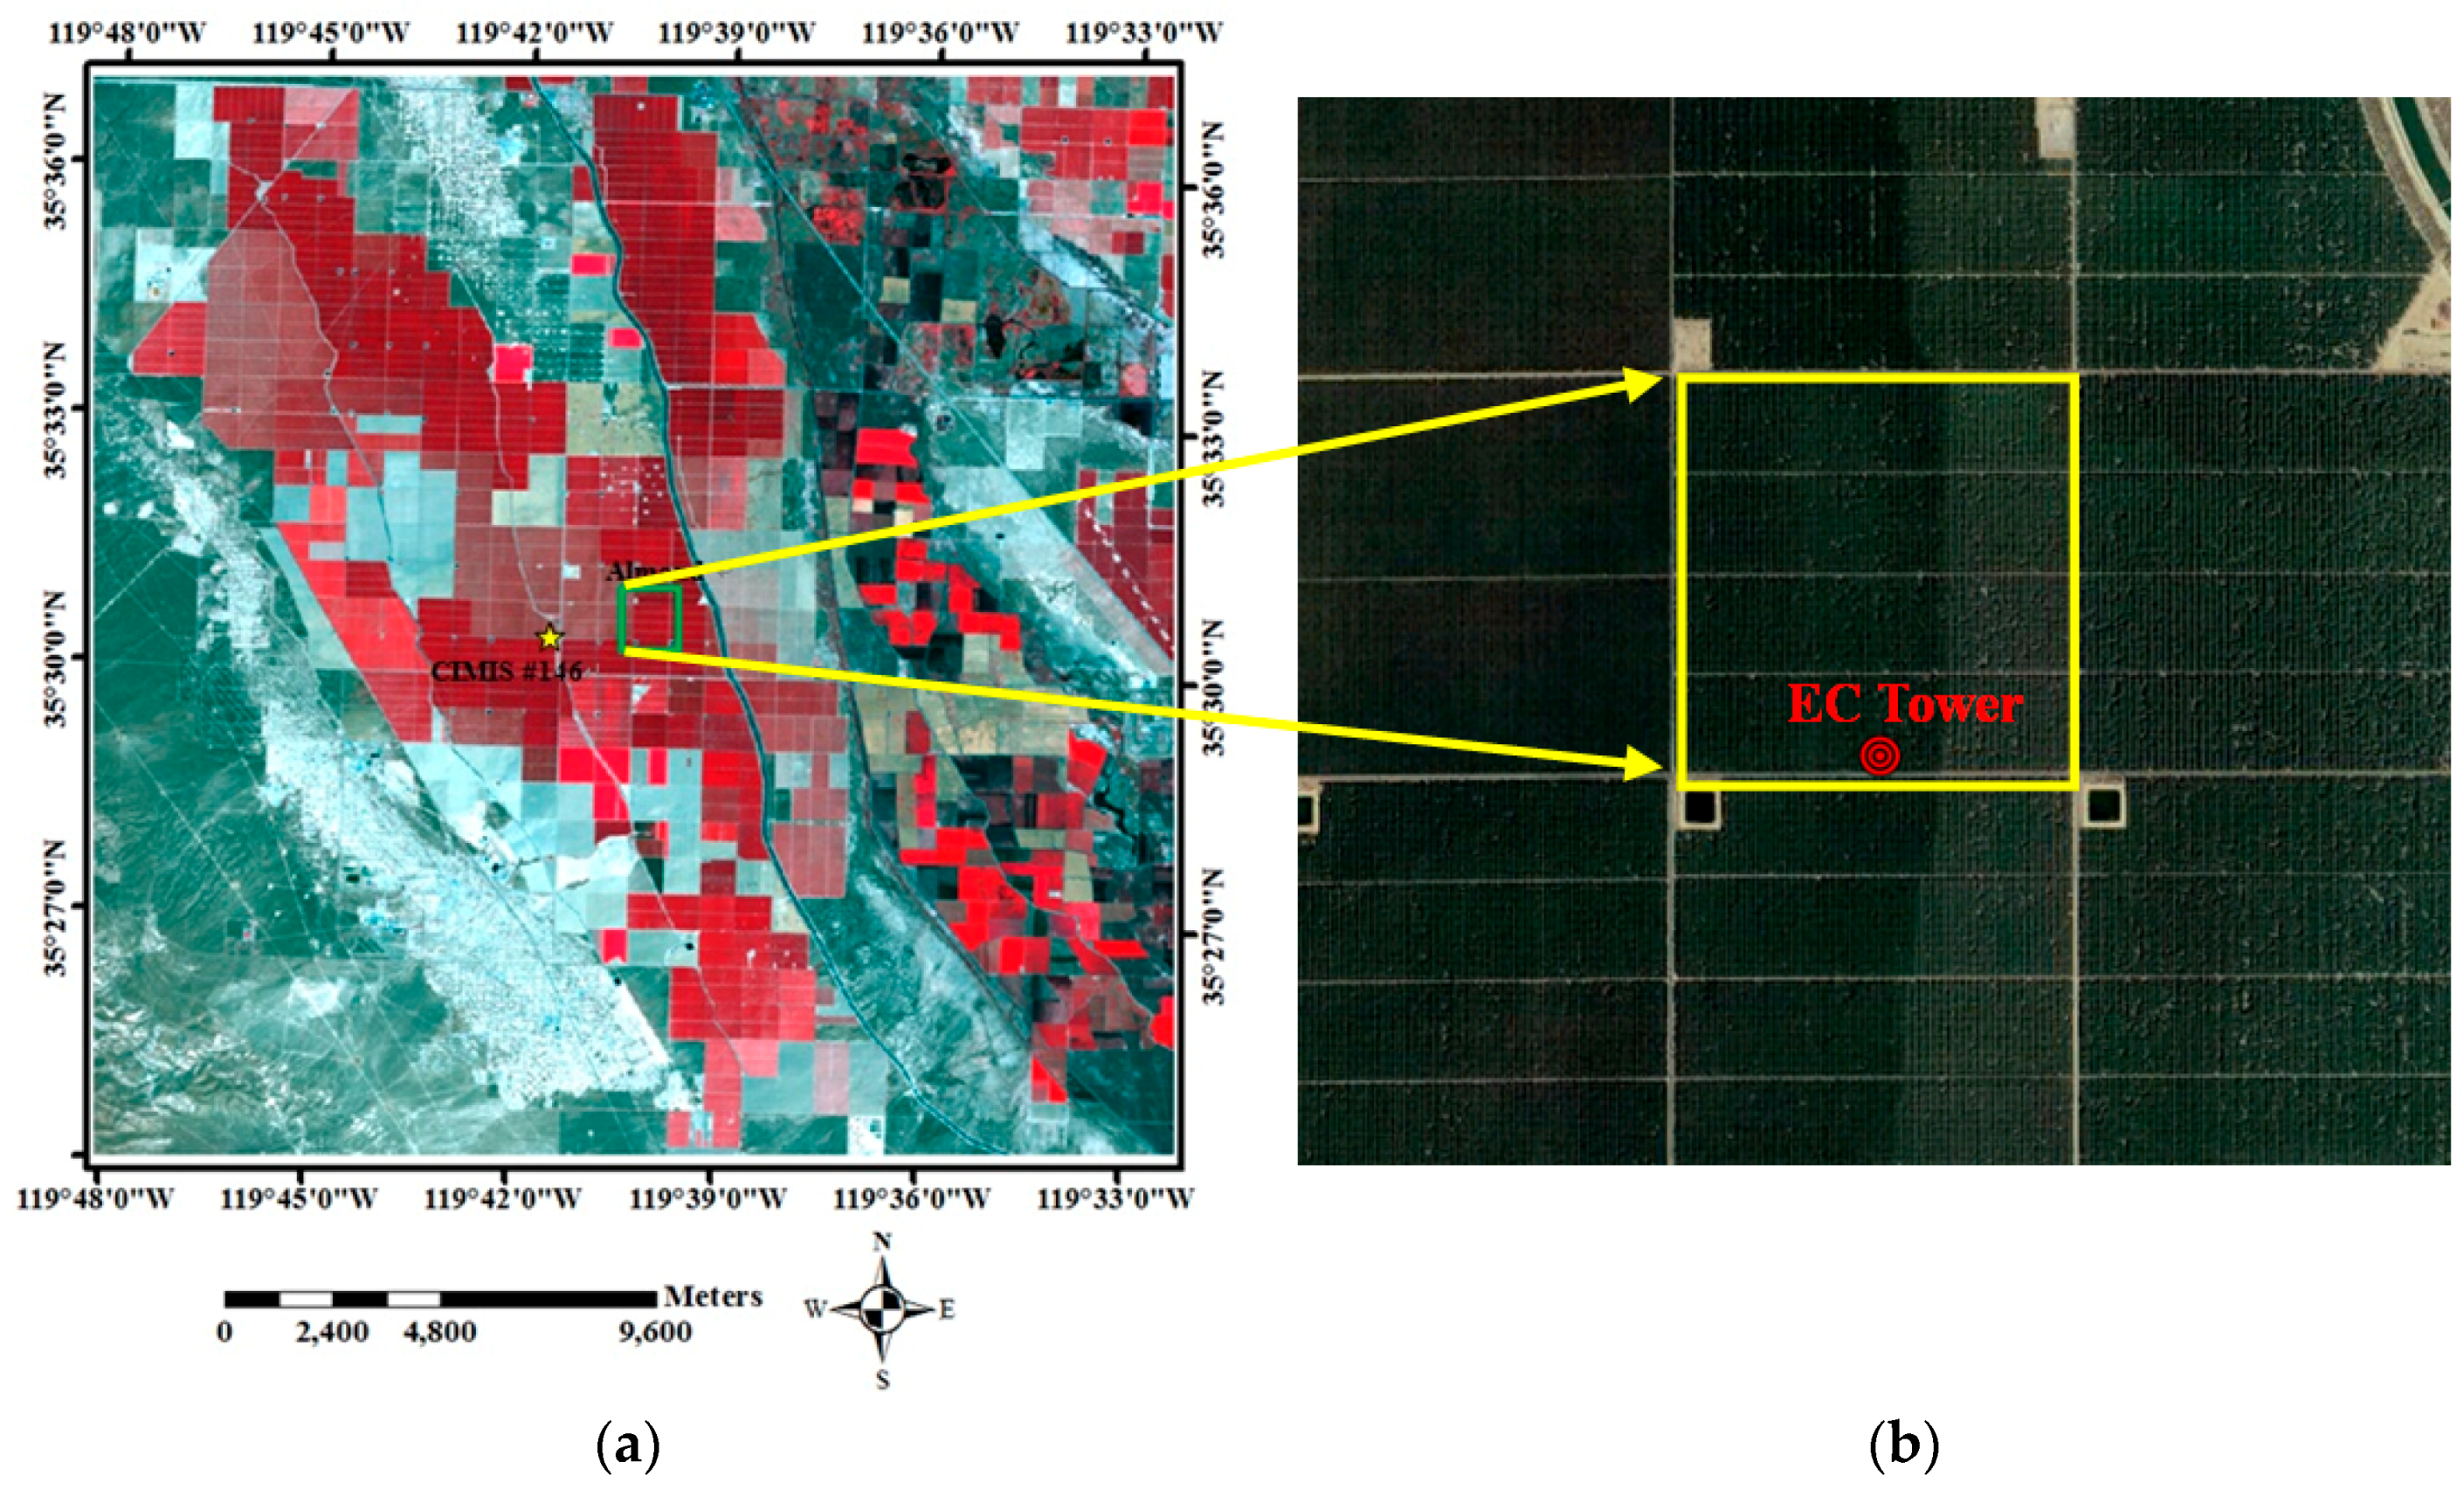
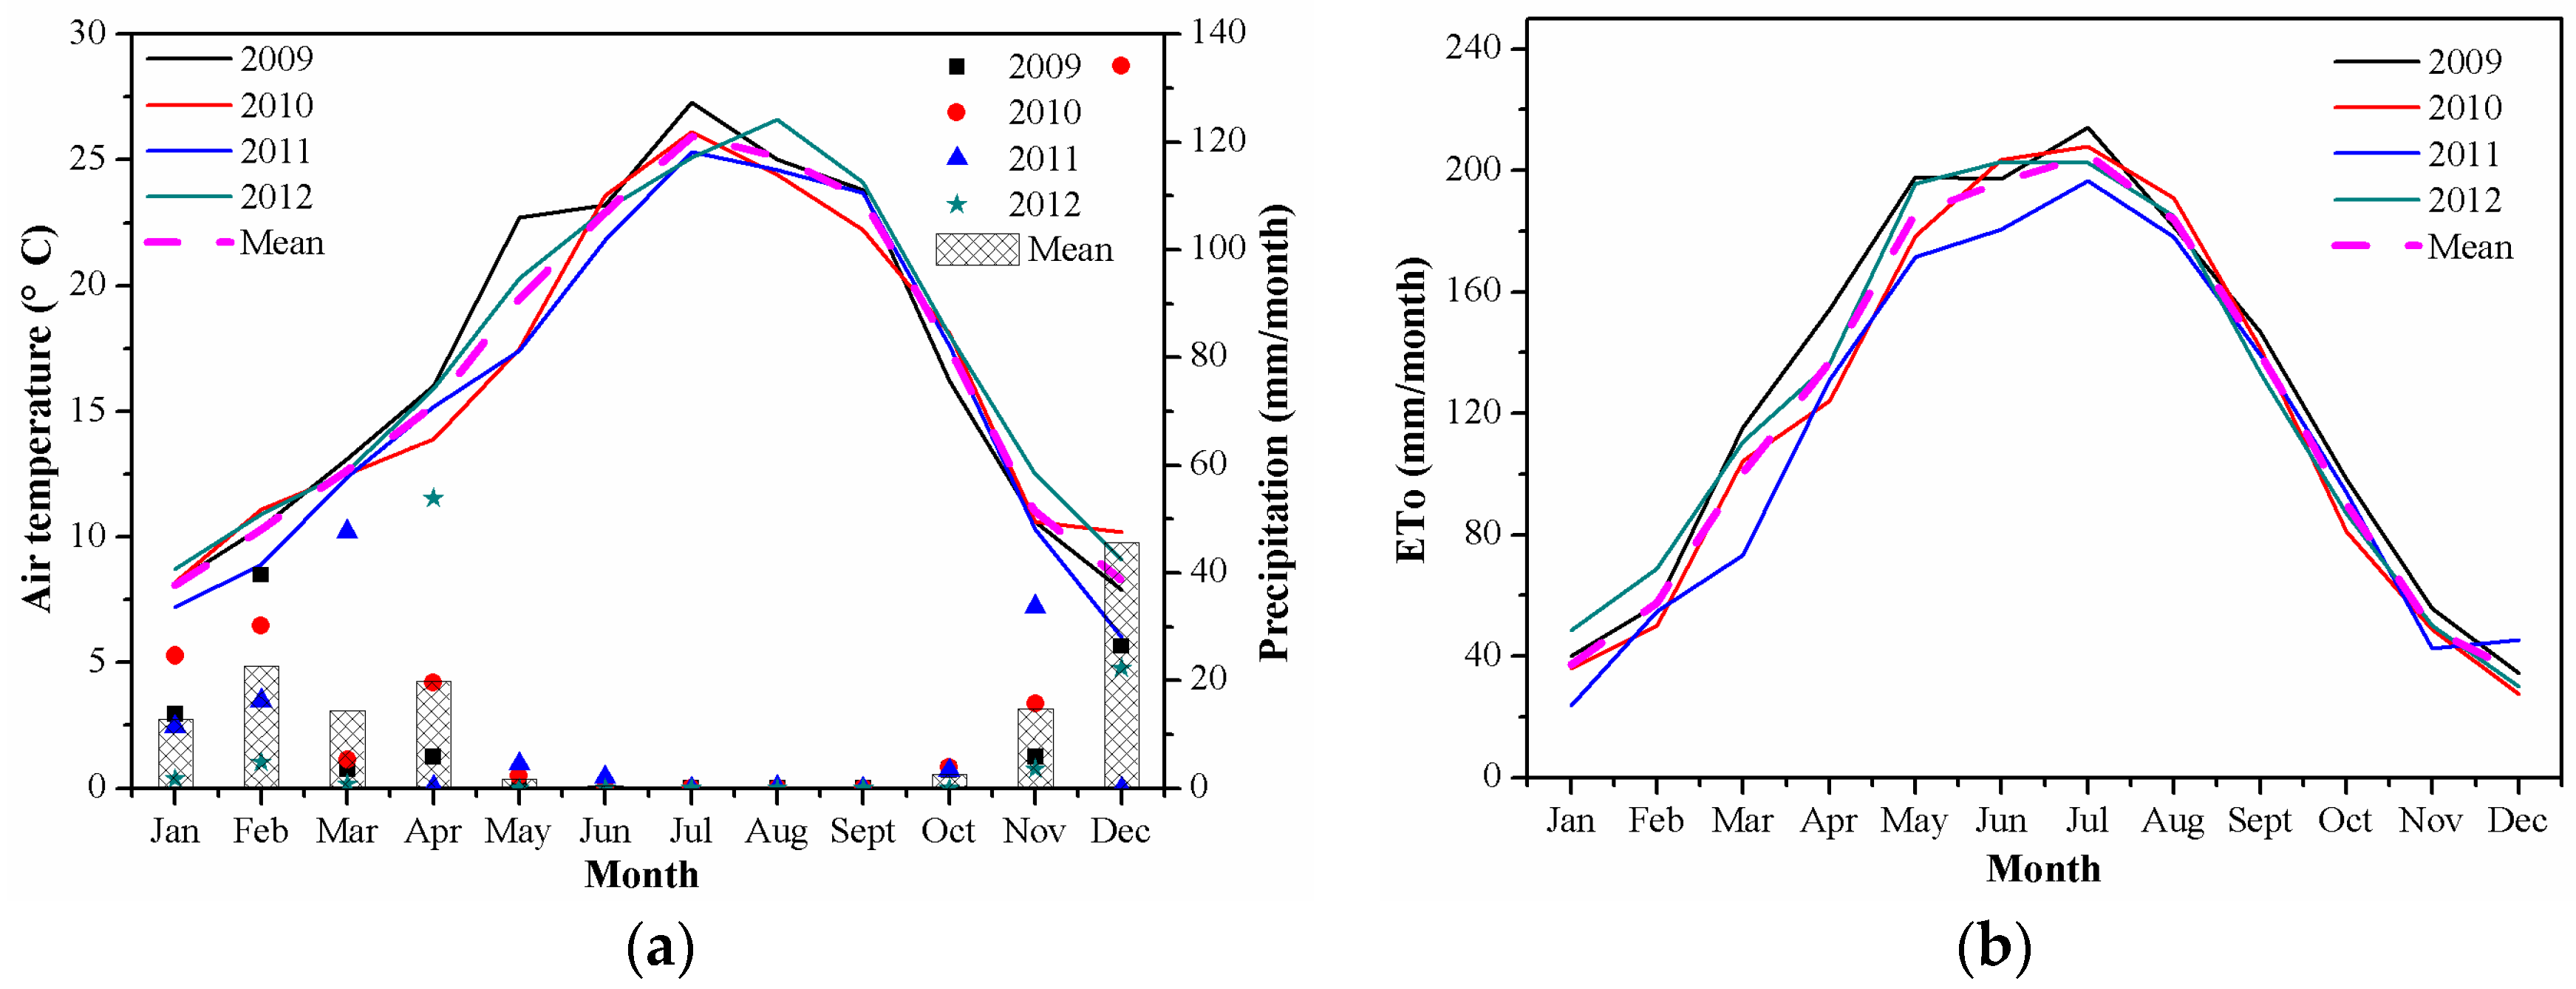
2.1. Study Area

The study area was a 60 ha mature almond orchard (Prunusdulcis) located near Lost Hill in Kern County, in the southern San Joaquin Valley of California (35.510°N, 119.667°W; Figure 1). The almond trees were planted in 1999 on a Milham sandy loam, with South to North orientation, 6.4 m between trees in the rows, and 7.3 m between the rows [37]. Two types of micro-irrigation systems, i.e., drip and fanjet, were used to water the orchard. This orchard was relatively homogeneous in terms of canopy structure since similar soil water storage was achieved for all trees on purpose through a careful management of the two micro-irrigation systems during 2009–2012. Almond trees were about 7 m tall during our study period from 2009 to 2012.
San Joaquin Valley has a typical Mediterranean climate. Mean annual temperatures ranged from 15.9 to 17.2 °C during 2009–2012. Summer months are hot and dry, while winter months are mild and wet (Figure 2a). Most rainfall occurs in winter and spring from November to April. Precipitation varied significant from year to year, e.g., annual precipitation varied from 98.5 mm in 2009 to 235.7 mm in 2010. Almond trees flower in late February to early March and reach almost full canopy cover by late March. Harvest typically occurs in late August to mid-September.
The reference ETo related to grass had a strong seasonal cycle, ranging from 23.8 mm/month in January to 214.1 mm/month in July (Figure 2b). The annual accumulated reference ETo was 1492.2, 1393.8, 1330.7, and 1450.8 mm/year in 2009–2012, respectively. The almond orchard was irrigated following typical practices in the upper San Joaquin Valley.

2.2. Remotely Sensed Data

Landsat 5 TM and 7 ETM+ observations were obtained from USGS (http://earthexplorer.usgs.gov/) for path 42 and row 35 during 2009–2012, covering the almond orchard study area (Supplementary Materials Table S1). Forty-six cloud-free images were obtained during the four year study period, with an average of 12 images per year, mostly from April to November. The Landsat revisiting time was 16 days, but most images during December to March rain season were not usable for our analysis due to frequent cloud cover. All the images were subsetted to a common domain, as shown in Figure 1a. A careful examination of individual Landsat 7 ETM+ images showed that this domain had no data gaps during the study period. This subset of 801 by 801 pixels included both bare soil and well-watered full cover vegetation areas, as needed by METRIC approach for the purpose of selecting cold and hot pixels to calculate sensible heat.

2.3. Micrometeorological Measurements

2.3.1. Station Reference Evapotranspiration

Reference ETo, associated with well-irrigated grass, and other meteorological data were obtained from CIMIS (http://www.cimis.water.ca.gov/), as ancillary inputs to the METRIC algorithm. CIMIS was jointly developed by the California Department of Water Resources (DWR) and the University of California, Davis (UCD) in 1982 to inform water resource and irrigation management. CIMIS currently operates a network of 164 automated stations measuring weather parameters over well-watered standardized grass surface across California. A typical ETo station consists of several sensors including pyranometer, thermistor, HMP35 temperature and humidity probe, wind vane, anemometer, and tipping-bucket rain gauge to collect information on solar radiation, soil temperature, air temperature, relative humidity, wind direction and speed, and precipitation, respectively. Data are collected every minute and archived as totals or averages each hour. Hourly and daily values of reference ETo are not measured directly, but calculated from meteorological data using both CIMIS Penman equation and the standardized reference evapotranspiration equation for short canopies [6]. The standardized ETo equation data were used in this study. ETo was only used for the internal calibration of energy balance and for calculating the fraction of grass reference ET as an index to represent the relative change in weather [17] (See 3.2 below).
The closest CIMIS station, Belridge station (CIMIS #146; Lat/Lon: 35.50°N/119.69°W), is approximately 2 km away from the almond orchard (Figure 1a). Belridge station was located near the center of footprint of Landsat 5 TM and 7 ETM+ image subsets, and thus was selected to provide weather input data sets and reference ETo for the METRIC approach in the study area. In particular, we used hourly reference ETo, air temperature, vapor pressure and wind speed at Landsat overpass time, typically around 10:30 a.m., and daily reference ETo during Landsat overpass dates from Belridge CIMIS station. Hourly reference ETo was used to internally calibrate METRIC approach for sensible heat flux calculation. Air temperature was required to correct land surface temperature (LST) estimates from Landsat thermal imagery. Daily reference ETo was used to convert instantaneous ET at Landsat overpass time to daily ET over the almond orchard in the METRIC approach, as shown below.

2.3.2. Actual Evapotranspiration Measurements

Evapotranspiration was measured with a micrometeorological tower installed 9 m above the ground in the almond orchard in early 2008. This system includes a net radiometer, sonic anemometer, two thermocouples, and soil heat flux plates, which were assembled to measure components of surface energy fluxes [38]. A REBS Inc. Q7.2 net radiometer was mounted at about 10 m height on the flux tower to measure net radiation (Rn). Sensible heat flux (H) was measured with both an RM Young 81000RE 3-d sonic anemometer and with Campbell Scientific Inc. FW3 fine-wire thermocouples as described in Shapland et al. [39]. The ground heat flux data were measured using three sets of ground heat flux packages, including a heat flux plate (REBS Inc., Seattle, WA, USA, HFT3) and a soil temperature averaging sensor (Campbell Scientific Inc., Logan, UT, USA, Tcav), which were established near the tower to measure the average ground heat flux (G) at the soil surface [40]. Latent heat flux (LE) was then estimated as the residual of the energy balance (LE = Rn − G − H) every half hour and converted to ET by dividing the LE in MJ m−2 per half hour by 2.45 MJ mm−1 of water vaporized. Hourly and daily ET of the almond orchard was calculated from the half-hourly data collected from 2009 through 2012. Using the station and measurement methodology described in Shapland et al. [39], there were almost no missing half hour estimates of almond ET. Daily and monthly calculations of ET were used to validate the METRIC approach for estimating and mapping almond ET.

3. Methodology

3.1. Landsat 5 TM and 7 ETM+ Data Preprocessing

The digital number (DN) of visible, near infrared and shortwave infrared bands of Landsat 5 TM and 7 ETM+ was first converted to radiance, and then atmospherically corrected to surface reflectance by using Landsat Ecosystem Disturbance Adaptive Processing System (LEDAPS) [41]. Surface albedo [42], normalized difference vegetation index (NDVI) [43] and leaf area index (LAI) [44] were derived from the spectral reflectances to calculate energy fluxes (Rn, G, and H) in the METRIC approach.
The original resolution of the thermal band (band 6) is 120 m. We here downscaled the thermal data to a 30-meter resolution to match the resolution of the reflective bands by using cubic convolution method. The thermal band DN was then converted to radiance using the coefficients provided in the imagery metadata. A correction to the radiance was further performed using the method of Wukelic et al. [45], and the Plank equation was then applied to compute the land surface temperature (LST). Cloud fraction (CF) mask for each Landsat image, provided by USGS (http://earthexplorer.usgs.gov/), was also used to remove data affected by cloud and cloud shadow.

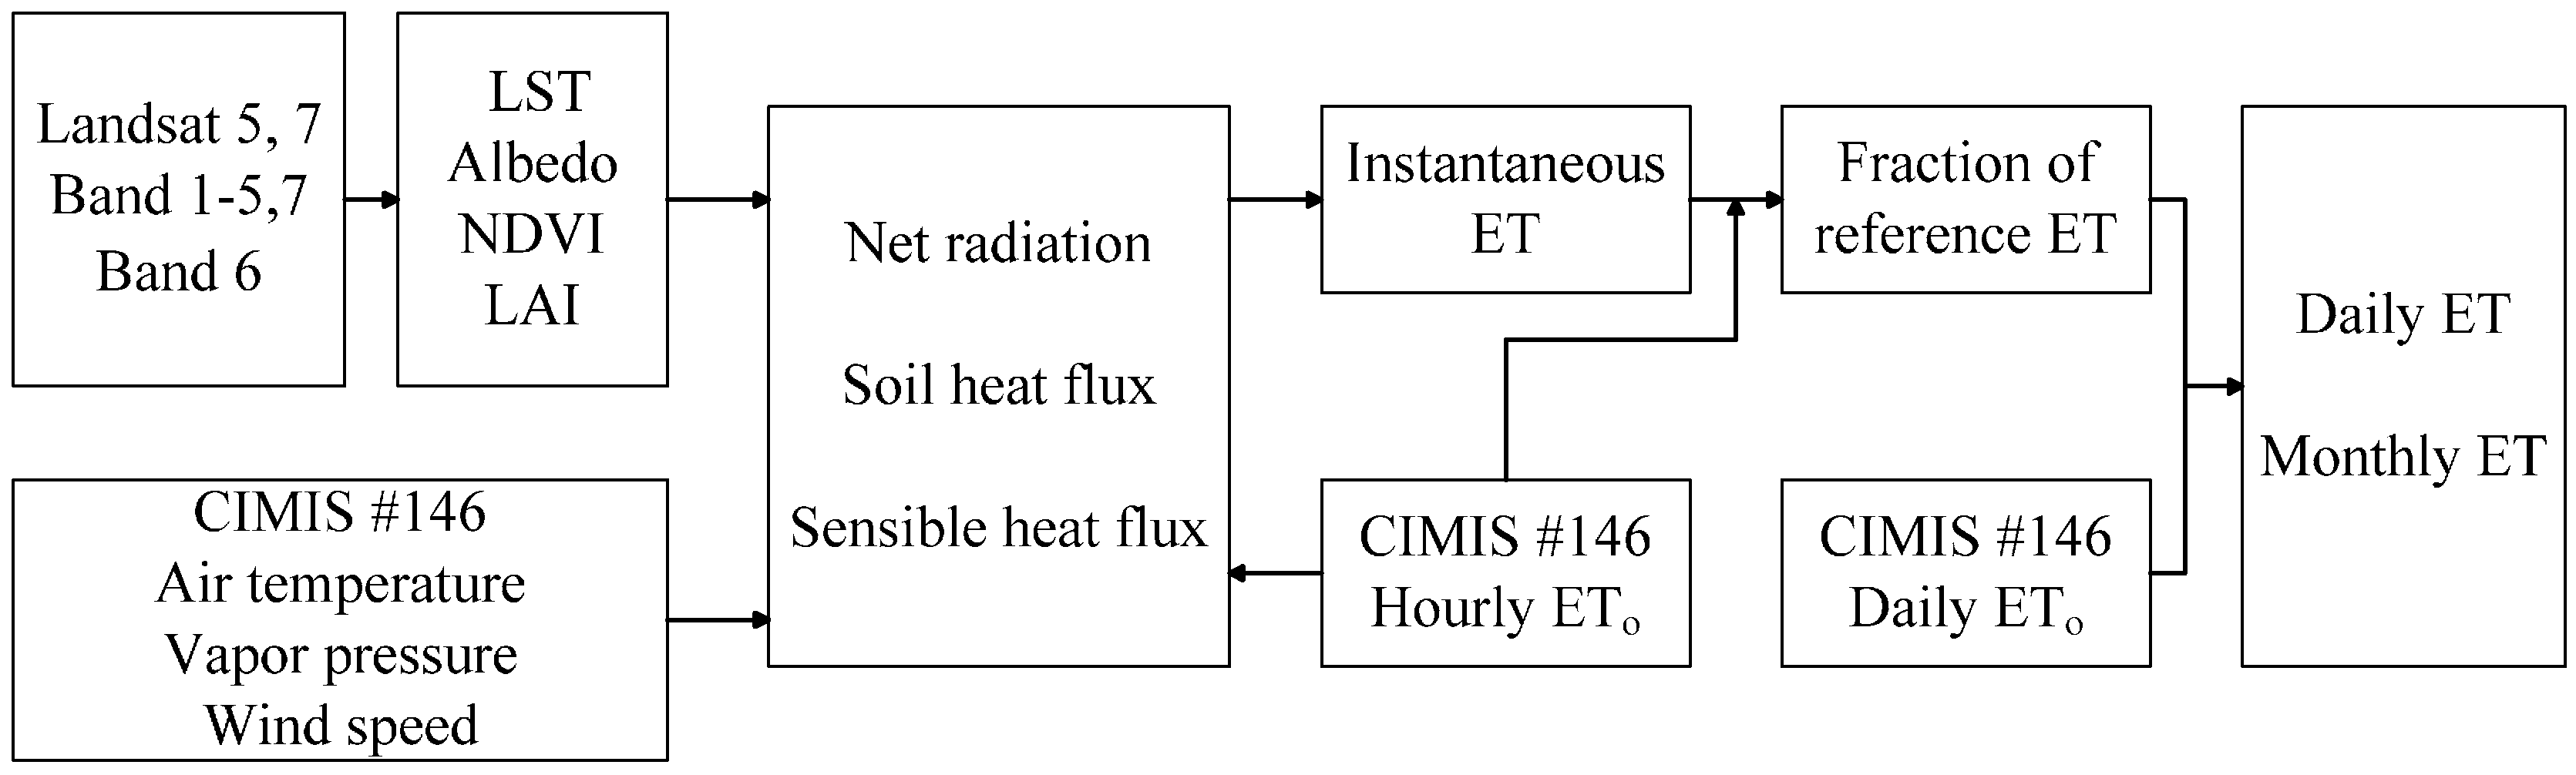
3.2. METRIC Evapotranspiration Estimate: General Approach

METRIC™, a satellite-based surface energy balance approach, has been widely used to map field-scale crop ET, mostly over row crops. It is a one-source model that considers transpiration of vegetation and evaporation of soil as a whole. Latent heat flux (LE), directly related to ET, is computed as a residual according to surface energy balance equation (Equation (1)):
LE   = R n G H
The major energy components are estimated as below:
R n = ( 1 α ) * R s + R l R l ( 1 ε 0 ) * R l
G = ( 0.05 + 0.18 * e 0.52 * LAI ) * R n ( LAI 0.5 )
G = ( 1.80 * Ts 273.16 R n + 0.084 ) * R n   ( LAI < 0.5 )
H = ( ρ * c p * dT ) / r ah
where α is the surface albedo, Rs↓ is the incoming shortwave radiation (W/m2), Rl↓ is the incoming longwave radiation (W/m2), Rl↑ is the outgoing longwave radiation (W/m2), ε 0 is the broad band surface emissivity, ρ is the air density (1.15 kg/m3), c p is the air specific heat (1004 J/kg/K). Ts is the land surface temperature (K), and dT is the near surface-air temperature difference (K). dT is assumed to have a linear relationship with Ts (Equation (5)) as developed by Bastiaanssen [46] (Figure S1).
dT = a * Ts + b
where the coefficients a and b were calculated using two sets of “hot” and “cold” anchor pixels, as shown below:
a = dT hot dT cold Ts hot Ts cold   b = dT hot a * Ts hot
where dT hot = H hot * r ah hot ρ * c p and dT cold = H cold * r ah cold ρ * c p . The initial values of H, r ah , and Ts were from the selected cold and hot pixels at the beginning of the iteration.
r ah is the aerodynamic resistance to heat transport (s/m). An iterative method was applied to calculate both r ah and H to reduce the effects of buoyancy of heated, light air at the surface. The algorithm started with finding a sets of “hot” and “cold” pixels. It assumed that LE equals to 0.05 and 1.05 times reference ET (ETo) for “hot” and “cold “pixels at the beginning of the iteration, and then calculated dThot and dTcold (Equation (4)), followed by calculating a and b, and then updating dT, H, and r ah . We used 5% of reference ET, instead of 0, to initiate the LE for “hot” pixels, considering the possibility of soil moisture content in bare soils shown by [17]. We tested the possible impact of using ETo for internal calibration, and found that using 1.05 as a constant led to the closest agreement between observed and estimated ET. The Monin–Obuknov length (L) was used to define the stability conditions of the atmosphere during iteration in METRIC [17]. The iteration stops when the value of r ah remains stable [44] (see Figure S1). After the convergence of the hot and cold pixels, iterations are also needed to converge the surface energy balance components. Dhungel et al. [47] demonstrated the improved behavior of surface energy balance convergence in the low wind speed, which is particularly important to reduce uncertainty in surface energy balance components due to the lack of the convergence. In our study, we set that the iteration process of H calculation stops when the coefficients of a and b remain stable. Our test showed that it typically takes 5 or 6 iterations to reach convergence while low wind conditions required more iterations. A simplified flowchart of METRIC approach is shown in Figure 3.
In METRIC, ET of each pixel at Landsat overpass time (10:30 a.m.) is calculated from Equation (7), and then the fraction of reference ET (EToF) is calculated by dividing instantaneous ET by hourly reference ETo (Equation (8)), obtained from Belridge CIMIS station. It assumes that the value of EToF at Landsat overpass time is the same as the average value of 24 h during Landsat overpass day [17,26]. Finally, the daily ET at each pixel is calculated as a product of EToF and daily reference ETo (Equation (9)), which is the accumulative 24 h reference ETo at the station during the dates when Landsat satellite overpasses every 16 days and when imagery is not obscured by cloud.
ET inst = 3600 * LE / ( λ * β w )
ET o F = ET inst / ET O _ inst
ET _ daily = ET o F * ET O _ daily
where ETinst is the instantaneous ET in mm/hour, 3600 is used for converting from seconds to hours, λ is the latent heat of vaporization in J/kg, βw is the density of water, ETo_inst is the hourly reference ET of grass at the time of image, ET_daily is the 24 h actual ET, and ETo_daily is the accumulative 24 h reference ETo on the date of image acquisition.
ET-based irrigation scheduling requires continuous daily ET estimate especially during growing season, so that ET losses could be replaced by applying the proper amount of water at the right time to meet the plant water demands. We applied a cubic spline interpolation to fill in the gaps of daily EToF using the Landsat-based estimates of EToF at the four most adjacent dates when Landsat clear sky observations were available. A cubic spline was first fitted to generate a smoothed EToF curve based on the non-linear curve nature of the temporal dynamics of fraction of reference ET [44]. The complete time series of daily EToF was then derived from the splined curve, and used in combination with the continuous daily reference ETo at the Belridge CIMIS station to derive daily ET estimate for every single day. Monthly, seasonal, and annual ET estimates were finally aggregated from daily values. The temporal interpolation was only done during the growing season from April to September, since there were too many missing data during October to March winter rainy season.

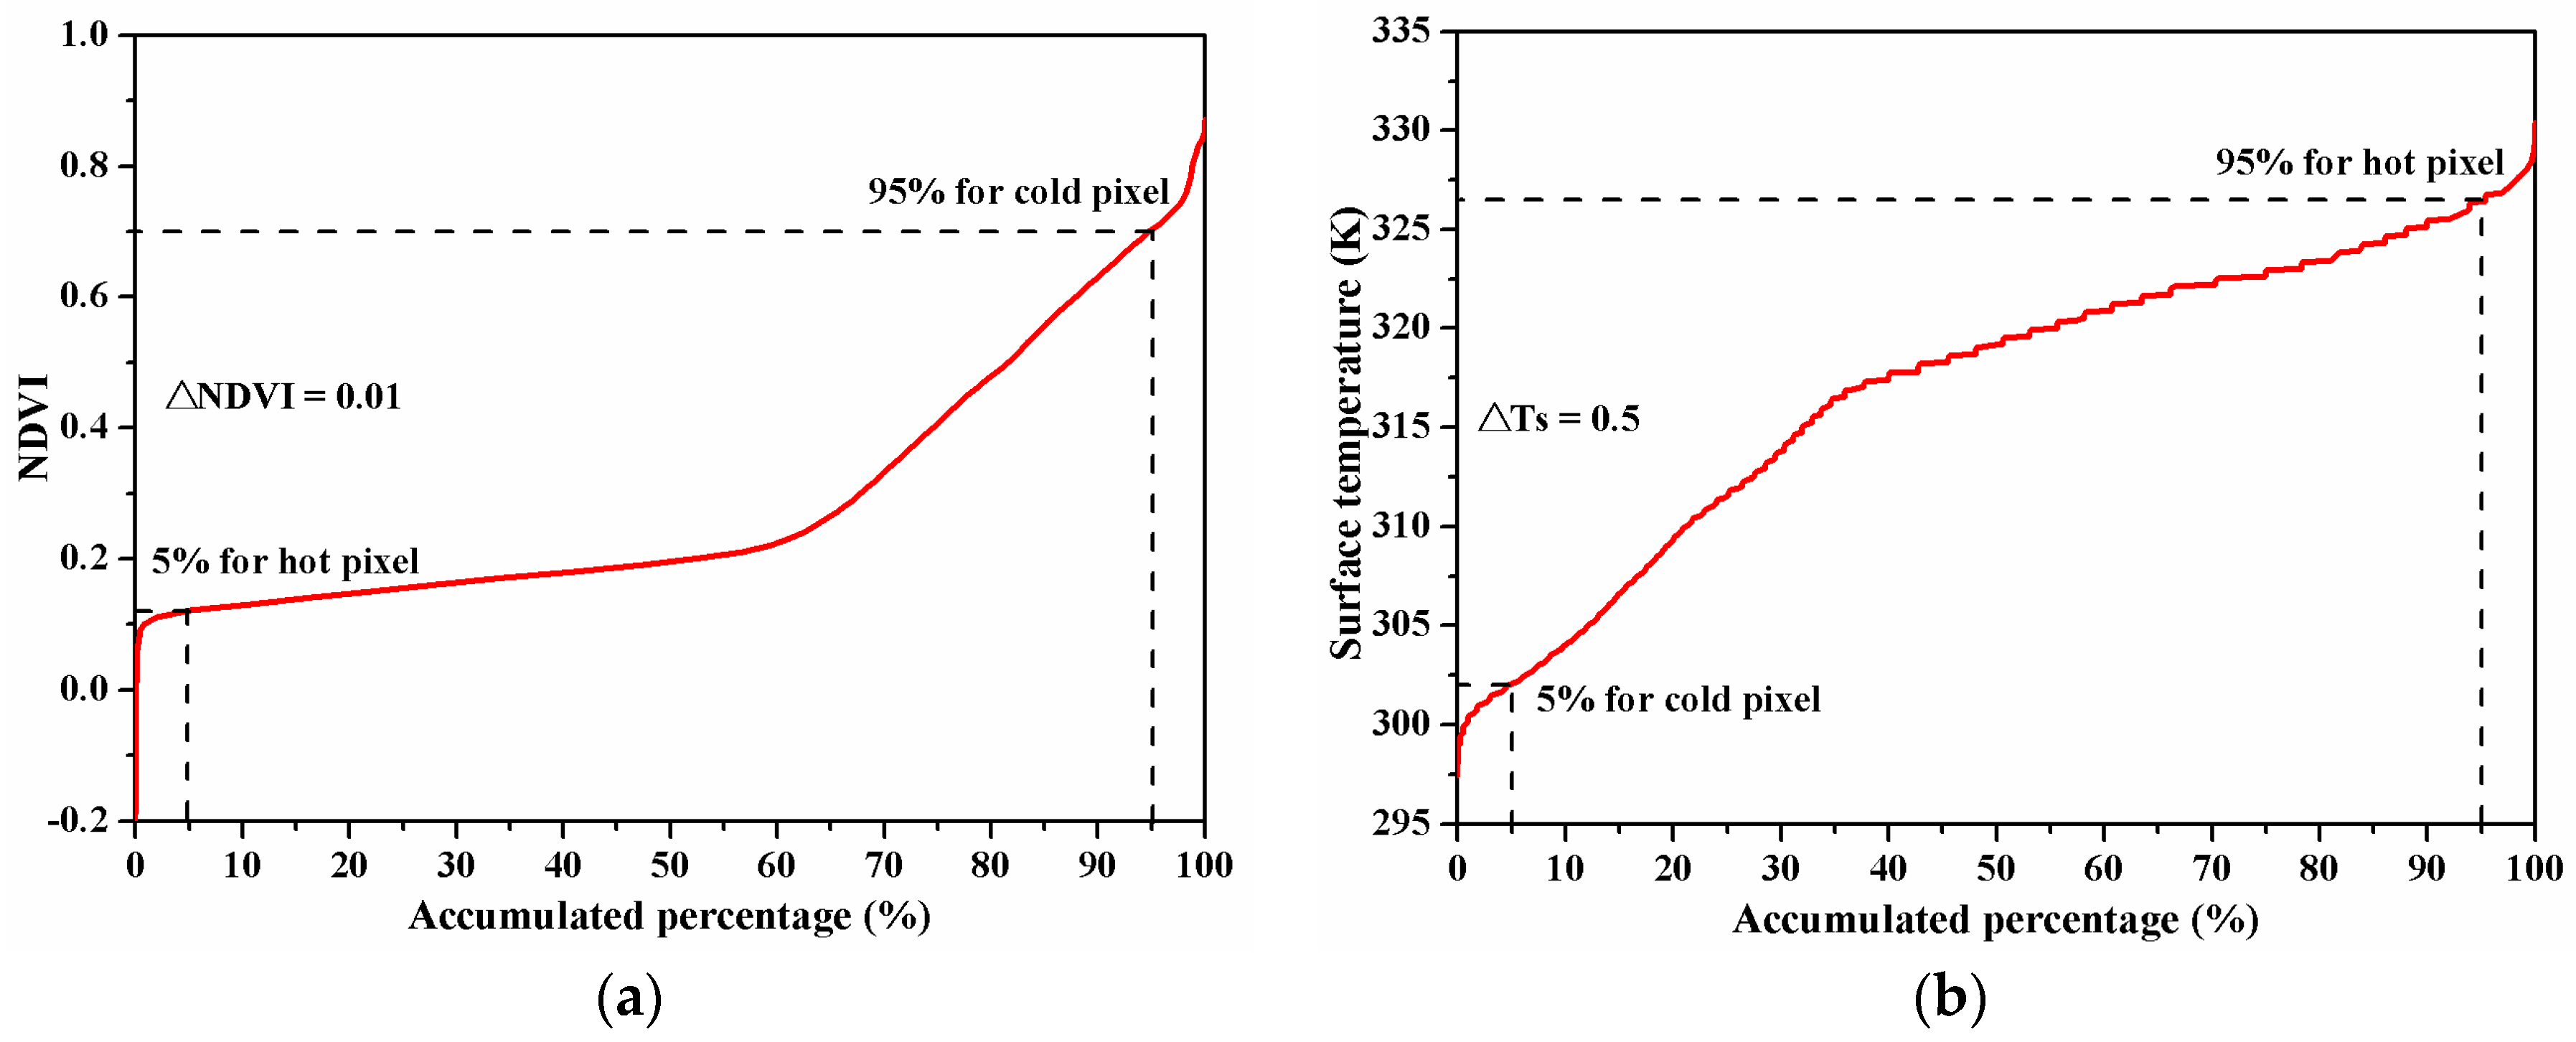
3.3. Automated “Cold” and “Hot” Pixel Selection

In order to estimate sensible heat flux (H) accurately, two “anchor” pixels, named “cold” pixel and “hot” pixel must be selected to determine the relationship between Ts and dT in the METRIC approach. “Cold” pixels represent well-watered, full-cover vegetation areas within an image, and thus have relatively higher NDVI and relatively low Ts. The “hot” pixels, namely dry and bare soil, on the other hand, usually have low NDVI but high Ts. The selection of these anchor pixels typically involves some training and manual image interpretation, and is often arbitrary. To make the process more consistent, we developed a method to select those pixels automatically based on the statistics of NDVI and Ts maps, following and integrating similar concepts proposed by previous studies [48,49,50,51]. The cumulative histogram of NDVI and Ts were first generated. The values of NDVI at the point of 5% (95%) and the values of Ts at the point of 95% (5%) in the accumulated percentage curves were used in combination as thresholds for identifying hot (cold) pixels. To allow for flexibility, we extracted all pixels falling both within ±0.01 of the NDVI thresholds and within ±0.5 °C of Ts threshold, and averaged over these two sets of pixels to calculate the mean Ts for “hot” and “cold” pixels (Figure 4). We tested imageries in different seasons and found that the resulting Ts − dT relationships with this automatic selection method were similar to those from manual selections.

3.4. Evaluation of Evapotranspiration Estimate

To assess the uncertainties of METRIC approach in estimating ET over the almond orchard, we compared the METRIC ET with field measurements. Comparisons were made for instantaneous, daily and monthly ET. Considering the fetch area of 50 by 50 m of the installed flux tower in the study area, we averaged the METRIC ET over 2 by 3 pixels centered at the flux tower location. Four statistics were reported, which are mean bias, mean relative difference (MRD), root mean squared error (RMSE) and determination coefficient (R2). The equations of bias, MRD and RMSE are shown as follows:
Bias = ET METRIC ET Tower
MRD ( % ) = | ET METRIC ET Tower | ET Tower * 100
RMSE = i = 1 n ( ET METRIC ET Tower ) 2 n
where ETMETRIC is METRIC-based ET estimate at Landsat 5 TM and 7 ETM+ overpass date and ETTower is ground-based ET measurement at the same day from micrometeorological tower. We also examined the ability of METRIC approach to capture the inter-annual and spatial variation of ET.

3.5. Simplified Empirical Approaches for Evapotranspiration Estimate

Many growers do not have the capacity to implement sophisticated remote sensing based algorithm for their irrigation management, especially on a daily basis. We thus also aimed to develop easy-to-use and cost-effective approaches for growers to estimate ET with easily accessible data such as NDVI and weather data in this study. We took advantage of the spatially explicit ET estimates derived from Landsat data, and examined the main factors controlling spatial and temporal ET variation using both temporal and spatial data. We quantified the relationship between METRIC ET, as a dependent variable, and NDVI, which potentially can be relatively easy to derive from imagery by drones, and a suite of environmental variables that growers have easy access to. Multivariate statistical models were built using three years of spatial data. The univariate linear and nonlinear relationships between ET and the explanatory variables were first examined, and then various combinations of linear and exponential terms of key ET driving factors, including NDVI, net radiation, and vapor pressure deficit, were explored. The parameters were optimized using “lsqcurvefit” in MATLAB to minimize the difference between predicted and METRIC-estimated ET. The models were validated with the rest year of both spatial ET data and field measured ET as well.

4. Results

4.1. Evaluation with Flux Tower Data

We compared the instantaneous METRC-based ET estimate using Landsat 5 TM and 7 ETM+ data, averaged over a 2 by 3 Landsat pixel window centered at the flux tower location, with ET values during 10:00 a.m. to 11:00 a.m. derived from flux tower measurements during Landsat overpassing dates. Aggregated ET estimates at daily, monthly, and annual time scales were also compared with corresponding field measurements in order to validate the performance of METRIC approach when it was applied to map ET at different time scales over an almond orchard in the southern San Joaquin Valley.

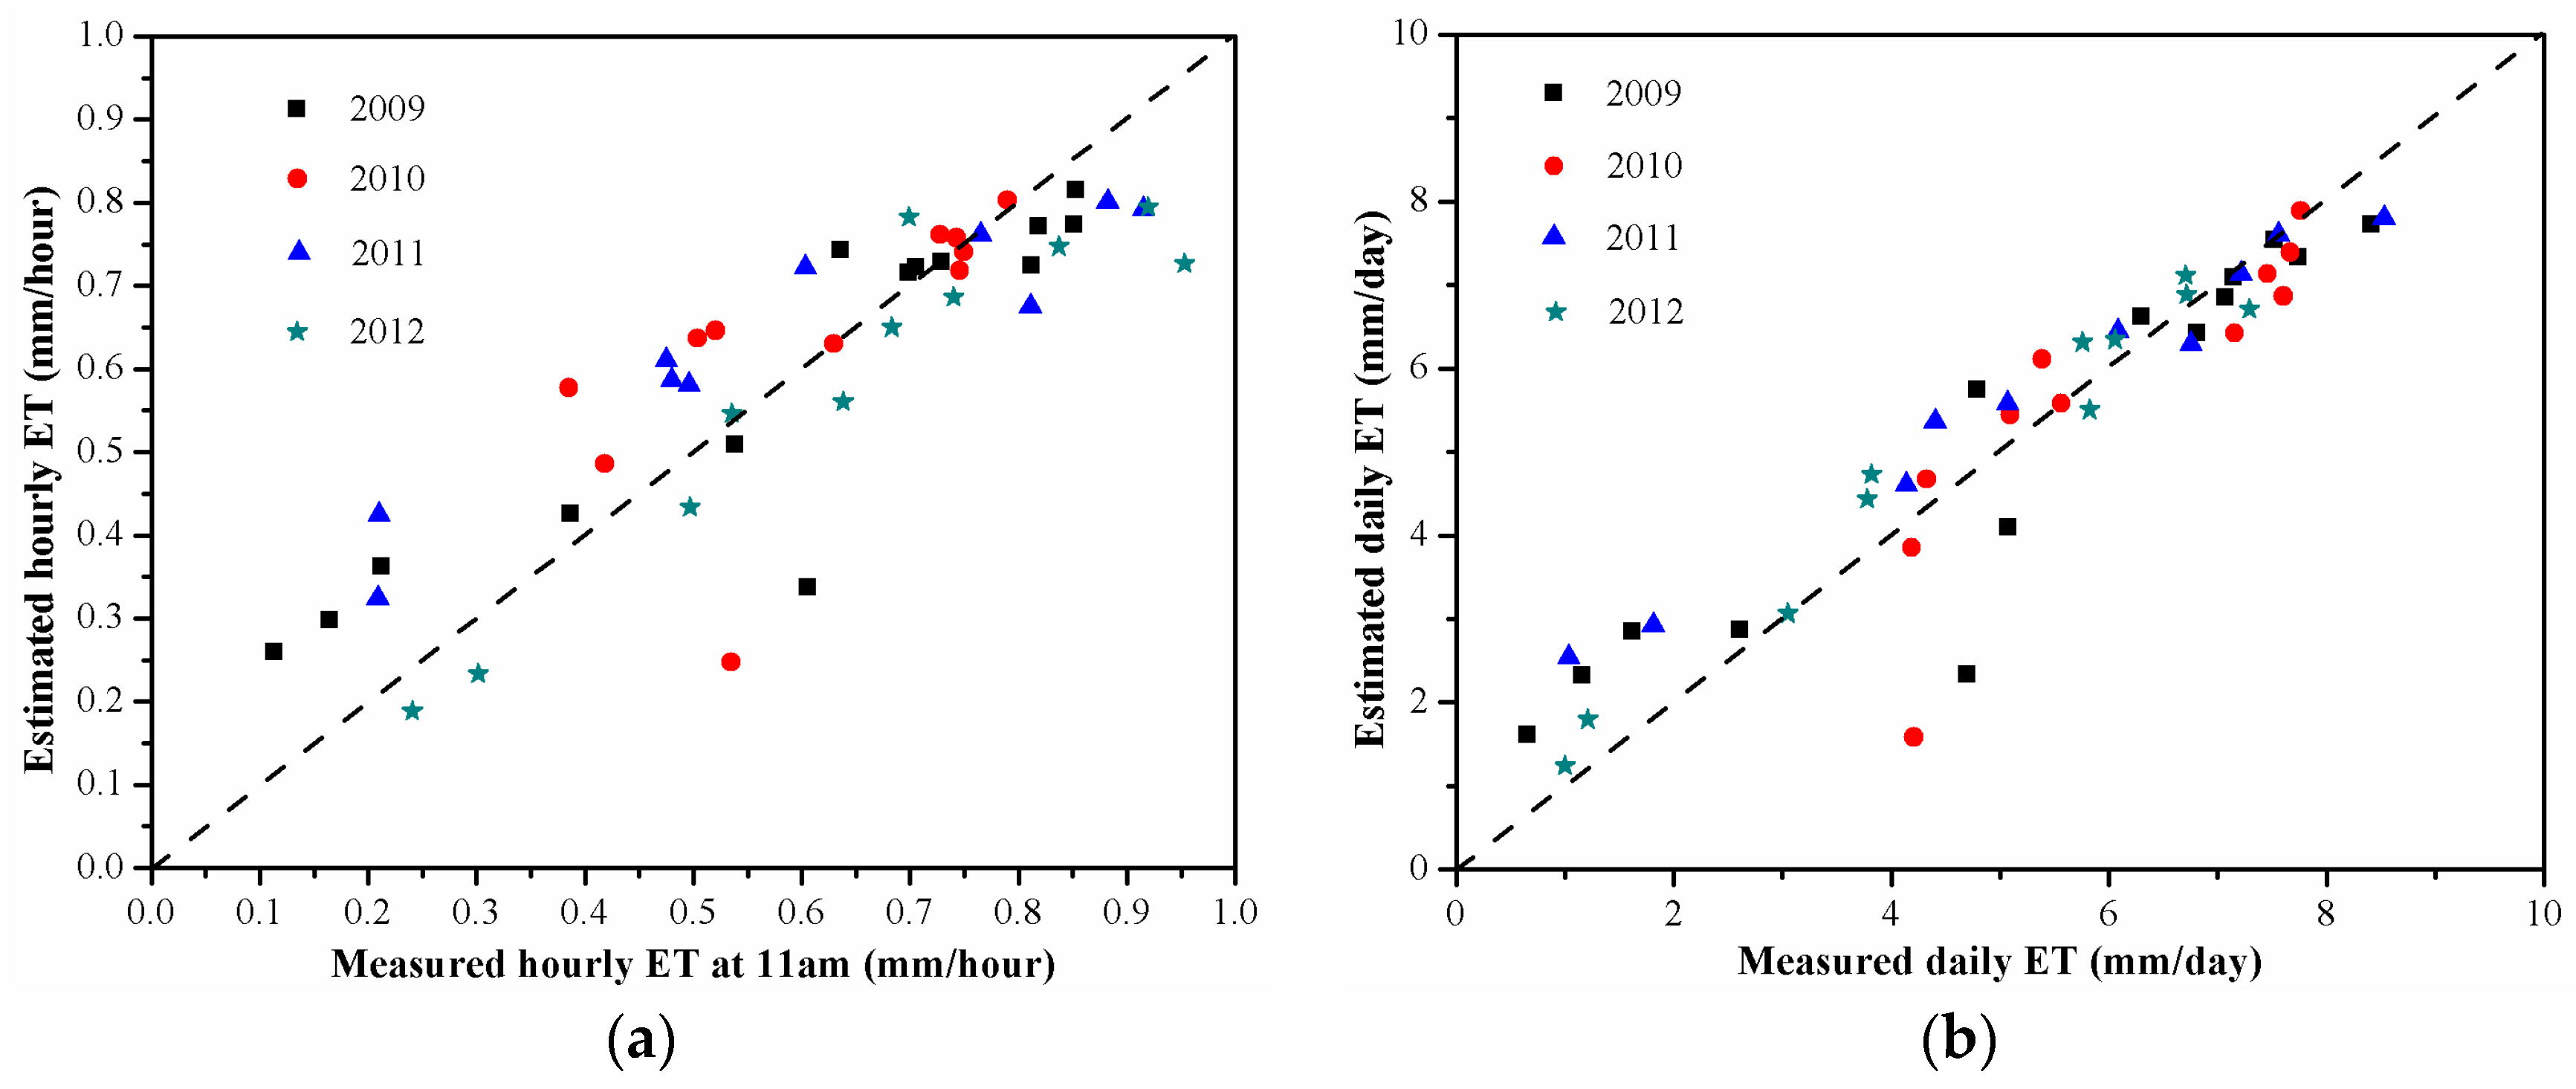
4.1.1. Instantaneous and Daily ET on Landsat Overpassing Dates

The instantaneous ET during Landsat overpassing time around 10:30 a.m., directly estimated through METRIC approach, agreed well with field measurements in general, with a R2 of 0.74 and RMSE of 0.11 mm/h, over a total of 46 Landsat overpassing cloud-free days from 2009 to 2012 (Figure 5a and Table 1). When aggregated at daily time scale, a better agreement was found, with a R2 of 0.87, RMSE of 0.80 mm/day. Higher accuracy was found during the growing season, e.g., R2 remains the same, but RMSE was reduced to 0.53 mm/day and mean relative difference (MRD) lowered to 8.0% (Figure 5b and Table 1).
The METRIC approach captured similar seasonal dynamics of daily ET as the field measurements (Figure 6 and Figure S2). For example, estimated ET varied from 1.61 mm on 3 December to 7.72 mm on 28 July in 2009. Similarly, the measured ET was lowest in January and December, increased gradually until June and July with a maximum of 9.15 mm/day on 20 June, and then declined again, reaching a minimum ET of 0.17 mm/day on 29 December. The large day-to-day fluctuation of field measured ET mostly followed that of the reference ETo. The mean daily METRIC-estimated ET was 5.10 mm/day, averaged over a total of usable 14 Landsat overpassing days in 2009, which was similar to that from the field measurements (5.12 mm/day) and about 7% higher than the mean daily reference ETo of 4.80 mm/day. A high bias of the METRIC approach was found in winter in both 2009 and 2010.

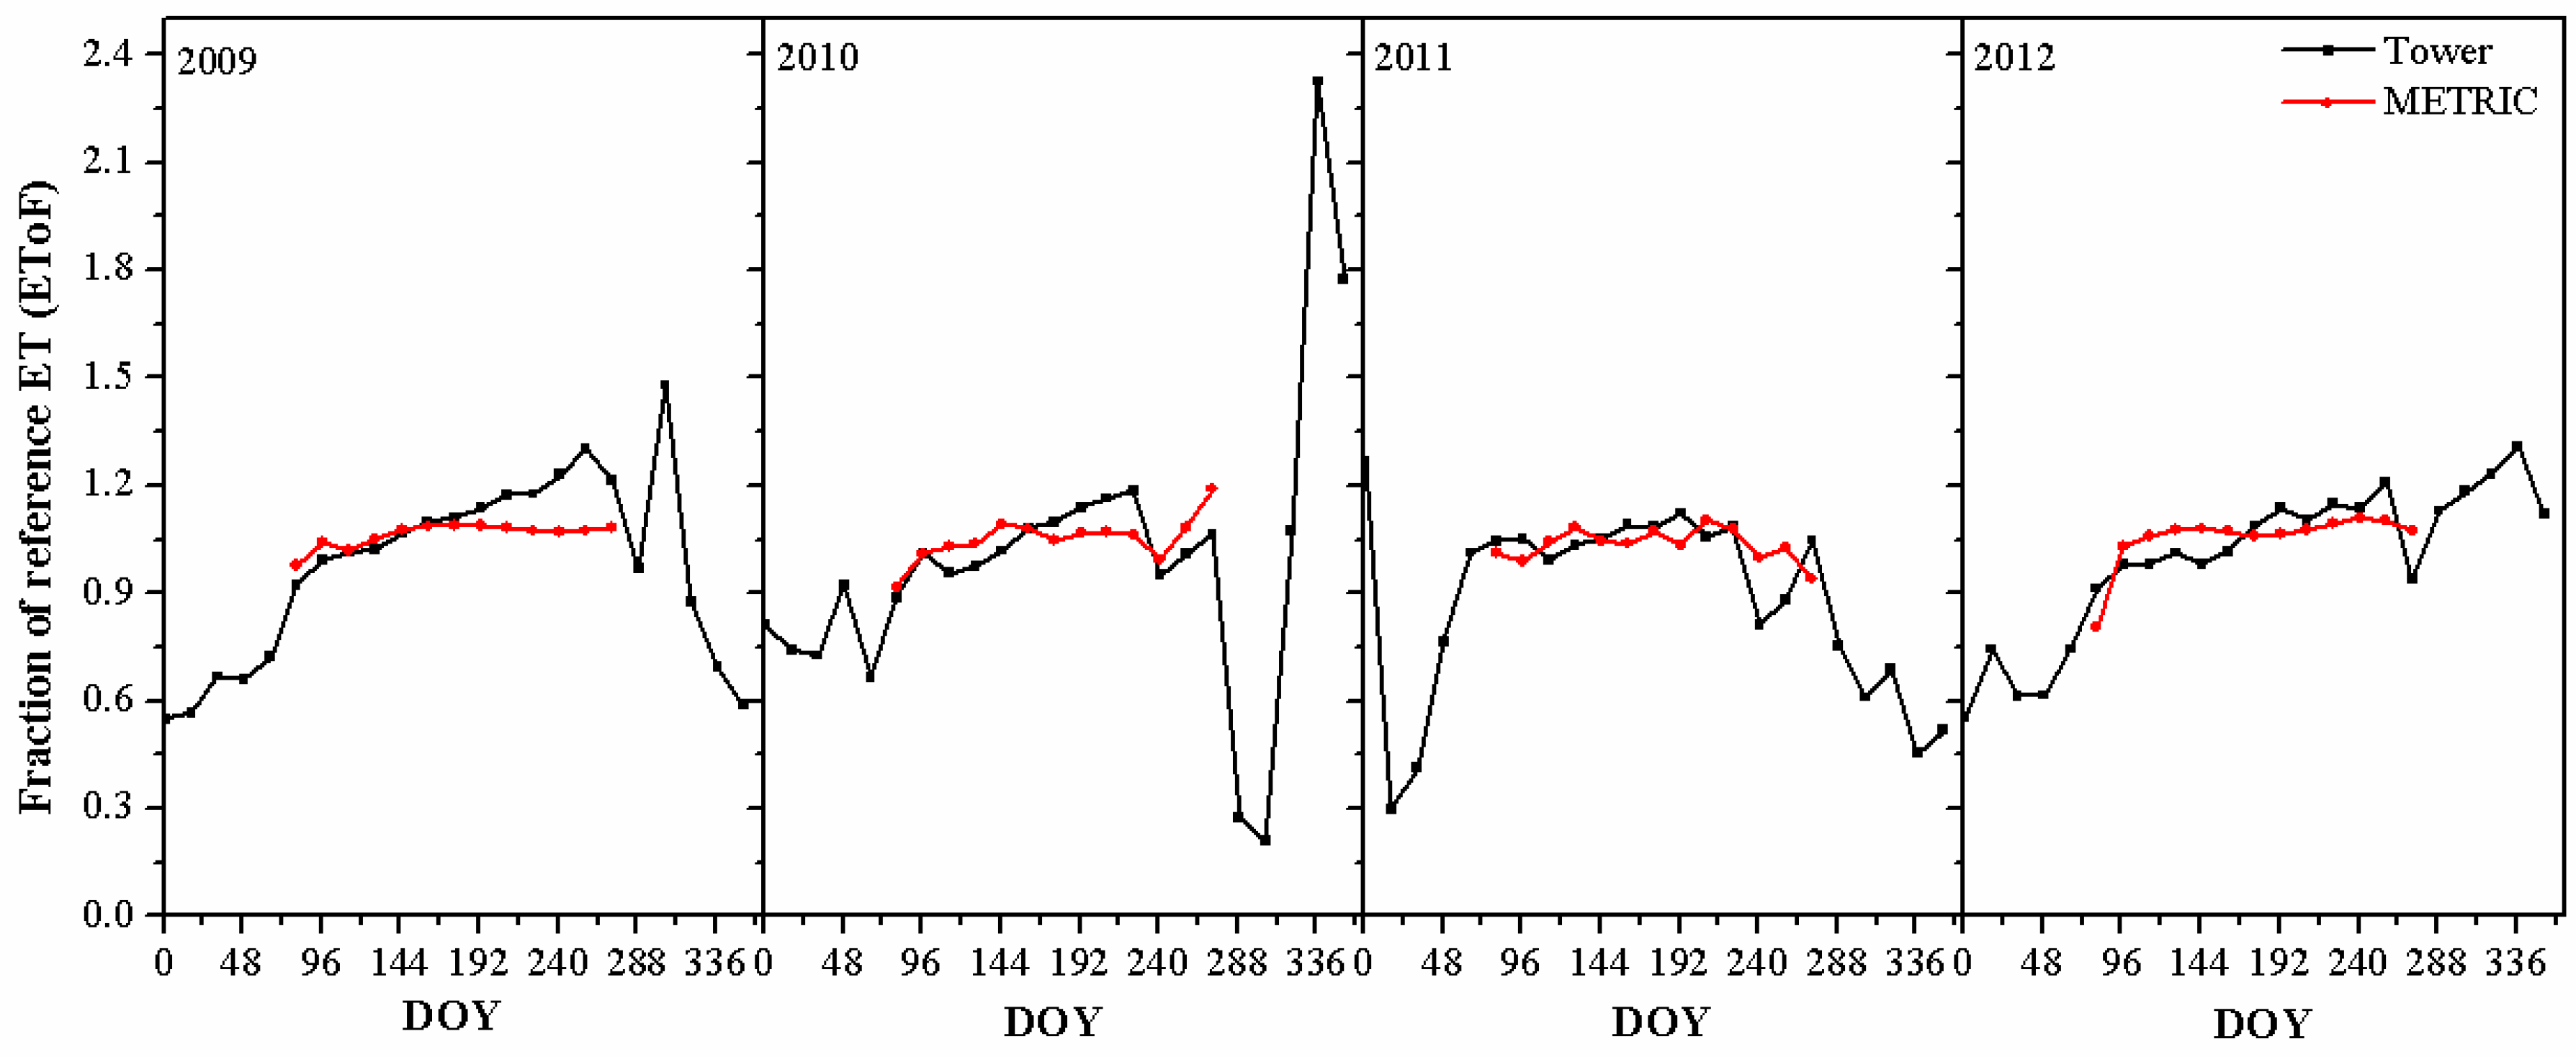
4.1.2. Fraction of Reference Evapotranspiration (EToF)

The daily time series of EToF derived from flux tower measurements showed some large day to day fluctuations, such as peaks (EToF > 1.30) on 10 April, 1 May, and 14 September in 2009; 21 April and 17 May in 2010; 8 April, 4 June, and 11 September (EToF = 0.54) in 2011, and 13 April in 2012 (Figure S3). The data spikes may be caused by irrigation events or by station maintenance. In addition, main spikes occurred during spring when a local high inversion fog and cloudiness is common and might cause temporal variability of the radiation balance. The METRIC-based EToF estimates could not capture this high frequency variation, limited by the 16-day revisiting time of the satellites and cloud cover. We therefore calculated a 16-day running average of field-based EToF as the ratio of 16-day running average of measured daily ET divided by 16-day running average of daily ETo (Figure 7). The complete time series of METRIC daily EToF was obtained using cubic spline interpolation from the available EToF estimates during Landsat overpassing days, and was then used to calculate the 16-day running average of METRIC EToF as show in Figure 7.
At a 16-day time scale, the average values of estimated EToF were close to those of measured EToF, with a MRD of 6.29% and a small bias of −0.01 from April to September in 2009–2012. Field-based EToF was mostly low from January to March, increased significantly from the beginning of April (EToF = 0.92) to August or the middle of September (EToF = 1.30), and then started to decrease at the end of September in general (Figure 7). For example, EToF increased from below 0.6 in January to 0.92 in April, reached its maximum at 1.30 in September, and decreased to 0.6 by the end of year in 2009. A similar trend was observed in 2012, when EToF was 0.91 in the beginning of April and reached 1.21 in the middle of September. The EToF during Landsat overpassing days followed this similar trend.

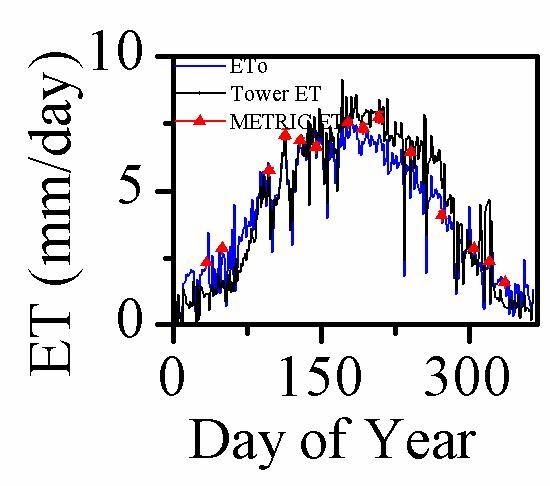
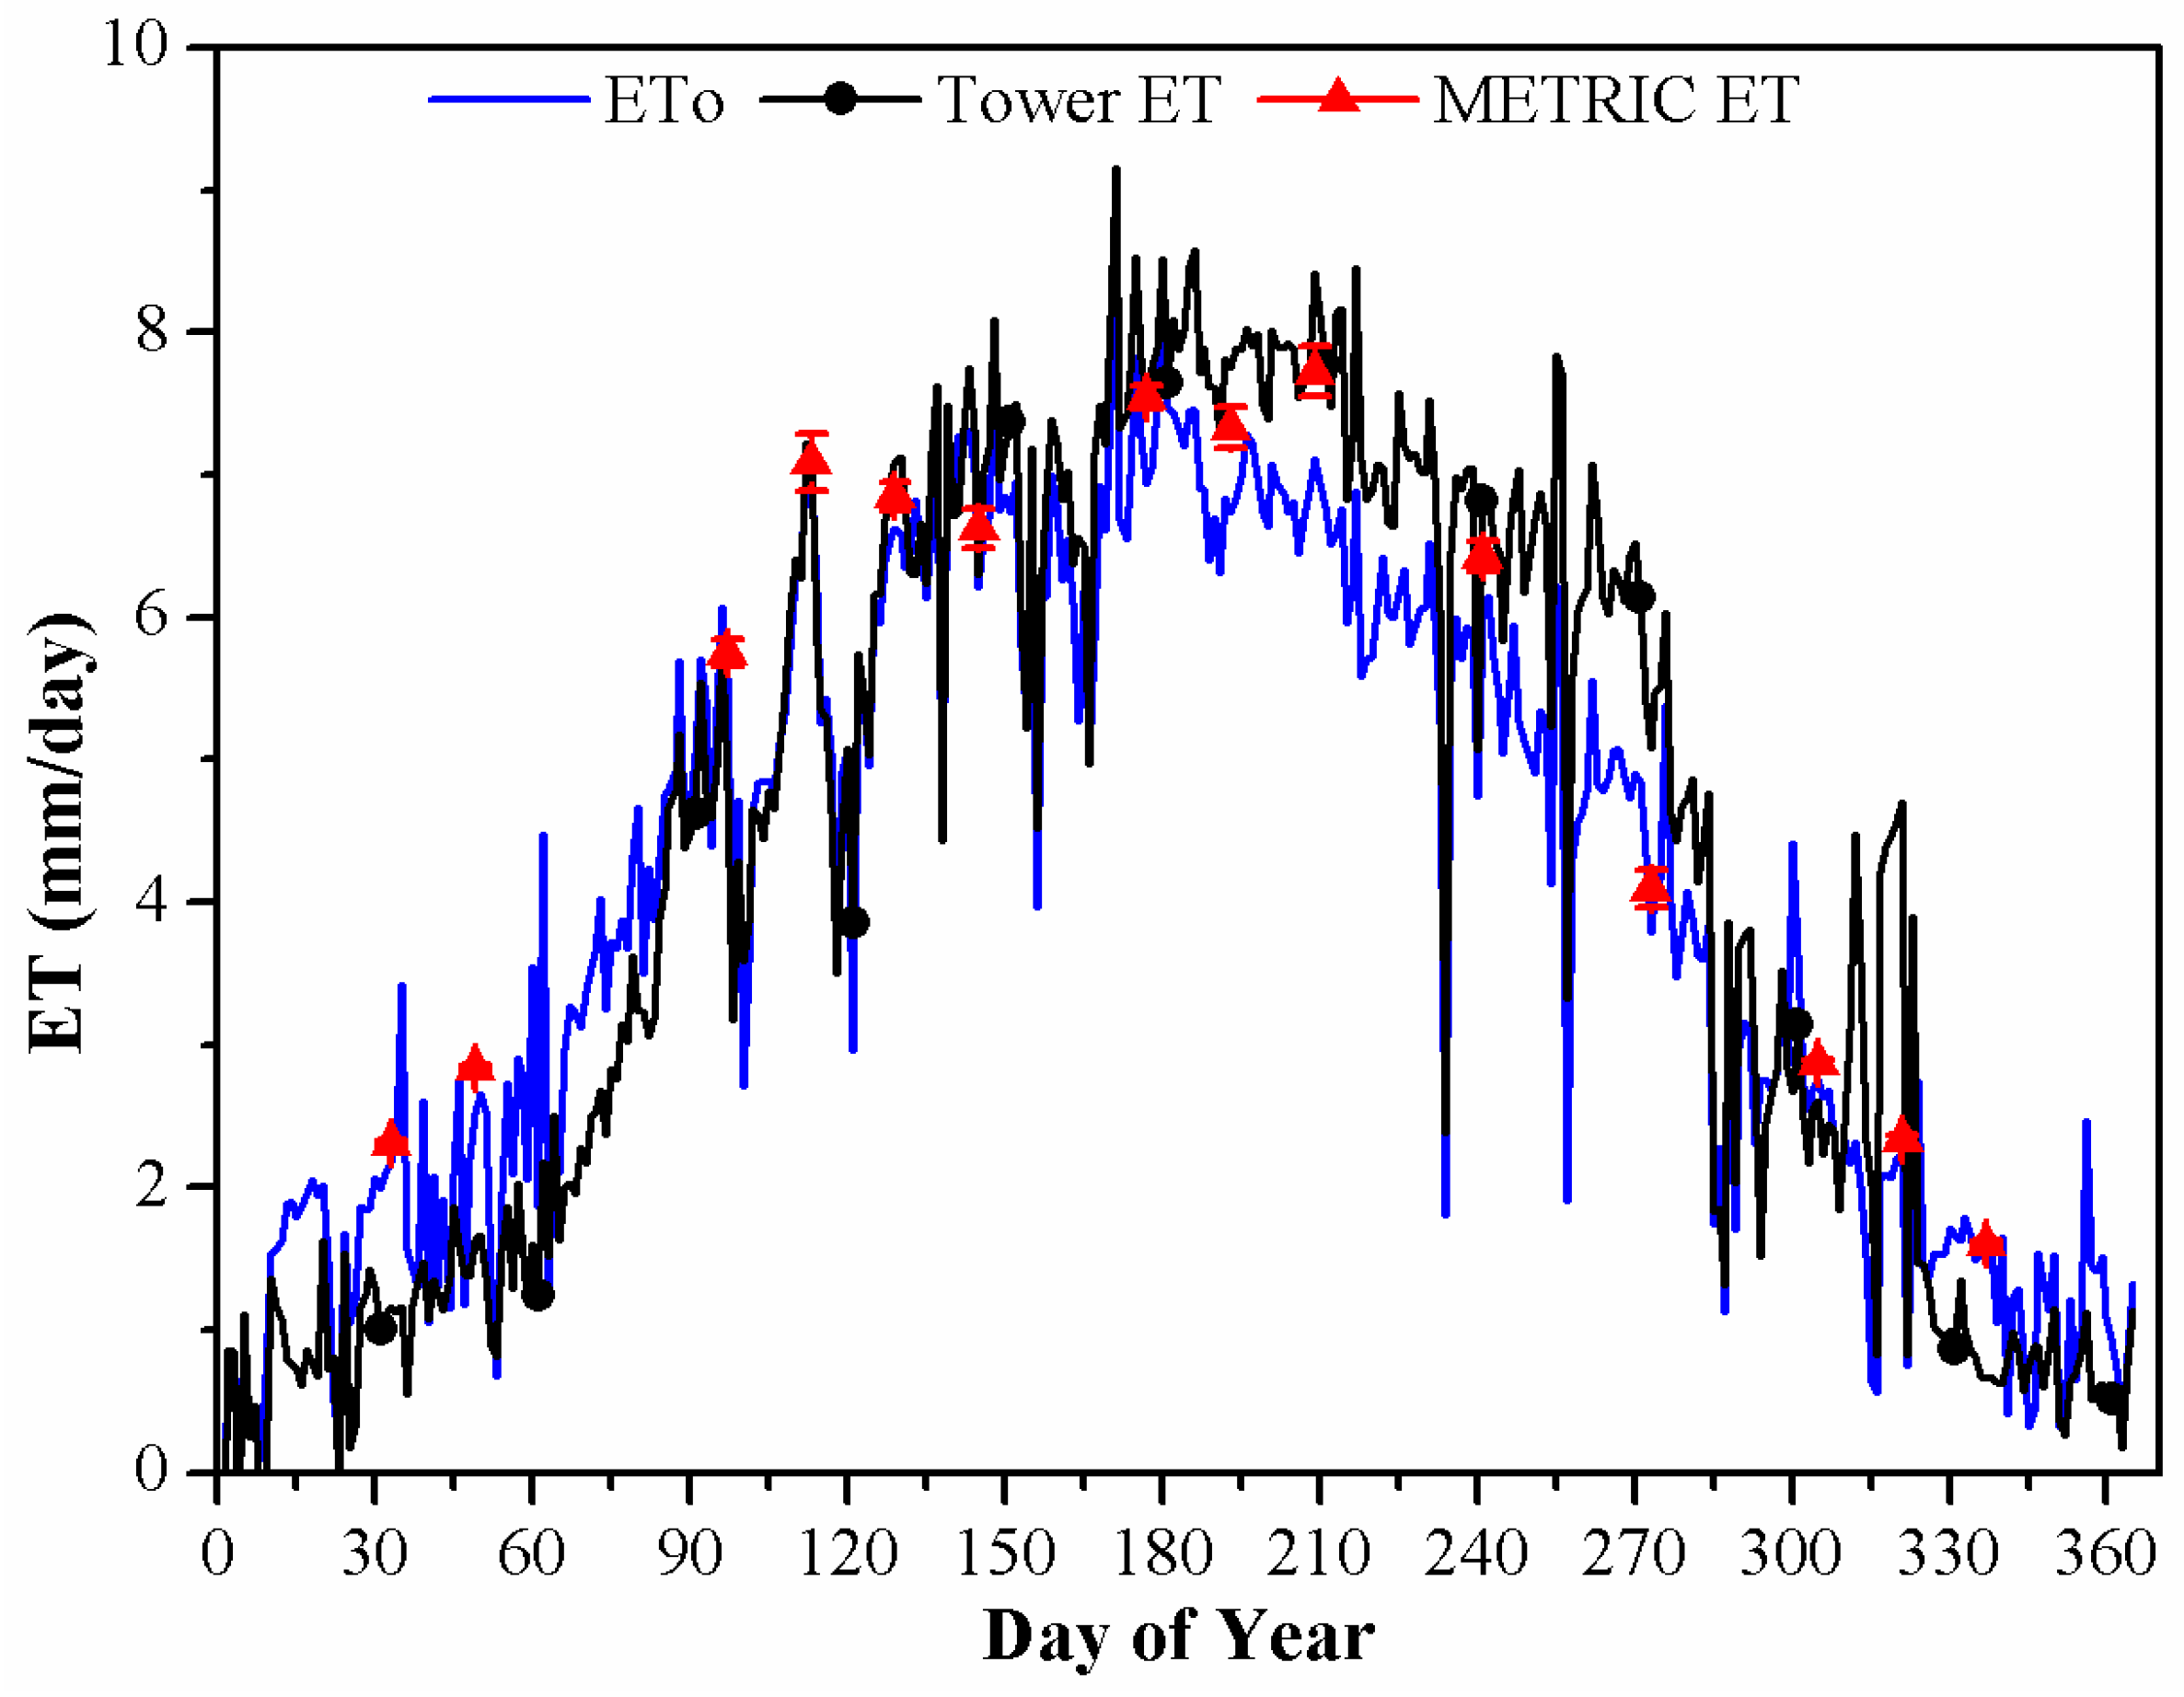
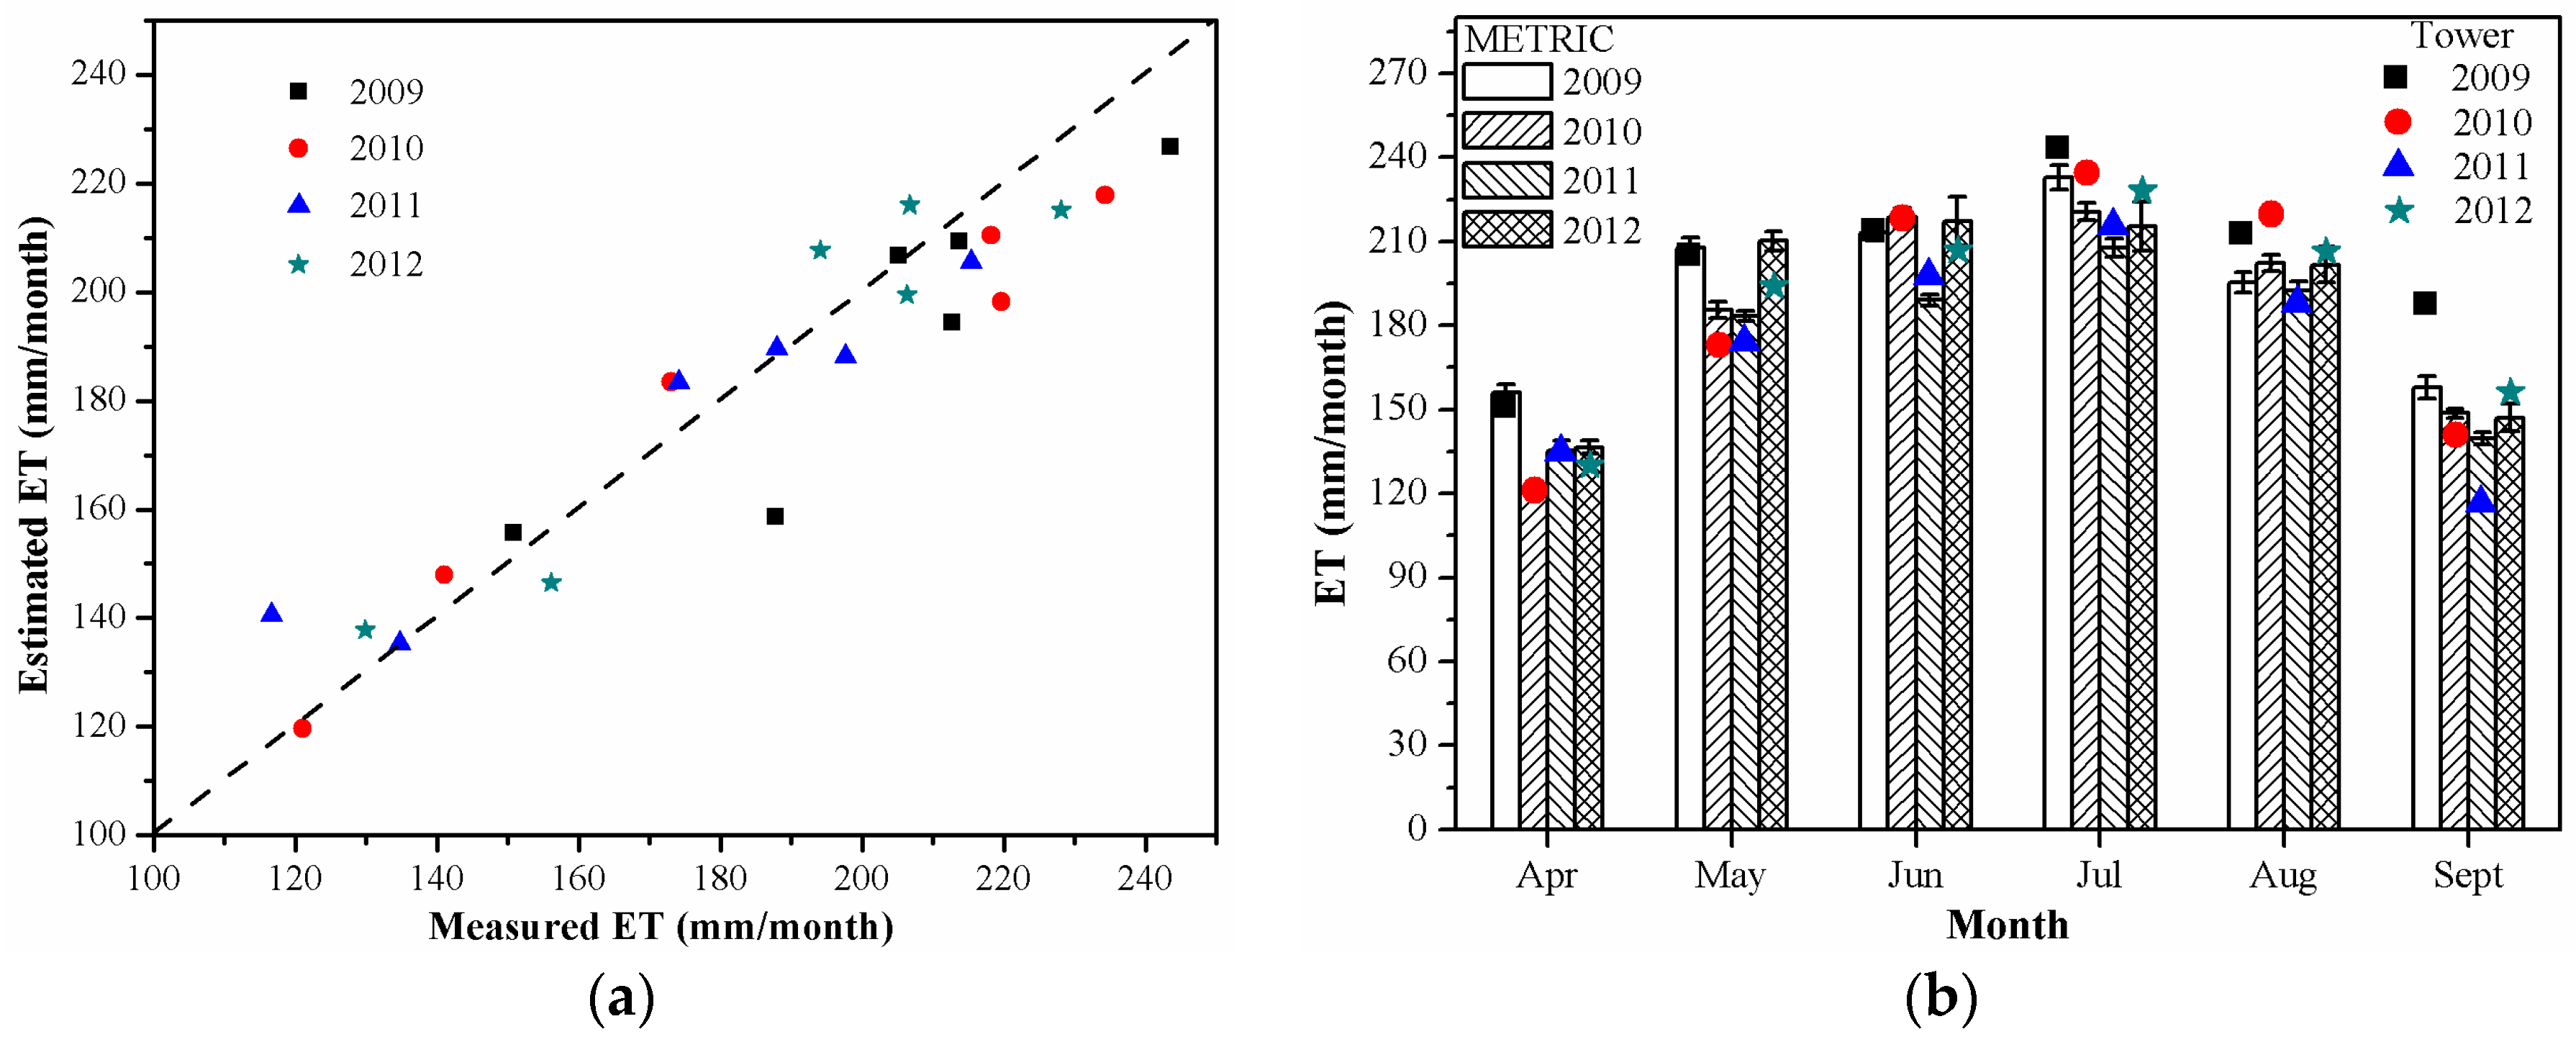
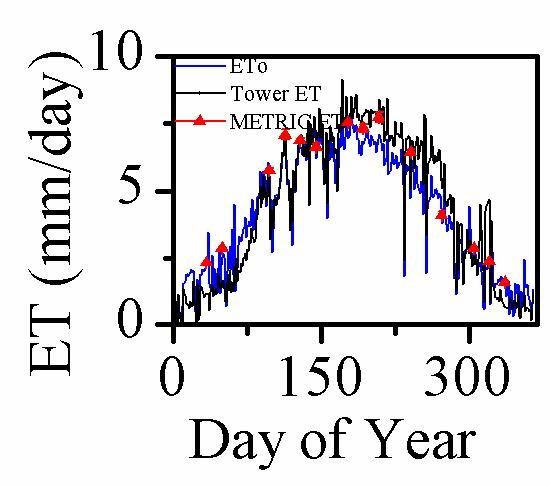
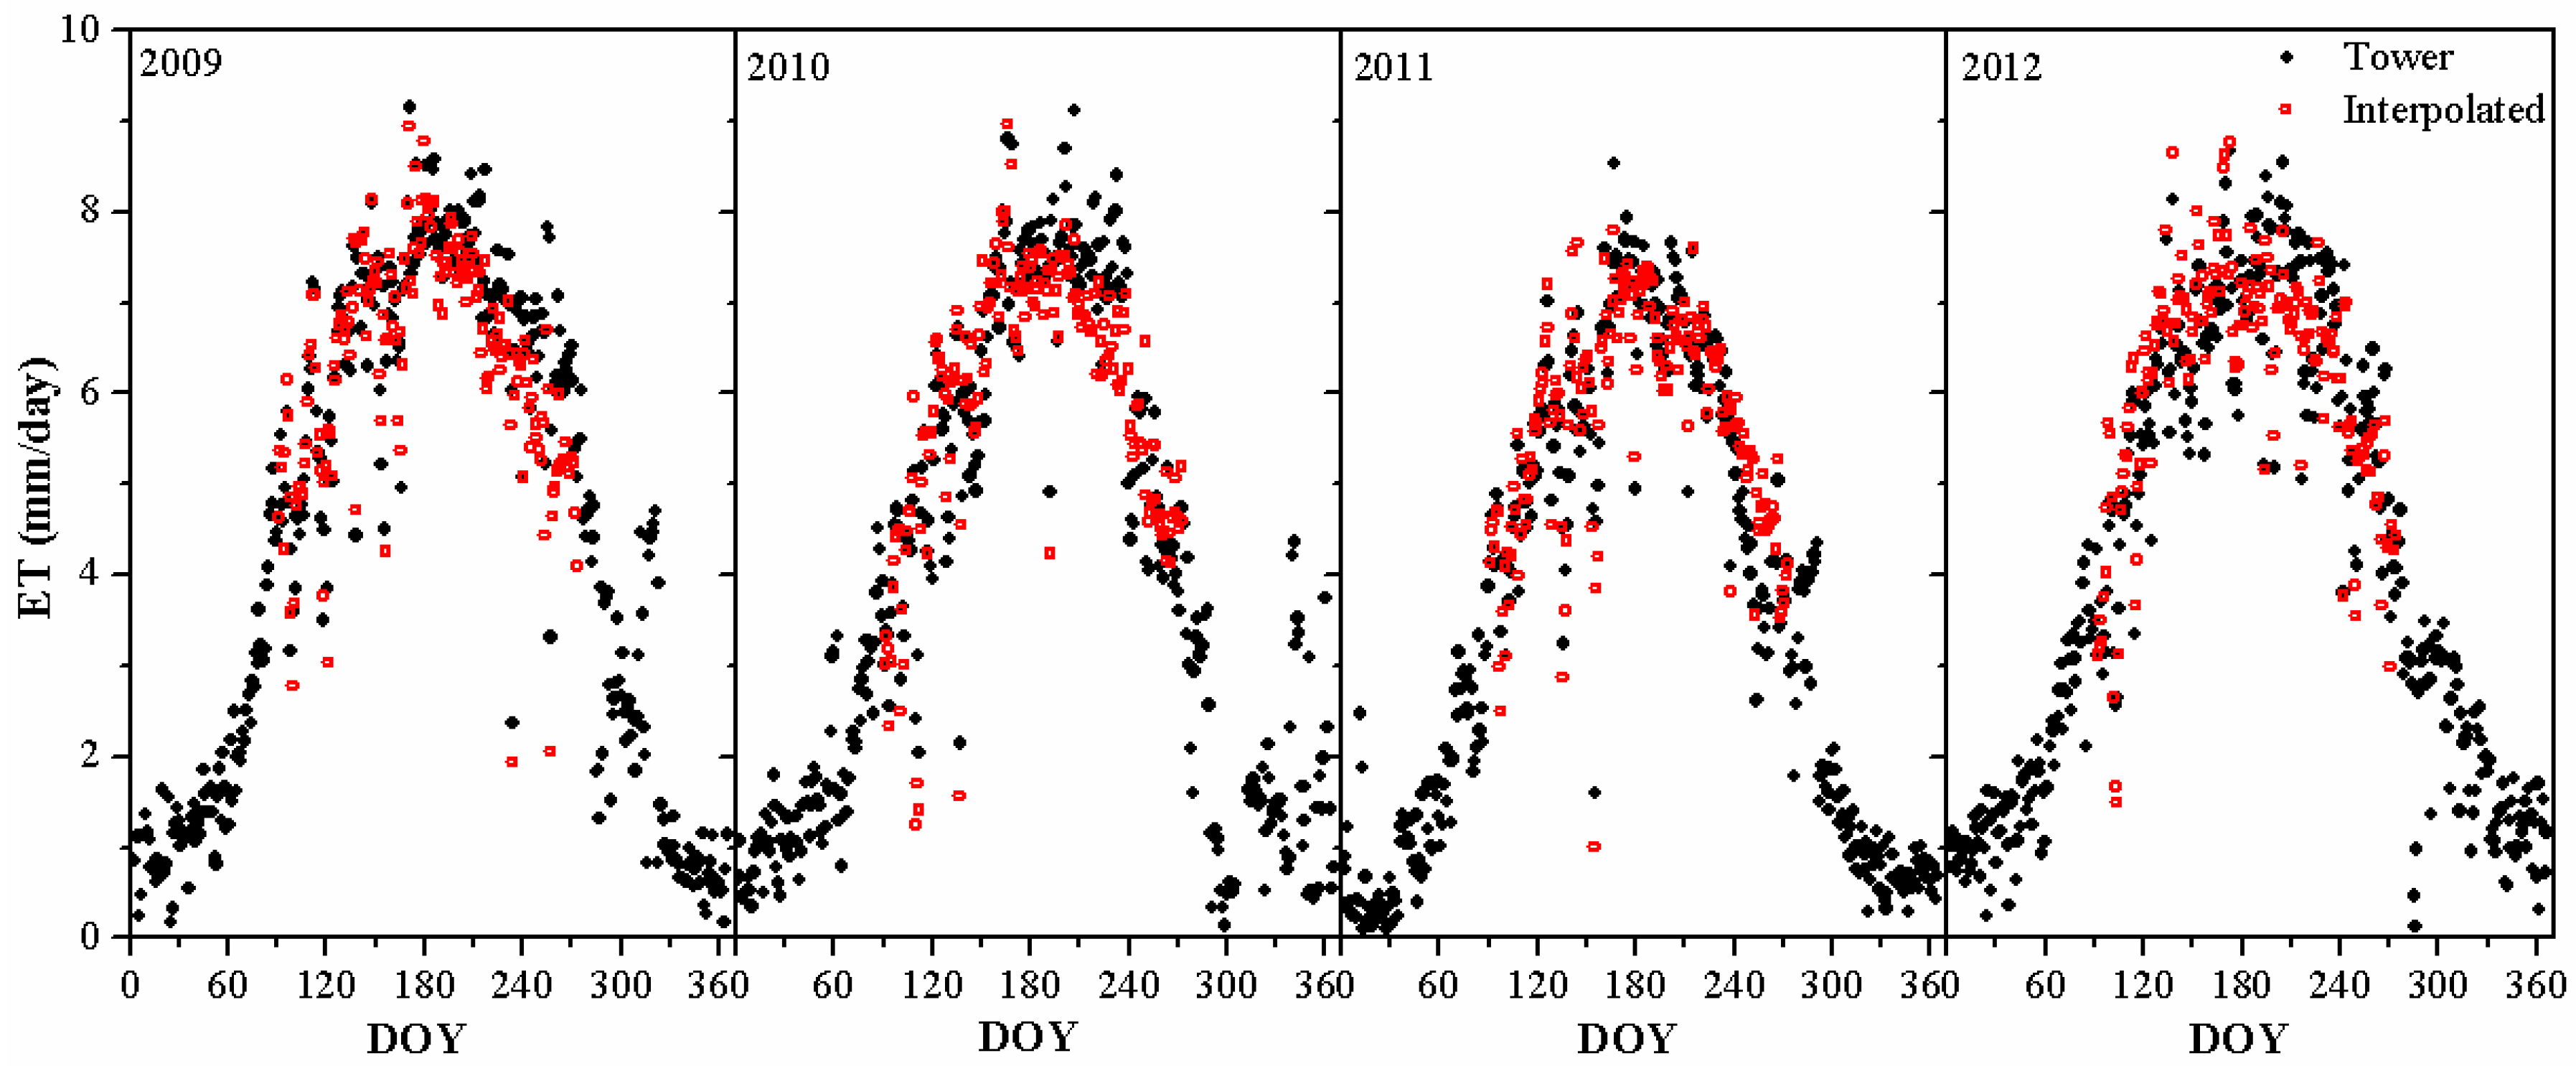
4.1.3. Continuous Time Series of Daily and Monthly ET

Daily ET was calculated by Equation (9), as a product of daily ETo and temporally interpolated daily EToF, during days with clouds or without Landsat overpass. We here focused on April to September since there were too many imageries obscured by cloud in winter season and thus the interpolation of EToF was expected to result in larger uncertainties. The complete daily time series of METRIC-based ET estimates followed closely with those from field measurements (Figure 8). Overall, METRIC daily ET agreed well with measurements, with a R2 of 0.85, a RMSE of 0.56 mm/day, a bias of −0.05 mm/day, and a MRD of 8% for a total of 732 days during 2009–2012 growing seasons (Table 2). Comparing with the daily ET estimate during Landsat overpass days only (see Section 4.1.1), the overall accuracy was not decreased after temporal interpolation, partly because all images used in this paper were of good quality (cloud-free) and EToF had a small range during growing season. Mean daily ET from METRIC was 6.36 ± 1.24 mm/day averaged during April–September (n = 183 days) in 2009, close to the flux tower measured ET (6.63 ± 1.23 mm/day). Both METRIC and field measurements showed a gradual decrease in mean daily growing season ET in 2010 and 2011, e.g., 5.99 ± 1.42 mm/day in 2010 and 5.73 ± 1.20 mm/day in 2011 from METRIC estimates, and then a slight increase to 6.16 ± 1.31 mm/day in 2012. Similarly, mean daily ET from flux tower measurements decreased to 6.05 ± 1.59 mm/day in 2010 and 5.61 ± 1.36 mm/day in 2011 and increased to 6.13 ± 1.33 mm/day in 2012.
When aggregated at monthly time scale, METRIC ET estimates were in good agreement with flux tower measurements during 2009–2012 growing seasons, as shown by a high R2 of 0.90 and a relatively small RMD of 9.68% (n = 24, Figure 9a). The RMSE was 12.08 mm/month and there was only a slight bias of −1.40 mm/month. Both METRIC and flux tower measurements showed a peak ET in July: METRIC ET varied from 207.7 mm/month in 2011 to 232.8 mm/month in 2009, and flux tower measured ET varied from 215.4 mm/month to 243.5 mm/month, respectively. METRIC-based ET was much lower in April, ranging from 120.3 mm/month in 2010 to 156.1 mm/month in 2009, similar with flux tower measured ET.
Satellite-based monthly ET estimates captured similar inter-annual variation as observed by flux tower measurements (Figure 9b). Mean annual measured ET varied from 1027 mm/year in 2011 to 1214 mm/year in 2009 summarized over April–September growing seasons. Similarly, METRIC monthly ET also showed the largest ET across all months in 2009, resulting in a mean annual ET of 1163 mm/year, and a 10% decrease in 2011. Monthly ET from June to September was much lower in 2011 than the other three years, as shown by both METRIC and flux estimates. This was consistent with the lower EToFs in 2011 (Figure 7). In addition, ETo in 2011 was also lower than that of the other three years from April to September.

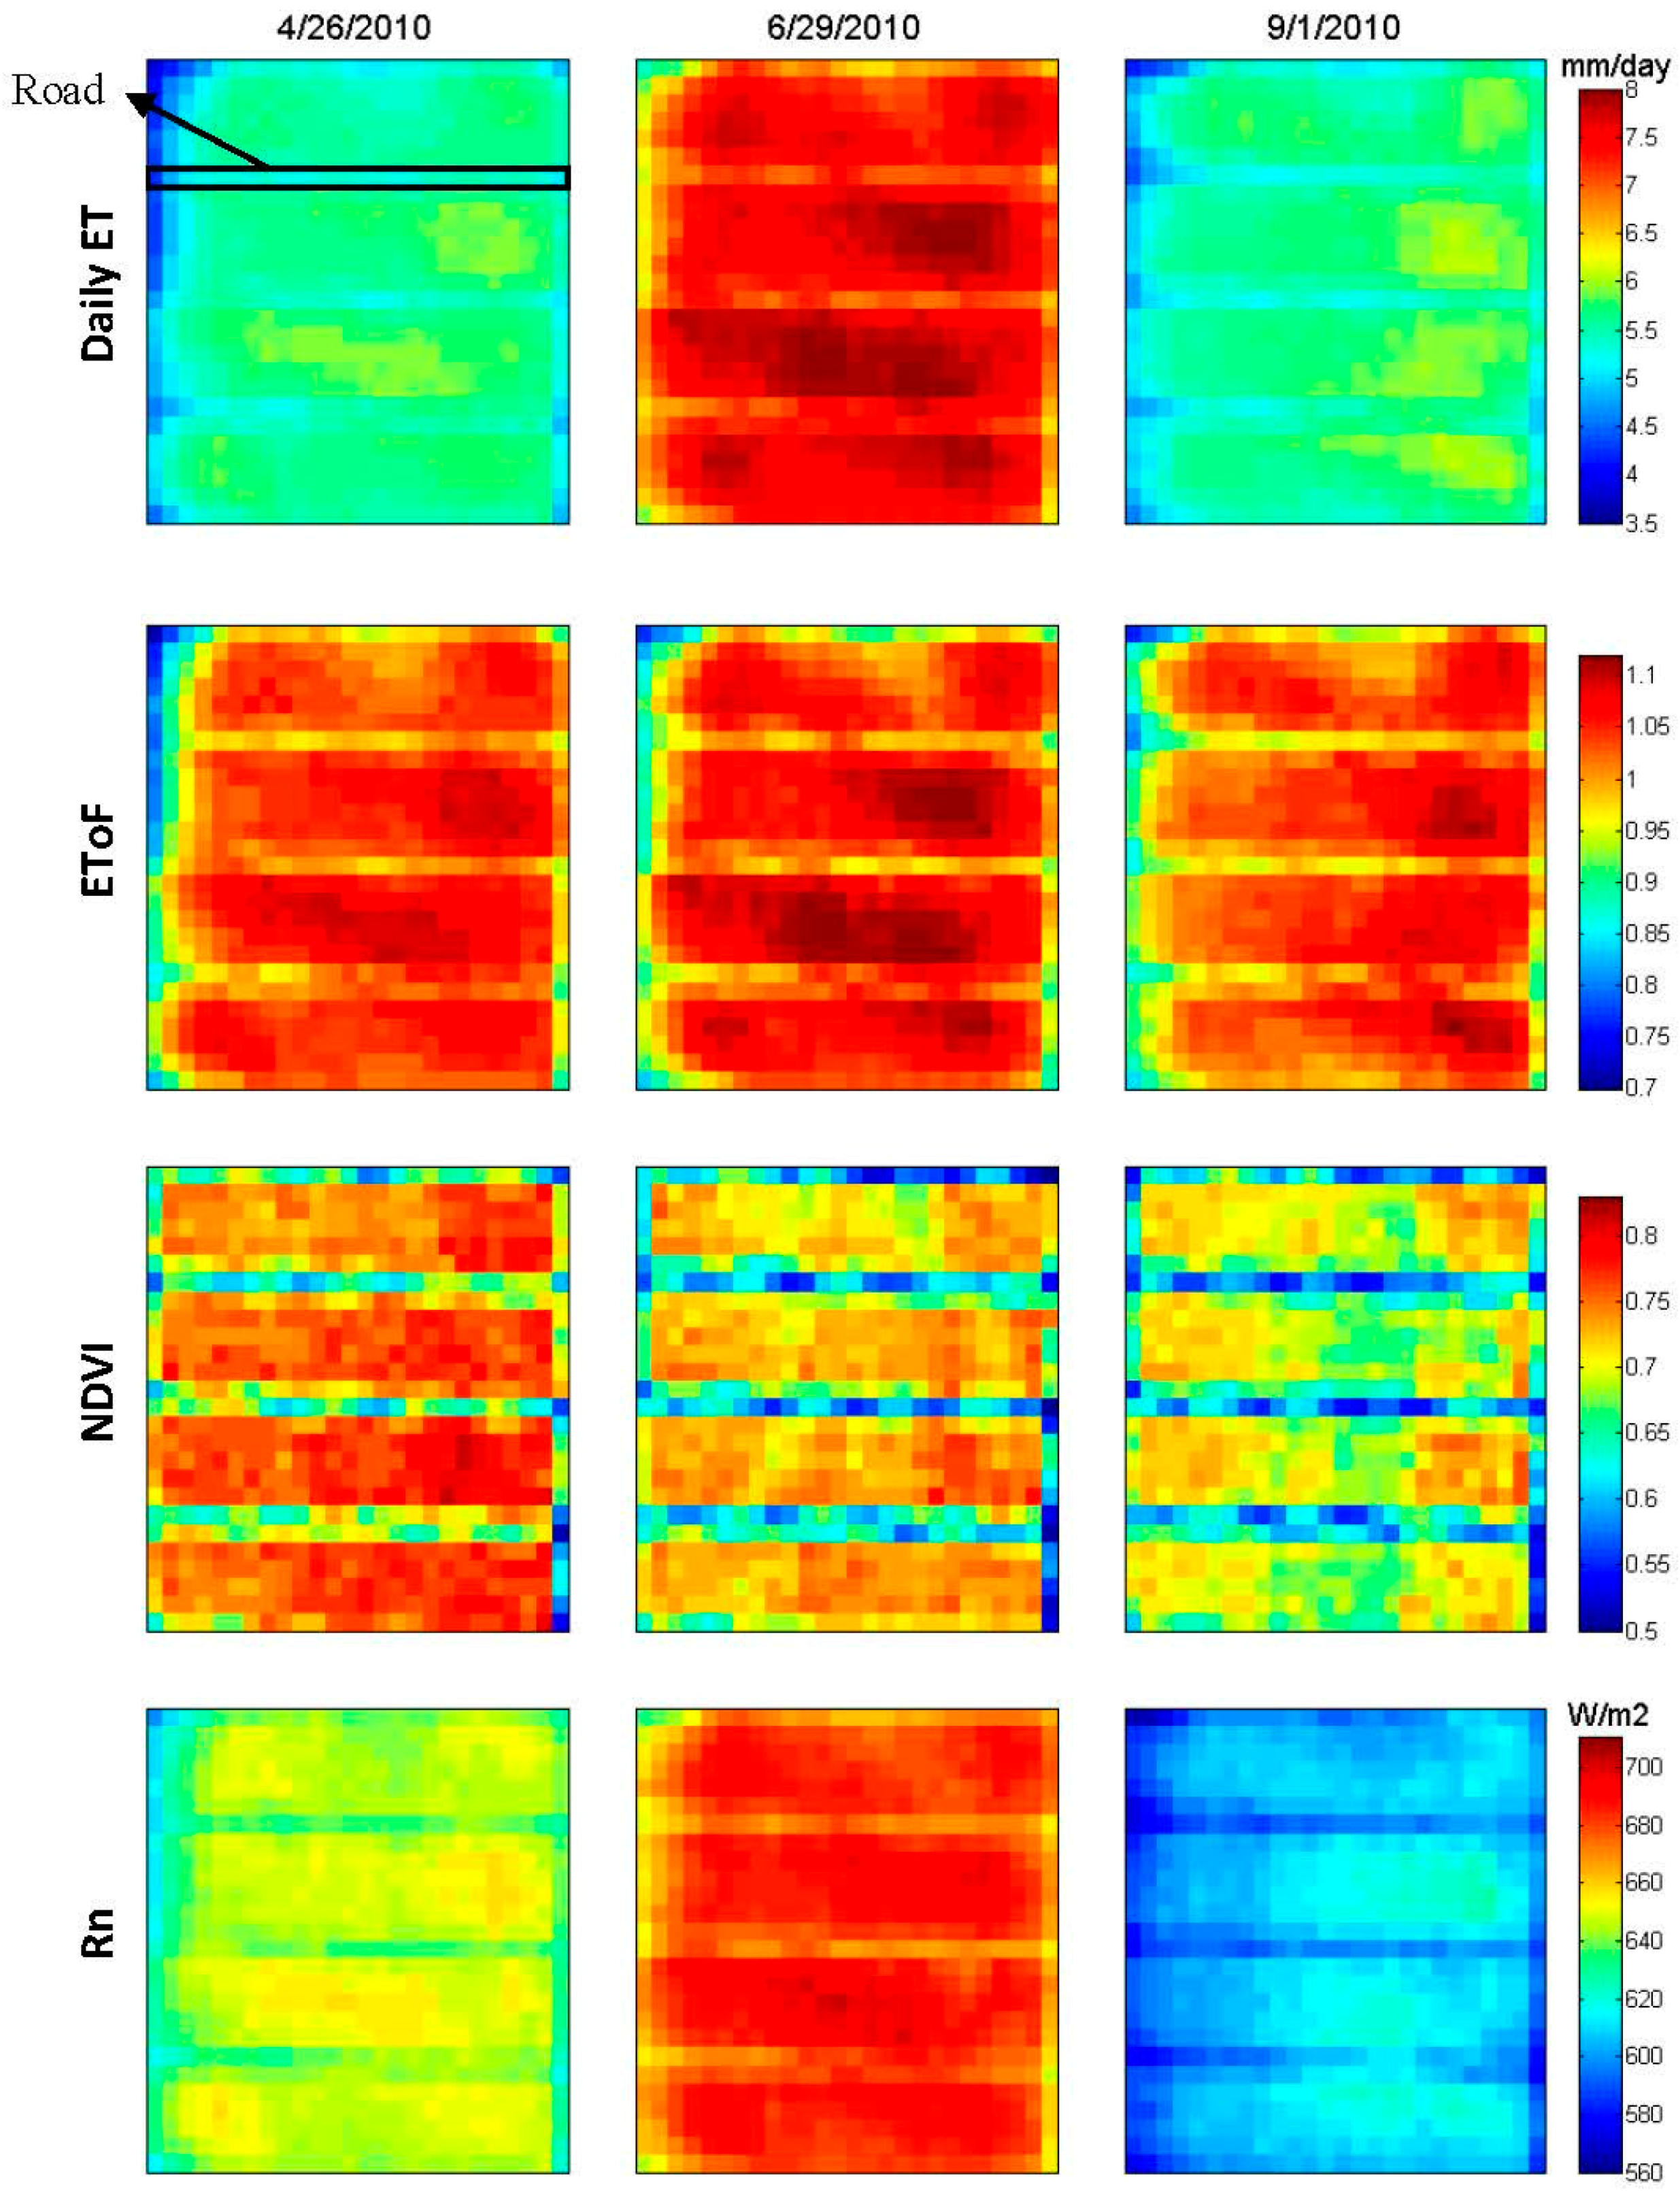
4.2. Spatial Pattern of Evapotranspiration

Spatial distribution of daily ET at the field-scale is essential to understand the water distribution pattern over a whole orchard to irrigate rationally, especially during crop growing season. Maps of spatial daily ET and main driving factors at a 30-m resolution (676 pixels) are shown in Figure 10, for selected dates representing different growth stages of almond trees. ET within the orchard follows similar spatial patterns of EToF, NDVI, and net radiation. Roads, either non-vegetated or sparsely vegetated, as indicated by low NDVI, had lower net radiation and available energy than trees, and smaller EToF further contributed to lower ET over sparsely vegetated areas, compared with the rest of the orchard.
Throughout the study period, ET of almond trees was relatively uniform, because the main driving factors, i.e., EToF and Rn calculated at Landsat overpassing time, had only slight variations within the orchard. Overall, the coefficient of variance (CV = STD/Mean) of METRIC-based daily ET estimates over the whole almond orchard varied between 3.63% and 10.52% and the CV of monthly ET ranged from 2.60% to 6.24% during the study period (Table S2). The CV of daily ET on 29 June 2010, for example, was 5.52%, with a mean ET of 7.39 mm/day. EToF varied between 0.77 and 1.13 and had a mean of 1.04 ± 0.06 (CV: 5.52%), while spatial variability of Rn was much smaller, with a CV less than 2% on the same day. The CV of NDVI was around 8% in general.
The difference between almond trees and the road were minimal during non-growing season, i.e., November and December (not shown), when almond trees go through a period of winter dormancy. The CV increased as the plants developed and then decreased again to dormancy. These findings were consistent with Couvreur et al. [37], which showed that the CV of tree-scale ET was 5–7% and increased as the average soil water stress was larger during 2009–2012 in the same study area.

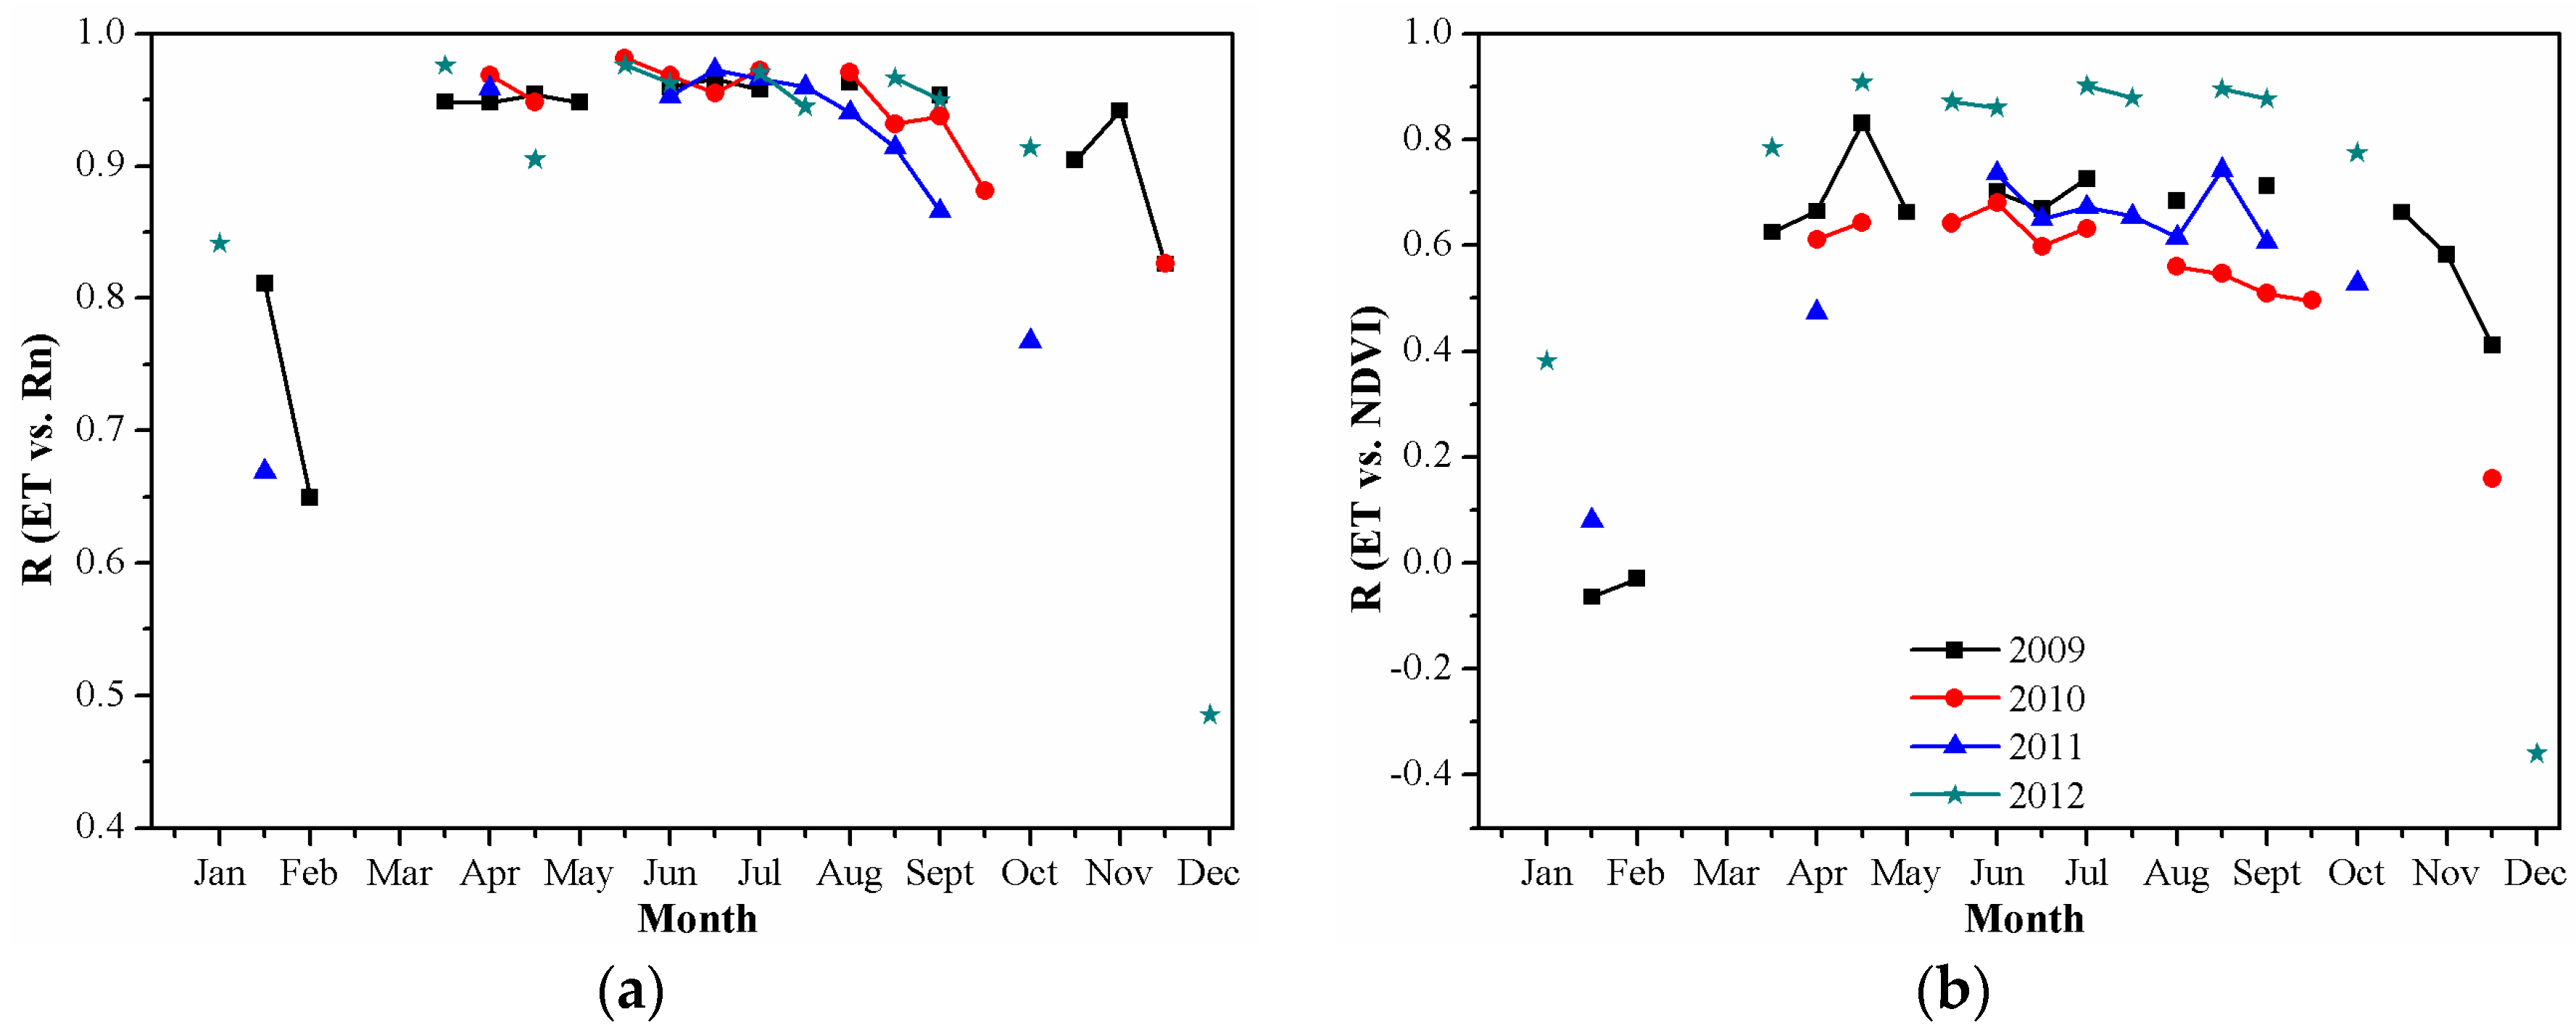
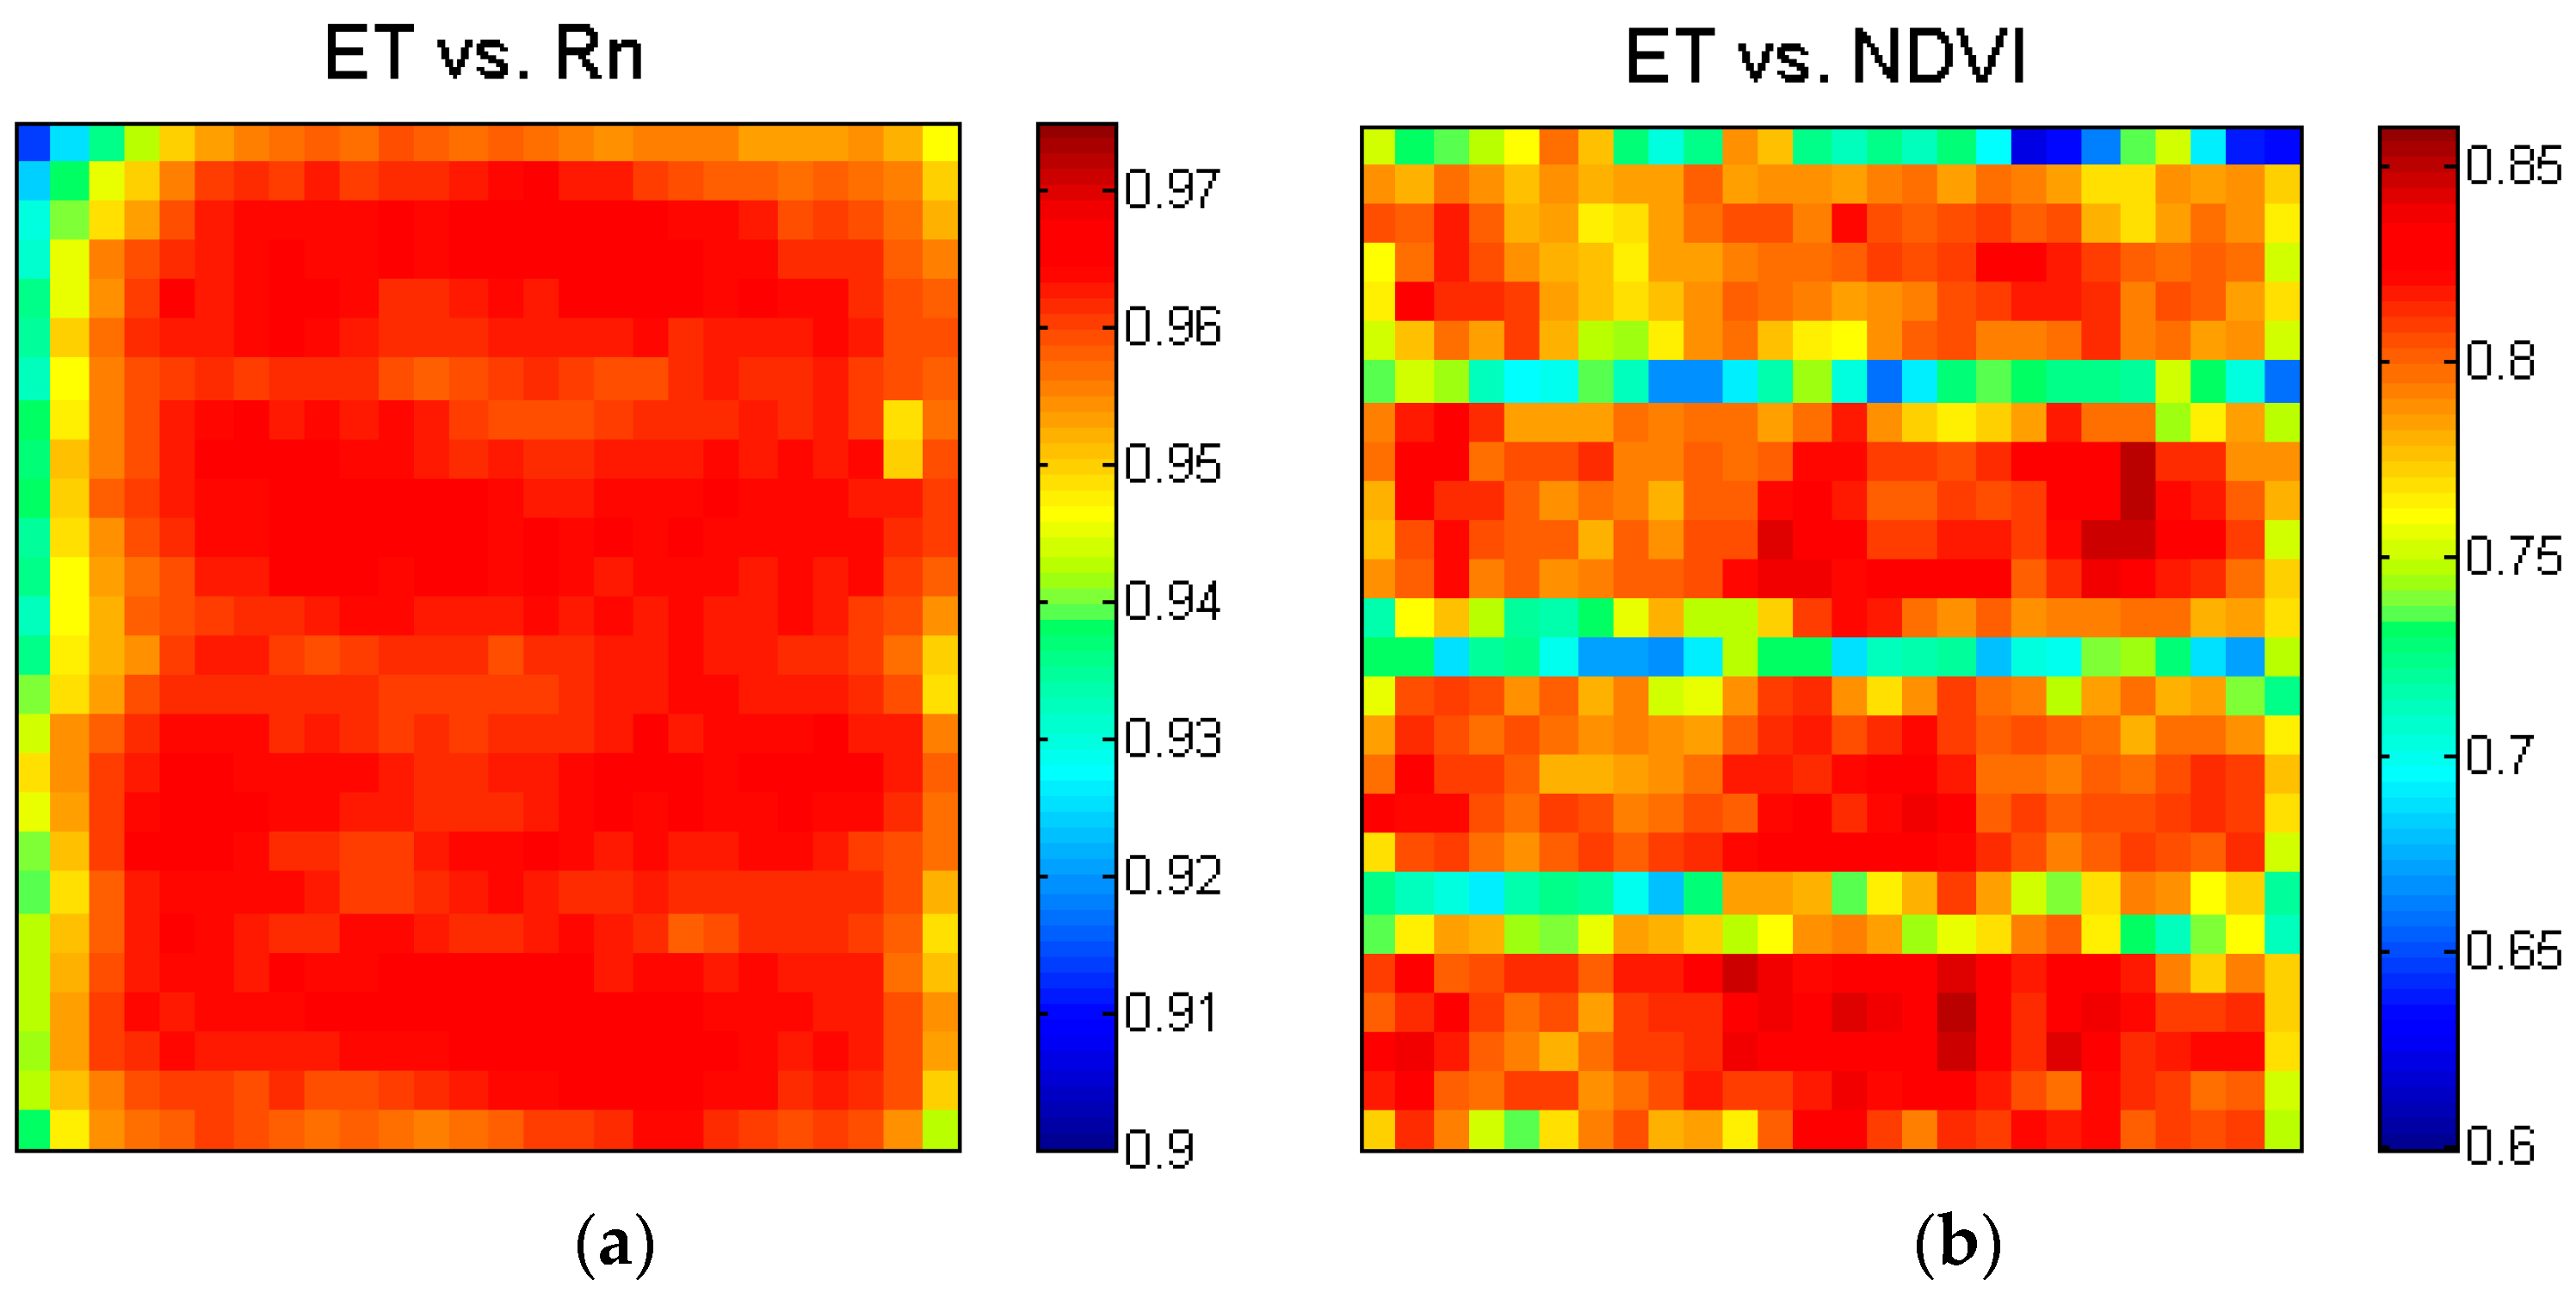
4.3. Factors Controlling Evapotranspiration

To better understand the main factors controlling spatial and temporal ET variation, correlations between ET and its driving factors were studied using both temporal and spatial data. For each individual pixel in the orchard, the correlations of daily ET with NDVI and Rn were computed for Landsat overpass dates (n = 46 days) during 2009–2012. Figure 11 shows that Rn was a dominate driver in determining day-to-day variation in ET, with an average correlation of 0.96, indicating that the majority of daily ET variation among seasons and years can be captured by Rn. Time series of NDVI was less correlated with that of daily ET, but was still highly correlated, with an average correlation of 0.79 and a range of 0.62–0.85 throughout the orchard (Figure 11b).
The spatial variability of daily ET was also mostly controlled by Rn variation across the orchard for any given Landsat overpass day, especially during April–September growing season, as shown by a typical correlation of 0.96 (Figure 12a). The average growing season correlations between daily ET and NDVI were 0.70, 0.60, 0.64 and 0.87 for 2009–2012, respectively, much lower than those with Rn (Figure 12b). The dependence of daily ET on spatial distributions of Rn and NDVI decreased during non-growing season (Figure 12).

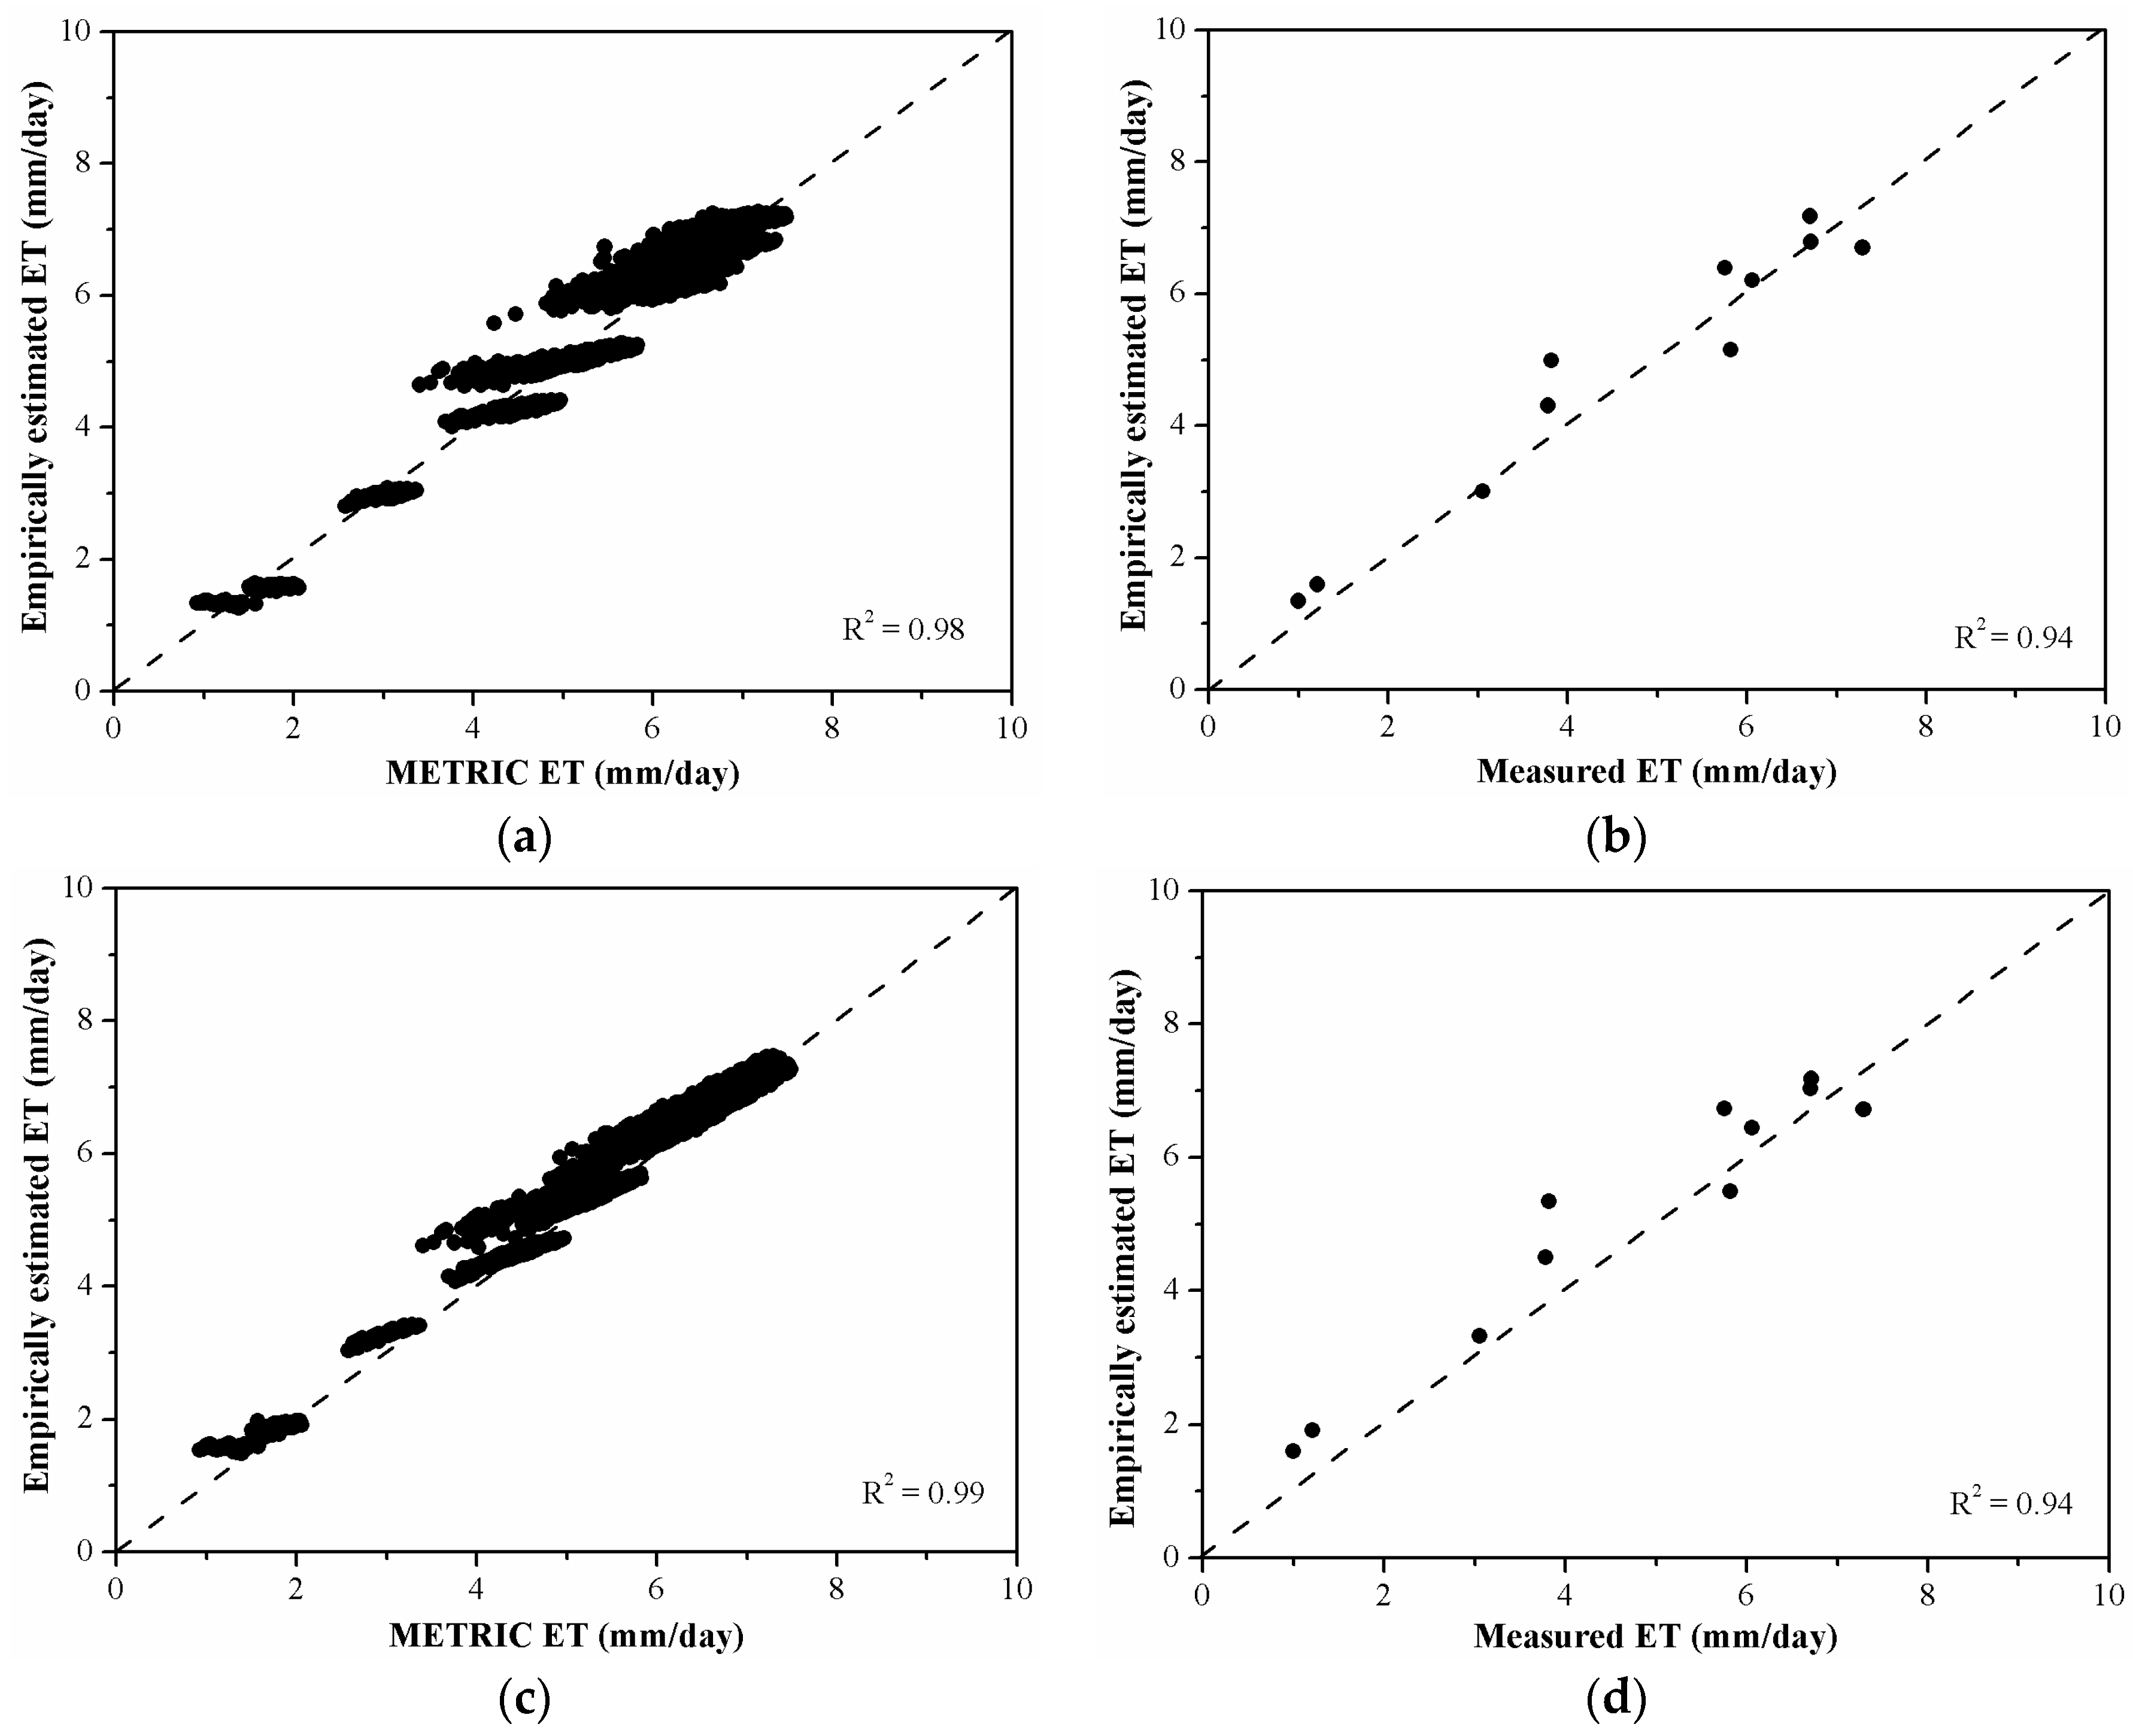
4.4. Empirical Method for Estimating Evapotranspiration

Rn and NDVI were both closely correlated with daily ET temporally and spatially as shown in 4.3. We thus explored the feasibility of using NDVI and Rn in combination with daily reference ETo, vapor pressure deficit (VPD), and average daily wind speed (U) to develop empirical and easy-to-use methods for daily ET estimation. Spatial data from 2009 to 2011 were used to build a suite of univariate and multivariate models and 2012 data were used for validation and uncertainty assessment. The ET results from the empirical methods were also compared with ET tower measurements. Equation (13) was chosen after model building and testing with all available spatial and temporal data:
ET = ETo   *   ( 0.3108   *   NDVI     0.0059   *   ln ( VPD )   +   0.8315 )
This statistical-based equation indicates that ETo and NDVI were positively related with ET as expected. VPD, however, negatively regulates evapotranspiration here, possibly as a proxy of water stress on EToF [7]. It predicted well the temporal dynamics of evapotranspiration at the tower site during 2012, with a R2 of 0.94 and a RMSE of 0.55 mm/day (n = 11 days) when comparing with flux tower measurements, and with a R2 and RMSE of 0.98 and 0.27 mm/day (n = 7436 pixels) when compared with METRIC-based ET estimates during 2012 (Figure 13).
We also found that reference ETo had an exponential relationship with Rn (R2 = 0.95) and therefore reconstructed Equation (13) and optimized the parameters to obtain the second empirical algorithm as shown below:
ET = [ 0.9405   *   exp ( 0.0027   *   Rn ) ]   *   [ 0.1816   *   NDVI   +   0.2672   *   ln ( VPD ) + 0.8913 ]
The ET estimates from Equation (14) were highly correlated with both tower measured ET (R2 = 0.94, RMSE = 0.71 mm/day) and with 2012 METRIC ET estimates (R2 = 0.99, RMSE = 0.28 mm/day) (Figure 13). This empirical method is of particular value to estimate ET, when ETo is not available, since net radiation can be estimated with satellite remote sensing observations. Similar to Penman Monteith concept, VPD here represents more the drying power of an atmosphere and thus atmospheric demand for water.

5. Conclusions and Discussion

The almond acreage in California has grown rapidly in the past 10 years, raising concerns about competition for the limited water resources in California. Information on crop ET at the field-scale is crucial for irrigation management at the farm level and for water planning at the watershed and state level. A robust and cost-effective approach for crop ET mapping is needed to improve sustainable water management. METRIC, a satellite-based surface energy balance method, has been widely used to map crop evapotranspiration (ET) of field crops, but less is known about how it performs for orchards.
In this paper, we assessed the accuracy of the METRIC approach, driven mainly by Landsat satellite data, in estimating daily and monthly ET over an almond orchard in southern San Joaquin Valley, California during 2009–2012 when field measured ET data were available. METRIC-based ET estimates agreed well with flux tower measured ET both instantaneously and at daily time step. High accuracy was found during the growing season (R2 = 0.87 and RMSE = 0.53 mm/day). Monthly ET estimates captured similar seasonal ET pattern, increasing from April and peaking in July, and were in good agreement with field measurements with a R2 of 0.90 and a RMSE of 13.69 mm/month during 2009–2012 growing seasons. ET estimated by METRIC varied from 119.56 to 226.46 mm/month averaged over three years, and measured monthly ET varied from 121.06 to 243.54 mm/month. Both METRIC and flux tower measurements showed the highest ET in 2009.
Continuous daily fraction of reference ET (EToF) was derived from the METRIC-estimated EToF during available clear sky Landsat overpass dates using a cubic spline interpolation technique. Overall, the estimated 16-day EToFs were close to those derived from field measurements, with a RMSE of 0.08 and a MRD of 6.29%. The interpolated EToF curve, however, was unable to capture the high frequency variation due to irrigation events and other factors as revealed by the flux tower measured ET.
We also examined the dominant drivers for temporal and spatial variation in crop water use. METRIC daily ET estimates were highly correlated with Rn and NDVI, both temporally and spatially. The correlation was 0.96 on average between time series of ET and Rn and 0.79 between temporal ET and NDVI (n = 46 days). The correlations between spatial ET and those of Rn and NDVI were 0.96 and 0.70 during 2009–2012 growing seasons, respectively. We further developed two empirical methods to estimate daily ET, using NDVI, Rn, ETo and VPD as key input data. The method driven by NDVI, Rn, and VPD showed a slightly lower accuracy in mapping ET, with a RMSE of 0.71 mm/day compared with the 2012 flux tower measurements, and a RMSE of 0.28 mm/day compared with the METRIC ET estimate. The empirical method driven by NDVI, ETo, and VPD showed a lower RMSE (0.55 mm/day) than that of Rn-based method, when compared with the 2012 flux tower measurements.
Overall, the METRIC approach driven by Landsat observations and CIMIS station data can estimate evapotranspiration (ET) in almond orchards with reasonable accuracy during growing season, and also identify both temporal and spatial variability in a cost-effective way. This is consistent with previous assessment of METRIC ET estimates in other crop types. Mean absolute differences between ET estimates from METRIC and field measurements ranged from 16% over irrigated meadow in the monthly scale [28] to 20% in olive orchards in the daily scale [35]. The error was reduced to 4% when aggregated to the seasonal scale [28]. The RMSE varied from 1.1 mm/day in spring wheat fields [32] to 1.9 mm/day over cotton [36].
A continuous daily ET mapping is critical for growers in their efforts to apply the right amount of water at the right time. ET estimate is limited by the 16-day repeat cycle when relying only on Landsat satellite observations, and uncertainties from mathematical interpolations can increase when there is no clear sky imagery during entire month due to cloudy and rainy weather, e.g., during winter and early spring in California. An important next step would be to combine and fuse observations from other sensors such as Sentinel-2 and VIIRS to increase the temporal frequency of remote sensing based ET estimate. The Spatial and Temporal Adaptive Reflectance Fusion Model (STARFM), for example, showed the success and promises of using data fusion to derive Landsat-like daily ET estimates at the field scale [10,52]. Other methods have also been developed to improve the accuracy of three hourly or daily ET mapping, including a combination of the feedback model (GG model) with SEBAL [53]. As discussed earlier, we utilized ETo to be congruent to the instantaneous and daily ET calculation, in order to interpolate EToF between the overpass dates using the spline method. Earlier studies indicate that ETrF needs to be adjusted in particular crops like olive orchards which behave similarly to the grass-based coefficients [34,35] because of the crop stress, physiological and micrometerological variations. To address this problem, Dhungel et al. [54] developed a backward-averaged iterative two-source surface temperature and energy balance solution algorithm (BAITSSS), incorporating the crop and soil stress components using soil water balance, to capture the impacts of the irrigation and precipitation between the satellite overpass. They demonstrated improved robustness compared with mathematical and regression based interpolations.
Our study here showed that the METRIC ET estimate using well-watered pasture as a reference crop worked reasonably well, although it may not be the case for other crop types. It is always necessary to examine the impact of selection of anchor pixels and the reference ET on actual ET estimate of any untested cropping systems. Further studies are also needed to quantify the ET field measurement errors and investigate the METRIC performance in younger orchards and in more homogeneous orchards under the effects of various environment stressors such as increasing salinity in soil and deficit irrigation.

Supplementary Materials

The following are available online at www.mdpi.com/2072-4292/9/5/436/s1, Figure S1: Illustration of METRIC algorithms: (a) Flowchart for iterative calculation of sensible heat flux; and (b) linear relationship between dT (near surface-air temperature difference) and Ts (surface temperature), as shown in the METRIC manual by Allen et al., 2014. Figure S2: Time series of daily ET measured by the flux tower (black line) and estimated by the METRIC approach (red triangle points) over almond trees in: (a) 2010; (b) 2011; and (c) 2012. The daily reference ETo of grass from Belridge CIMIS station is also shown here in blue line. Figure S3: Time series of daily EToF from ground-based measurements (ETa/ETo, in black) and from METRIC estimated ET averaged over 2 × 3 pixels centered around EC tower at Landsat overpass dates (red dots) from April to September in 2009–2012. The cubic spline interpolation of METRIC daily EToF using daily EToF estimates on four adjacent Landsat overpassing dates (in blue) is also shown. Table S1: List of 46 Landsat 5 TM and 7 ETM+ images used for estimating ET by METRIC approach. Table S2: Statistics of METRIC-based monthly ET (mm/month) over the almond orchard (n = 676 pixels) from April to September in 2009–2012.

Acknowledgments

We acknowledge support from California State Water Resources Control Board and California Department of Food and Agriculture. Ruyan He was supported by the overseas exchange program from China Scholarship Council (CSC) and the doctoral innovative talents cultivation project at China University of Mining & Technology, Beijing (00-800015Z693). We are also grateful to three anonymous reviewers for their insightful and constructive comments.

Author Contributions

Y.J. and R.H. conceived and designed research; R.H. performed the satellite data analysis; Y.J. and R.H. analyzed the results; B.L.S. and R.L.S. instrumented field station and contributed field measurements; R.H. and Y.J. wrote the paper; and M.M.K., D.Z., J.J. and J.W.H. contributed to analysis and discussion.

Conflicts of Interest

The authors declare no conflict of interest.

References

  1. California Department of Food and Agriculture (CDFA). California Agricultural Statistics Review, 2014–2015. Available online: www.cdfa.ca.gov/statistics (accessed on 3 May 2017).
  2. Wilson, K.; Goldstein, A.; Falge, E.; Aubinet, M.; Baldocchi, D.; Berbigier, P.; Bernhofer, C.; Ceulemans, R.; Dolman, H.; Field, C.; et al. Energy balance closure at FLUXNET sites. Agric. For. Meteorol. 2002, 113, 223–243. [Google Scholar] [CrossRef]
  3. Bowen, I.S. The ratio of heat losses by conduction and by evaporation from any water surface. Phys. Rev. 1926, 27, 779. [Google Scholar] [CrossRef]
  4. Shapland, T.M.; Snyder, R.L.; Paw U, K.T.; McElrone, A.J. Thermocouple frequency response compensation leads to convergence of the surface renewal alpha calibration. Agric. For. Meteorol. 2014, 189, 36–47. [Google Scholar] [CrossRef]
  5. Allen, R.G.; Pereira, L.S.; Raes, D.; Smith, M. FAO Irrigation and Drainage Paper No. 56; Food and Agriculture Organization of the United Nations: Rome, Italy, 1998; Volume 56, pp. 97–156. [Google Scholar]
  6. Allen, R.G.; Pruitt, W.O.; Wright, J.L.; Howell, T.A.; Ventura, F.; Snyder, R.L.; Itenfisu, D.; Steduto, P.; Berengena, J.; Baselga Yrisarry, J.; et al. A recommendation on standardized surface resistance for hourly calculation of reference ETo by the FAO56 Penman-Monteith method. Agric. Water Manag. 2006, 81, 1–22. [Google Scholar] [CrossRef]
  7. Fisher, J.B.; Tu, K.P.; Baldocchi, D.D. Global estimates of the land–atmosphere water flux based on monthly AVHRR and ISLSCP-II data, validated at 16 FLUXNET sites. Remote Sens. Environ. 2008, 112, 901–919. [Google Scholar] [CrossRef]
  8. Jin, Y.; Randerson, J.T.; Goulden, M.L. Continental-scale net radiation and evapotranspiration estimated using MODIS satellite observations. Remote Sens. Environ. 2011, 115, 2302–2319. [Google Scholar] [CrossRef]
  9. Anderson, R.G.; Jin, Y.; Goulden, M.L. Assessing regional evapotranspiration and water balance across a Mediterranean montane climate gradient. Agric. For. Meteorol. 2012, 166–167, 10–22. [Google Scholar]
  10. Semmens, K.A.; Anderson, M.C.; Kustas, W.P.; Gao, F.; Alfieri, J.G.; McKee, L.; Prueger, J.H.; Hain, C.R.; Cammalleri, C.; Yang, Y.; et al. Monitoring daily evapotranspiration over two California vineyards using Landsat 8 in a multi-sensor data fusion approach. Remote Sens. Environ. 2016, 185, 155–170. [Google Scholar] [CrossRef]
  11. Glenn, E.P.; Neale, C.M.U.; Hunsaker, D.J.; Nagler, P.L. Vegetation index-based crop coefficients to estimate evapotranspiration by remote sensing in agricultural and natural ecosystems. Hydrol. Processes 2011, 25, 4050–4062. [Google Scholar] [CrossRef]
  12. Taghvaeian, S.; Chávez, J.L.; Hansen, N.C. Ground-based remote sensing of corn evapotranspiration under limited irrigation practices. In Proceedings of the 32nd Annual American Geophysical Union Hydrology Days, San Francisco, CA, USA, 3–7 December 2012; pp. 119–131. [Google Scholar]
  13. Johnson, L.F.; Trout, T.J. Satellite NDVI assisted monitoring of vegetable crop evapotranspiration in California’s San Joaquin Valley. Remote Sens. 2012, 4, 439–455. [Google Scholar] [CrossRef]
  14. O’Connell, M.; Whitfield, D.; Abuzar, M.; Sheffield, K.; McClymont, L.; McAllister, A. Satellite remote sensing of crop water use in perennial horticultural crops. In Proceedings of the Program and Abstracts Australian Irrigation Conference, Sydney, Australia, 31 August–3 September 2010; pp. 129–130. [Google Scholar]
  15. Bastiaanssen, W.G.M.; Menenti, M.; Feddes, R.A.; Holtslag, A.A.M. A remote sensing surface energy balance algorithm for land (SEBAL): 1. Formulation. J. Hydrol. 1998, 212, 198–212. [Google Scholar] [CrossRef]
  16. Su, Z. The Surface Energy Balance System (SEBS) for estimation of turbulent heat fluxes. Hydrol. Earth Syst. Sci. Discuss. 2002, 6, 85–100. [Google Scholar] [CrossRef]
  17. Allen, R.G.; Tasumi, M.; Trezza, R. Satellite-based energy balance for mapping evapotranspiration with internalized calibration (METRIC)—Model. J. Irrig. Drain. Eng. 2007, 133, 380–394. [Google Scholar] [CrossRef]
  18. Senay, G.B.; Budde, M.; Verdin, J.P.; Melesse, A.M. A coupled remote sensing and simplified surface energy balance approach to estimate actual evapotranspiration from irrigated fields. Sensors 2007, 7, 979–1000. [Google Scholar] [CrossRef]
  19. Senay, G.B.; Bohms, S.; Singh, R.K.; Gowda, P.H.; Velpuri, N.M.; Alemu, H.; Verdin, J.P. Operational evapotranspiration mapping using remote sensing and weather datasets: A new parameterization for the SSEB approach. J. Am. Water Resour. Assoc. 2013, 49, 577–591. [Google Scholar] [CrossRef]
  20. Norman, J.M.; Kustas, W.P.; Humes, K.S. Source approach for estimating soil and vegetation energy fluxes in observations of directional radiometric surface temperature. Agric. For. Meteorol. 1995, 77, 263–293. [Google Scholar] [CrossRef]
  21. Kustas, W.P.; Norman, J.M. Evaluation of soil and vegetation heat flux predictions using a simple two-source model with radiometric temperatures for partial canopy cover. Agric. For. Meteorol. 1999, 94, 13–29. [Google Scholar] [CrossRef]
  22. Anderson, M.C.; Norman, J.M.; Diak, G.R.; Kustas, W.P.; Mecikalski, J.R. A two-source time-integrated model for estimating surface fluxes using thermal infrared remote sensing. Remote Sens. Environ. 1997, 60, 95–216. [Google Scholar] [CrossRef]
  23. Anderson, M.C.; Norman, J.M.; Mecikalski, J.R.; Otkin, J.A.; Kustas, W.P. A climatological study of evapotranspiration and moisture stress across the continental United States based on thermal remote sensing: 1. Model formulation. J. Geophys. Res. Atmos. 2007, 112, D10. [Google Scholar] [CrossRef]
  24. Norman, J.M.; Anderson, M.C.; Kustas, W.P.; French, A.N.; Mecikalski, J.; Torn, R.; Diak, G.R.; Schmugge, T.J.; Tanner, B.C.W. Remote sensing of surface energy fluxes at 101-m pixel resolutions. Water Resour. Res. 2003, 39, 1221. [Google Scholar] [CrossRef]
  25. Kustas, W.P.; Norman, J.M.; Anderson, M.C.; French, A.N. Estimating subpixel surface temperatures and energy fluxes from the vegetation index–radiometric temperature relationship. Remote Sens. Environ. 2003, 85, 429–440. [Google Scholar] [CrossRef]
  26. Allen, R.G.; Irmak, A.; Trezza, R.; Hendrickx, J.M.H.; Bastiaanssen, W.; Kjaersgaard, J. Satellite-based ET estimation in agriculture using SEBAL and METRIC. Hydrol. Process. 2011, 25, 4011–4027. [Google Scholar] [CrossRef]
  27. Kilic, A.; Allen, R.G.; Trezza, R.; Ratcliffe, I.; Kamble, B.; Robison, C.; Ozturk, D. Sensitivity of evapotranspiration retrievals from the METRIC processing algorithm to improved radiometric resolution of Landsat 8 thermal data and to calibration bias in Landsat 7 and 8 surface temperature. Remote Sens. Environ. 2016, 185, 198–209. [Google Scholar] [CrossRef]
  28. Allen, R.G.; Tasumi, M.; Morse, A.; Trezza, R.; Wright, J.L.; Bastiaanssen, W.; Kramber, W.; Lorite, I.; Robison, C.W. Satellite-based energy balance for mapping evapotranspiration with internalized calibration (METRIC)—Applications. J. Irrig. Drain. Eng. 2007, 133, 95–406. [Google Scholar] [CrossRef]
  29. Tasumi, M.; Allen, R.G. Satellite-based ET mapping to assess variation in ET with timing of crop development. Agric. Water Manag. 2007, 88, 54–62. [Google Scholar] [CrossRef]
  30. Gowda, P.H.; Chávez, J.L.; Howell, T.A.; Marek, T.H.; New, L.L. Surface energy balance based evapotranspiration mapping in the Texas high plains. Sensors 2008, 8, 5186–5201. [Google Scholar] [CrossRef] [PubMed]
  31. Pôças, I.; Cunha, M.; Pereira, L.S.; Allen, R.G. Using remote sensing energy balance and evapotranspiration to characterize montane landscape vegetation with focus on grass and pasture lands. Int. J. Appl. Earth Obs. Geoinf. 2013, 21, 159–172. [Google Scholar] [CrossRef]
  32. Lian, J.; Huang, M. Evapotranspiration Estimation for an Oasis Area in the Heihe River Basin Using Landsat-8 Images and the METRIC Model. Water Resour. Manag. 2015, 29, 5157–5170. [Google Scholar] [CrossRef]
  33. Santos, C.; Lorite, I.J.; Allen, R.G.; Tasumi, M. Aerodynamic parameterization of the satellite-based energy balance (METRIC) model for ET estimation in rainfed olive orchards of Andalusia, Spain. Water Resour. Manag. 2012, 26, 3267–3283. [Google Scholar] [CrossRef]
  34. Pôças, I.; Paço, T.A.; Cunha, M.; Andrade, J.A.; Silvestre, J.; Sousa, A.; Santos, F.L.; Pereira, L.S.; Allen, R.G. Satellite-based evapotranspiration of a super-intensive olive orchard: Application of METRIC algorithms. Biosyst. Eng. 2014, 128, 69–81. [Google Scholar] [CrossRef]
  35. Paço, T.A.; Pôças, I.; Cunha, M.; Silvestre, J.C.; Santos, F.L.; Paredes, P.; Pereira, L.S. Evapotranspiration and crop coefficients for a super intensive olive orchard. An application of SIMDualKc and METRIC models using ground and satellite observations. J. Hydrol. 2014, 519, 2067–2080. [Google Scholar] [CrossRef]
  36. French, A.N.; Hunsaker, D.J.; Thorp, K.R. Remote sensing of evapotranspiration over cotton using the TSEB and METRIC energy balance models. Remote Sens. Environ. 2015, 158, 281–294. [Google Scholar] [CrossRef]
  37. Couvreur, V.; Kandelous, M.M.; Sanden, B.L.; Lampinen, B.D.; Hopmans, J.W. Downscaling transpiration rate from field to tree scale. Agric. For. Meteorol. 2016, 221, 71–77. [Google Scholar] [CrossRef]
  38. Falk, M.; Pyles, R.D.; Ustin, S.L.; Paw U, K.T.; Xu, L.; Whiting, M.L.; Sanden, P.H.; Brown, P.H. Evaluated Crop Evapotranspiration over a Region of Irrigated Orchards with the Improved ACASA–WRF Model. J. Hydrometeorol. 2014, 15, 744–758. [Google Scholar] [CrossRef]
  39. Shapland, T.M.; McElrone, A.J.; Paw U, K.T.; Snyder, R.L. A turnkey data logger program for field-scale energy flux density measurements using eddy covariance and surface renewal. Ital. J. Agrometeorol. 2013, 1, 1–9. [Google Scholar]
  40. De Vries, D.A. Thermal properties of soils. In Physics of Plant Environment; van Wijk, W.R., Ed.; North-Holland Publishing Company: Amsterdam, The Netherlands, 1963; pp. 210–235. [Google Scholar]
  41. Masek, J.G.; Vermote, E.F.; Saleous, N.E.; Wolfe, R.; Hall, F.G.; Huemmrich, K.F.; Gao, F.; Kutler, J.; Lim, T.K. A Landsat surface reflectance data set for North America, 1990–2000. Geosci. Remote Sens. Lett. 2006, 3, 68–72. [Google Scholar] [CrossRef]
  42. Liang, S. Narrowband to broadband conversions of land surface albedo I: Algorithms. Remote Sens. Environ. 2000, 76, 213–238. [Google Scholar] [CrossRef]
  43. Rouse, J.W., Jr.; Haas, R.H.; Schell, J.A.; Deering, D.W. Monitoring vegetation systems in the Great Plains with ERTS. NASA Spec. Publ. 1974, 351, 309. [Google Scholar]
  44. Allen, R.G.; Trezza, R.; Tasumi, M.; Kjaersgaard, J. Mapping Evapotranspiration at High Resolution Using Internalized Calibration: Application Manual for Landsat Satellite Imagery; Version 3.0; University of Idaho: Kimberly, ID, USA, 2014. [Google Scholar]
  45. Wukelic, G.E.; Gibbons, D.E.; Martucci, L.M.; Foote, H.P. Radiometric calibration of Landsat Thematic Mapper thermal band. Remote Sens. Environ. 1989, 28, 339–347. [Google Scholar] [CrossRef]
  46. Bastiaanssen, W.G.M. Regionalization of Surface Flux Densities and Moisture Indicators in Composite Terrain: A Remote Sensing Approach under Clear Skies in Mediterranean Climates. Ph.D. Thesis, Wageningen Agricultural University, Wageningen, The Netherlands, 1995. [Google Scholar]
  47. Dhungel, R.; Allen, R.G.; Trezza, R. Improving iterative surface energy balance convergence for remote sensing based flux calculation. J. Appl. Remote Sens. 2016, 10, 026033. [Google Scholar] [CrossRef]
  48. Allen, R.G.; Burnett, B.; Kramber, W.; Huntington, J.L.; Kjaersgaard, J.; Kilic, A.; Kelly, C.; Trezza, R. Automated calibration of the metric-landsat evapotranspiration process. J. Am. Water Resour. Assoc. 2013, 49, 563–576. [Google Scholar] [CrossRef]
  49. Morton, C.G.; Huntington, J.L.; Pohll, G.M.; Allen, R.G.; McGwire, K.C.; Bassett, S.D. Assessing calibration uncertainty and automation for estimating evapotranspiration from agricultural areas using METRIC. J. Am. Water Resour. Assoc. 2013, 49, 549–562. [Google Scholar] [CrossRef]
  50. Long, D.; Singh, V.P.; Li, Z. How sensitive is SEBAL to changes in input variables, domain size and satellite sensor? J. Geophys. Res. Atmos. 2011, 116, D21107. [Google Scholar] [CrossRef]
  51. Biggs, T.W.; Marshall, M.; Messina, A. Mapping daily and seasonal evapotranspiration from irrigated crops using global climate grids and satellite imagery: Automation and methods comparison. Water Resour. Res. 2016, 52, 7311–7326. [Google Scholar] [CrossRef]
  52. Cammalleri, C.; Anderson, M.C.; Gao, F.; Hain, C.R.; Kustas, W.P. Mapping daily evapotranspiration at field scales over rainfed and irrigated agricultural areas using remote sensing data fusion. Agric. For. Meteorol. 2014, 186, 1–11. [Google Scholar] [CrossRef]
  53. Long, D.; Singh, V.P. Integration of the GG model with SEBAL to produce time series of evapotranspiration of high spatial resolution at watershed scales. J. Geophys. Res. Atmos. 2010, 115, D21128. [Google Scholar] [CrossRef]
  54. Dhungel, R.; Allen, R.G.; Trezza, R.; Robison, C.W. Evapotranspiration between satellite overpasses: Methodology and case study in agricultural dominant semi-arid areas. Meteorol. Appl. 2016, 23, 714–730. [Google Scholar] [CrossRef]
Figure 1. Study area shown as: (a) a Landsat 5 TM false color image; and (b) true color image from Google Earth. The subset extent of the Landsat image (path 42, row 35) used in the Mapping Evapotranspiration at high Resolution with Internalized Calibration (METRIC) approach for our evapotranspiration (ET) estimate includes the almond orchard, well-watered vegetation area and bare soil area. The nearest California Irrigation Management Information System (CIMIS) weather station (#146) and flux tower installed at the southern edge of the orchard are also shown.
Remotesensing 09 00436 g001
Figure 2. Monthly: (a) air temperature and precipitation; and (b) reference ETo related to grass during 2009–2012 at the Belridge CIMIS station.
Remotesensing 09 00436 g002
Figure 3. Flowchart of METRIC approach. Input data sets including Landsat 5 TM and 7 ETM+ observations from USGS and weather data from Belridge CIMIS station are used to calculate instantaneous surface energy fluxes (instantaneous values at Landsat overpass time) such as net radiation flux (Rn), soil heat flux (G) and sensible heat flux (H) in the processing procedure. The derived instantaneous fraction of reference ET (EToF) and reference ETo were then used to derive daily and monthly evapotranspiration (ET) maps over the almond orchard. The detailed description of METRIC approach can be found in Allen et al. [17,26].
Remotesensing 09 00436 g003
Figure 4. Automatic selection of “cold” pixels and “hot” pixels based on accumulative percentage of (a) NDVI and (b) land surface temperature (LST) maps. Red curve shows the accumulative percentage.
Remotesensing 09 00436 g004
Figure 5. Site-level comparison of: (a) instantaneous; and (b) daily ET estimated by Landsat-METRIC on a total of 46 Landsat images with those measured by flux tower, at Landsat overpass time around 10:30 a.m. and on Landsat overpass dates during 2009–2012 over the almond orchard.
Remotesensing 09 00436 g005
Figure 6. Time series of daily ET measured by the flux tower (black line) and estimated by the METRIC approach (red triangle points) over almond trees in 2009. The daily reference ETo of grass from Belridge CIMIS station is also shown here in blue line.
Remotesensing 09 00436 g006
Figure 7. Comparison of 16-day running mean daily fraction of reference ET (EToF) derived from the field measurements and estimated from Landsat-METRIC ET estimates during April–September in 2009–2012. Landsat-based EToF was not available from October to March since most Landsat observations were obscured by cloud cover during these months.
Remotesensing 09 00436 g007
Figure 8. Time series of interpolated daily METRIC ET (red open circles) from April to September and full annual time series of measured daily ET (black solid circles) at the tower site in 2009–2012.
Remotesensing 09 00436 g008
Figure 9. Comparison of estimated and measured monthly ET from April to September in 2009–2012.
Remotesensing 09 00436 g009
Figure 10. Spatial distribution of daily ET estimated by the METRIC approach at selected Landsat overpass dates and fraction of reference ET (EToF), NDVI, and net radiation (Rn) at Landsat overpass time, for the almond orchard outlined in Figure 1b.
Remotesensing 09 00436 g010
Figure 11. Maps of temporal correlation coefficient (R) between time series of METRIC-based daily ET and: (a) net radiation (Rn); and (b) NDVI at Landsat overpass time in each pixel over almond orchard during 2009–2012 (n = 46 days for each pixel).
Remotesensing 09 00436 g011
Figure 12. Spatial correlation coefficient (R) between METRIC-based ET and: (a) net radiation (Rn); and (b) NDVI over the almond orchard (n = 676 pixels) at Landsat overpass dates. There were 14 days in 2009, 11 days in 2010, 10 days in 2011 and 11 days in 2012.
Remotesensing 09 00436 g012
Figure 13. Daily ET estimated by two empirical methods, compared with: (a,c) METRIC-based ET (n = 7436 pixels); and (b,d) measured ET at the tower site, during 11 Landsat overpass dates in 2012. The top panel shows the results from the empirical method driven by ETo, NDVI, and VPD, while the bottom panel shows the results with Rn, NDVI, and VPD as driving variables.
Remotesensing 09 00436 g013
Table 1. Accuracy of instantaneous and daily METRIC ET estimates in comparison with flux tower measurements during Landsat overpass dates in 2009–2012.
Instantaneous ETDaily ET
YearNumber of DaysR2RMSE (mm/h)Bias (mm/h)MRD(%)R2RMSE (mm/Day)Bias (mm/Day)MRD (%)
All clear-sky Landsat overpassing dates
2009140.820.110.0027.910.870.93−0.0231.82
2010110.450.120.0216.700.760.91−0.3211.69
2011100.890.120.0428.470.980.760.3727.31
2012110.900.10−0.0613.020.960.490.2713.67
Total460.740.110.0021.790.870.800.0621.68
Growing season (April–September)
200990.690.05−0.026.380.780.56−0.167.56
201090.860.090.0512.640.890.48−0.066.46
201180.790.110.0115.930.940.540.138.31
201280.600.11−0.0610.800.880.540.269.73
Total340.640.090.0011.320.870.530.037.96
Table 2. Comparison between complete time series of daily ET estimated by METRIC and measured by the tower from April to September (n = 183 days per year) during 2009–2012.
YearR2RMSE (mm/Day)Bias (mm/Day)MRD (%)
20090.840.57−0.287.09
20100.870.58−0.068.27
20110.860.530.128.32
20120.830.560.048.31
Total0.850.56−0.058.00

