
Assessing Re-Composition of Xing’an Larch in Boreal Forests after the 1987 Fire, Northeast China


1
Key Laboratory of Remote Sensing Monitoring of Geographic Environment, College of Geography Sciences, Harbin Normal University, Harbin 150025, China
2
College of Mining Engineering, Heilongjiang University of Science and Technology, Harbin 150027, China
3
Department of Geography, University of South Carolina, Columbia, SC 29208, USA
*
Author to whom correspondence should be addressed.
Remote Sens. 2017, 9(5), 504; https://doi.org/10.3390/rs9050504
Submission received: 20 March 2017
/
Revised: 24 April 2017
/
Accepted: 16 May 2017
/
Published: 19 May 2017
Abstract
:Xing’an larch, a deciduous coniferous species, is the zonal tree of the Greater Xing’an Mountains in Northeast China. In May 1987, a catastrophic fire broke out in the mountains and burned 1.3 million hectares of forests in 26 days. While studies have shown that forest greenness has come back to normal in certain years, the re-composition of this zonal species has not been studied after the 1987 fire. With a series of Landsat 8 OLI images acquired in 2013–2015, this study builds the Normalized Difference Vegetation Index (NDVI) and Green Vegetation Index (GVI) time series in a complete growing cycle. A decision tree is developed to classify tree species with an overall accuracy of 86.16% and Kappa coefficient of 0.80. The re-composition of Xing’an larch after the 1987 fire is extracted, and its variations in areas under different fire intensities are statistically analyzed. Results show that Xing’an larch comprises 17.52%, 26.20% and 33.19% of forests in burned areas with high, medium and low fire intensities, respectively. Even around 30 years after the 1987 fire, the composition of this zonal species in boreal forest has not been fully recovered in the Greater Xing’an Mountains. The Xing’an larch map extracted in this study could serve as base information for ecological and environmental studies in this south end of the boreal Eurasia.
1. Introduction
The Greater Xing’an Mountains in Northeast China, comprising 10% of boreal biome in the Northern Eurasia Region, are the only boreal and the largest national forest of China. Xing’an larch (Larix gmelinii) is a representative boreal tree species extending from deciduous coniferous forests in the eastern Siberia [1]. It is recognized as the zonal vegetation of the Greater Xing’an Mountains and is part of the historical climax community along climatic succession. Spatially, it covers 55% in area and 75% in volume of China’s boreal forests and possesses important ecological functions of boreal forest ecosystems [2].
On 6 May 1987, a forest fire broke out in the Greater Xing’an Mountains, which burned 1.3 million hectares of forest in 26 days, causing economic losses worth of hundreds of millions of dollars and reducing forest areas from 78.4% down to 61.5% of the region [3,4]. Biodiversity was heavily destroyed in areas with severe and medium fire intensities. The fire also resulted in dramatic changes in local species composition and forest structures. The long-term loss of natural resources was almost unpredictable in this important natural forest of China.
Intensive research in China has been conducted in the Greater Xing’an Mountains forest to explore its recovery after the 1987 fire. Reference [4] found widespread white birch (Betula papyrifera) emerging in heavily burned areas, but regrowth of Xing’an larch was limited. Reference [3,5] simulated post-fire forest growth and suggested that higher proportion of conifers was needed for better recovery of forest ecosystems. Post-fire forest succession is a complex process that varies in different stages after fire disturbance. In deciduous conifers with medium-severe fire intensity, white birch dominated in early stages of succession but was eventually replaced by native coniferous species [6]. Post-fire recovery also varied with human interferences such as logging and planting [7]. These studies were mostly conducted at plot and landscape scales. The decadal National Forest Resource Inventory (NFRI) of China [4] was also applied to gain a general sense about species composition and tree structural information in each unit polygon. Furthermore, most field studies were conducted in a short period after the 1987 fire. Studies for a longer term, especially those in recent years (i.e., about 30 years after the fire), have been limited. The spatial and temporal limitation of past studies hindered our knowledge about spatiotemporal dynamics of Xing’an larch after the 1987 fire in this unique boreal forest.
Satellite observations since 1970s, owing to their synoptic view of Earth surfaces, have been identified as an effective tool for monitoring forest fires and post-fire recovery. Satellite-assisted forest recovery in the Greater Xing’an Mountains has been conducted. Kong and Liu [8] manually extracted burned areas from Landsat imagery and examined fire disturbances to landscape in the northern Xing’an Mountains. The Normalized Difference Vegetation Index (NDVI), a greenness indictor, was commonly used to approximate its regrowth after a fire event [9]. However, it often saturated before reaching the point where a forest recovered to its maximum biomass [10]. Furthermore, post-fire succession of boreal forests varies with fire severity and extent coupled with environmental conditions [11,12]. In this sense, it is inappropriate to evaluate forest recovery by relying on static NDVI values [13]. Chu and Guo [14] reviewed a rich set of remote sensing studies in fire impacts and post-fire forest responses of boreal forests and suggested that variations in forest composition and structure in pre- and post-fire forests should be further examined for operational monitoring of post-fire forest recovery.
Forest composition is characterized by tree species richness and abundance. With limited scenes of satellite images, different tree species often have similar spectral signatures, which result in high uncertainties in tree species mapping [15,16]. As a deciduous coniferous species, Xing’an larch possesses a unique growth cycle that differs from evergreen conifers in the northern high latitudes and deciduous forests in the south. Forest phenology identifies the unique timing of tree development in a growing season. Frequent observations of satellite time series take advantage of spectral differences in a growth cycle and, therefore, may improve the accuracy of tree species classification [17]. In [18], multi-temporal Landsat imagery illustrated annual phenology that clearly improved the delineation of temperate forest stands in different succession stages. In the remote boreal ecosystems, however, tree species delineation from satellite time series has been limited (as reviewed in [19].
Based on the 1987 fire event in the Greater Xing’an Mountains, this study aims to examine the tree species re-composition using satellite time series collected in one growing cycle. Distributions of Xing’an larch extracted in this study provide the first spatial layer of this unique boreal tree species after the 1987 fire, which may serve as base information for studies of ecological habits and functions responding to frequent fire disturbances in boreal forests.
2. Materials and Methods
2.1. Study Area
The Greater Xing’an Mountains forest lies between the Inner Mongolia Plateau and the Northeast Plain in northern China. It has an annual average temperature of −3.9 °C and annual cumulative precipitation of 400 mm, more than 60% of which occurs between June and August.
This study takes one of the four forest subdivisions in the Greater Xing’an Mountains, the Tuqiang Forest in Heilongjiang Province, as our study area (the inset of Figure 1). It is located in 122°18′28″–123°28′10″E and 52°15′35″–53°33′42″N, covering an area of 0.5 million ha that is dominated with forests. Located in the south end of the boreal Eurasia, tree species in the study area are mostly Xing’an larch, white birch and Mongolian pine (Pinus sylvestris var. mongolica). Other deciduous species such as aspen and willow and coniferous species such as spruce only grow in less than 10% of the region [9]. As Xing’an larch is the primary concern of this study, these tree species are not examined to avoid unnecessary classification uncertainties. Alerted by the 1987 fire, China enhanced its control of forest fire by enhancing regular fire airplane cruise and increasing ground personnel [20]. According to local station of Forest Fire Prevention, there were no large-sized (>100 ha) fires bursting in the study area after 1987 (Mr. Huadong Wu, Vice Director, Fire Prevention Office, Tuqiang Forest Bureau, personal communication, 5 June 2015). Therefore, the study area provides a perfect test site for post-fire species re-composition analysis after this catastrophic fire.
2.2. Datasets
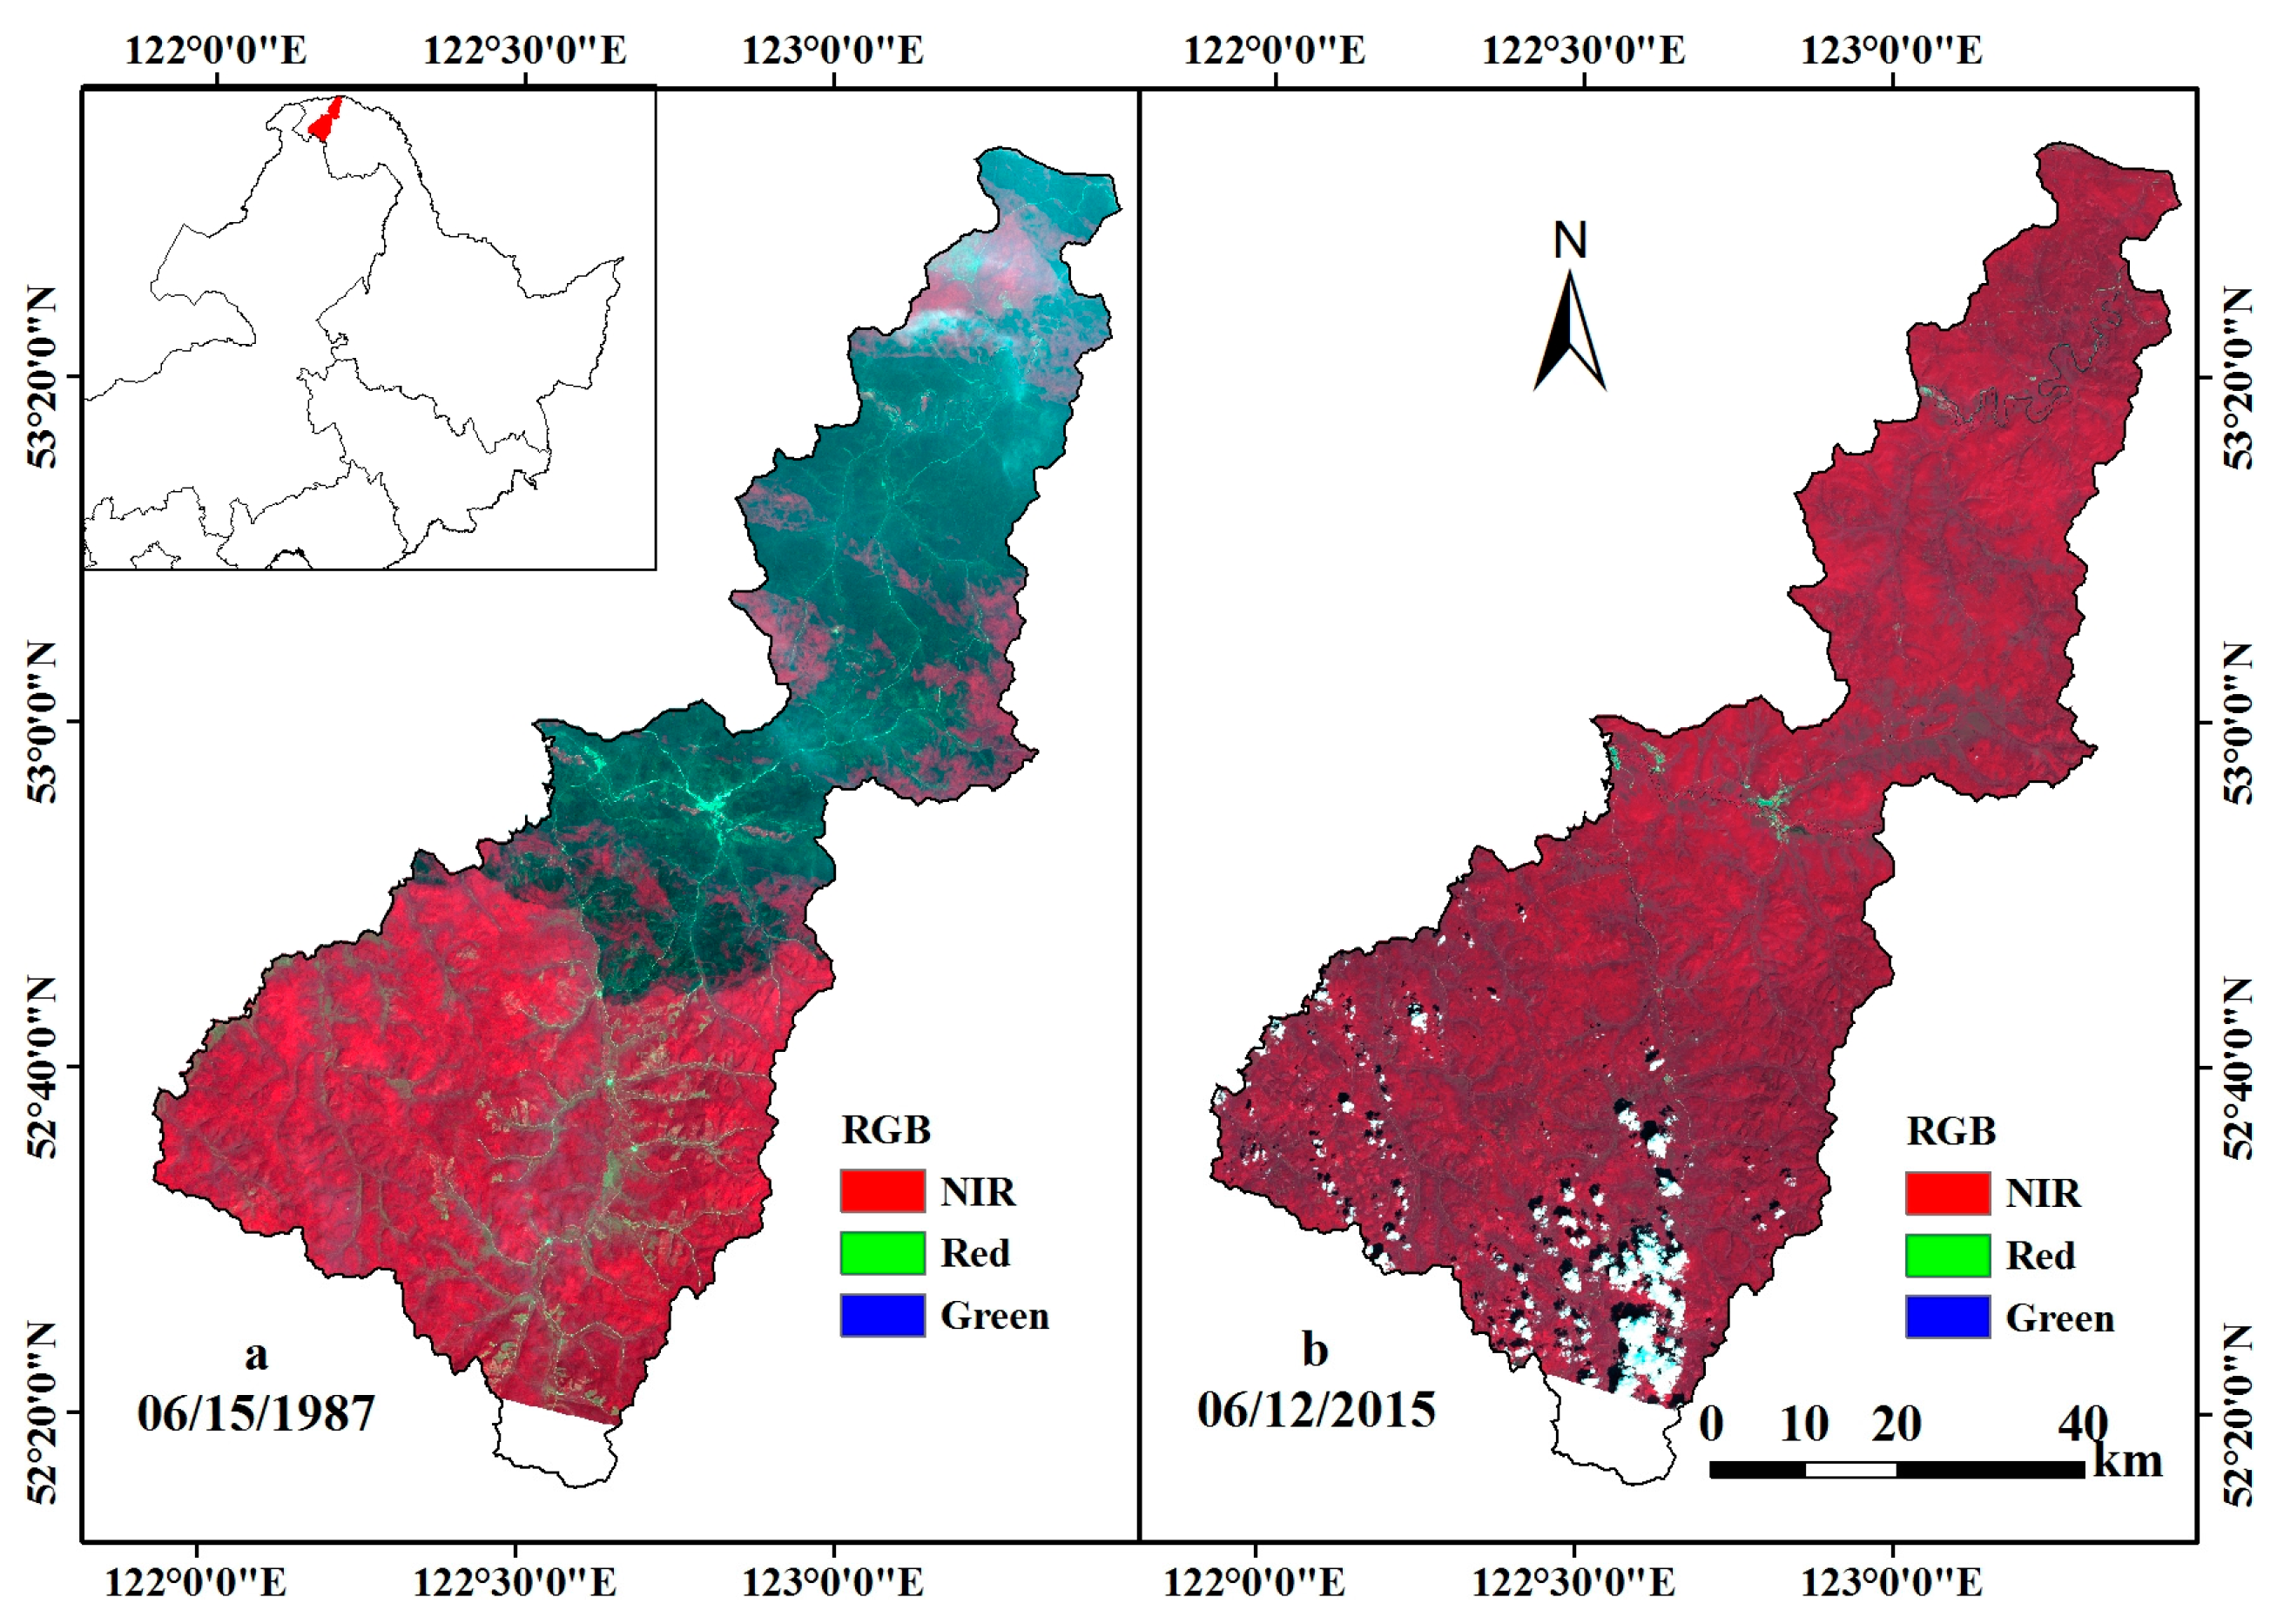
The study area is covered within one Landsat tile (Path 122, Row 23). The white spot in the middle of images in Figure 1 is Tuqiang Town, the only developed urban land in the study area. Logging is the primary human activity. Several roads intersected at the town for wood transportation. The 1987 fire swamped the Greater Xing’an Mountains from northeast to southwest. In the Landsat 5 TM image acquired one month after the fire (Figure 1a), fire scars occupied more than half of the study area. It burned a total area of 0.23 million ha and a total volume of 8.68 million m3 of the Tuqiang Forest [21]. The southern portion of the study area was not affected, providing a good reference of pre-fire forest conditions. In the Landsat 8 OLI image acquired in 2015 (around 30 years after fire), forest greenness seemed fully recovered, and fire scars were not visually apparent (Figure 1b).
All Landsat images in the study area were searched in the USGS Data Clearinghouse (Earth Explorer). From February–October in 2013–2015, only 9 Landsat 8 OLI scenes with low cloud covers were available (Table 1). Within three years, we assume the inter-annual growth of forests is not significant. This image series contains one image per month, which fairly represents forest development in a complete growing cycle. All Landsat 8 OLI images downloaded at Earth Explorer are surface reflectance products, and therefore, atmospheric correction was not further performed. With the UTM projection in the WGS84 datum, the downloaded OLI images were geometrically matched well. The Landsat 5 TM image in 1987 was georeferenced to the OLI images with a root-mean-square error (RMSE) less than one pixel (30 m).
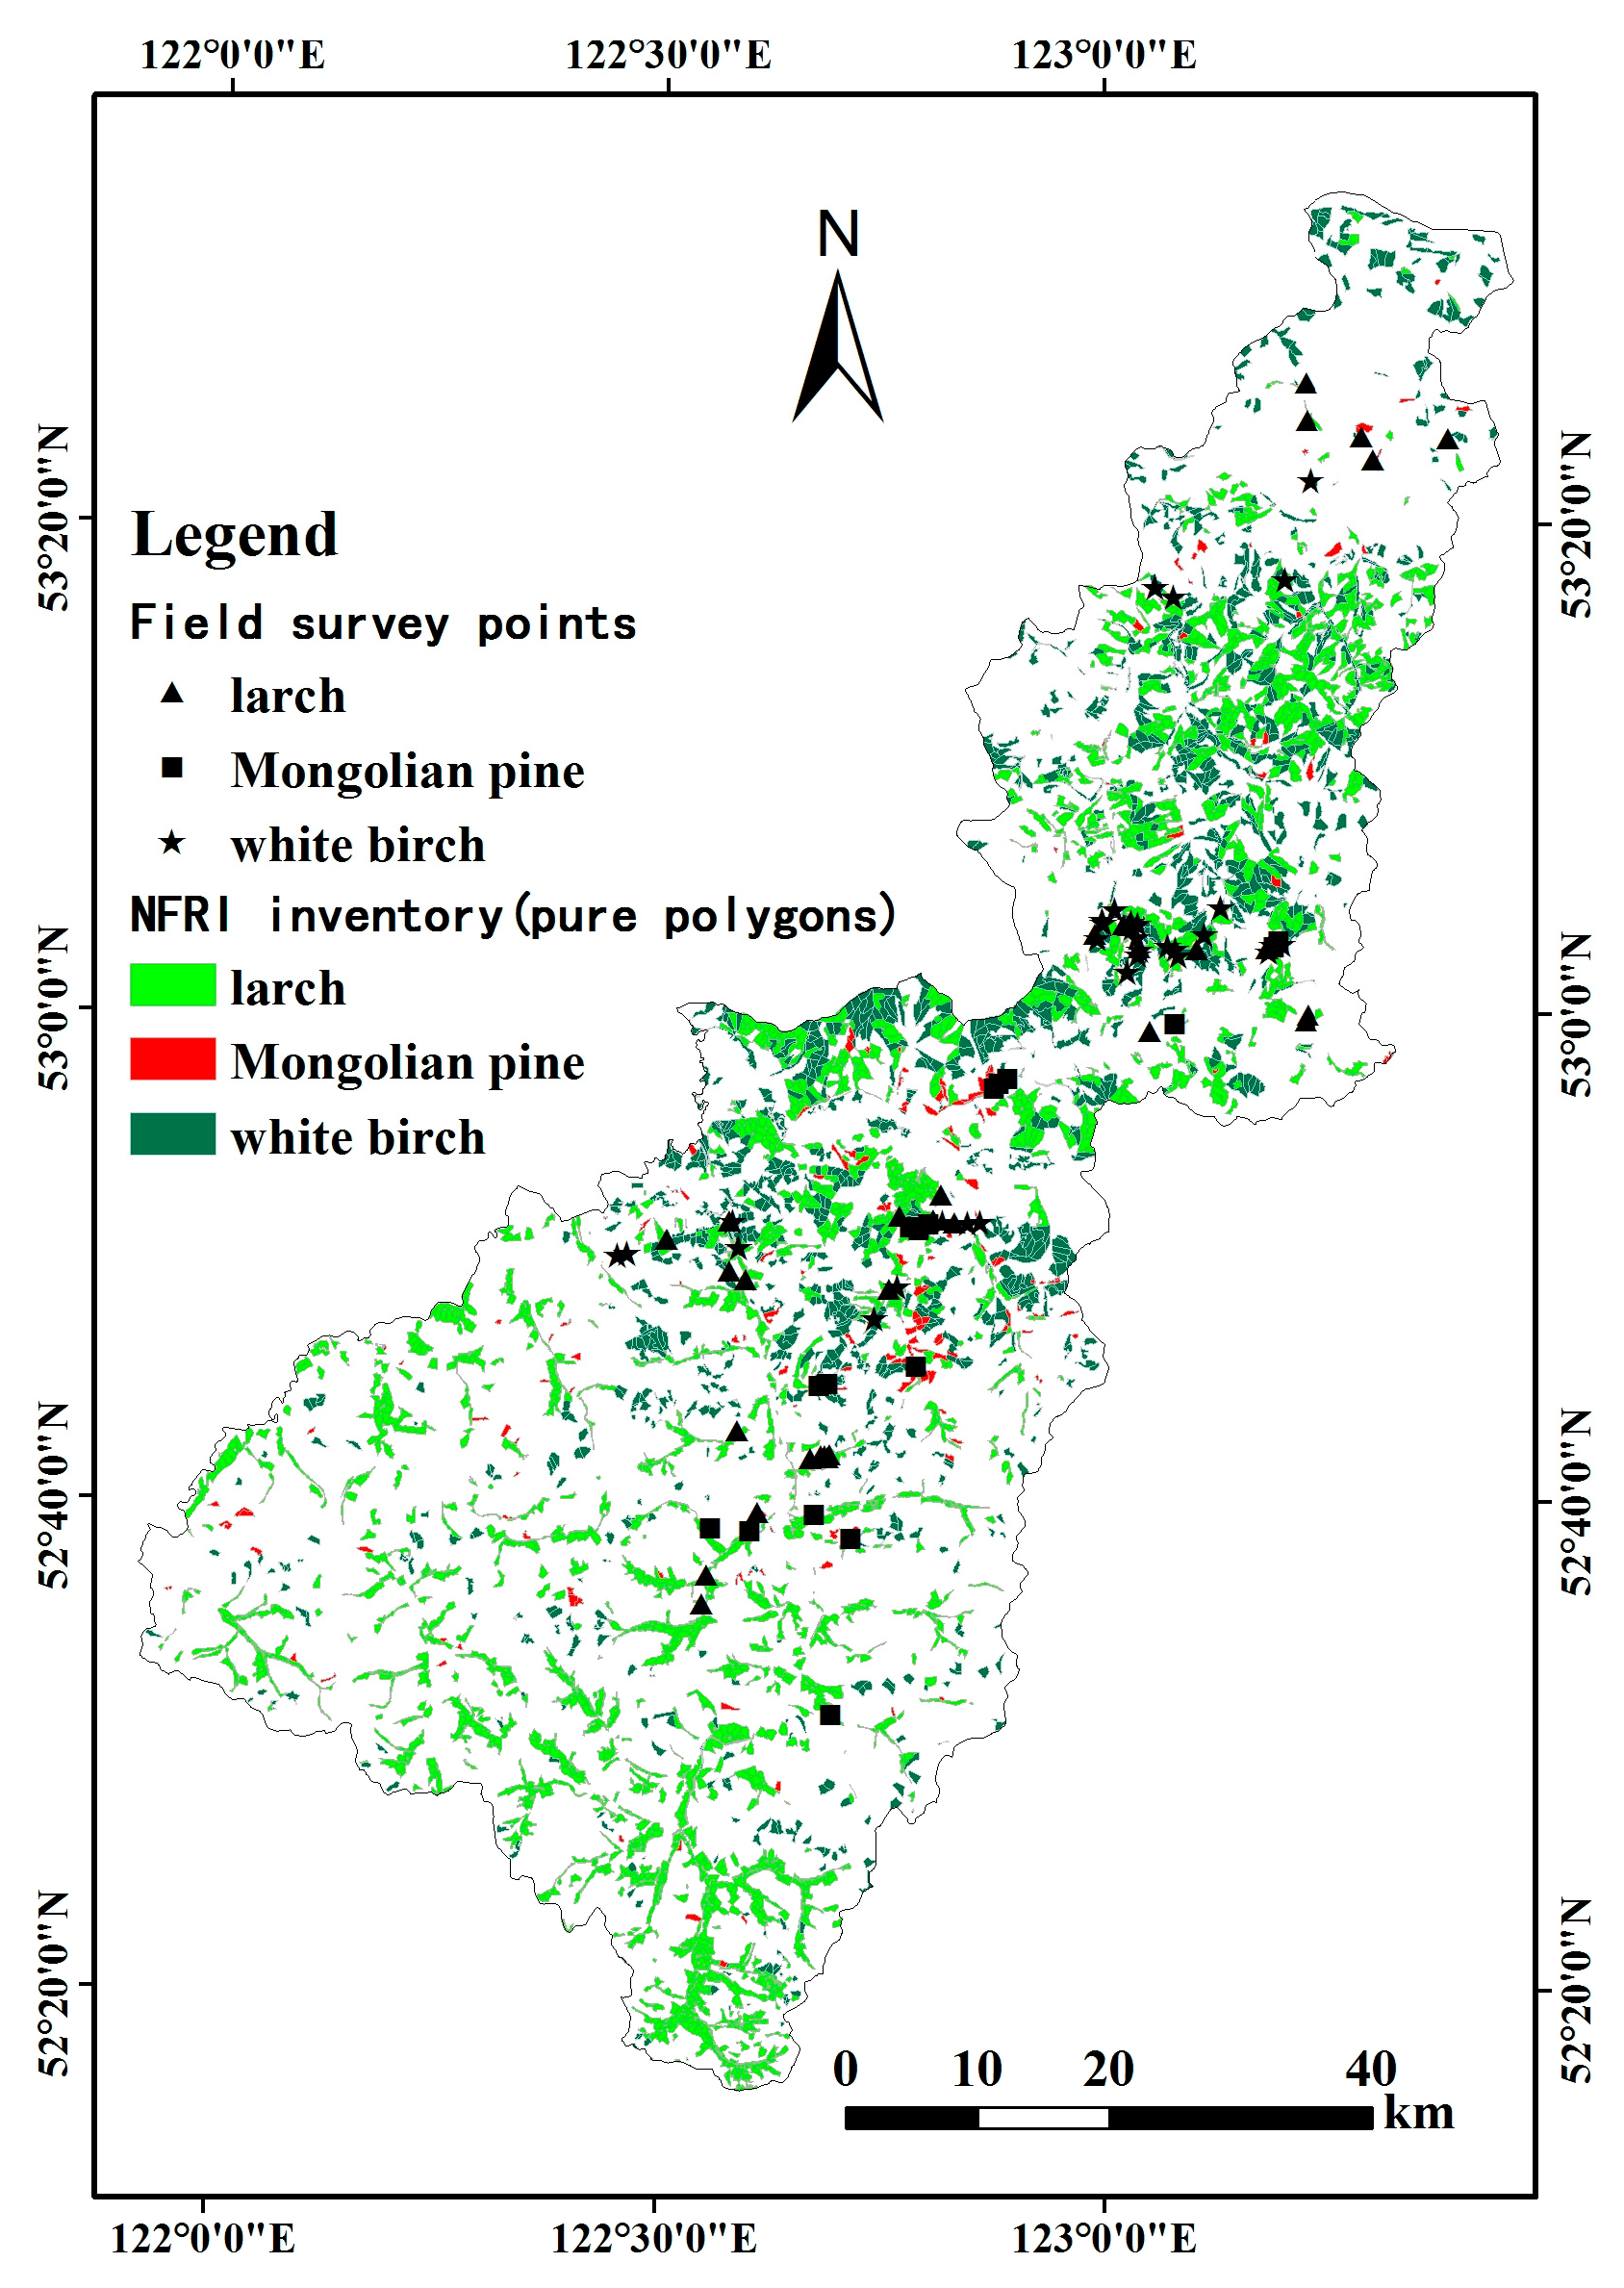
Ground truth samples of tree species were collected from two sources. The 2010 NFRI inventory data in Tuqiang Forest Bureau provides survey records about tree species composition in each unit polygon. The average polygon size was 29 ha, calculated from more than 10,000 unit polygons in the study area. While most polygons were found in mixed growth of tree species in the inventory records, we extracted those with pure species (Xing’an larch, white birch, Mongolian pine). Polygons with pure stands are displayed in Figure 2. Training sample points were randomly extracted from these polygons and visually checked against Google Earth imagery to remove erroneous points, such as those in or close to non-forest covers. With this process, 189 samples for Xing’an larch, 187 white birch and 24 Mongolian pine were collected as our training dataset. Mongolian pine has a much smaller sample size because its pure-stand polygons are very limited.
Secondly, a field experiment was carried out on 5–19 June 2015 to collect validation sample points. We conducted field surveys at selected stops across the study area. At each stop point, we walked into the forest along a 150-m transect and recorded species composition at a 30-m interval. All observations along this transect served as one sample point, which matched to a 3 × 3 pixel window in the OLI image. The primary species along this transect was considered the tree species of this sample point. A total of 82 ground truth samples of tree species was collected in the field trip (33 Xing’an larch, 32 white birch, 17 Mongolia pine), which served as validation points of the classification. These sample points are also marked in Figure 2. Non-forest land covers in the study area were primarily herbaceous grasses at low elevations, clusters of urban development and water bodies. These cover types can be easily identified in the meter-scale Google Earth imagery. After cross-checking with the OLI images, we randomly collected 77 points from Google Earth to serve as validation points of non-forest covers (24 water, 27 grass, 26 urban).
2.3. Approaches
With the OLI time series, full trajectories of spectral indices in a growing cycle were extracted at each pixel. Based on phenological differences of the three tree species, a decision tree approach was developed to delineate Xing’an larch from Mongolian pine and white birch, as well as non-forest covers. The re-composition of Xing’an larch was then statistically examined under different fire intensities.
2.3.1. Time-Series Spectral Indices
Two greenness-related spectral indices were analyzed. The commonly-applied NDVI effectively represents vegetation greenness using red and near-infrared (NIR) bands. The Green Vegetation Index (GVI) takes full consideration of all spectral bands and is the greenness component of the tasseled cap transformation (TCT) [22]. The two indices are calculated as:
where ρ is surface reflectance of blue, green, red, NIR and two shortwave infrared (SWIR) bands. The coefficients of the TCT transformation are adopted from [22], which reports that these newly-derived coefficient sets for OLI are in continuation of its TM predecessors.
NDVI = (ρnir − ρred)/(ρnir + ρred)
GVI = −0.2941ρblue − 0.243ρgreen − 0.5424ρred + 0.7276ρnir + 0.0713ρswir1 − 0.1608ρswir2
Spectral indices extracted from the 9 OLI images are assigned N1–N9 for NDVI and G1–G1 for GVI in Table 1. Upon the training sample points, trajectories in Figure 3 reflect spectral dynamics in a complete growing cycle. For each tree species, the trajectory reveals its biophysical development from leafing at the start of season to senescence at the end of season. Influenced by a boreal climate in the north and continental temperate climate in the south, the three tree species in the study area have unique timing sequences. Mongolian pine belongs to evergreen conifer. For both spectral indices, it has much higher values than other two species in the early (February, N1 and G1) and late (October, N9 and G9) growing stages. Xing’an larch is a deciduous conifer species and has similar trajectories as white birch. Their NDVI trajectories are almost the same (Figure 3a), but the GVI values of Xing’an larch are recognizably lower than those of white birch in the peak season (G5–G7, June–August) in Figure 3b. It should be noted, however, error bars (±standard error of the mean) of these three tree species turned out to overlay even in these optimal stages, which causes uncertainties in tree species classification. Grasses have similar growth cycles as tree species, but their values in peak stages are remarkably lower in both figures. These unique trajectory features allow us to delineate tree species from satellite time series, especially Xing’an larch in this study.
The non-vegetation covers (developed lands and water bodies) do not have clear growing cycles and, therefore, are not displayed in Figure 3. From the validation samples, developed lands had slightly higher values than water for both indices. Water turned out to have negative values in the trajectory, with an NDVI range of [−0.417, 0.025] and a GVI range of [−0.245, −0.007], except for the 6th image on 12 June 2015, in which the water samples were affected by isolated cloud covers (as shown in Figure 1b). These characteristics made the non-forest covers easily delineated from tree species in an unsupervised classification as described below.
2.3.2. Hierarchical Image Classification
Since Xing’an larch was our primary concern, non-forest classes were considered noises in image classification. Here, a two-step classification process was proposed. First, a regular unsupervised clustering analysis was performed. All forest pixels were grouped into forest and all non-forest pixels into non-forest. With the resulted non-forest mask, a forest-only image set was thus extracted from the NDVI and GVI time series.
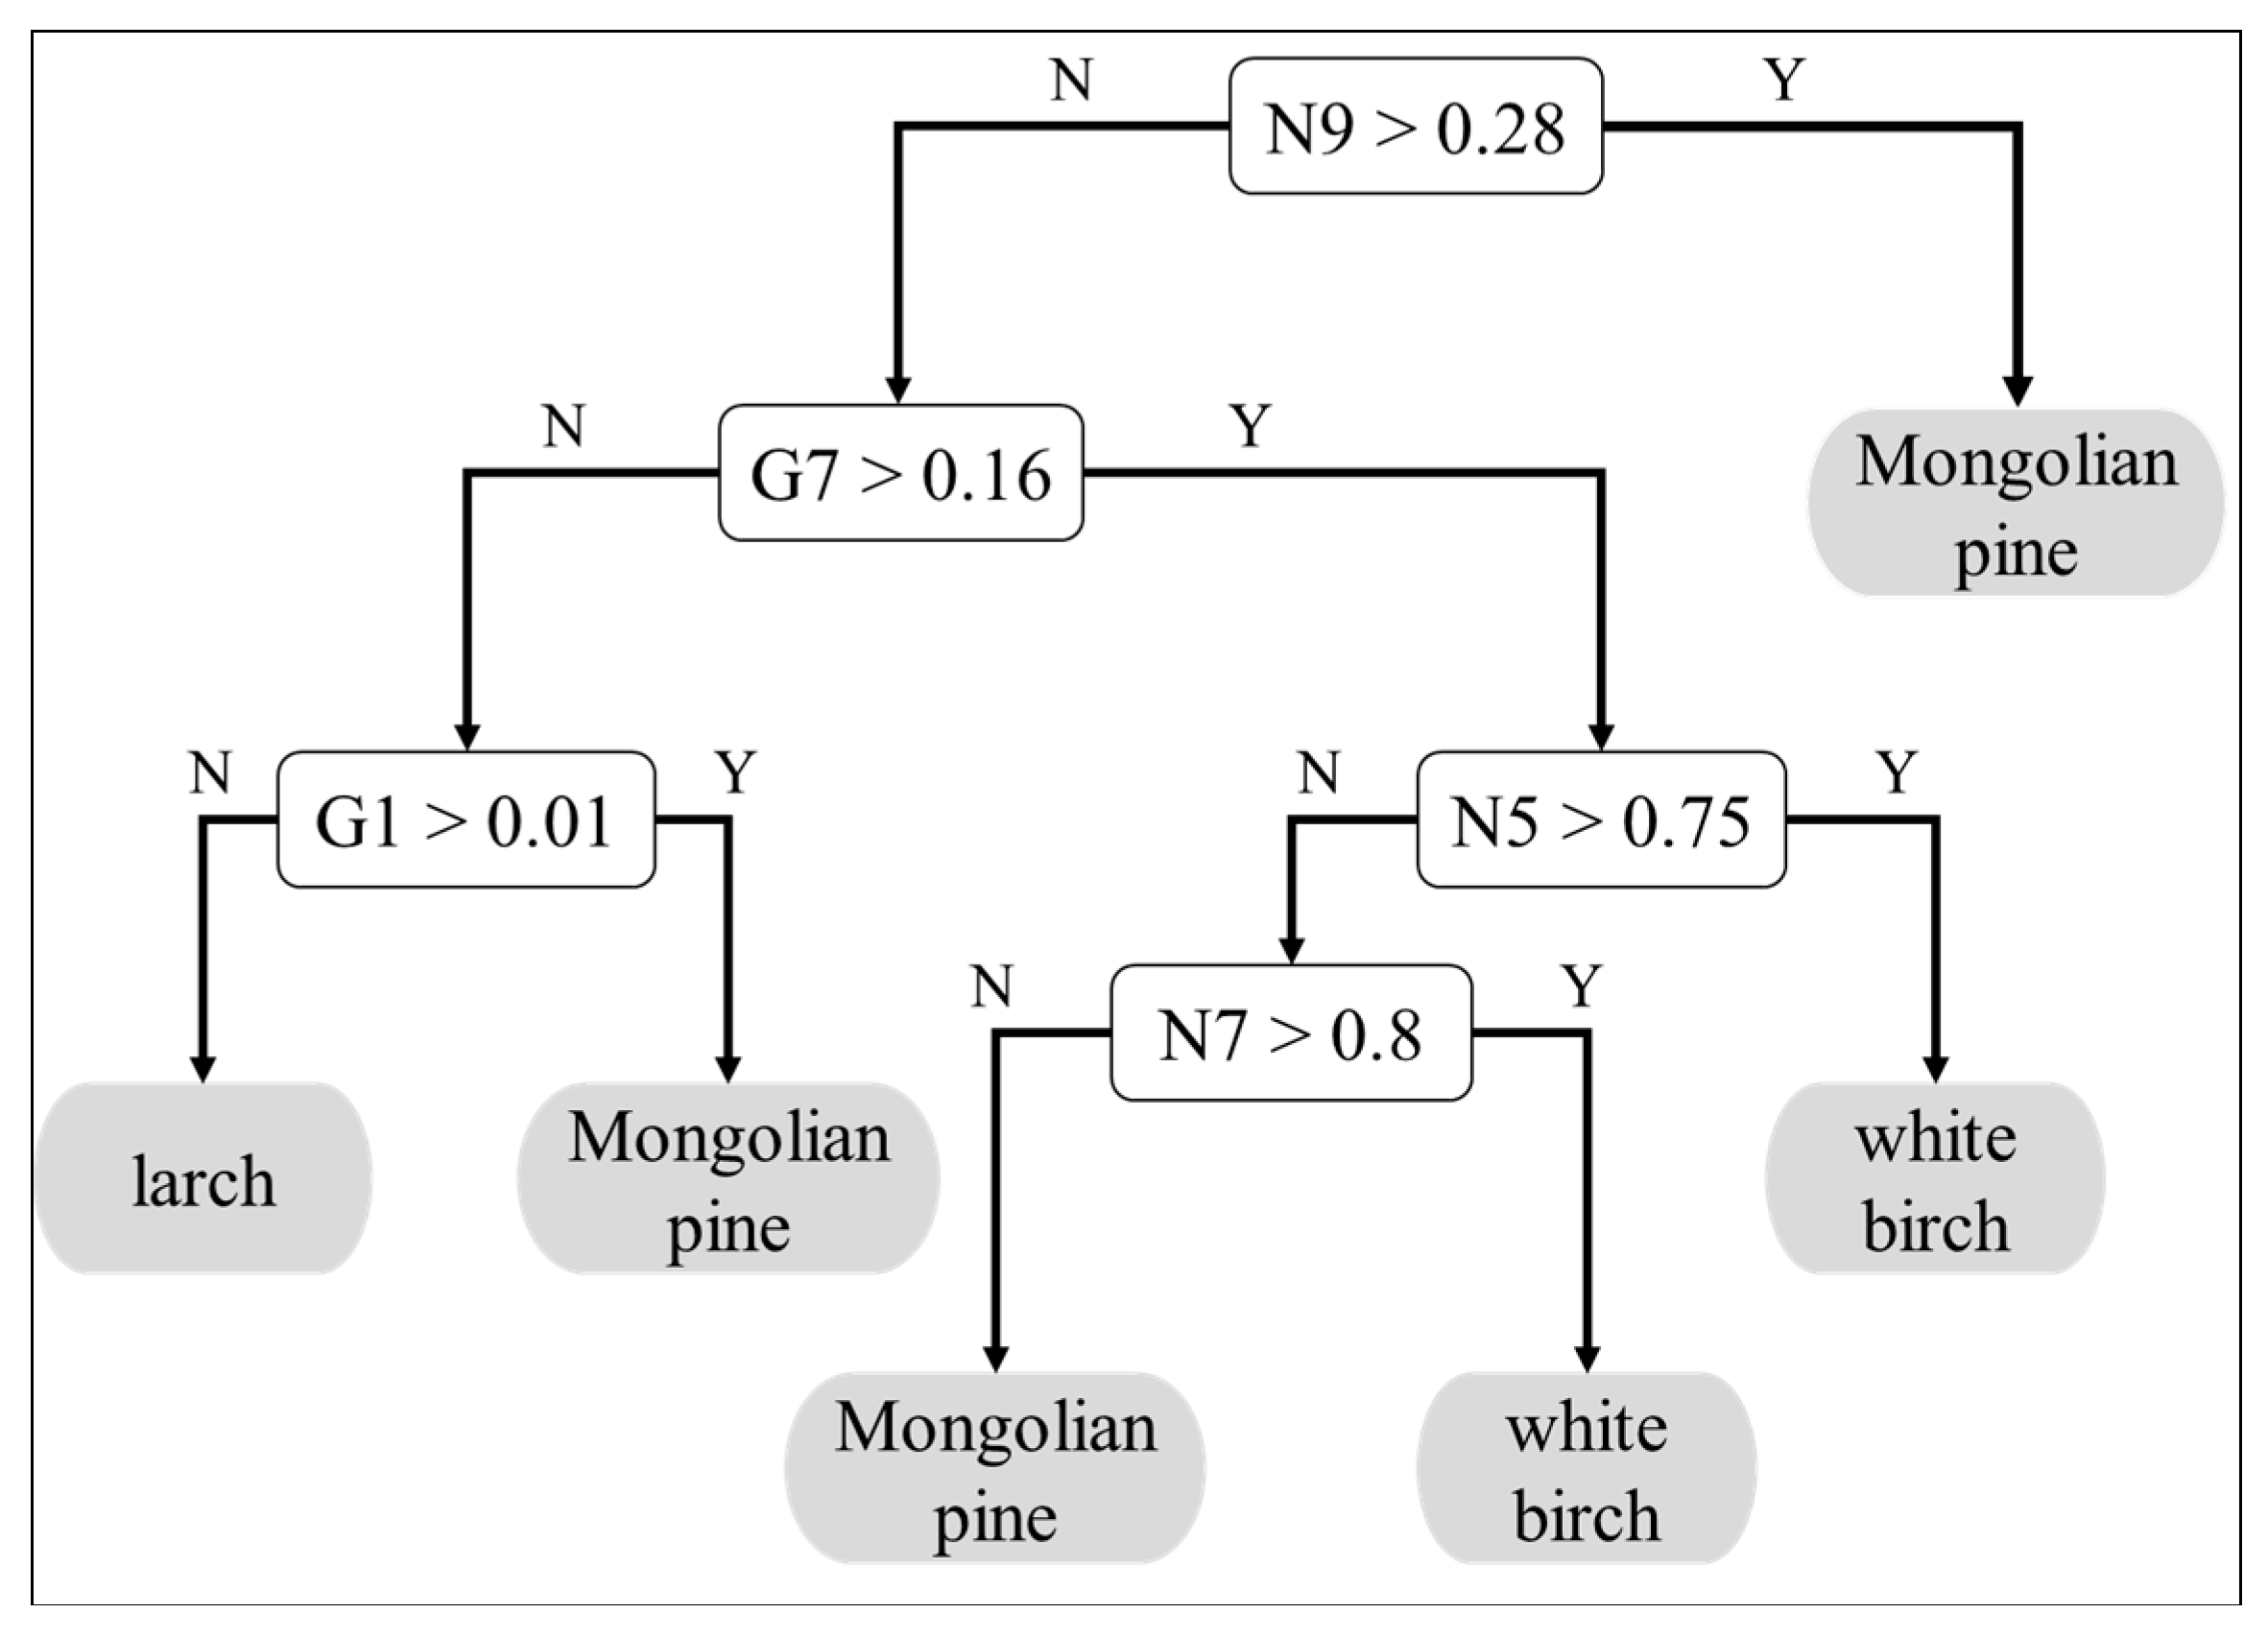
Using the large amount of training samples of tree species, a classification and regression tree (CART) decision tree was developed in the Salford Predictive Modeler (SPM) v7.0 [23] by taking advantage of NDVI and GVI trajectories. Figure 4 displays the first 5 nodes of the decision tree, including G1 (February), N5 (June), G7 and N7 (August), and N9 (October). Data in early (G1) and late (N9) growing stages identified Mongolian pine because of its higher off-season greenness as an evergreen tree species. Peak-season greenness (G7) better separated larch and white birch. Early greenness in June (N5) and highest greenness in peak season (N7) maximally delineated white birch from Mongolian pine.
Four classes were extracted in this hierarchical classification: Xing’an larch, Mongolian pine, white birch and non-forest. Using the validation points described in Section 2.2, accuracy assessment was performed with the commonly-applied confusion matrix approach. The overall accuracy, Kappa coefficient and producers’ and user’s accuracies of each class were calculated. The uncertainties of Xing’an larch were thoroughly discussed.
2.3.3. Fire Intensity Mapping and Larch Re-Composition Analysis
Historical imagery before the 1987 fire was not available in the study area. Here, we adopted the idea of substituting “space for time” proposed by [18]. Since the southern part of the study area (as shown in Figure 1a) was not burned, we used these unburned areas to approximate the “pre-fire” forest conditions by assuming that tree species composition had not been changed since 1987. The assumption was reasonable because the population in the Greater Xing’an Mountains was low, and therefore, anthropogenic impacts were limited. It should be noted, however, that forest growth and succession stages since 1987 may change forest covers and biophysical properties in unburned areas.
Fire intensity was approximated by post-fire severity quantified from the observed short-term vegetation changes after the event [14]. To assess the impacts of the 1987 fire, we adopted the normalized burn ratio (NBR) to quantify fire intensity from satellite imagery [24]. A factor of 1000 was multiplied to expand the values to [−1000, 1000]:
NBR = (ρnir − ρswir2)/(ρnir + ρswir2) × 1000
The TM5 image acquired one month after the 1987 fire was used to extract the NBR in the study area. The burned areas have low NBR values, and healthy forests have high values. Intensive studies have also used the difference NBR (dNBR) calculated from pre- and post-fire images to quantify fire intensities by reducing the impacts of pre-fire land covers in heterogeneous landscapes (e.g., those summarized in [14]). Since pre-fire satellite imagery (before 1987) in the study area was not available, we could not take advantage of this normalized index. Located in a remote, natural forest, the study area was almost homogeneously forest before the 1987 fire. Therefore, we assume that the pre-fire condition did not dramatically vary across the study area, and the NBR in Equation (3) effectively quantified fire intensities in this study.
Reference [25] studied the 1987 fire in a forest within the Greater Xing’an Mountains and categorized the NBR values into three ranks of fire intensities: low, medium and high. Using the same thresholds, however, fire in our study area was predominately in high rank. Here, we re-grouped the NBR values into 10 ranks at an internal of 100 to examine fire impacts with consecutively increasing intensities. Relying on the classified tree species distributions, percent covers of Xing’an larch in areas under these 10 fire intensities were extracted and compared. Against the unburned forests in the south of the study area, the re-composition status of this zonal boreal tree species was evaluated.
3. Results and Discussion
3.1. Tree Species Classification
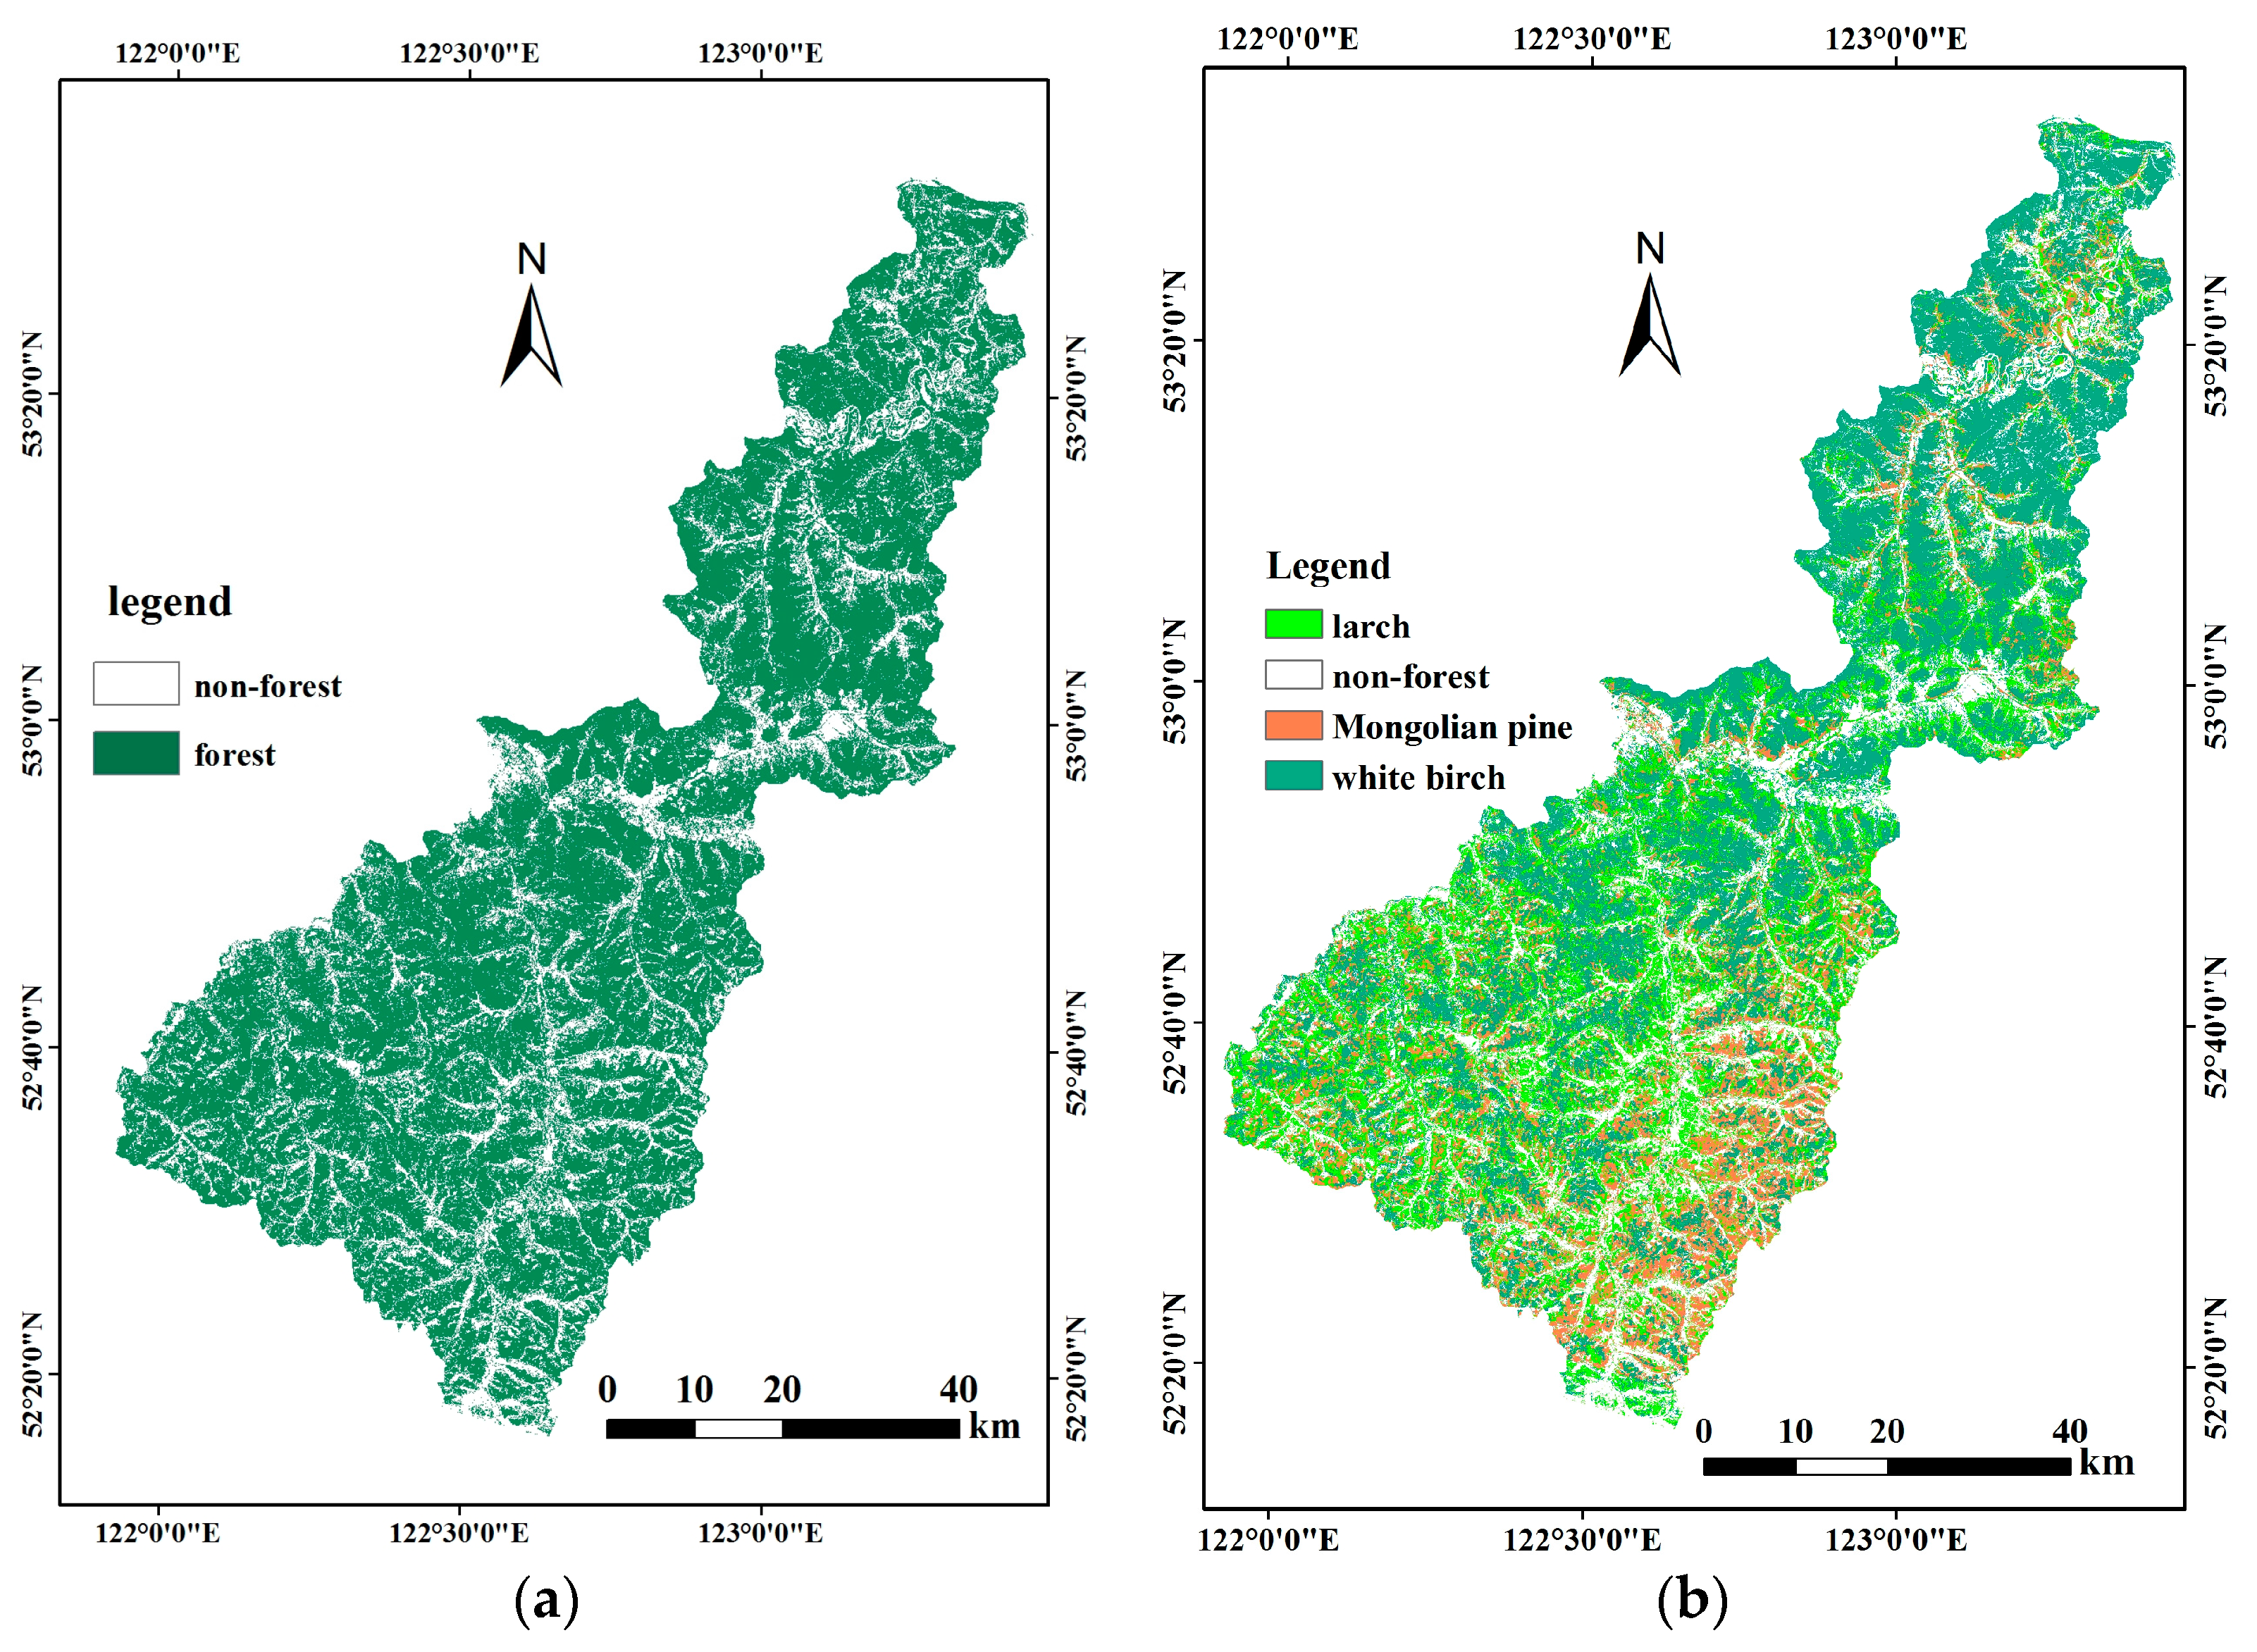
The two-step classification results are displayed in Figure 5. In the unsupervised forest/non-forest map (Figure 5a), the non-forest classes are mostly herbaceous grasses clustered in valleys and low-elevation wetlands. During our field trip, we learned from local foresters that many low-elevation areas were covered with natural forests before the 1987 fire. Trees failed to grow back in these lowlands because of high moisture conditions in soil (Mr. Huadong Wu, Vice Director, Fire Prevention Office, Tuqiang Forest Bureau, personal communication, 5 June 2015). In Figure 5b, there are more Xing’an larch distributions in the unburned south. The regrown tree species in the north was dominated with white birch. Mongolian pine was mostly clustered in the southeastern end of the study area, where the climate is transiting to a warmer continental temperate climate.
In the confusion matrix (Table 2), the overall accuracy of classification reaches 86.16% with a Kappa value of 0.80. Non-forest covers were optimally classified from satellite time series because of their distinctively different reflectance from tree species. As indicated in the overlaid error bars among the three trajectories in Figure 3, high confusion of tree species was observed in the classification results. As an evergreen coniferous species, Mongolian pine had different spectral trajectories from other tree species at the start and end of growth, which resulted in a high producer’s accuracy of 94.12%, although its accuracy (72.73%) was low, which may come from its small sample size. White birch and Mongolian pine were less confused. Xing’an larch, however, turned out to be confused with both tree species. One possible reason was the mixed re-growth of all tree species after the 1987 fire as recorded in the 2010 NFRI inventory data. Studies have observed that white birch outcompeted Xing’an larch in severely burned forests [4]. The mixed composition of tree species also had its natural causes, as the study area was transiting from boreal to warmer temperate climates.
Only nine Landsat images were available to build the time series in the study area. If more frequent observations were available, the confusion among tree species could be reduced from better defined trajectories in a growing cycle. Reference [9] extracted trajectories of the post-fire stand regrowth index from the 15-day AVHRR Global Inventory Modeling and Process (GIMMS) NDVI product in 1984–2006. Its 8-km grid size, however, is too coarse to classify individual tree species in this study. More recently, data fusion techniques have been developed to build Landsat-like, daily image series by taking advantage of image pairs between coarse-spatial, but high-temporal resolution imagery (e.g., MODIS) and medium-spatial resolution Landsat data [26]. While inter-calibration of different sensors could be a concern in the fused NDVI time series, it could be leveraged by explicit trajectory smoothing. The more frequent, Landsat-like time series could provide better insights for trajectory-based tree species identification.
The CART decision tree approach for tree species classification heavily relied on training samples for optimal threshold selection in decision rules. Training samples in this study were collected from surveyed pure polygons of forest inventory data. Uncertainties of inventory records could rise from field surveyors’ experience and the physical accessibility of the remote, natural forest in our study area. To leverage this, we collected a large amount of training samples (e.g., 189 samples for larch and 187 for white birch), although Mongolian pine had a much smaller training set due to its limited number of pure unit polygons in the study area (as shown in Figure 2). Large sample sets improved the validity of thresholds selected by the CART approach. As demonstrated from the error bars of trajectories in Figure 3, however, high uncertainties are expected in classifying the three tree species.
Given the abovementioned uncertainties, Xing’an larch reached accuracies around 70% in producer’s and user’s assessments. However, Figure 5b represents the first spatial layer of Xing’an larch in the Greater Xing’an Mountains after the 1987 fire. Its spatially-heterogeneous distributions in the study area could reflect fire disturbances to its recovery in the past 30 years.
3.2. The NBR Fire Intensity Map and Xing’an Larch Re-Composition
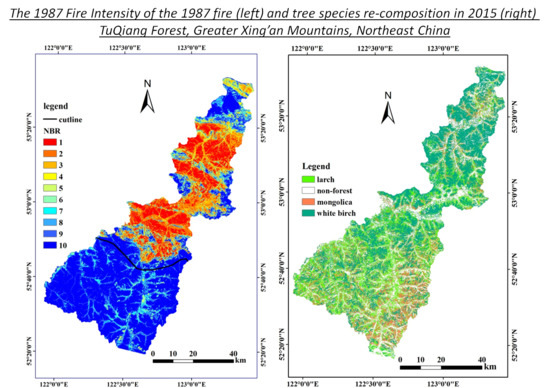
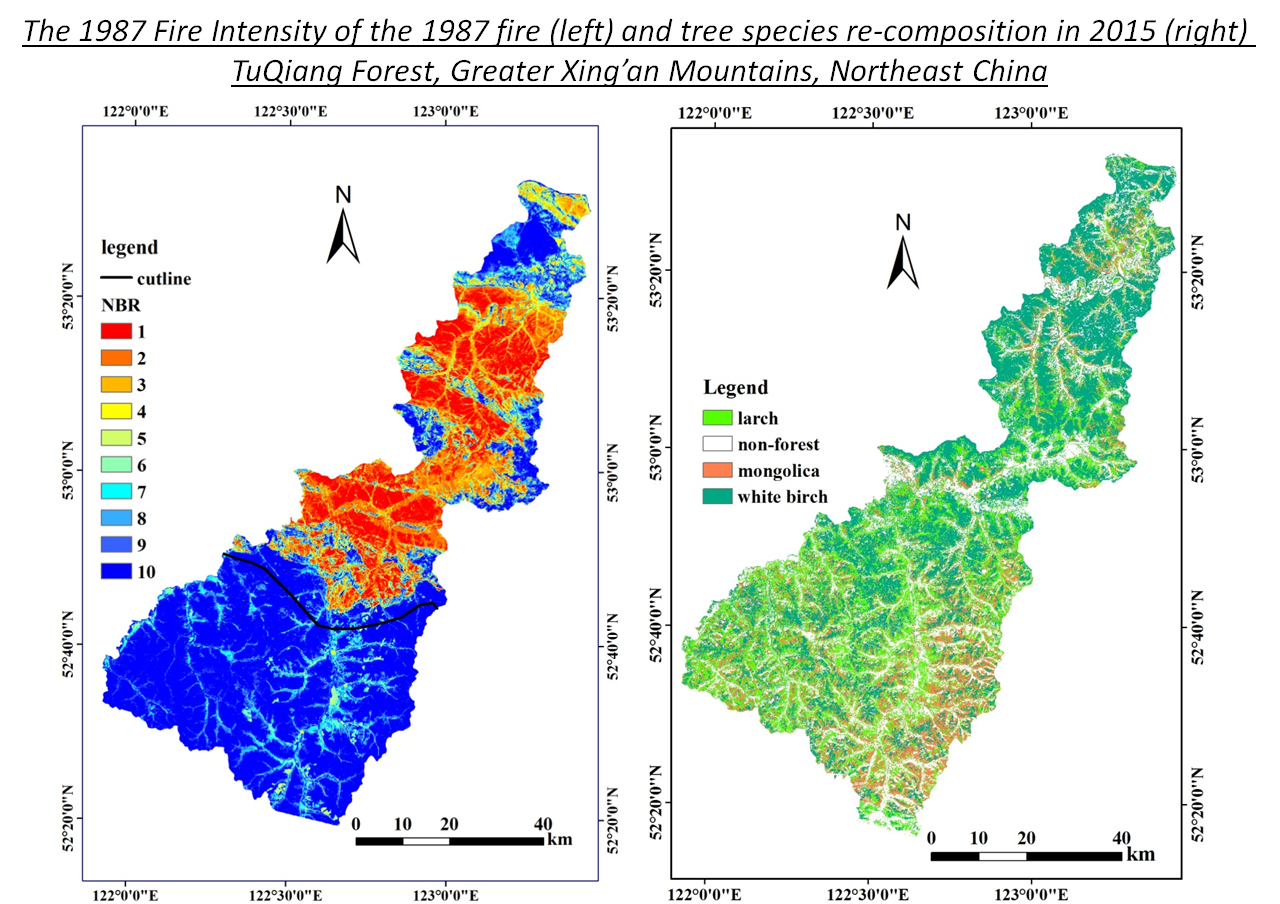
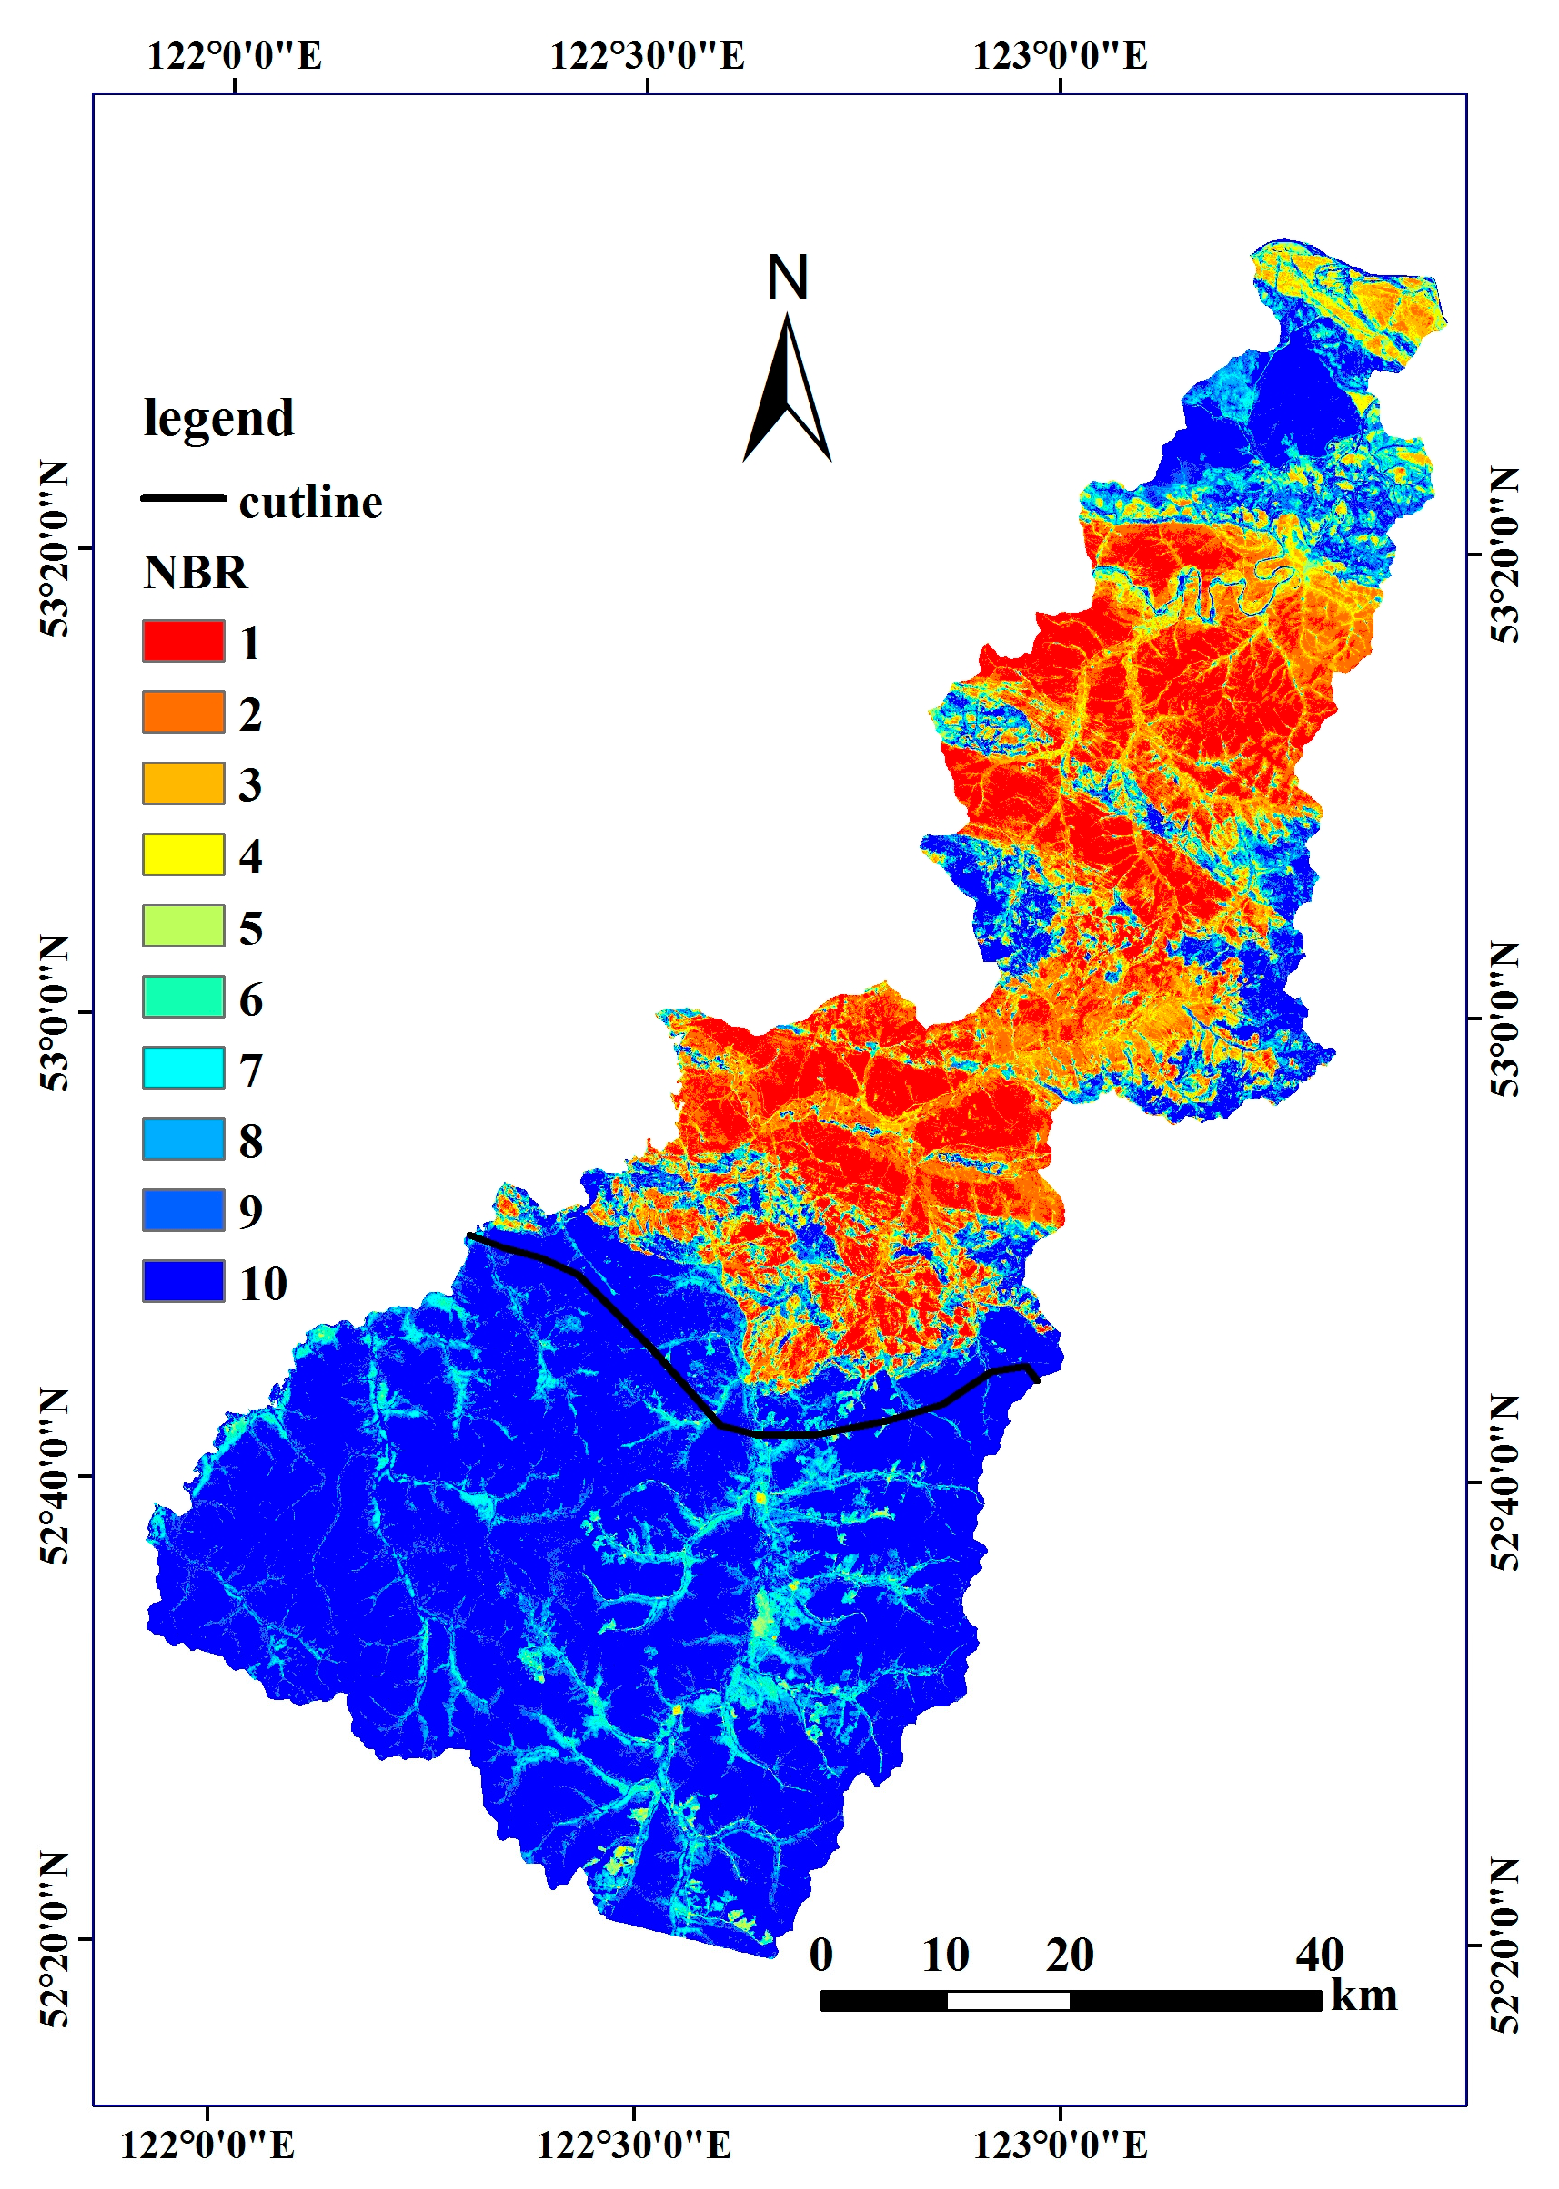
The 1987 fire swamped half of the study area in the north (Figure 6). Most of the burned areas had the highest fire intensity (rank = 1, highlighted in red), reaching 13.97% of the study area (Table 3). Areas with other burned ranks were scattered around. Unburned forests, for example in the south of the study area, were dominated with Rank 10 (in bright blue), covering 53.35% of the study area. To demonstrate the relative severity of fire damages, we grouped the 10 ranks of NBR into high, medium, low and unburned. Details about the ranks and their associated fire intensity categories are listed in Table 3.
Valleys and low-elevation areas in the south were not burned, but were also characterized with lower NBR values due to their spectral differences from forests. They have Ranks 7–9 in Figure 6 and could be misclassified as low-intensity burned areas using the categories in Table 3. For this reason, we used a cutline at the south edge of fire scars (marked in Figure 6) to separate burned area in the north and unburned area in the south. In the south of this cutline, all ranks lower than 10 were assigned 10 to represent unburned areas. Areal percentages in Table 3 reflect the re-assigned ranks.
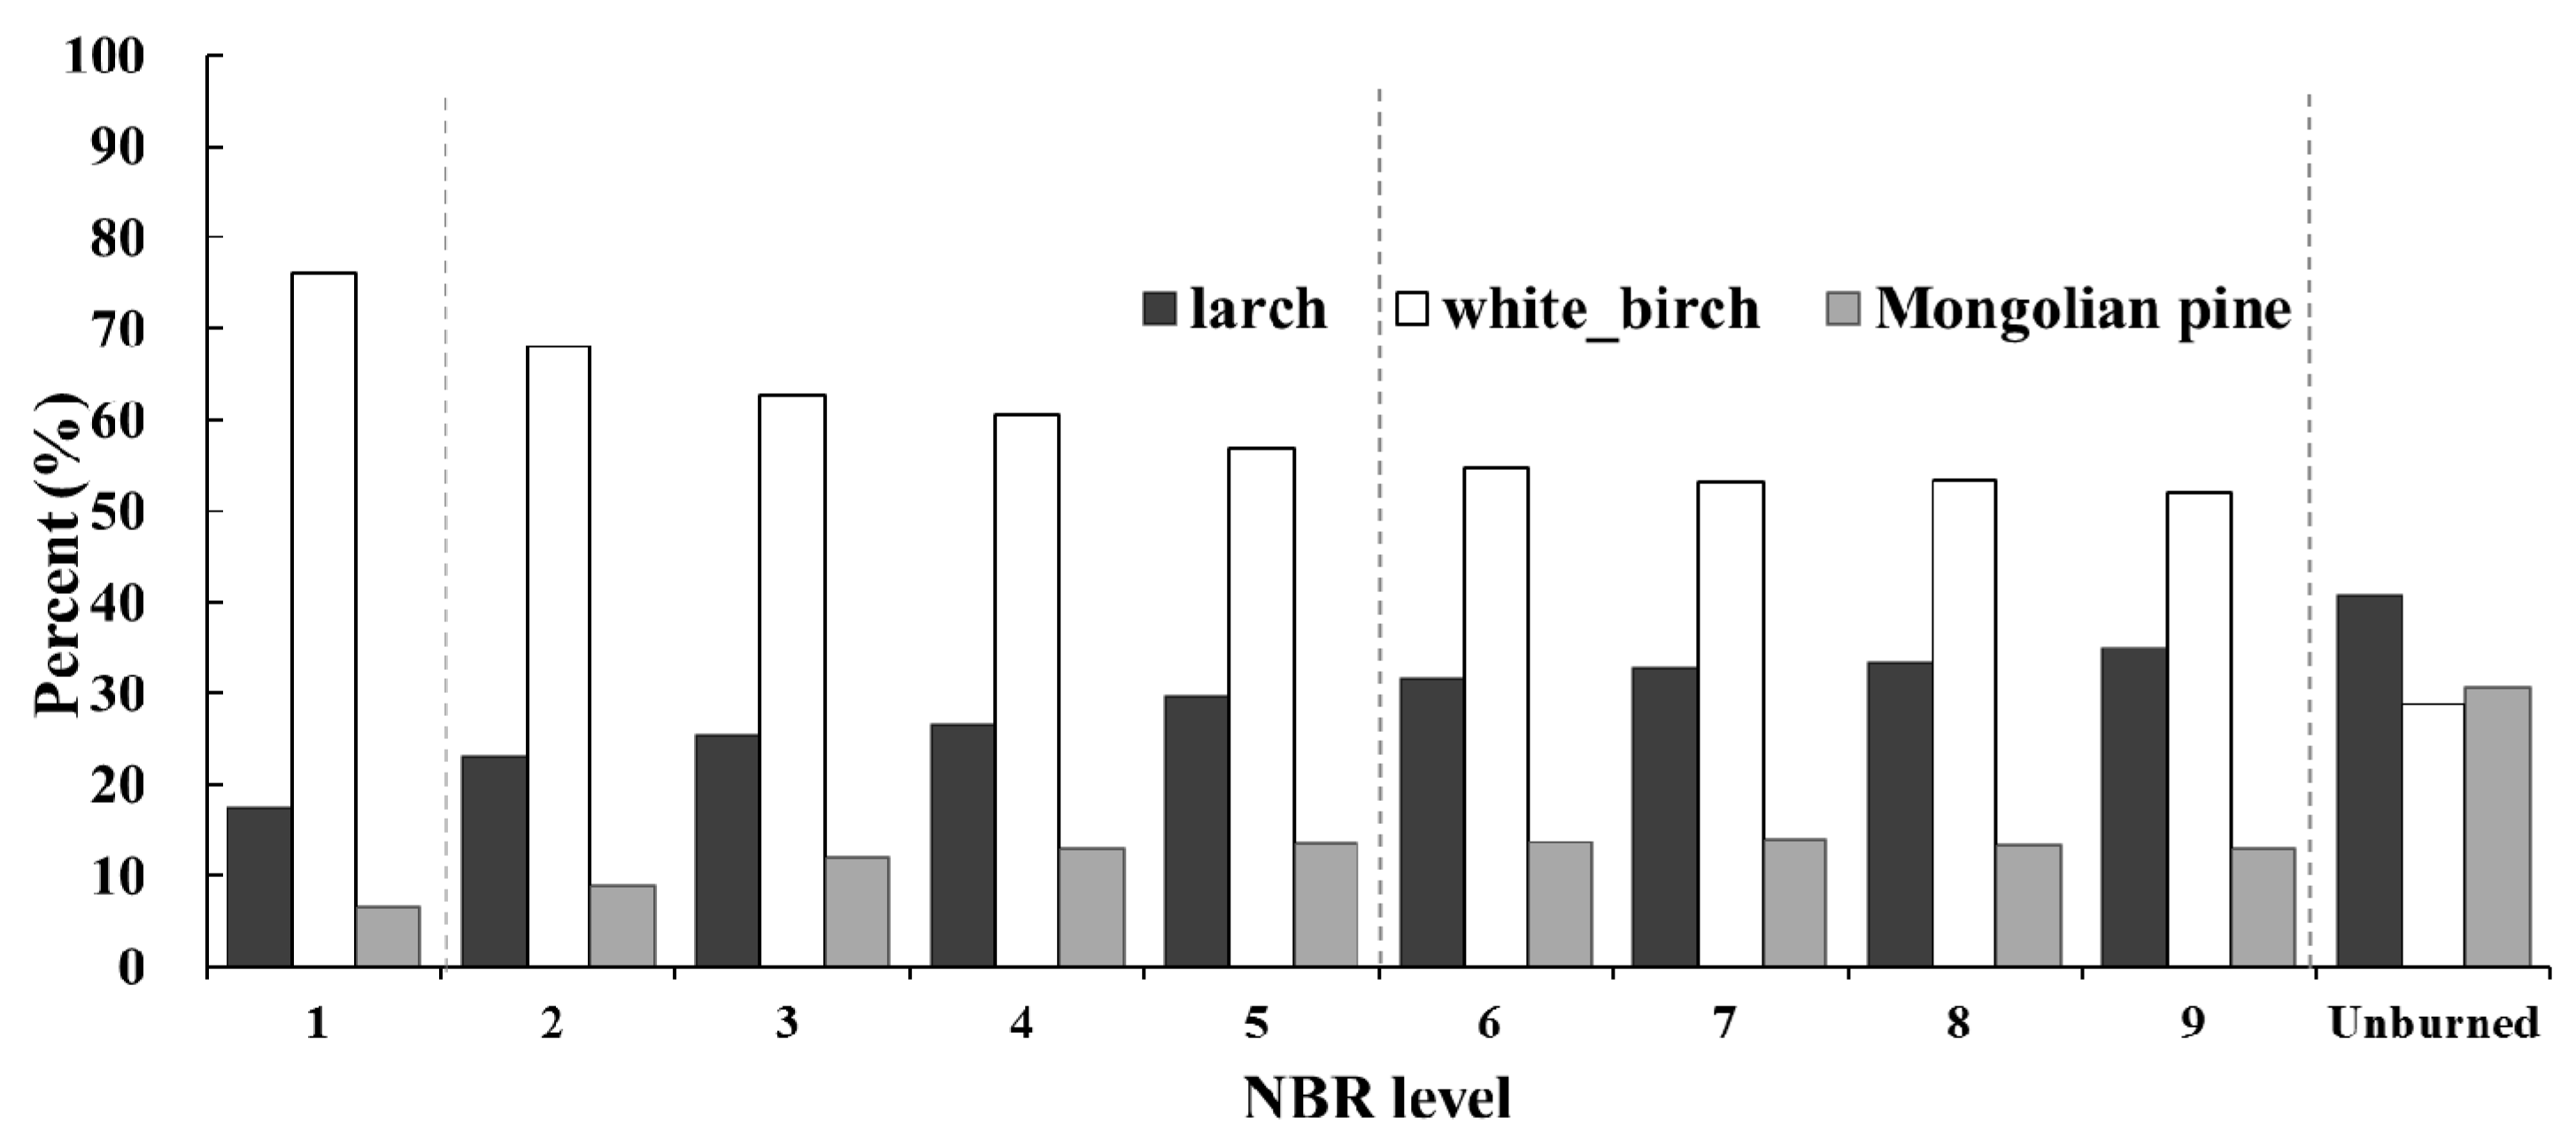
Tree species compositions in each NBR rank were summarized to statistically evaluate their regrowth under various fire intensities (Figure 7). Only forested areas were calculated. A higher larch composition approximated its better recovery in burned areas. Figure 7 reveals a linear increasing rate of recovery of Xing’an larch under high to low burning intensities. In high-intensity burned areas (rank = 1), almost all trees died from the 1987 fire, and therefore, tree species were mostly grown from new seedlings [25]. White birch outcompeted other species and dominated these areas with a high composition of 76.01% in forests. Xing’an larch could not compete with white birch in its early stage of post-fire succession; therefore, its composition dropped to 17.52% under high burning intensities. In areas closer to roads and Tuqiang Town, we observed patches of planted Xing’an larch during our field trip. However, with the lack of labor and budget, planted stands in the study area were very limited. Forests in natural recovery were thus dominated with white birch. Under medium burning intensity (rank = 2, 3, 4, 5), some trees were able to survive. Xing’an larch had a relatively higher composition and white birch had a lower composition than in high-intensity areas. Under low intensity (rank = 6, 7, 8, 9), trees survived the 1987 fire, and therefore, Xing’an larch composition was much higher than that in low-medium intensities.
For unburned forests (rank = 10) in the south of the study area, Xing’an larch, Mongolian pine and white birch covered 40.59%, 28.78% and 30.63%, respectively (Figure 7). It fairly demonstrated the compositions of pre-fire natural forests in this region, i.e., higher Xing’an larch distributions in the south end of boreal Eurasia. It is also shown in Figure 5b and Figure 7 that Mongolian pine has an un-proportionally high composition in unburned forests in the south, which may reflect tree species transition in a warmer climate below the boreal zone.
Figure 7 indicates that, within 30 years after the 1987 fire, Xing’an larch in the study area has not fully recovered. It composed 17.52%, 26.20% and 33.19% of burned forested in high, medium and low intensities, which had not reached its composition in unburned forests (40.59%) even with a higher distribution of Mongolian pine in the south. Different compositions of Xing’an larch in Figure 7 are supported by field studies in the past. In high-intensity burned areas, larch germination was heavily hindered by the lack of surviving seeds, while white birch rapidly took over via sprouting [3]. Its higher composition rate in low-intensity areas could be attributed to the improved seeding conditions. After ground canopies were burned down, seeds from surviving larches had a higher chance to reach soil.
Aside from natural succession of forests, post-fire tree species composition was highly affected by human interferences. Shortly after the 1987 fire, salvage logging was widely operated by the Greater Xing’an Forest Bureau across the burned forests to maximize the profit and to prevent the consequent insect damages. Since Xing’an larch holds high economic value, a large volume of healthy trees in areas with lower burning intensities were also logged. These activities further reduced larch compositions in burned areas, but were not documented in open data records. The planting strategy in the region after 1987 shifted from timber harvesting to planting coniferous seedlings. However, the planting density varied, and only 10% of the burned forests were managed with planting [7]. Since the early 2000s, the Natural Forest Protection Project named “Tian Biao” has been enforced, and logging activities were prohibited in the Greater Xing’an Mountains. Within a rigid fire monitoring network, there have been no severe fires in the study area since 1987. Some research actually concerned that intensive logging and successful fire suppression efforts have led to fire fuel buildup. Fires in this region become less frequent. Once broken out, however, they could be more intense than historical regimes.
In short, this study performed tree species classification from satellite time series relying on their unique trajectory patterns of spectral indices in a growing cycle. Past remote sensing applications in the study area often utilized limited scenes of satellite imagery for forest classification. While forest/non-forest types were fairly discriminated, detailed tree species composition cannot be effectively extracted because of their spectral similarity. With vegetation indices, various studies reported that greenness of boreal forests can grow back to pre-fire conditions in 5–20 years depending on fire severities and imagery resolutions [9,10,19]. This study revealed, however, that Xing’an larch re-composition had not been fully recovered in a 30-year span. Boreal forests grow slower than the temperate biome. They may need a much longer time to reach a later stage of succession (e.g., mature forest stands) or have been changed permanently in this vulnerable boreal forest. This study only examined the most recent growing cycle using imagery in 2013–2015 to extract the current re-composition of Xing’an larch. As demonstrated in the AVHRR GIMMS-extracted stand regrowth index trajectory in [9], image series of past cycles deserve further examination to understand the temporal path of larch re-composition in the long period after 1987.
4. Conclusions
This study collected satellite time series of two spectral indices in a complete growing cycle in 2013–2015 and developed a decision tree approach to classifying tree species in the Greater Xing’an Mountains. A sequence of fire intensities (high to low) was mapped with the NBR index from a TM image acquired one month after the 1987 fire. With the “space for time” substitution, their post-fire tree species compositions were examined against the unburned forests. The overall accuracy reached 86.16% in the study area. Accuracies of Xing’an larch were around 70% given the mixed growth of the three tree species and their spectral confusion in the nine-point trajectories. Results showed that, even 30 years after the catastrophic fire, Xing’an larch composition had not been fully recovered, although its distribution was higher in areas with lower burning intensities. More importantly, this study extracted the first spatial layer of this important zonal species of deciduous conifers, which may provide base information for studying its ecological functions and adaptations from natural/anthropogenic disturbances under the pressure of global warming.
Acknowledgment
This study was financially supported by the National Natural Science Foundation of China (No. 41371397).
Author Contributions
Junjie Wang and Cuizhen Wang designed the experiment and wrote the paper; Junjie Wang conducted the experiment and data analysis. Shunying Zang guided the field experimental design and paper revision.
Conflicts of Interest
The authors declare no conflict of interest.
References
- Gu, Y. The succession of forest communities in the forest region of Greater Xing’anling Mountains. Acta Phytoecol. Geobot. Sin. 1985, 9, 64–70. [Google Scholar]
- Wang, Y.; Zhou, G.; Jiang, Y.; Yang, Z. Estimation Biomass and NPP of Larix Forest Inventory Data (FID). Acta Phytoecol. Sin. 2001, 5, 420–425. [Google Scholar]
- Wang, X.; Li, X.; He, H.; Xie, F. Long-term effect of different planting proportions on forest landscape in Great Xing’an Mountains, Northeast China after the catastrophic fire in 1987. Front. For. China 2007, 2, 382–389. [Google Scholar] [CrossRef]
- Luo, X.; He, H.S.; Liang, Y.; Wang, W.; Wu, Z.; Fraser, J.S. Spatial simulation of the effect of fire and harvest on aboveground tree biomass in boreal forests of Northeast China. Landsc. Ecol. 2014, 29, 1187–1200. [Google Scholar] [CrossRef]
- Wang, X.; Li, X.; He, H.; Hu, Y. Assessing the cumulative effects of postfire management on forest landscape dynamics in northeastern China. Can. J. For. Res. 2006, 36, 1992–2002. [Google Scholar] [CrossRef]
- Sun, L.; Zhang, Y.; Guo, Q.; Hu, H. Carbon Emission and Dynamic of NPP post Forest Fires in 1987 in Daxing’an Mountains. Sci. Silvae Sin. 2009, 45, 100–104. [Google Scholar]
- Yang, S.; Liu, X.; Cao, H. Vegetation change in burned areas in the Greater Hinggan Mountain Forest. J. Northeast For. Univ. 1998, 26, 19–23. [Google Scholar]
- Kong, F.H.; Liu, X.Z. Gradient analysis on the influence of terrain on the forest landscape pattern in the burned blanks of the north slope of Mt. Daxing’anling. Acta Ecol. Sin. 2004, 24, 1863–1870. [Google Scholar]
- Yi, K.; Tani, H.; Zhang, J.; Guo, M.; Wang, X.; Zhong, G. Long-term satellite detection of post-fire vegetation trends in boreal forests of China. Remote Sens. 2013, 5, 6938–6957. [Google Scholar] [CrossRef]
- Goetz, S.J.; Fiske, G.J.; Bunn, A.G. Using satellite time-series data sets to analyze fire disturbance and forest recovery across Canada. Remote Sens. Environ. 2006, 101, 352–365. [Google Scholar]
- Furyaev, V.V.; Vaganov, E.A.; Tchebakova, N.M.; Valendik, E.N. Effects of fire and climate on successions and structural changes in the Siberian Boreal forest. Eurasian J. For. Res. 2001, 2, 1–15. [Google Scholar]
- Zhao, F.J.; Shu, L.F.; Wang, M.Y.; Liu, B.; Yang, L.J. Influencing factors on early vegetation restoration in burned area of Pinus pumila–Larch forest. Acta Ecol. Sin. 2012, 32, 57–61. [Google Scholar] [CrossRef]
- Frolking, S.; Palace, M.; Clark, D.; Chambers, J.; Shugart, H.; Hurtt, G. Forest disturbance and recovery: A general review in the context of spaceborne remote sensing of impacts on aboveground biomass and canopy structure. J. Geophys. Res. 2009, 114, G00E02. [Google Scholar] [CrossRef]
- Chu, T.; Guo, X. Remote sensing techniques in monitoring post-fire effects and patterns of forest recovery in boreal forest regions: A review. Remote Sens. 2014, 6, 470–520. [Google Scholar] [CrossRef]
- Hesketh, M.; Sánchez-Azofeifa, G.A. The effect of seasonal spectral variation on species classification in the Panamanian tropical forest. Remote Sens. Environ. 2012, 118, 73–82. [Google Scholar] [CrossRef]
- Fassnacht, F.E.; Latifi, H.; Stereńczak, K.; Modzelewska, A.; Lefsky, M.; Waser, L.T.; Straub, C.; Ghosh, A. Review of studies on tree species classification from remotely sensed data. Remote Sens. Environ. 2016, 186, 64–87. [Google Scholar] [CrossRef]
- Dymond, C.C.; Mladenoff, D.J.; Radeloff, V.C. Phenological differences in Tasseled Cap indices improve deciduous forest classification. Remote Sens. Environ. 2002, 80, 460–472. [Google Scholar] [CrossRef]
- Liu, W.; Song, C.; Schroeder, T.A.; Cohen, W.B. Predicting forest successional stages using multitemporal Landsat imagery with forest inventory and analysis data. Int. J. Remote Sens. 2008, 29, 3855–3872. [Google Scholar] [CrossRef]
- Cuevas-Gonzalez, M.; Gerard, F.; Balzter, H.; Riaño, D. Analyzing forest recovery after wildfire disturbance in boreal Siberia using remotely sensed vegetation indices. Glob. Chang. Biol. 2009, 15, 561–577. [Google Scholar] [CrossRef]
- Shi, M.; Qi, J.; Yin, R. Has China’s Natural Forest Protection Program Protected Forests?—Heilongjiang’s experience. Forests 2016, 7, 218. [Google Scholar] [CrossRef]
- Li, C.; Wang, J.; Hu, L.; Yu, L.; Clinton, N.; Huang, H.B.; Yang, J.; Gong, P. A Circa 2010 Thirty Meter Resolution Forest Map for China. Int. J. Remote Sens. 2014, 6, 5325–5343. [Google Scholar] [CrossRef]
- Baig, M.H.A.; Zhang, L.; Shuai, T.; Tong, Q. Derivation of a tasseled cap transformation based on Landat 8 at-satellite reflectance. Remote Sens. Lett. 2014, 5, 423–431. [Google Scholar] [CrossRef]
- CART Classification and Regression Trees, SPM 7.0 User Guide, 2012. Available online: https://www.salford-systems.com/products/cart (accessed on 17 May 2017).
- Roy, D.P.; Boschetti, L.; Trigg, S.N. Remote sensing of fire severity: assessing the performance of the Normalized Burn Ratio. IEEE Geosci. Remote Sens. Lett. 2006, 1, 112–116. [Google Scholar] [CrossRef]
- Wang, X.; Wang, W.; Chang, Y.; Fen, Y.; Chen, H.; Hu, Y.; Chi, J. Fire severity of burnt area in Huzhong forest region of Great Xing’an Mountains Northeast China based on normalized burn ratio analysis. Chin. J. Appl. Ecol. 2013, 24, 967–974. [Google Scholar]
- Wang, C.; Fan, Q.; Li, Q.; SooHoo, W.M.; Lu, L. Energy crop mapping with enhanced TM/MODIS time series in the BCAP agricultural lands. ISPRS J. Photogramm. Remote Sens. 2017, 124, 133–143. [Google Scholar] [CrossRef]
Figure 1.
The study area and two example images in standard false color: Landsat 5 TM image in 1987 (a) and Landsat 8 OLI image in 2015 (b).
Figure 1.
The study area and two example images in standard false color: Landsat 5 TM image in 1987 (a) and Landsat 8 OLI image in 2015 (b).

Figure 2.
The NFRI unit polygons with pure stands and field survey points for the three tree species in the study area. Boundaries of unit polygons are also displayed.
Figure 2.
The NFRI unit polygons with pure stands and field survey points for the three tree species in the study area. Boundaries of unit polygons are also displayed.

Figure 3.
Trajectories of tree species and non-forest covers for NDVI (a) and GVI (b). Error bars are marked as ± standard error at each point.
Figure 3.
Trajectories of tree species and non-forest covers for NDVI (a) and GVI (b). Error bars are marked as ± standard error at each point.

Figure 4.
A 5-node CART decision tree for the three tree species. The thresholds are summarized from the CART outputs of the training samples.
Figure 4.
A 5-node CART decision tree for the three tree species. The thresholds are summarized from the CART outputs of the training samples.

Figure 5.
Distributions of forest/non-forest (a) and tree species (b) in the study area.

Figure 6.
The NBR-extracted fire intensity map. A cutline is manually drawn to generally separate the burned areas in the north and unburned areas in the south of the study area.
Figure 6.
The NBR-extracted fire intensity map. A cutline is manually drawn to generally separate the burned areas in the north and unburned areas in the south of the study area.

Figure 7.
Tree species composition in forests under different fire intensities.

Table 1.
Time series of Landsat imagery in the study area. GVI, Green Vegetation Index.
| Date | Type | NDVI ID | GVI ID | |
|---|---|---|---|---|
| 1 | 15 June 1987 | Landsat 5 TM | / | / |
| 2 | 20 February 2015 | Landsat 8 OLI | N1 | G1 |
| 3 | 5 March 2014 | Landsat 8 OLI | N2 | G2 |
| 4 | 6 April 2014 | Landsat 8 OLI | N3 | G3 |
| 5 | 11 May 2015 | Landsat 8 OLI | N4 | G4 |
| 6 | 12 June 2015 | Landsat 8 OLI | N5 | G5 |
| 7 | 8 July 2013 | Landsat 8 OLI | N6 | G6 |
| 8 | 31 August 2015 | Landsat 8 OLI | N7 | G7 |
| 9 | 29 September 2014 | Landsat 8 OLI | N8 | G8 |
| 10 | 31 October 2014 | Landsat 8 OLI | N9 | G9 |
Table 2.
Confusion matrix of forest classification.
| Larch | Mongolian Pine | White Birch | Non-Forest | Samples | User’s (%) | |
|---|---|---|---|---|---|---|
| larch | 24 | 1 | 6 | 4 | 35 | 68.57 |
| Mongolian pine | 5 | 16 | 1 | 0 | 22 | 72.73 |
| white birch | 4 | 0 | 24 | 0 | 28 | 85.71 |
| non-forest | 0 | 0 | 1 | 73 | 74 | 98.65 |
| Samples | 33 | 17 | 32 | 77 | 159 | |
| Producers (%) | 72.73 | 94.12 | 75.00 | 94.81 | ||
| Overall Accuracy: 86.16% | ||||||
| Kappa Coefficient: 0.80 | ||||||
Table 3.
The NBR ranks and the grouped fire intensities.
| NBR | Area % | Fire Intensity | |
|---|---|---|---|
| 1 | <−300 | 13.97 | High |
| 2 | [−300, −200] | 8.85 | Medium |
| 3 | [−200, −100] | 4.68 | Medium |
| 4 | [−100, 0] | 3.16 | Medium |
| 5 | [0, 100] | 2.38 | Medium |
| 6 | [100, 200] | 2.25 | Low |
| 7 | [200, 300] | 2.44 | Low |
| 8 | [300, 400] | 3.63 | Low |
| 9 | [400, 500] | 5.30 | Low |
| 10 | >500 | 53.15% | Unburned |
© 2017 by the authors. Licensee MDPI, Basel, Switzerland. This article is an open access article distributed under the terms and conditions of the Creative Commons Attribution (CC BY) license (http://creativecommons.org/licenses/by/4.0/).
Share and Cite
MDPI and ACS Style
Wang, J.; Wang, C.; Zang, S. Assessing Re-Composition of Xing’an Larch in Boreal Forests after the 1987 Fire, Northeast China. Remote Sens. 2017, 9, 504. https://doi.org/10.3390/rs9050504
AMA Style
Wang J, Wang C, Zang S. Assessing Re-Composition of Xing’an Larch in Boreal Forests after the 1987 Fire, Northeast China. Remote Sensing. 2017; 9(5):504. https://doi.org/10.3390/rs9050504
Chicago/Turabian StyleWang, Junjie, Cuizhen Wang, and Shuying Zang. 2017. "Assessing Re-Composition of Xing’an Larch in Boreal Forests after the 1987 Fire, Northeast China" Remote Sensing 9, no. 5: 504. https://doi.org/10.3390/rs9050504
Note that from the first issue of 2016, this journal uses article numbers instead of page numbers. See further details here.