Article

Archaeological Application of Airborne LiDAR with Object-Based Vegetation Classification and Visualization Techniques at the Lowland Maya Site of Ceibal, Guatemala

1
School of Anthropology, University of Arizona, Tucson, AZ 85721-0030, USA
2
Ceibal-Petexbatun Archaeological Project, Guatemala City 01005, Guatemala
3
Escuela de Historia, Universidad de San Carlos, Guatemala City 01012, Guatemala
4
Graduate School of Science Biology and Geosciences, Osaka City University, Osaka 558-8585, Japan
5
Faculty of Biosphere-Geosphere Science, Okayama University of Science, Okayama 700-0005, Japan
6
NSF National Center for Airborne Laser Mapping (NCALM), University of Houston, Houston, TX 77204-5059, USA
7
Faculty of Humanities, Ibaraki University, Mito 310-8512, Japan
8
Graduate School of Education, Naruto University of Education, Naruto 772-8502, Japan
*
Author to whom correspondence should be addressed.
Remote Sens. 2017, 9(6), 563; https://doi.org/10.3390/rs9060563
Submission received: 8 March 2017 / Revised: 16 May 2017 / Accepted: 31 May 2017 / Published: 5 June 2017

Abstract

:
The successful analysis of LiDAR data for archaeological research requires an evaluation of effects of different vegetation types and the use of adequate visualization techniques for the identification of archaeological features. The Ceibal-Petexbatun Archaeological Project conducted a LiDAR survey of an area of 20 × 20 km around the Maya site of Ceibal, Guatemala, which comprises diverse vegetation classes, including rainforest, secondary vegetation, agricultural fields, and pastures. We developed a classification of vegetation through object-based image analysis (OBIA), primarily using LiDAR-derived datasets, and evaluated various visualization techniques of LiDAR data. We then compared probable archaeological features identified in the LiDAR data with the archaeological map produced by Harvard University in the 1960s and conducted ground-truthing in sample areas. This study demonstrates the effectiveness of the OBIA approach to vegetation classification in archaeological applications, and suggests that the Red Relief Image Map (RRIM) aids the efficient identification of subtle archaeological features. LiDAR functioned reasonably well for the thick rainforest in this high precipitation region, but the densest parts of foliage appear to create patches with no or few ground points, which make the identification of small structures problematic.

Graphical Abstract

1. Introduction

Since the groundbreaking work at Caracol, Belize [1], the application of airborne LiDAR (Light Detection and Ranging) has been making revolutionary effects in archaeological investigations in the Maya lowlands [2,3,4,5,6], the Mexican Pacific Coast [7,8], and other tropical regions [9,10]. With its ability to penetrate the canopy, LiDAR allows archaeologists to rapidly map archaeological features with topographic signatures in areas where dense vegetation makes extensive ground surveys difficult. Nonetheless, it is still important to evaluate the effectiveness of LiDAR for different vegetation types and geological settings, and to improve techniques for the detection of archaeological remains. This paper aims to contribute to the LiDAR-based study of archaeological features by refining the process of LiDAR data evaluation.
Important issues in this regard are vegetation classification [11,12,13,14,15] and the visualization of LiDAR data [16,17]. As to the first issue, types of land cover affect the rate of laser pulses reaching the ground and thus the detection of archaeological features. The effectiveness of LiDAR for archaeological studies needs to be evaluated separately for different vegetation classes, making vegetation classification an indispensable step of analysis. As we developed a classification of vegetation in our study region, we combined vegetation characteristics that likely affected LiDAR data significantly, such as canopy density and height. For this purpose, we applied the method of object-based image analysis (OBIA), which offered a more effective approach to the assessment of LiDAR data than the traditional pixel-based classification or the use of vegetation height alone. With regard to the second issue, visualization techniques of ground reliefs considerably affect the efficiency and effectiveness of detection and interpretation of archaeological features. Many archaeologists and their collaborators have dedicated their effort to developing visualization methods rather than automated or semi-automated detections of features [18,19,20,21,22,23]. This is partly because archaeological remains may take diverse forms and sizes, making automated detections of all types challenging. Archaeological features may include stone monuments, residential buildings of small horizontal dimensions, extensive but low platforms, tall pyramids, as well as negative relief features, such as storage pits, quarries, and reservoirs. They may also consist of large-scale landscape modifications, such as agricultural terraces, dams, canals, roads, and defensive walls. More importantly, visualization techniques aid not only the detection of features but also many subsequent stages of archaeological analysis. Variations in the shapes and sizes of archaeological features studied through visualization methods reflect the history of occupation, the cultural backgrounds of builders, and differences in economic and political status. While we recognize the importance of developing automated detection methods for specific types of archaeological features, in this paper we focus on visualization techniques as an approach with broader effects. We evaluated different visualization methods and found the Red Relief Image Map (RRIM) technique particularly effective in various respects.
The basis of this study was a LiDAR survey conducted over an area of approximately 20 × 20 km2 around the Maya site of Ceibal, Guatemala, during the 2015 field season of the Ceibal-Petexbatun Archaeological Project (CPAP) (Figure 1). Ceibal is the largest center in the Pasión region of the southwestern Maya lowlands, and its main occupation spans from 1000 BC to AD 900 or 950. Including the zones along the edges without an overlap of flight strips, the LiDAR data covered an area of 460 km2. This area receives a larger amount of precipitation (roughly 1800 mm annually) and its rainforest tends to be higher and denser than in the central and northern Maya lowlands [24]. The forest around Ceibal is protected as a national park, along with the Rosario Park in the same region, although some parts suffered illegal deforestation by squatters in recent years. Vegetation in most areas outside these parks has been substantially modified for agriculture, cattle ranches, and oil palm plantations. Diverse vegetation types in this region present a challenge to the application of LiDAR data for archaeological studies.
Prior to the CPAP, Harvard University carried out archaeological investigations at Ceibal from 1964 to 1968. As part of this research, Ian Graham mapped the area of 1.9 km2 in the Ceibal center [25], and Gair Tourtellot [26] surveyed an additional area of roughly 6 km2 in its surroundings along transects. The rest of the LiDAR-surveyed area had not been systematically studied except for some excavations at the satellite sites of Anonal and Caobal [26,27]. We initiated the CPAP in 2005, focusing on intensive excavations in the central part of Ceibal [28,29].

2. Materials and Methods

Our study followed the following steps: (1) the acquisition of LiDAR data in 2015; (2) the evaluation of visualization techniques of LiDAR data; (3) the identification of archaeological features in LiDAR data; (4) the ground verification of archaeological features in 2016 in sample areas with different vegetation types based on the preliminary vegetation classification; (5) a vegetation survey conducted simultaneously with the archaeological survey; and (6) the development of a refined vegetation classification with OBIA incorporating the results of the vegetation survey. After these analyses, we combined the all results to evaluate the effectiveness of LiDAR data for the study of archaeological features covered by different vegetation types (discussed in Section 3. Results).

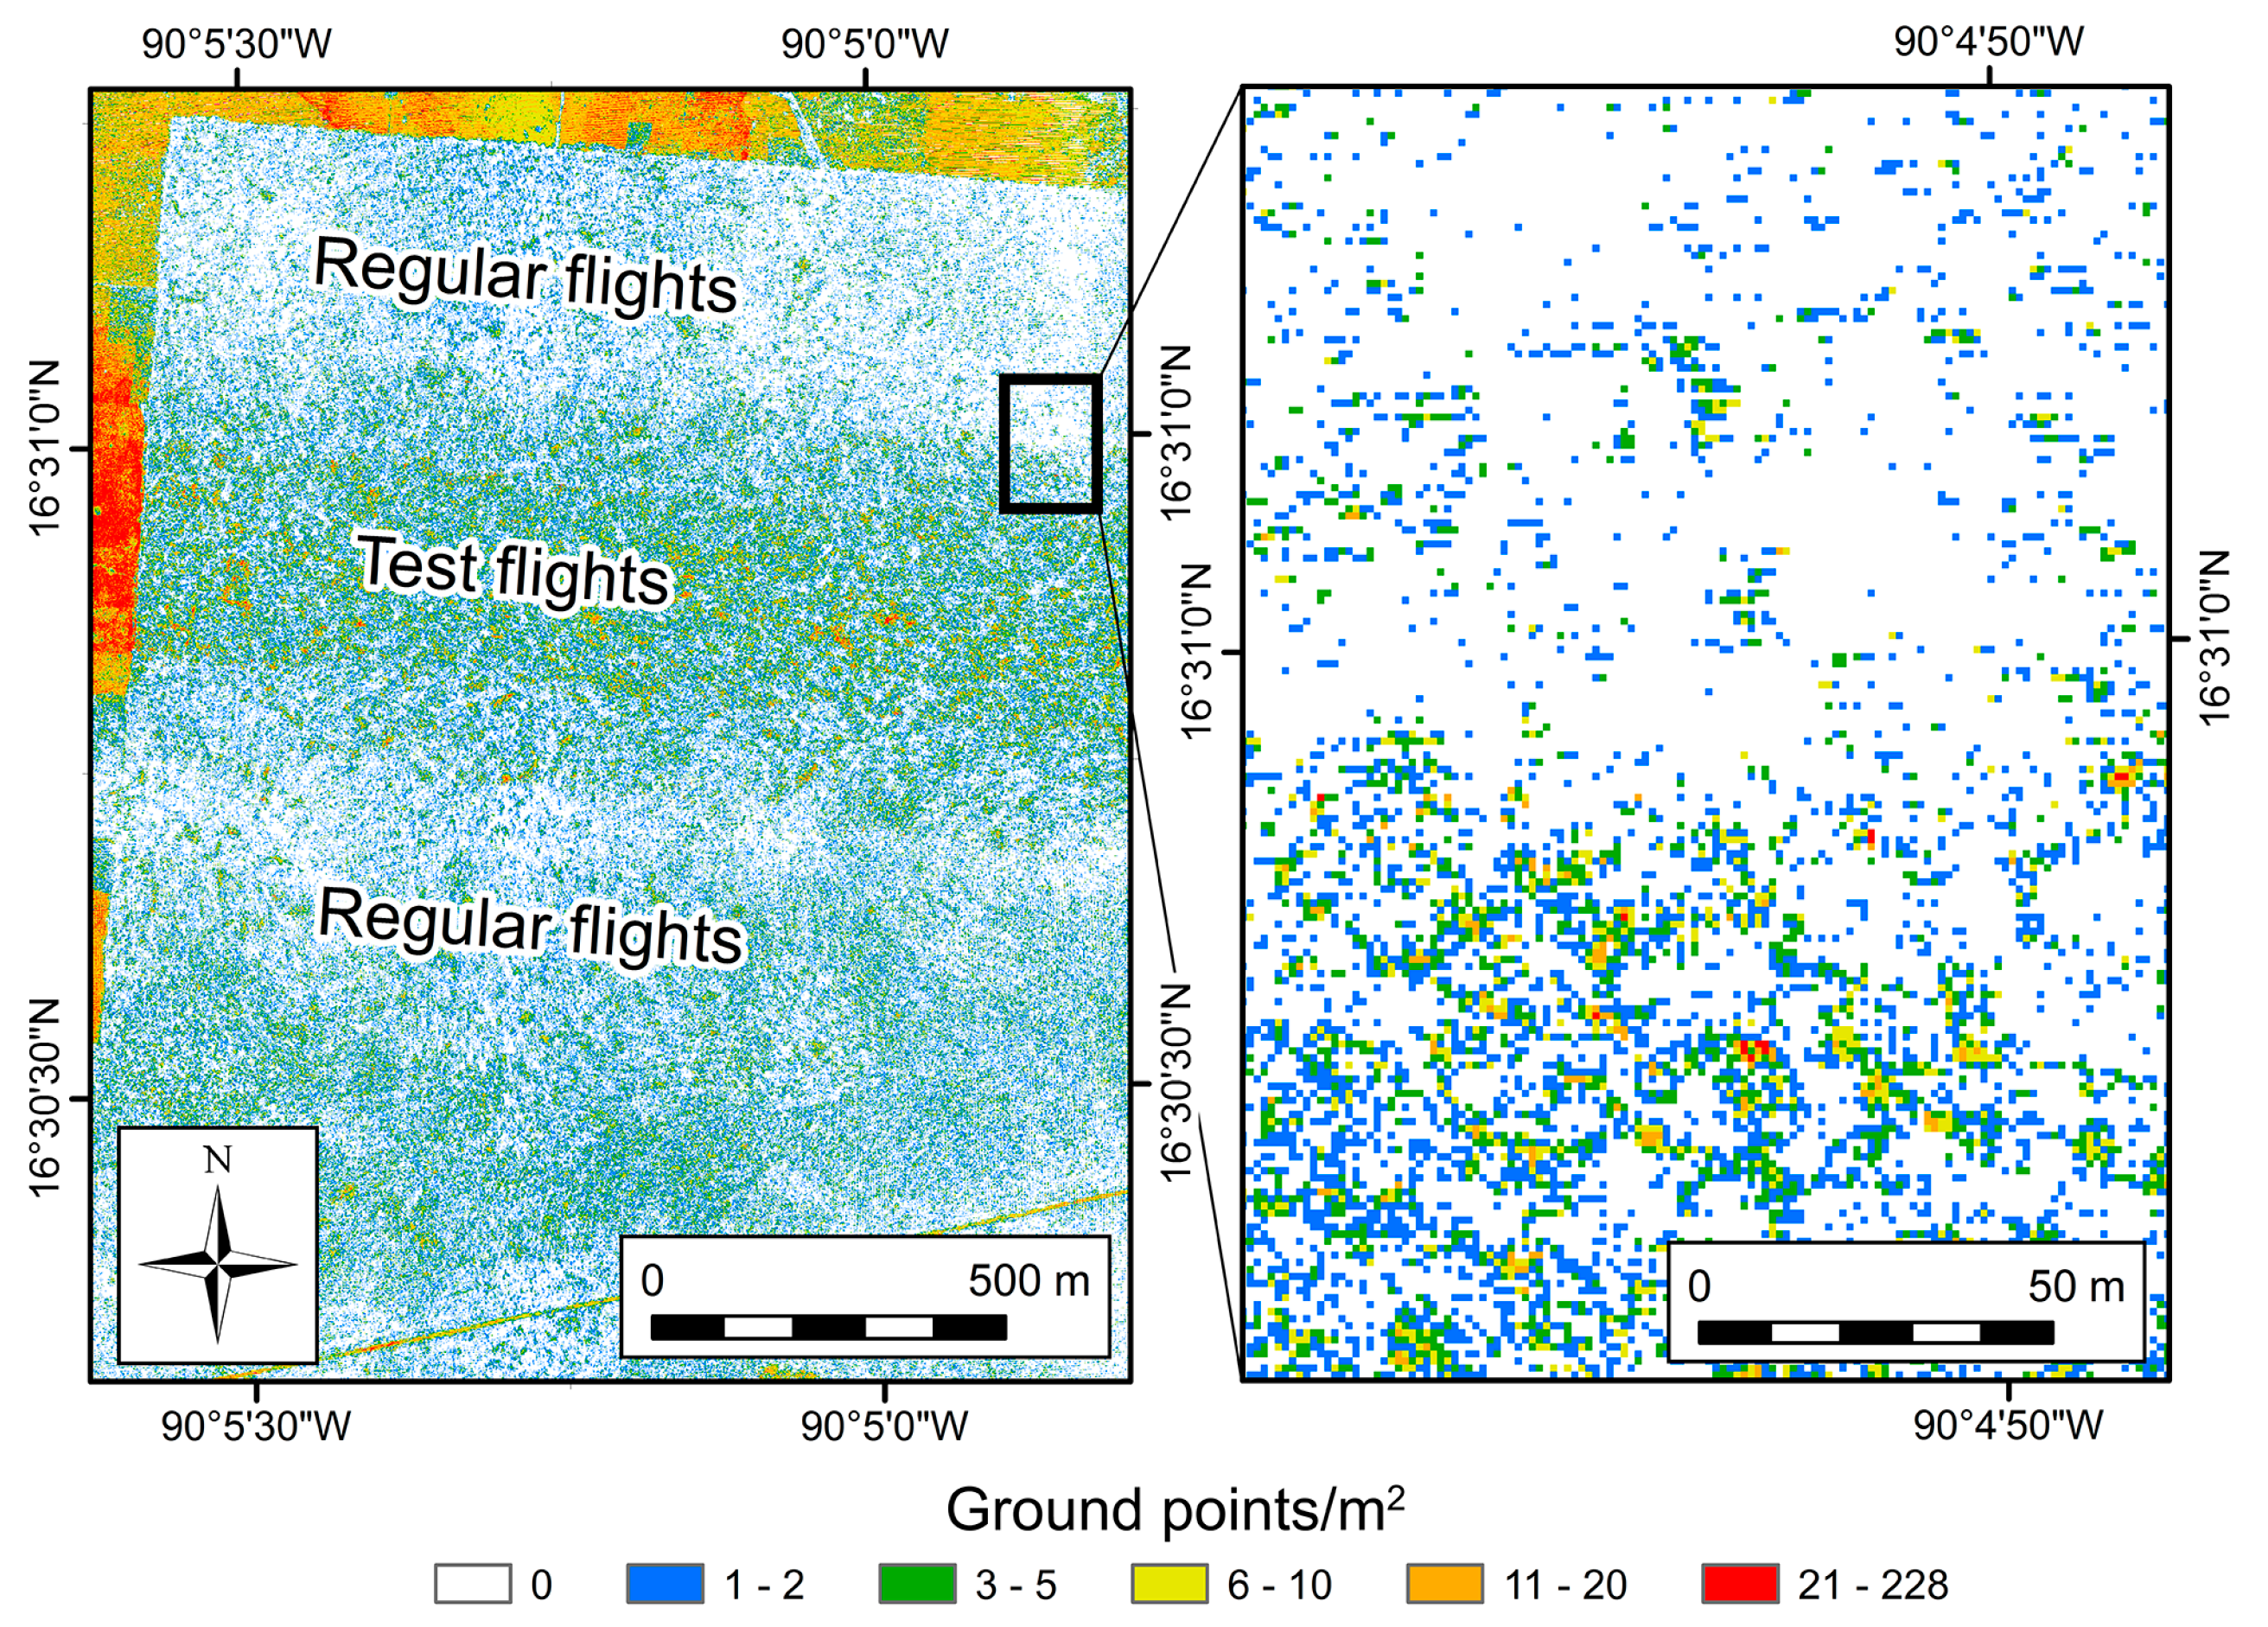
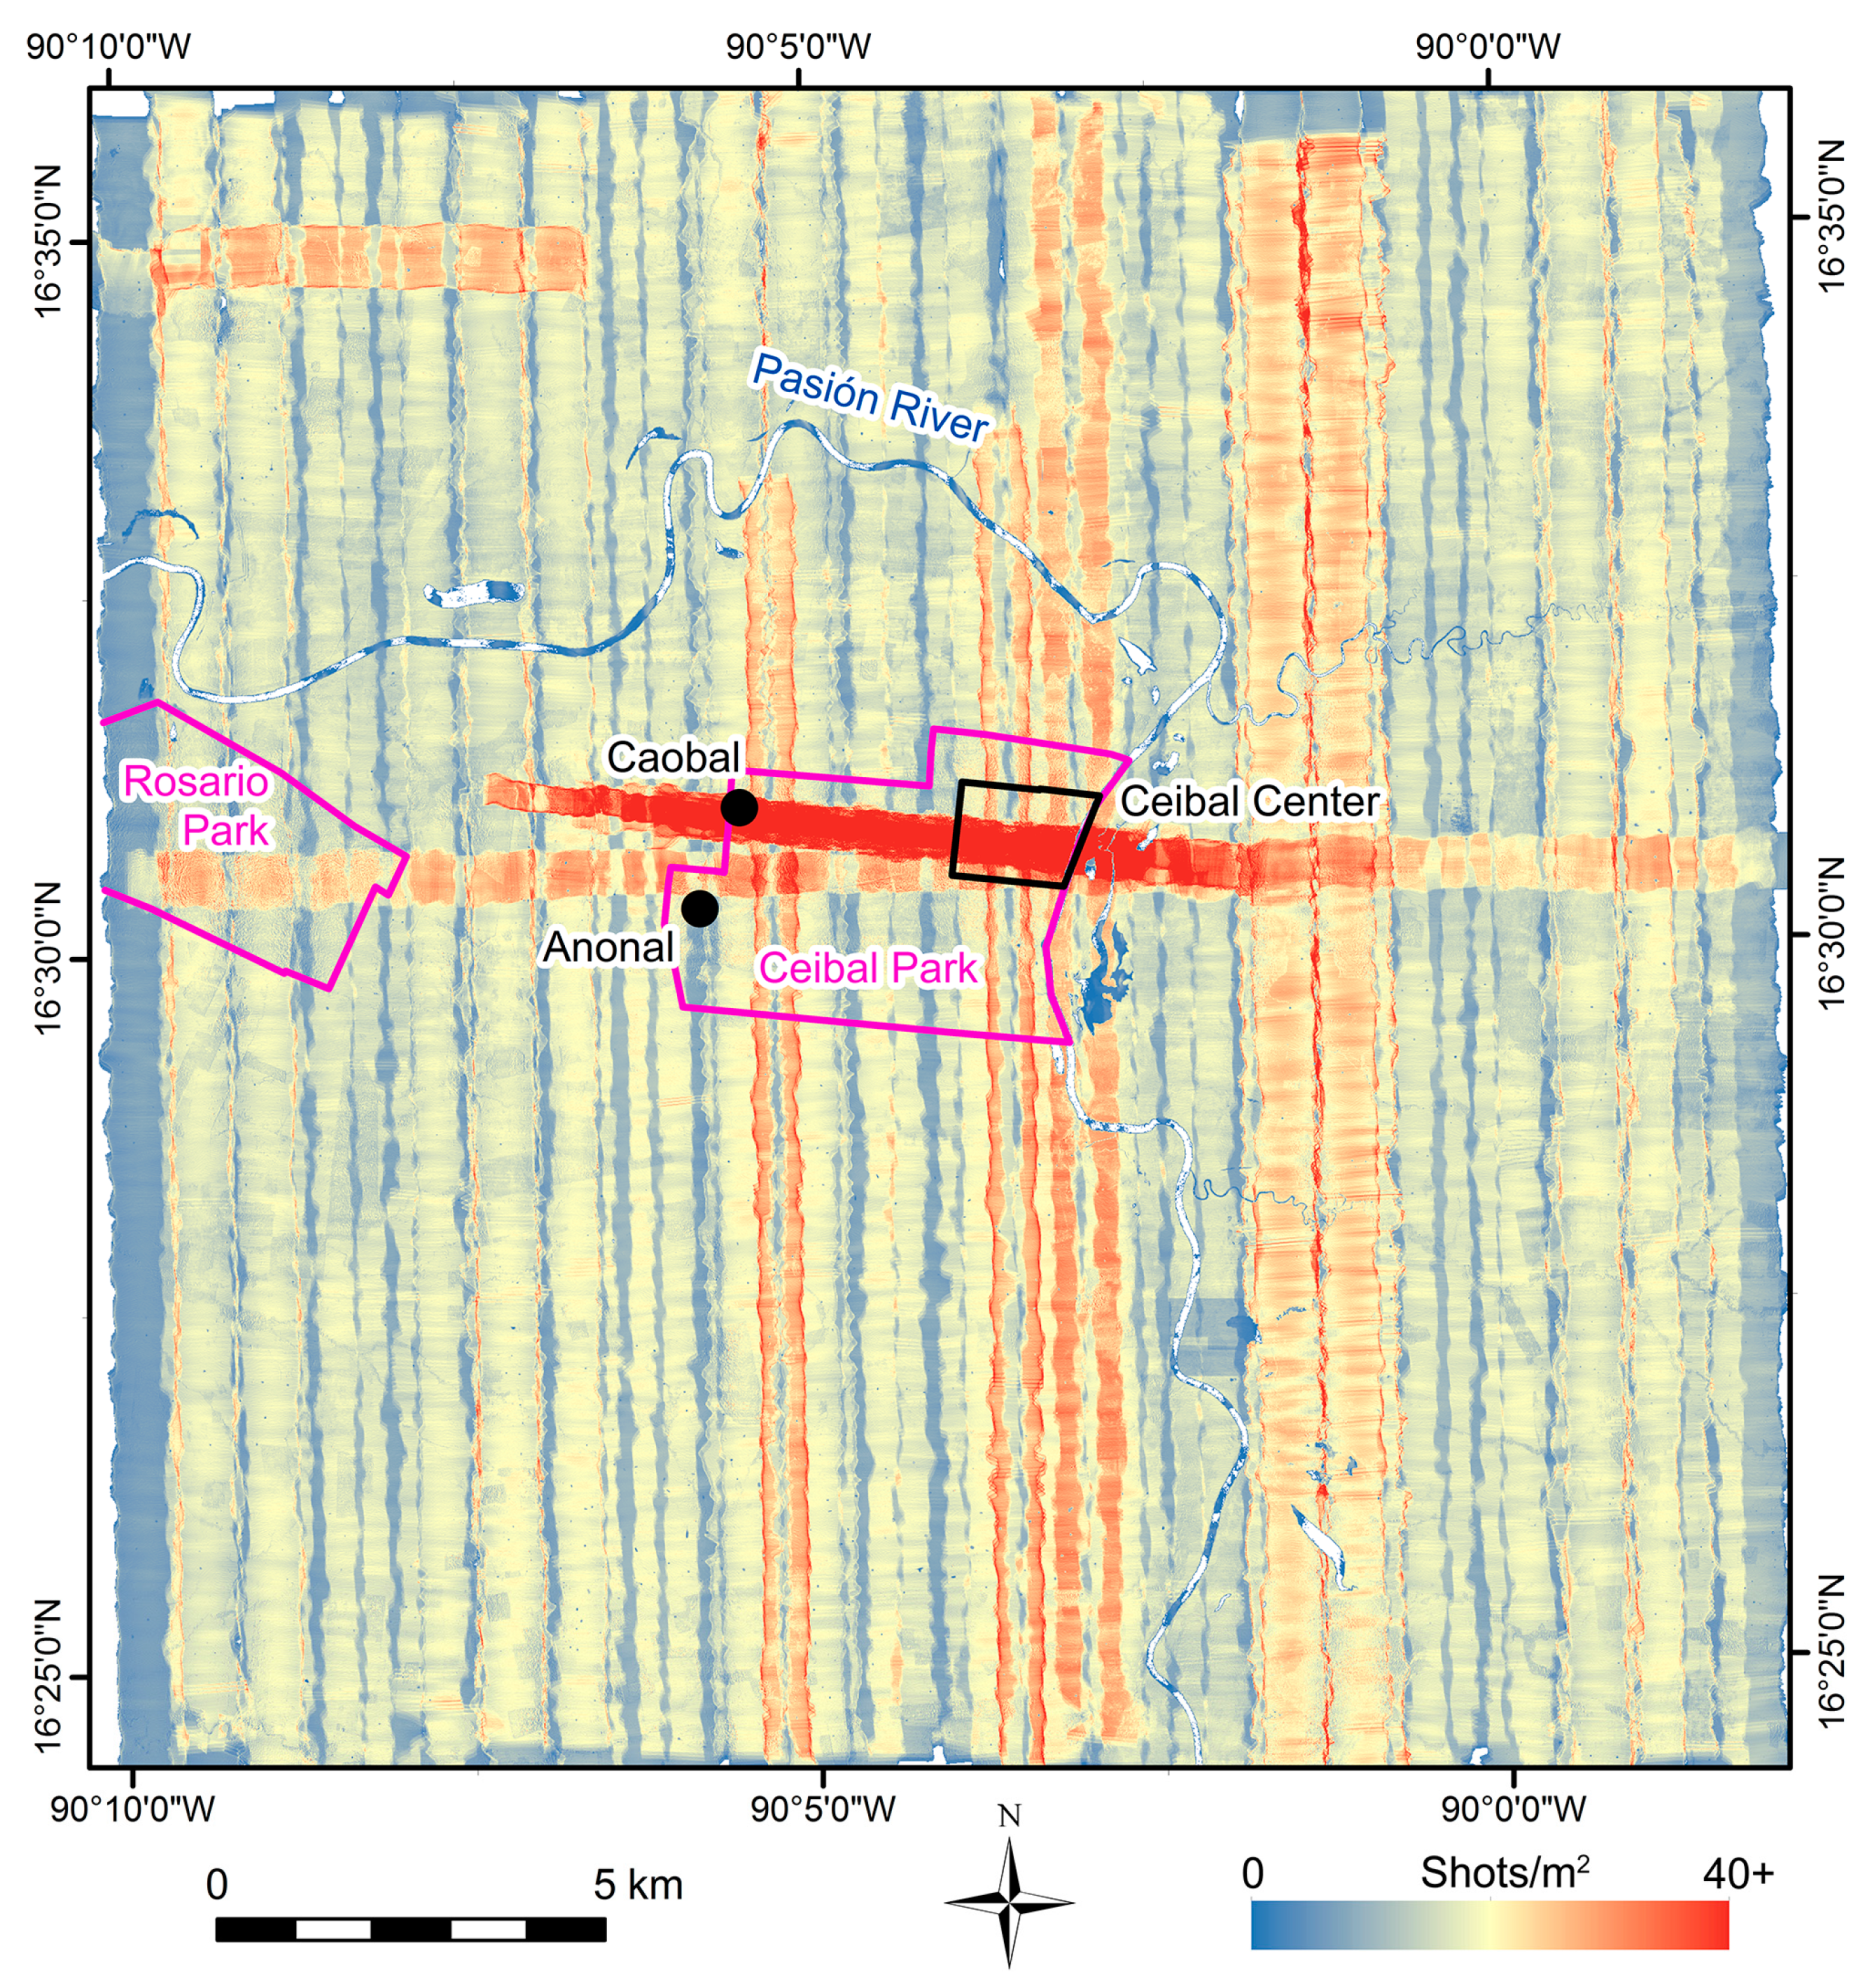
2.1. LiDAR Data Acquisition

LiDAR data were obtained in 18–23 March 2015, by the crew of the National Center for Airborne Laser Mapping (NCALM) of the University of Houston, under the direction of Ramesh L. Shrestha and the research coordination by Juan Carlos Fernandez-Diaz. Abhinav Singhania of the NCALM processed the LiDAR data and produced a digital surface model (DSM, model including vegetation and buildings) and a digital elevation model (DEM, bare earth model after the removal of vegetation and buildings) at a horizontal resolution of 0.5 m. The NCALM crew used Teledyne Optech Titan MW, a new multichannel and multispectral LiDAR that they acquired in 2014. Titan emits laser pulses in the 1550 (Channel 1), 1064 (Channel 2), and 532 (Channel 3) nm wavelengths simultaneously through a single oscillating mirror. This multispectral LiDAR contrasts with Teledyne Optech Gemini with a single laser channel of a 1064 nm wavelength, which the NCALM used in their previous campaigns in the Maya area and the nearby regions. With its three channels, Titan is capable of operating at higher pulse repetition frequencies (PRF) than Gemini, which means that it can emit a larger number of laser pulses per unit time. More importantly, the energy per pulse of laser pulses that Titan emits does not decrease significantly as the PRF increases. With Gemini, the energy per pulse weakens when it operates at a higher PRF, which makes the canopy penetration of each pulse more difficult. In other words, Titan can maintain high rates of canopy penetration per pulse when a higher PRF is used [30,31].
In the Ceibal region, the NCALM crew collected most data from a flying altitude of 700 m above the ground level (AGL) and at a PRF of 150 kHz per channel, that is, a total PRF of 450 kHz, but they also used a PRF of 250 kHz per channel or a total PRF of 750 kHz for some flight lines. All of the flight lines were collected with scan parameters of ±30° of scan angle and 20 Hz for the mirror scan frequency. In addition, the team conducted canopy penetration tests over the central part of Ceibal, where the forest was relatively undisturbed. These test flights involved the following settings: 700 m AGL and 100 kHz PRF per channel; 600 m AGL and 150 kHz per channel; and 400 m AGL and 150 kHz per channel [31]. Whereas the regular data acquisition flights followed the north-south lines, the canopy penetration tests involved flight lines in roughly east-west directions (Figure 2). In the area for the canopy penetration test flights, 51 to 72 laser shots per m2 were emitted, whereas regular mapping flight lines produced 15 to 19 shots per m2.
As discussed in [30], the capability of an analyst to detect and identify subtle cultural features on a LiDAR dataset is a function of LiDAR sample density. In the case of areas covered by vegetation, successful detection is directly related to the effective ground sample density, which depends on the vegetation type (height and density) and on the ability of the LiDAR system to penetrate through the canopy [31]. The objective of maximizing canopy penetration is highly dependent on sensor configuration and flying parameters [30]. Achieving optimum penetration requires a balancing act between maximizing the number of laser shots per square meter (shot density proportional to the system PRF and inversely proportional to flying height) while ensuring that the energy of the laser pulse is high enough for the two-way trip through the canopy (dependent on laser source characteristics and directly proportional to the flying height). The configuration for the nominal mapping consisting of the flying height of 700 m AGL and sensor PRF of 3 × 150 kHz were selected to optimize the shot density and canopy penetration characteristics based on the canopy penetration test performed over the core of Ceibal.
While accuracy assessment measurements were not conducted for this particular project within the mapping area, results of extensive vertical accuracy testing for the point cloud products obtained with the Titan sensor around the time of the Ceibal collection and under a variety of circumstances are reported in Section 3.5 of [31]. The reported results indicate that the vertical component of precision is better than 2 cm and height accuracy values are better than 10 cm, generally in the range of 2.5 to 6.5 cm. It is a well-known fact that the horizontal accuracy of LiDAR point cloud data is much harder to assess and is not as good as the vertical accuracy with typical values in the range of 15–30 cm [30]. An experiment to assess the horizontal accuracy of Titan LiDAR point cloud data is reported in [32], with results indicating a horizontal accuracy of 3.2 cm under very close to ideal conditions (low flying heights and low aircraft dynamics). However, authors warn that under less ideal conditions horizontal accuracies can be significantly degraded.
The LiDAR data obtained in the canopy test flights were included in the production of the final LAS dataset (a standard format for discrete return LiDAR point cloud data) [33], the DSM, and the DEM delivered to the CPAP. Inomata then analyzed the DEM and point cloud data, using ESRI ArcGIS, Trimble eCognition, and GeoCue LP360 for vegetation classification and the identification of archaeological features.

2.2. Visualization Techniques

The visualization of topographic data is a critical step in the analysis of LiDAR, and researchers have developed various techniques [18,19,20,21,22,23]. Scholars agree that there is no single method that promises the best results for all cases, and we need to consider the advantages and disadvantages of each technique to devise a strategy suited for specific objectives, the morphology of features of interests, and the local topography and vegetation. Hillshaded images or combinations of hillshades and DEMs represent the approach most commonly used by archaeologists. Because hillshades aim to reproduce the effects of shadows and illumination as incident light from a specific direction interact with the terrain, they produce different images for different directions of light. Thus, to gain a better understanding of reliefs, researchers need to compare multiple hillshade images with different light directions. To mitigate this problem, scholars have proposed the principal component analysis of hillshades (PCA), generally combining images with 16 light directions of different azimuths [12,19,20,23]. Another common method is slope gradient, which visualizes the steepness of slope [34,35]. In flat areas, such as northern Yucatan, color-classified DEMs may work well [11,19], but its archaeological utility is more limited in areas with undulating topography.
As a method for the specific purpose of identifying reservoirs, Adrian Chase [36] used a map showing differences in elevation between neighboring cells. To produce this image, he used a moving window of an annulus, which calculated the difference in elevation between a given cell and the mean of the surrounding cells in the annulus. The Topographic Position Index (TPI) applied by Ebert et al. [14] represents a similar concept. Some researchers find Sky-View Factor analysis (SVF) particularly useful for the identification of archaeological remains [17,23]. SVF represents the amount of the sky visible from a particular location [37,38].
The method that we found most effective was Red Relief Image Map (RRIM) developed by Chiba et al. [39,40]. RRIM uses the measurements of topographic “openness”, originally developed by Yokoyama et al. [41] and combines them with slope gradient. Positive openness is a concept somewhat similar to SVF and is measured as the mean of zenith angles of tangent lines to the above-ground surface within a specified radius from a given point, whereas negative openness concerns nadir angles of tangent lines to the under-ground surface. For each cell, RRIM expresses the slope steepness as the intensity of red and the difference between the positive openness and the negative openness as brightness. In addition, RRIM incorporates an image in which positive and negative openness values are expressed by specific hues, ranging from yellow for high positive openness to green for high negative openness. In final products of RRIM, high, convex points, such as hilltops and mound summits, show bright whitish yellow, whereas low, concave points, such as bottoms of valleys and depressions, appear in dark green. Steep slopes exhibit intense red, and flat areas near white to grayish colors. In this manner, RRIM effectively visualizes small-scale natural and cultural features, as well as large-scale topographic reliefs.
For this study, we produced images with hillshades, PCA, slope gradient, and moving window elevation difference, using the 0.5 m resolution DEM with ArcGIS. The SVF analysis of the DEM was conducted with free software, Relief Visualization Toolbox [42]. RRIM was produced from the DEM by Asia Air Survey, Japan.

2.3. Archaeological Feature Detection in LiDAR Data

We identified and recorded probable archaeological features primarily by visual inspection of the RRIM visualization. Other LiDAR data visualizations (particularly, hillshades with varying light angles), elevation profiles, and point cloud profiles were also examined when necessary. Archaeological features included structures (individual roofed buildings), platforms (constructions with an ample summit, which potentially could support multiple structures), walls (elongated buildings without roofs), terraces (leveled areas for agricultural fields or the construction of structures), and depressions (including human-made features and natural ones that may have been utilized by humans). These features were manually plotted with ArcGIS. For the purpose of evaluating the effectiveness of LiDAR data for archaeological feature detection under different vegetation types, this paper focuses on the two most common classes, i.e., structures and platforms. A broader range of archaeological data will be published elsewhere.
Within the 460 km2 area covered by LiDAR, we registered 10,208 structures, 4538 possible structures, 724 platforms, and 253 possible platforms. When features appeared likely to be archaeological remains, we classified them into the categories of “structure” or “platform”. When we were uncertain whether they were archaeological features or those of natural or modern origins, we recorded them as “possible structures” or “possible platforms”.

2.4. Field Verification of Archaeological Features

We conducted a preliminary vegetation classification prior to the 2016 field season by applying pixel-based classification to the LiDAR data. We designed a strategy for the ground-truthing of archaeological features, considering this vegetation classification. We verified possible archaeological features identified in the LiDAR through two strategies. One was a comparison with the archaeological map of the Ceibal center produced by the Harvard Project. This allowed us to assess the LiDAR data in totally-surveyed areas under forested conditions. As discussed in Section 3.3, there were a small number of discrepancies between those identified in LiDAR and those recorded in the Harvard map. Instead of re-visiting these features within the area of the Harvard map, we decided to focus our effort during the 2016 season on the second strategy, that is, a pedestrian survey in previously unstudied peripheral zones. This decision was because our goal of the field season was not only to verify LiDAR data but also to obtain archaeological information on previously unknown sites through the observation of construction methods, surface collection, and test excavations.
The ground survey was carried out from 7 February to 9 March 2016. Potential areas for the pedestrian survey were chosen from different vegetation areas within the peripheral zones. We also selected probable ceremonial buildings of the Middle Preclassic period (1000–350 BC) as important targets. Nonetheless, areas outside the Ceibal and Rosario Parks were privately owned, and it was often difficult to obtain permission from the landowners. In addition, some of the landowners were suspected of involvement in drug trafficking, and we avoided those areas. These restrictions strongly affected the distribution of survey zones. When the survey crew reached a target site, they usually focused on features identified in the LiDAR data to verify whether they were indeed archaeological remains, to record their construction materials, and to collect artifacts found on the surface. They also walked over the immediate surroundings of these targets to examine whether there are any buildings that were missed in the LiDAR data and to inspect other possible features, such as terraces, depressions, and walls. In three cases, they systematically covered areas of pasture measuring 100 × 200 m2 to 130 × 400 m2 by walking at regular intervals. In most other cases, they walked unsystematically around detected features, in order to concentrate more on the recording of construction materials and surface collection.
The survey crew recorded the locations of verified features with Garmin GPSMAP 64 GPS devices, which generally had horizontal accuracies of 3 to 15 m in areas with no or sparse canopy cover. In most cases, they could compare the GPS measurements with RRIM images loaded on the devices and could manually correct measurement errors as long as they could use archaeological features visible in LiDAR data as references. In total, the crew ground-truthed 981 features that had been recorded as structures or possible structures in the examination of LiDAR data.

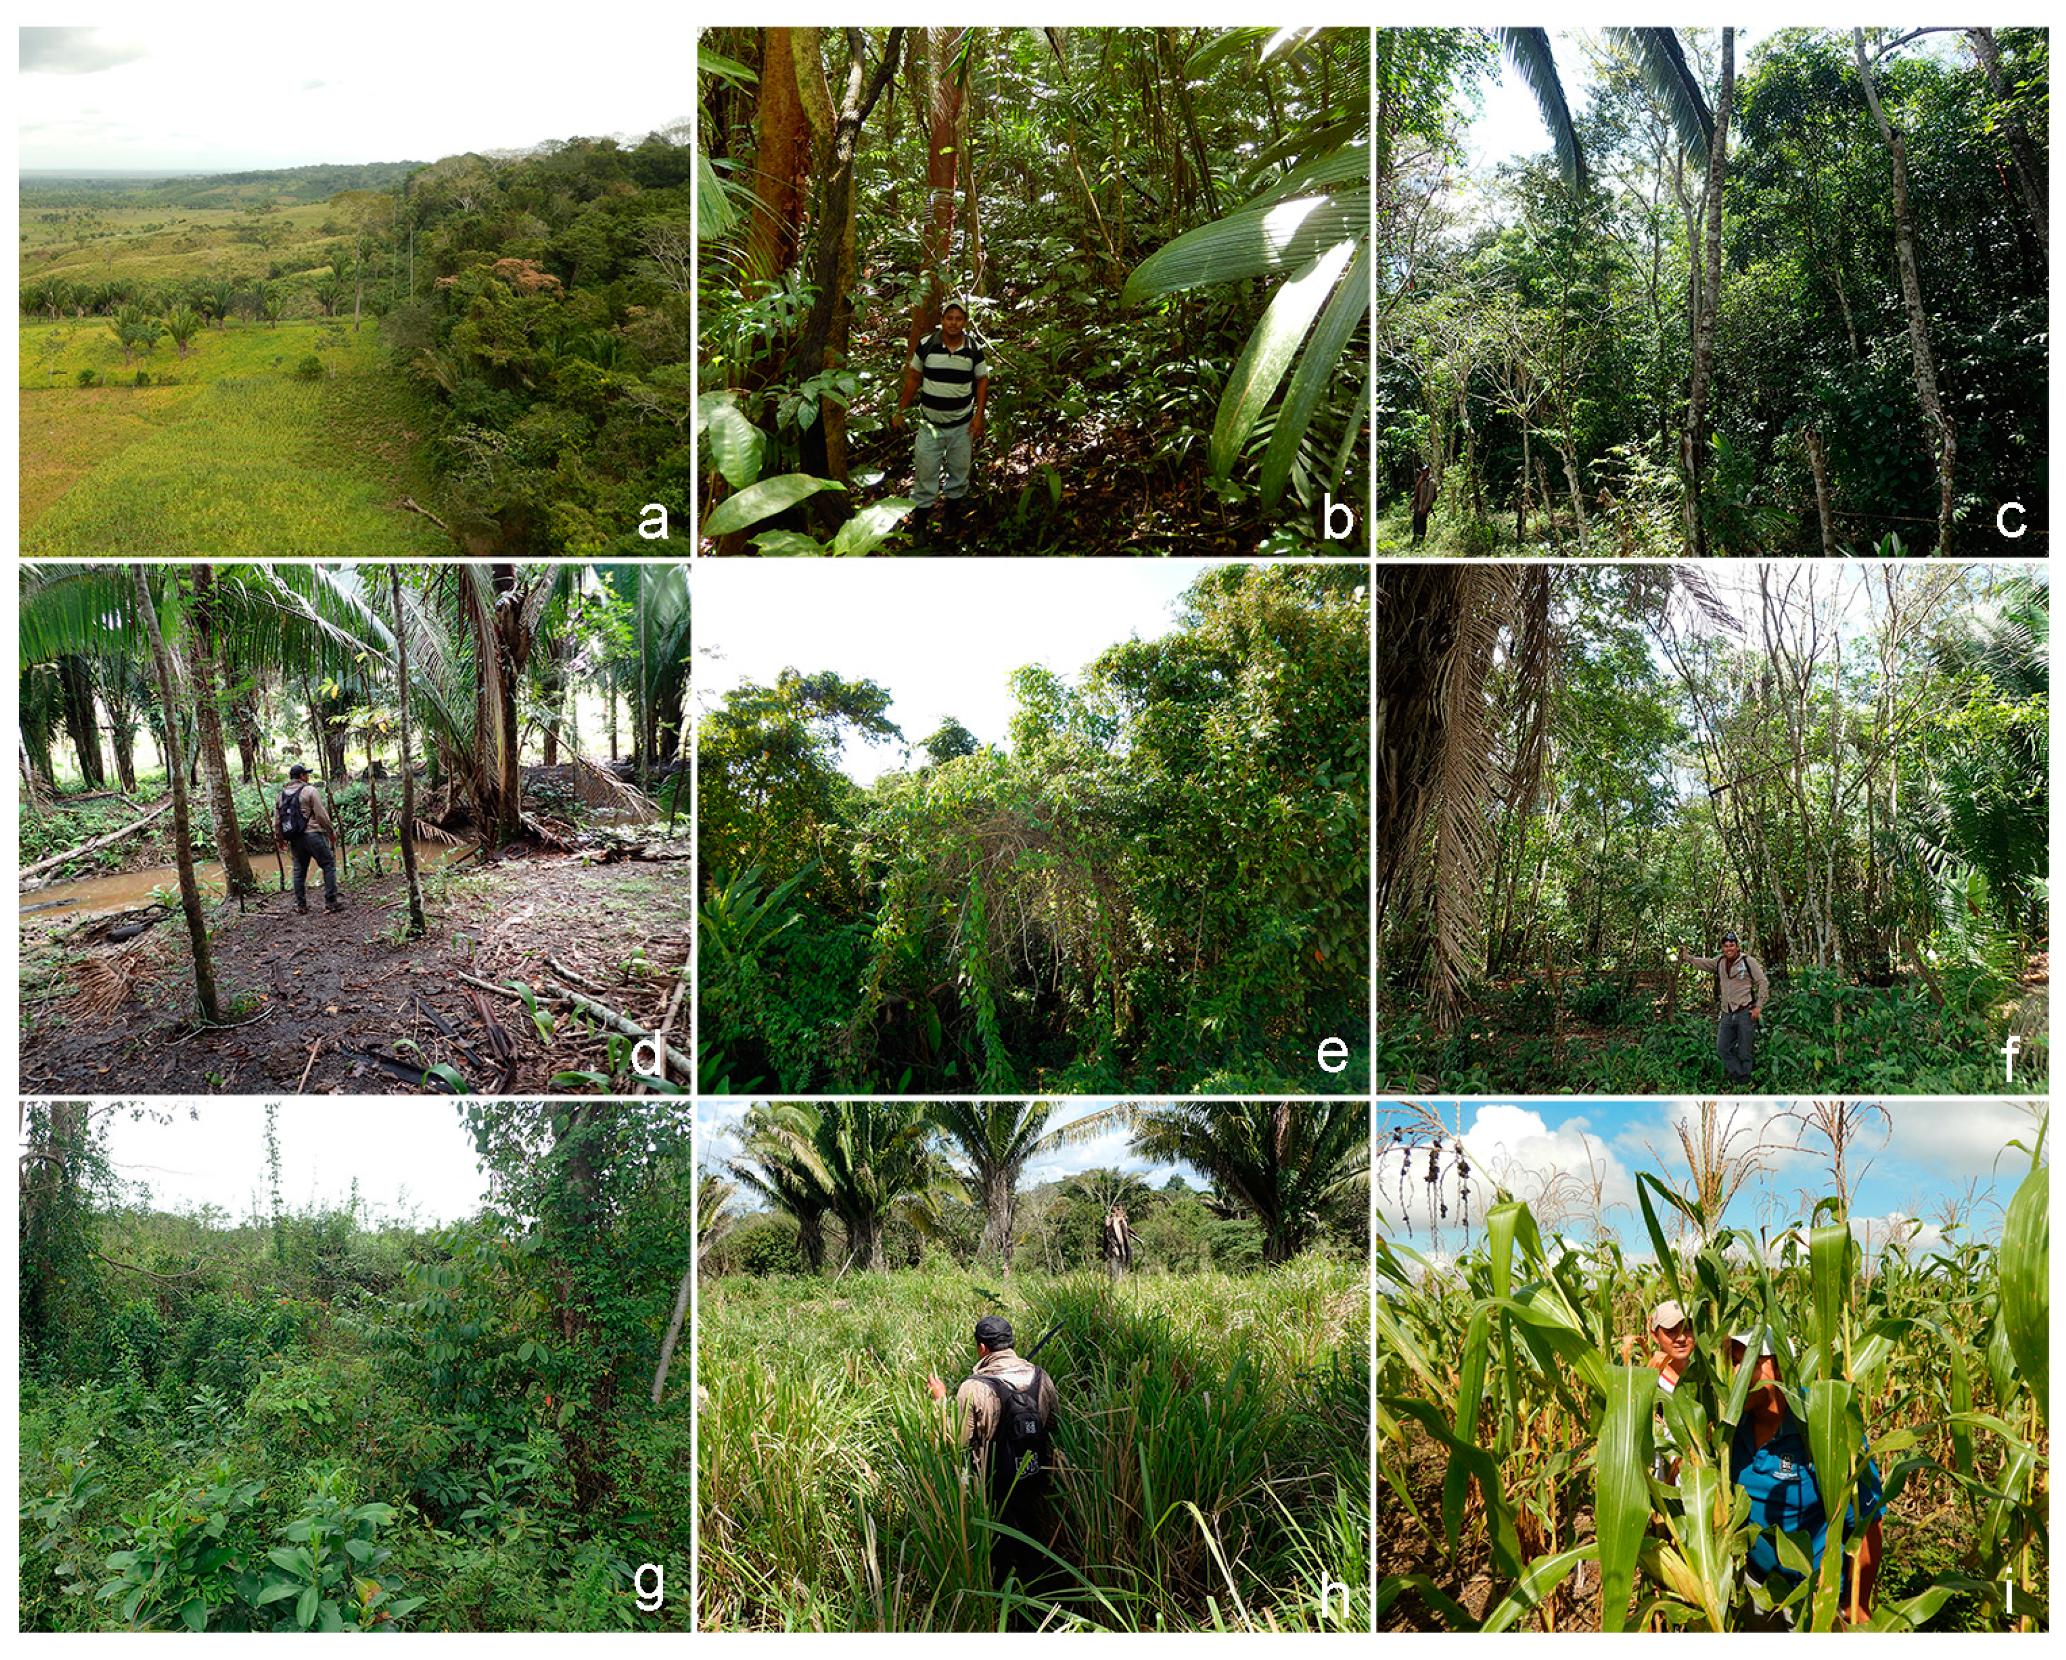
2.5. Vegetation Survey

During the field season, the field crew also conducted a vegetation survey. Instead of developing a specific design for a vegetation survey, the survey team collected vegetation data as they conducted archaeological investigations. They recorded the vegetation around the archaeological sites that they visited and, in some cases, along the ways to archaeological sites. For secondary vegetation, the survey team recorded its age after the last clearing as reported by the landowner or as estimated by our local workers. In total, the survey recorded the vegetation data of 199 reference areas (24 rainforest, 12 high secondary vegetation, 32 medium high secondary vegetation, 11 low secondary vegetation, 19 high grass, 79 low grass, 11 agricultural fields, 2 palm plantations, 1 low wetland forest).

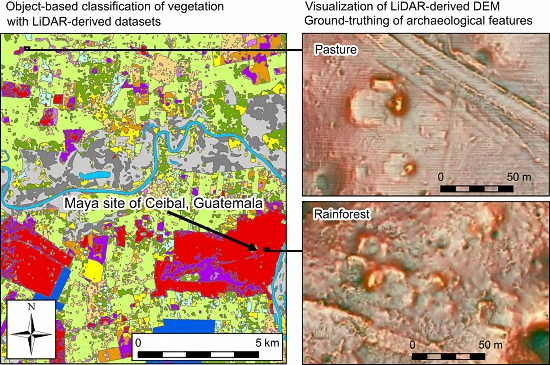
2.6. OBIA Vegetation Classification with LiDAR Data

The analysis of vegetation and biomass with LiDAR data is well-developed in forestry, biology, and ecology [43,44,45,46,47,48]. Nonetheless, our vegetation analysis was designed specifically for the purposes of evaluating vegetation’s effects on LiDAR data in the detection of archaeological features and thus differed from forestry- or ecology-oriented studies. In the process of our vegetation classification, we considered common vegetation types observed on the ground, such as secondary vegetation and pasture, but we did not aim at the best fit to biological or ecological classifications of vegetation. Instead, our primary goal was to classify land cover mainly by vegetation characteristics that affect LiDAR data most, that is, the density and height of vegetation.
After the pedestrian vegetation survey carried out with the archaeological investigation, we refined vegetation classification, using object-based image analysis (OBIA). We developed the OBIA classification of vegetation with eCognition software for an area of 441 km2, excluding edges of the LiDAR data (outside nominal survey polygon) where there is not sufficient swath overlap. In an OBIA approach, neighboring cells with similar values are segmented into objects of varying sizes, which are then used as units of classification. Researchers have traditionally used the pixel-based classification of remotely-sensed data [14], but the OBIA is gaining popularity in various disciplines recently as it is considered more accurate and versatile [49,50,51,52].
For the vegetation classification, we primarily used LiDAR-derived datasets, including Canopy Density Model (CDM), window averaged Canopy Height Model (CHM), window standard deviation of CHM (SD CHM), and Intensity Difference Model (IDM) (Figure 3 and Table 1). In addition, Uninhabited Aerial Vehicle Synthetic Aperture Radar data (UAVSAR, courtesy of NASA/JPL-Caltech, Bruce Chapman, PI) [53,54] were used as part of the OBIA for the delineation of water. Prior to this study, we have been examining other remotely-sensed data of the region. These datasets, besides UAVSAR, were not incorporated systematically in the OBIA but were occasionally consulted for the examination of vegetation types. These data include Airborne Synthetic Aperture Radar (AIRSAR, courtesy of NASA/JPL-Caltech, Bruce Chapman, PI) [55], IKONOS, Landsat 7 and 8, and aerial orthophotos produced by the Instituto Geográfico Nacional de Guatemala (IGN).
Among the indices used for OBIA, CDM, which represents the density of vegetation above ground and is also called Percentage Canopy hit Model (PCM), is most closely related to the effectiveness of LiDAR in the detection of ground-level features. CDM (Figure 3a) is given as a ratio of above-ground points to all points within a spatial unit of a chosen size. A resultant value of 1 indicates dense vegetation which no laser pulses penetrated, whereas a value of 0 or close to 0 means sparse vegetation or bare earth without vegetation. Although the density of ground points can be used for similar purposes [8], CDM provides normalized data better suited for further analysis. To calculate CDM, we used ArcMap’s point to raster tool to create a 4 m resolution raster that recorded the counts of above ground points and another with the counts of all points. We chose 4 m cell size to have statistically sufficient numbers of points. After replacing no-data cells with a value of 0, we divided the above ground point raster by the all point raster, using ArcMap’s raster calculator.
CHM, also called height above ground (HAG), approximates to vegetation height [8,11]. We calculated CHM (Figure 3b) by subtracting the value of DEM from that of DSM for each cell, using ArcMap’s raster calculator. An advantage of CHM is that it can be intuitively translated to different vegetation types, such as high forests and low shrubs. We then created a 4 m resolution CHM raster by calculating the average of neighboring 0.5 m cells within a 4 meter window with ArcMap’s aggregate function. Thus, cell values of the 4 m CHM raster may be substantially lower than the highest points of trees. Outlier values in the DEM and DSM produced outlier values for the CHM raster, which could be negative (vegetation below ground level) or significantly larger values than the highest vegetation in the study area. The raster nodes with negative values were set to zero, and all values larger than 50 m were set to 50 m. Then, to produce the 4 m SD CHM raster (Figure 3c), we calculated standard deviations of canopy heights, based on the 4 m CHM raster after the correction of outlier values. We assigned to each cell the standard deviation for the values of 29 cells of the 4 m CHM raster, using ArcMap’s focal statistics tool with the sample method of 3-cell-radius circle. This SD CHM raster reflects canopy surface texture, that is, whether an area contains vegetation of similar heights or a mix of tall and short plants.
Another LiDAR-derived dataset comprises the intensities of laser return pulses, which are correlated to land cover types [43,56]. In particular, the low intensities of first returns allow us to separate bare or sparsely covered agricultural fields from areas of dense vegetation cover in our study area. The intensity of our LiDAR data is multispectral, meaning that each laser return contains intensity information at either the 1550, 1064 or 532 nm bands, which with a nuanced processing can potentially provide better information for land cover classification than traditional single wavelength LiDAR data [31]. However, because of (a) the malfunctioning of a laser source causing laser pulses of the 1064 and 532 nm channels to have weaker energy than normal and (b) flight lines flown at different PRFs producing varying return intensities, rigorous multispectral intensity analysis was not attempted. As a simple yet effective alternative, we created IDM, representing differences between the intensities of first returns and last returns [43]. We first created two intensity rasters, by averaging the intensities of first returns of all channels within 4 meter cells and those of the last returns of all channels. These calculations utilized ArcMap’s point to raster tool with binning interpolation and the cell assignment type of average, which filled cells without any point with the averages of values from the surrounding cells. Remaining no-data cells were then assigned a value of 0. The final intensity data product named IDM (Figure 3d) was produced by subtracting the averaged last return intensity raster from the averaged first return intensity raster. Like the case of CHM, outlier values in the point cloud data resulted in anomalously large or anomalously small values in IDM (a range of −164 to 263 with a mean of 0.62 and a standard deviation of 1.81). Cells with values smaller than −15 were set to −15, and those with values larger than 15 were set to 15.
Figure 4 summarizes the workflow of our OBIA vegetation classification. Before this analysis, the cell values of CDM, SD CHM, and IDM were scaled in a range from 0 to 50 to be equivalent to the CHM values. Although the scaling of data is not necessary for OBIA classification using threshold values, it facilitates the intuitive understanding of variation among different data sets. In addition, scaled data can be used without additional manipulations in case we decide to conduct supervised or unsupervised classification with Erdas Imagine or other programs, for which such data normalization is recommended. In the OBIA analysis, we first classified bodies of water, using UAVSAR data. UAVSAR uses L-band radar (1.26 GHz/0.2379 m with a bandwidth of 80 MHz), and its dual-polarized SAR data (polarization of radar waves at transmission and reception) distinguishes water clearly even under thin vegetation [57,58]. As indicated by other scholars [59,60], we found the HH polarization (horizontal transmit and horizontal receive) the most effective in the discrimination of water bodies (Figure 3e). We used a multiresolution segmentation scale value of 30, which generally produced a single segment for a small pond. A threshold value of 2 for the UAVSAR HHHH product gave the best delineation of water when compared to the orthophotos. Then we manually delineated palm plantations, which can be easily identified in the DEM and DSM. The automated classification of palm plantations is difficult because they include diverse vegetation cover, including palms of different growing stages and dense undergrowth (see Section 3.3).
For the rest of the area, we created four vegetation height categories, using the CHM: rainforest, high secondary vegetation, medium-high secondary vegetation, and low vegetation. For these steps, we used a multiresolution segmentation scale value of 10, which generated segments, each of which typically included canopies of a few trees in the rainforest. For the classification of the rainforest we chose a threshold value of 15 to include most of the Ceibal Park, and an additional use of SD CHM with a threshold value of 12 further separated the rainforest from known areas of high secondary vegetation. The CHM values for secondary vegetation exhibited continuous distribution from low to high, and we separated arbitrarily into high secondary vegetation and medium secondary vegetation with a threshold value of 7. We further subdivided each of the rainforest, high secondary vegetation, and medium secondary vegetation categories into dense (mostly undisturbed or uncut) and sparse (partially cut or disturbed) areas, using CDM. We chose threshold values for these separations at breaks in the histograms of CDM.
Since it was difficult to separate wetland forest from secondary vegetation, we delimited wetland areas after separating rainforest. For this, we first delimited the wetland land with a threshold value of 115 for the DEM raster because orthophotos, UAVSAR, and Landsat images showed that the divisions between wetlands and well-drained terrains were located around this elevation throughout our study areas. We then conducted multiresolution segmentation for wetlands, using the same scale value of 10 as rainforest and secondary vegetation. We did not conduct a ground survey of wetlands, except one location, but the examination of orthophotos, UAVSAR, and LiDAR point cloud profiles suggested that a threshold value of 7 for CHM separated high wetland forests covering areas that became dry during the dry season from low wetland forests of more moist zones. Wetlands with CHM values below 1 appeared to consist of low secondary vegetation and wetland grasses.
Our ground survey of well-drained terrains showed that areas with CHM values below 2 included agricultural fields (milpas), low secondary vegetation, high grass, and low grass (pasture). These areas were segmented with a scale value of 8 because a value of 10 would produce large segments, in some cases including different vegetation types. The use of pedestrian survey data for the classification of milpas and young secondary vegetation required caution because land use might have switched between these types from the time of LiDAR data acquisition in 2015 and the ground survey in 2016. It was still clear that most milpas tended to exhibit low IDM values than other land cover types. We chose a threshold value of 24 for IDM to separate milpas by examining the IDM histogram and by comparing LiDAR data with ground survey results. We divided the remaining areas into low secondary vegetation, high grass, and low grass (pasture) through supervised classification, using ground-verified areas as references.
After each step of classification, we merged classified areas and removed isolated small segments with eCognition’s minimum mapping unit function, using the following pixel sizes: 21 for water, 300 for rainforest and 201 for the rest, 500 for wetland forests, 90 for high secondary vegetation, 300 for medium secondary vegetation, 63 for milpas and 50 for the rest of low vegetation areas, and 100 for low secondary vegetation, high grass, and low grass. In addition, after the classification of water, we smoothed its edges with a scale value of 2. After all the classifications, we also smoothed the edges of classified areas, except water and palm plantations, with a scale value of 30. In the final step, we exported shape files for all vegetation categories from eCognition, which were then used for calculating the statistics of LiDAR data and of ground-truthing results by vegetation types with the zonal statistics and spatial join tools of ArcMap.

3. Results

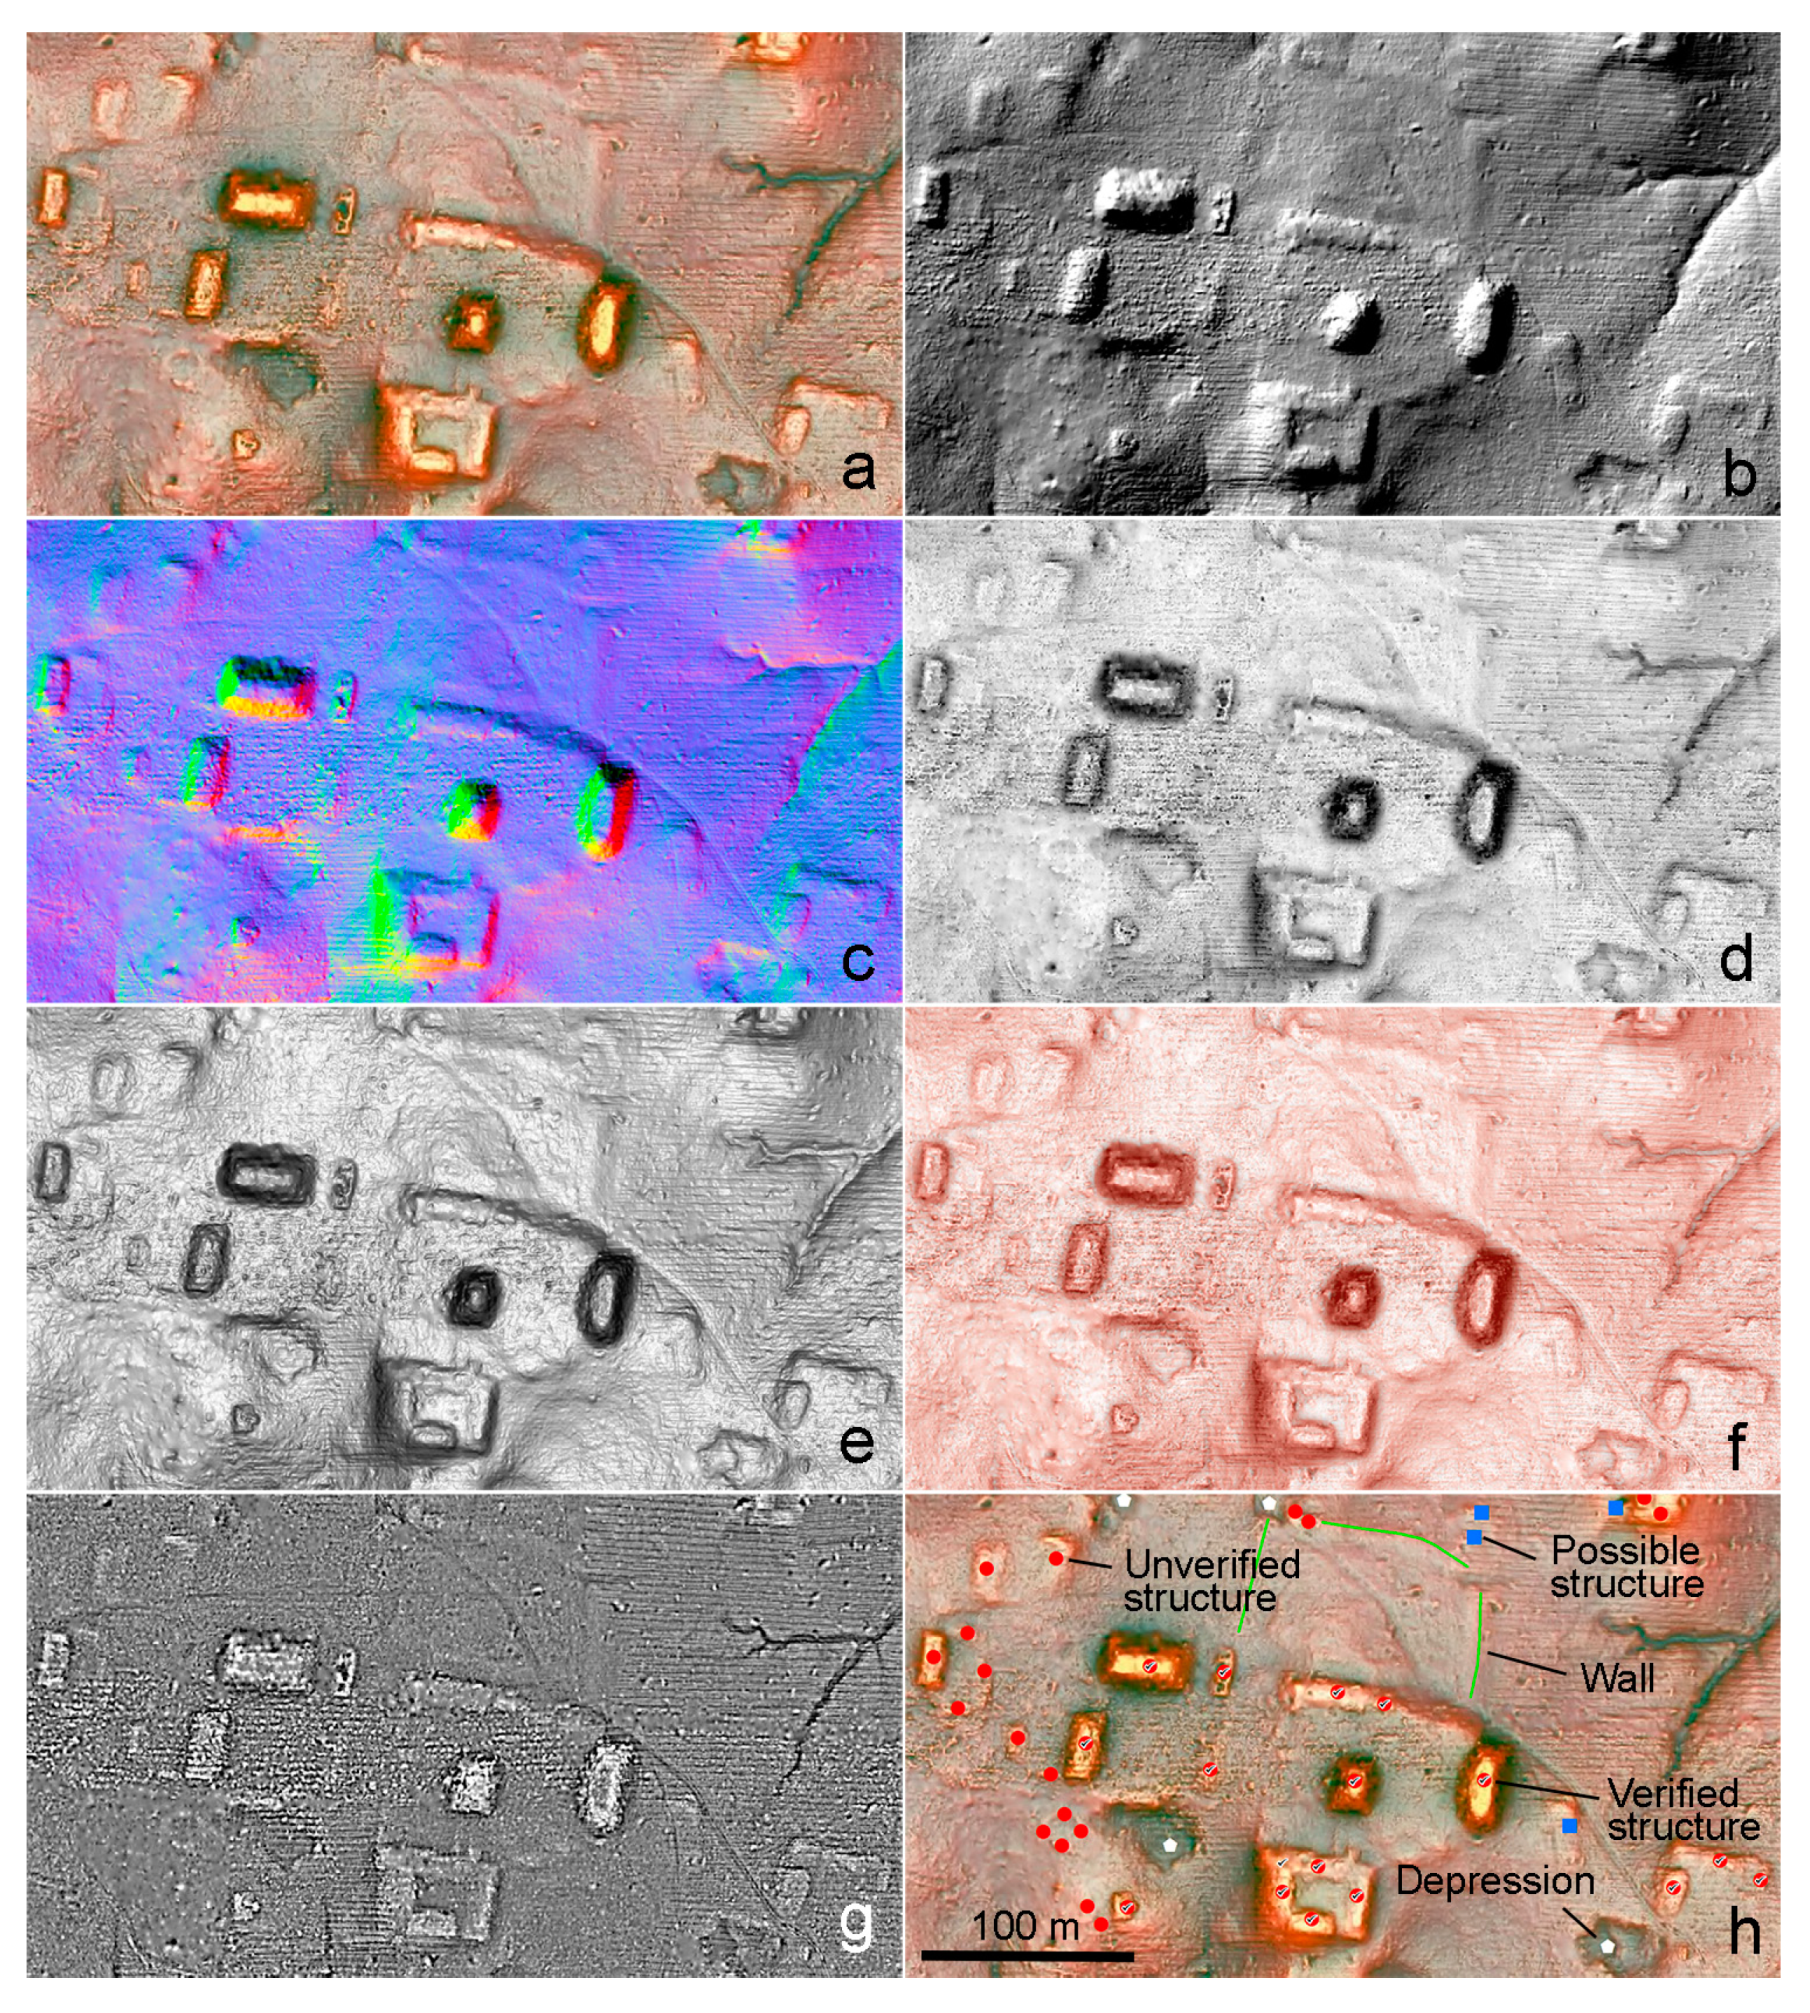
3.1. Comparison of RRIM with Other Visualization Techniques

We compared RRIM with other visualization techniques under different conditions. Figure 5 shows an area of pasture and three years old secondary vegetation, which appears as a strip of rough texture. While the high mounds, measuring 3 to 5 m in height, are clearly visible in all images, RRIM highlights subtle features better than other techniques. These features include those marked as possible structures and walls, measuring 10 to 20 cm in height above the patio areas, as well as a modern path. In addition, depressions stand out better in RRIM. The one near the lower right corner, for example, measures 1.2 m in depth. We should note that most of subtle features can be identified in the other images through careful examination.
Figure 6 shows an area to the south of Group C in the central part of Ceibal covered by rainforest. The advantage of RRIM over other visualization techniques becomes clearer in such an area with a lower density of LiDAR ground points, a higher noise level, and the prevalence of small-sized structures. The numbers of structures, platforms, and depressions identified in different images of this area, as well as those recorded in the Harvard map, are indicated in Table 2. We should note that the results of such comparison vary among individuals with different levels of familiarity with archaeological features and visualization techniques. In addition, as discussed in Section 2.4 we did not conduct time-consuming systematic ground surveys in forested areas. Nevertheless, our research results, as discussed in Section 3.3, suggested that our false positive identification rate based primarily on RRIM images was 2 out of 62 (3.2%) for rainforest areas. Although it is desirable to verify the figures presented in Table 2 in future studies, we believe that these numbers reasonably represent the relative effectiveness of different visualization techniques. Most techniques distinguish structures higher than 50 cm, platforms, and depressions, but RRIM better highlights smaller structures. Given the low false positive identification rate, it is likely that the examination of the RRIM image detected some structures missed during the ground survey by Harvard researchers. Structures below 30 cm are difficult to identify in SVF and the moving-window elevation difference image, and the detection of such features in hillshade images depends on the angle of light. Although depressions can be identified in most images, they stand out more clearly in RRIM. In the slope gradient image, such concave features may be confused with convex ones (structures).
These comparisons suggest that RRIM highlights small features better than other techniques in various conditions. In addition, a major advantage of RRIM is that with clearer contrasts in color and brightness it allows researchers to spot low mounds and other subtle features quickly. For the analysis of LiDAR data covering large areas, such efficiency in feature detection is critical.

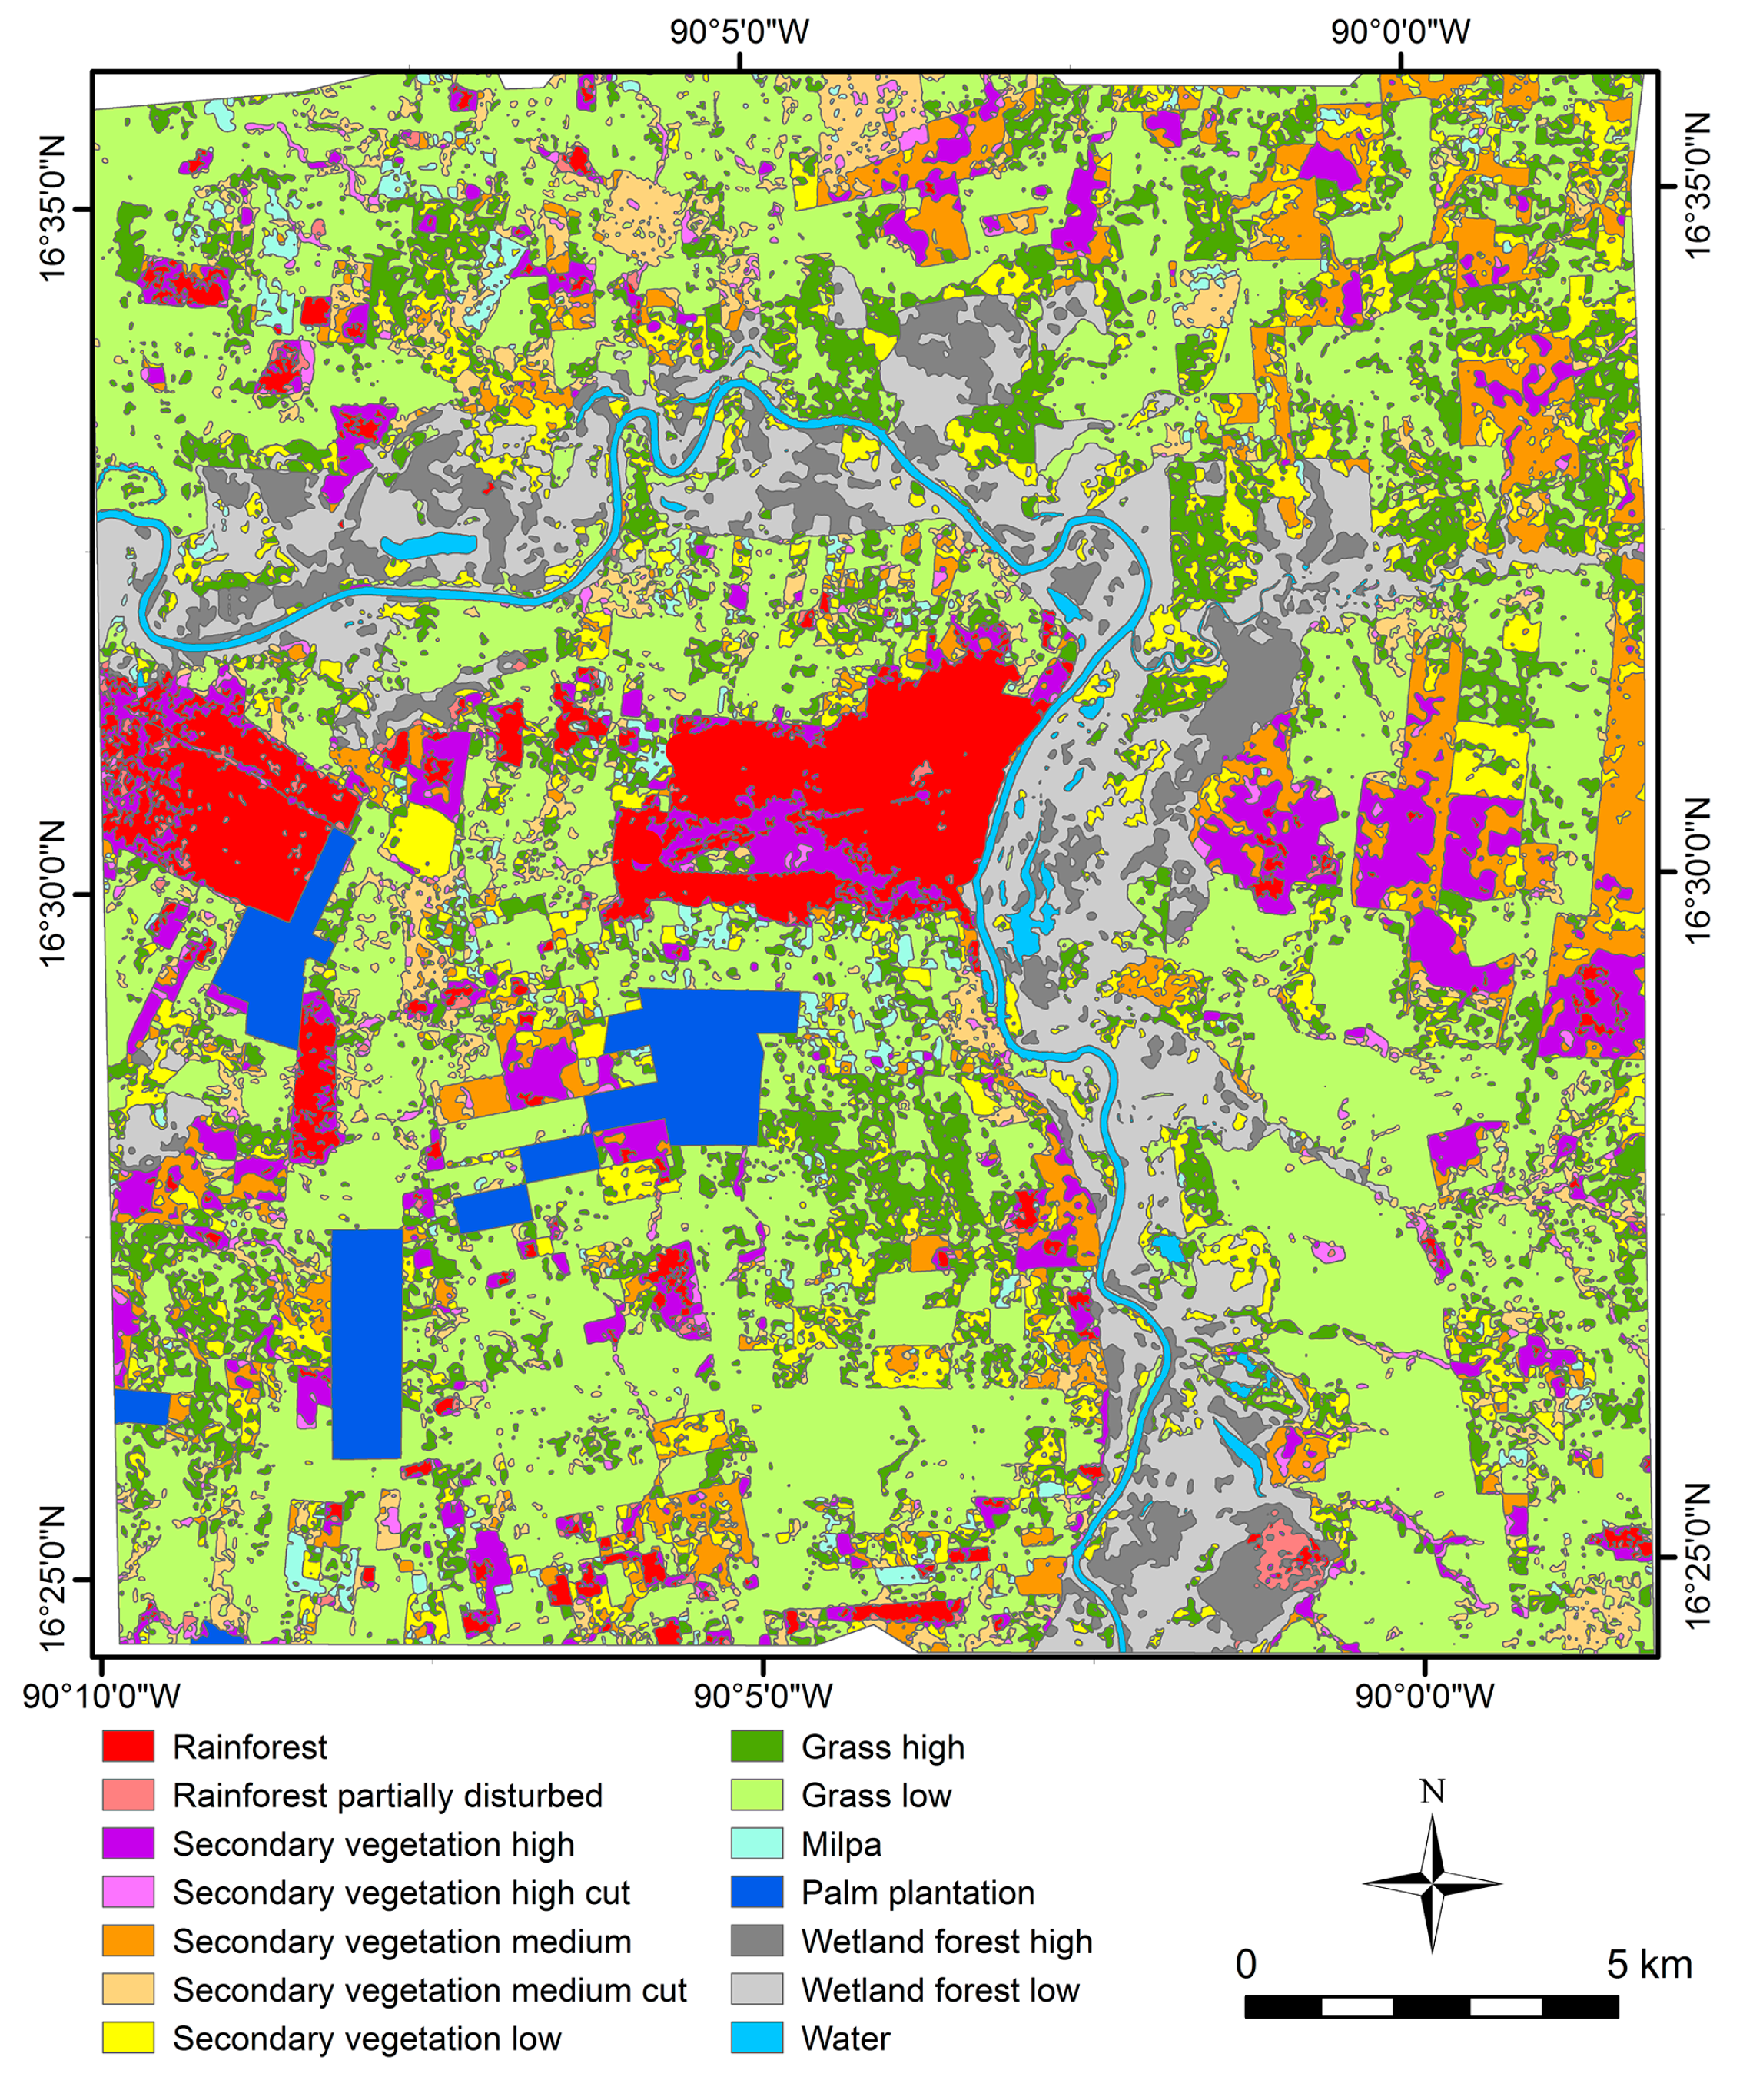
3.2. Vegetation Classification

The prevalent rainforest taxa in the study area include high evergreen trees (Brosimum alicastrum, Ficus spp.), high deciduous trees (Ceiba pentandra, Leguminosae spp.), medium deciduous trees (Drypetes brownii, Spondias mombin), and cohune palm (Attalea cohune). The high secondary vegetation (12 to 30 years old) is dominated by small to medium cohune palms, deciduous medium-high trees (Spondias mombin, Bursera simaruba, Cedrela odorata), and its understory is characterized by young cohune palms, other small to medium palms (Chamaedorea tepejilote, Caryota mitis, Sabal morrisiana) and small to medium trees (Piper spp., Stemmadenia donnell-smithii). The medium (3 to 15 years old) and low (1 to 10 years old) secondary vegetation includes rapid growth small to medium trees (Hampea stipitata, Cecropia spp.) and their dense understory is formed mainly by young palms, shrubs (Hamelia patens, Piper spp.), herbaceous plants (Heliconiaceae spp., Marantaceae spp., Poaceae spp., Asteraceae spp.), and vines (Ipomoea spp.).
Figure 7 and Table 3 present the results of OBIA vegetation classification, and Figure 8 and Table 4 their characteristics. Because our resources and time were dedicated primarily to the study of archaeological features, we did not collect independent sets of vegetation data for the accuracy assessment of the vegetation classification. As noted above, our classification mainly reflects vegetation’s effects on LiDAR data, and the resultant types are presented as somewhat inclusive categories in relation to the land cover classes observed on the ground. For example, 12 to 15 years old secondary vegetation can belong to either “high secondary vegetation” or “medium secondary vegetation”. Likewise, “partially cut medium secondary vegetation” can include orchards and cohune palm forests. In addition, because of the uncertainty regarding milpas and low secondary vegetation at the time of LiDAR data acquisition, dense milpas and thin secondary vegetation less than one year old may be misclassified. Despite these qualifications, the resulting classification should serve its main purpose, that is, to provide a baseline for the evaluation of land cover’s effects on LiDAR data for archaeological feature detection.
A significant number of archaeological features at the center of Ceibal and in its immediate surroundings are covered by the thick rainforest canopy. In this vegetation type, undergrowth is relatively thin, allowing some laser pulses to penetrate. Nonetheless, the distribution of ground points is uneven (Figure 9a). A significant portion of ground returns appear to concentrate in areas under thinner leafage, while few laser pulses penetrate thicker parts of foliage. These patches with few ground points make the identification of small archaeological features problematic (see Section 4). High secondary vegetation contains denser lower-level cover, and point cloud profiles show some patches with few ground points (Figure 9b). The ground return/laser shot ratio for medium-high secondary vegetation is generally higher than that of high secondary vegetation, but denser parts of this vegetation type blocked laser pulses or in some cases vegetation returns close to the ground were misclassified as ground points (Figure 9c). Particularly problematic cases are low secondary vegetation and dense high grass consisting of guinea grass (Panicum maximum cv. Mombasa). Laser pulses did not penetrate these vegetation types well, producing mixed ground/vegetation returns which were often misclassified as ground points (Figure 9d,e). Thus, the high ground return/laser shot ratios for low secondary vegetation and high grass in Table 4 are misleading. They resulted from substantial numbers of mixed signal misclassified points.

3.3. Assessment of Archaeological Features Detection in LiDAR Data

In the central part of Ceibal completely mapped by the Harvard project, we could identify nearly all previously mapped structures. We judged that three small structures in the Harvard map were probably not archaeological features, and recorded 24 “structures/platforms” and 88 “possible structures/platforms” that were not on the Harvard map (Figure 10). For the reason discussed above, we did not ground-truth these features in the 2016 season. Nonetheless, we think that there is a reasonable possibility that many of the features registered as “structures/platforms” are archaeological remains, based on the results of our ground-truthing outside of the Harvard map (Table 5). Our pedestrian survey confirmed that more than 90% of locations registered as “structures” in various vegetation types were indeed archaeological features (false positive rates lower than 10%), whereas the rate of positive confirmation for those recorded as “possible structures” ranged from 40 to 100% in most cases.
Our ground survey also identified additional structures that were not recorded in the LiDAR analysis (“Field IDed” in Table 5). For the most part these features were small in horizontal dimensions (around 10 m or less in length) and in vertical relief (around 30 cm or less in height). The ratios of such false negative identifications were relatively high for rainforest and uncut high secondary vegetation while those for partially cut secondary vegetation and low grass were lower (Table 5). In rainforest and uncut high secondary vegetation, the low rates of laser penetration and the patches with few ground points were most likely responsible for the higher number of missed small features in these areas (see Section 4). LiDAR-based identification of archaeological features is more reliable for partially cut secondary vegetation with higher canopy penetration rates (Table 4 and Table 5). The low numbers of missed structures for medium-high and low secondary vegetation, however, are probably misleading. Thorough ground survey of these areas would require substantial clearing of vegetation, but permission for clearing was difficult to obtain. Various scholars have pointed out the reduced effectiveness of LiDAR for dense and short secondary vegetation [12,30], and we assume that more detailed ground surveys of these areas in the future will reveal a considerable number of structures not present in the interpolated LiDAR data.
For bare fields and areas with low grasses or pastures, LiDAR provided high-resolution data that allowed us to identify many of subtle features. Our field investigations demonstrated that the vertically precision of LiDAR better than 2 cm allowed us to identify cultural features measuring 10 to 20 cm in height in ideal conditions. These low structures commonly consisted of one course of 10 to 30 cm high stones that were partially buried in the ground. For example, Structure E shown in Figure 11c,d were 20 cm higher than the patio area, and Structure F (also seen in the foreground of Figure 11b) were 10 cm higher. Calibration errors of LiDAR resulted in vertical discrepancies of 2 to 8 cm between different flight paths, which is seen as east-west stripes in DEM visualizations (Figure 11c) and subtle undulations in north-south elevation profiles (Figure 11d bottom). Although Structures E and F were still identifiable, these errors made the detection of features lower than 10 cm nearly impossible. The configurations of structure groups, often surrounding a patio, also aided the identification of low buildings. Since the Maya nearly always built structures in elevated locations for better drainage, the back sides of these buildings usually formed downslopes. Structure D, for instance, did not show recognizable difference in elevation from the patio area (Figure 11d), but its well-defined edges on its back and lateral sides facilitated its detection. Nonetheless, when the edge of a structure and that of the underlying platform coincided or when structures were located on slopes, some misidentifications occurred (Structure A in Figure 11c,d). When low structures did not exhibit regular configurations of patio groups, their identifications were more difficult.
Oil palm (Elaeis guineensis) plantations, which have spread in our study area in the last decade, pose a significant challenge. Point cloud profiles indicate that laser pulses penetrate leaves of palm trees planted at regular intervals of 9 to 10 m and sparse undergrowth below them, but they are blocked by extremely dense undergrowth of about 1.5 m high which covers the ground between palm trees (Figure 12). Under such conditions, LiDAR-derived DEMs give honeycomb-like appearances. We could not ground-truth these plantations because permission for entrance was not given. Nonetheless, the examination of point clouds suggests that the identification of structures lower than 1 m is difficult in those areas.

4. Discussion

The effectiveness of RRIM in archaeological studies derives from its clear visualization of both small and large topographic reliefs, using gradations in colors and brightness. This technique also retains relatively natural appearances of topography, facilitating the identification of cultural and natural features of diverse morphologies, including structures, platforms, walls, terraces, roads, canals, and depressions. SVF images overlaid with slope gradient produce somewhat similar effects (Figure 5f and Figure 6f). However, SVF usually generates close values for convex points and flat areas although it provides distinct values for concave points. This is probably the reason that Hutson [11] found SVF less effective than color-classified DEMs for the identification of low platforms in the flat terrain of northern Yucatan. An advantage of RRIM over SVF is that its use of positive and negative openness, as well as its visualization through brightness rather than gray scale, leads to clearer distinctions between concave points, flat areas, and convex points. In addition, our comparison suggests that RRIM distinguishes small features better than SVF in areas covered by dense forests (Figure 6 and Table 2). RRIM has been used in geosciences [61,62,63], but its archaeological application outside of Japan has been limited, except for investigations at Angkor Tom, Cambodia [64]. As a product of mathematical operations, RRIM, as well as SVF, facilitates feature detection through the exaggeration of vertical differences and convexities, but these effects can also lead to misunderstandings of features’ shapes. For this reason, it is often desirable to compare RRIM with regular hillshade images, in which humans can intuitively understand the shapes of reliefs. In particular, RRIM tends to highlight the edges of platforms and terraces with flat summits. We often needed to inspect hillshades and elevation profiles to examine the presence or absence of low structures along the edges of platforms and terraces.
This study also demonstrates that the OBIA approach to vegetation classification is effective in evaluating the effects of vegetation types on LiDAR data. Our ground-truthing of archaeological features shows that there tends to be more errors in the detection of archaeological features in land cover types that block more laser pulses (Table 4 and Table 5). In this sense, our classification of vegetation serves its main purposes of providing a baseline for the evaluation of LiDAR data for archaeological applications. Nonetheless, we should note that other ways of vegetation classification are also possible. Examples may include classifications of a larger number of secondary growth types and the distinction of intentionally managed forests and orchards from naturally-grown secondary vegetation. An additional issue to consider is that the category of partially cut high secondary vegetation in our classification tends to have higher trees than uncut high secondary vegetation, and the same is true for partially cut medium-high secondary vegetation and uncut medium-high secondary vegetation (Figure 8). This is because partially cut forests with some open parts often result in lower average values in the 4 m CHM raster. An alternative approach in this regard is to use the maximum values, instead of the averages that we used, for 4 m windows in generating a CHM raster.
In terms of vegetation’s effects on LiDAR data and the identification of archaeological features, a significant problem is posed by dense and low secondary vegetation, which blocks substantial part of laser pulses and can produce mixed ground-vegetation returns, leading to misrepresentations of the terrain. Oil palm plantations add to this problem. These plantations are rapidly expanding in Guatemala and in other parts of the tropics in the world. The mix of regularly planted palm trees and extremely dense undergrowth makes the detection of small archaeological features in LiDAR data difficult. The development of palm plantations often involves the construction of substantial canals with heavy machineries, which may destroy archaeological remains. It is desirable to conduct archaeological and environmental studies in areas of planned palm plantations prior to their development to assess their impacts.
Another important issue concerns different types of rainforest. The Maya lowlands comprise diverse vegetation types, including high and dense rainforest with high precipitation around Ceibal, less dense rainforest in the central lowlands, and deciduous scrub in the northern areas. The ground return/laser shot ratios of 3.3 to 4.1% for rainforest in our dataset (Table 4) are significantly lower than those in Yaxnohcah, Calakmul, Mayapan, and Cansahcab in the central and northern Maya lowlands, ranging from 9.4 to 37.0% [30]. Although those figures taken with different equipment and in different configurations are not directly comparable, the low ratios for Ceibal accord with our expectations for the dense rainforest coverage in our study area. Our LiDAR data still detect small archaeological features under the rainforest canopy reasonably well, but there are also considerable numbers of small structures that were not identified in the LiDAR data but found during the pedestrian survey (false negative identifications).
Our study suggests that an important factor contributing to the high false negative rates in the rainforest and high secondary vegetation is the presence of patches with no or few ground points, possibly caused by particularly dense parts of foliage. We could not confirm whether false negative locations indeed correspond to such areas of no ground points because the thick canopy also blocked GPS signals, making it difficult to plot field identified features accurately. We, however, suspect that the effects of these occluded areas are significant because some patches without any ground point measure up to 20 × 20 m (Figure 13). Archaeological features smaller than this size can go undetected in LiDAR data, and the shapes of larger structures can be misinterpreted. In the areas where multiple test flights produced denser distributions of laser shots, the false negative rates for rainforest and uncut secondary vegetation are lower (Table 5). The higher density of laser shots, as well as the increased penetration resulted possibly from lower flying altitudes, appears to mitigate this problem to a certain degree. Nonetheless, a substantial portion of ground returns still appear to concentrate in areas under thinner leafage (Figure 13). Certain occluded regions might not be accurately mapped despite firing higher numbers of laser shots. In this sense, although a higher number of laser shots enhance results, their benefits may gradually diminishes in terms of cost-effectiveness as the number of laser shots increases.
These observations indicate that the successful identification of small archaeological features depends not only on average densities of ground returns but also on evenness in the distribution of ground points. Examining the frequencies and sizes of occluded regions in the rainforests of other parts of the Maya lowlands may represent an effective research strategy. Such data should help design cost-effective LiDAR data acquisition strategies in regions of similar ecological settings and allow researchers to estimate the sizes of archaeological features that may go undetected in LiDAR data. Geiger-mode LiDAR, which emit laser pulses at varying angles, may reduce occluded regions as laser pulses shot at certain angles may illuminate parts of ground that are not reached by pulses from different angles. In addition, photon-counting LiDAR, which may record weak ground returns, also presents an important potential in this regard. Nonetheless, their effectiveness needs to be tested in future research.

5. Conclusions

As noted by various scholars, vegetation classification is an important step for the evaluation of LiDAR data for the detection of ground-level features. The OBIA classification using LiDAR-derived datasets, combined with a ground vegetation survey, presents a productive approach, which allows researchers to generate LiDAR-related statistics for the entire study area efficiently. The methods of vegetation classification developed in forestry and ecology provide an important basis for this study, but the specific goal of vegetation classification in archaeological applications is different from those in forestry or ecology. Instead of aiming at classifications that best reflect biological or ecological ones, vegetation classifications in archaeological studies need to focus on the purpose of examining vegetation’s effects on LiDAR data. As archaeologists dedicate a significant part of their resources and time into the investigations of archaeological remains, they need to develop efficient, yet reasonable methods to classify vegetation that reflect the ways vegetation blocks and reflects laser pulses.
For the visualization of LiDAR data, RRIM presents an effective method for the identification of subtle cultural and natural features. While many visualization techniques work reasonably well in the detection of structures larger than 50 cm in height in near ideal conditions, RRIM is particularly effective in highlighting smaller features covered by dense rainforest canopy. In addition, with clear differentiations of concave and convex points with different colors, RRIM allows researchers to spot small features quickly. The use of RRIM allowed us to examine archaeological features rapidly over a wide area. Nonetheless, combinations of different visualization techniques are desirable, depending on the types of local topography and the morphologies of targeted features.
Our study suggests that LiDAR detects nearly all structures higher than 1.5 m under most conditions and a significant portion of structures higher than 0.3 m in optimal settings. Nonetheless, the dense rainforest in this high precipitation region, as well as thick, low to medium-low secondary vegetation and palm plantations, presents problems for the identification of small features. For the rainforest, higher densities of laser shots appear to improve feature identification, but do not eliminate the problem of patches with few ground returns, possibly caused by the thickest parts of foliage.

Acknowledgments

Investigations at Ceibal were carried out with permits issued by the Instituto de Antropología e Historia de Guatemala. The LiDAR data were obtained with the funding from the JSPS KAKENHI (26101002 and 26101003), and the field and lab work was supported by the Alphawood Foundation. The analysis of LiDAR data was carried out with the support of a Dumbarton Oaks fellowship and the University of Arizona Agnese Nelms Haury program.

Author Contributions

Inomata, Aoyama, Yonenobu, and Haraguchi planned the LiDAR survey, and Fernandez-Diaz oversaw the data acquisition. Inomata analyzed LiDAR and other remotely-sensed data, recorded archaeological features, and developed vegetation classification. Pinzón and Ranchos carried out field verification, following the strategy designed by Inomata, and Pinzón, Ranchos, and Nasu conducted the vegetation survey. Inomata wrote the first draft of the paper, and Fernandez-Diaz and Nasu provided edits and additions.

Conflicts of Interest

The authors declare no conflict of interest. The founding sponsors had no role in the design of the study; in the collection, analyses, or interpretation of data; in the writing of the manuscript, and in the decision to publish the results.

References

  1. Chase, A.F.; Chase, D.Z.; Weishampel, J.F.; Drake, J.B.; Shrestha, R.L.; Slatton, K.C.; Awe, J.J.; Carter, W.E. Airborne LiDAR, archaeology, and the ancient Maya landscape at Caracol, Belize. J. Archaeol. Sci. 2011, 38, 387–398. [Google Scholar] [CrossRef]
  2. Chase, A.F.; Chase, D.; Awe, J.; Weishampel, J.; Iannone, G.; Moyes, H.; Yaeger, J.; Brown, M.K. The use of LiDAR in understanding the Ancient Maya landscape. Adv. Archaeol. Pract. 2014, 2, 208–221. [Google Scholar] [CrossRef]
  3. Chase, A.F.; Chase, D.Z.; Fisher, C.T.; Leisz, S.J.; Weishampel, J.F. Geospatial revolution and remote sensing LiDAR in Mesoamerican archaeology. Proc. Natl. Acad. Sci. USA 2012, 109, 12916–12921. [Google Scholar] [CrossRef] [PubMed]
  4. Chase, A.F.; Chase, D.Z.; Awe, J.J.; Weishampel, J.F.; Iannone, G.; Moyes, H.; Yaeger, J.; Brown, M.K.; Shrestha, R.L.; Carter, W.E. Ancient Maya regional settlement and inter-site analysis: The 2013 west-central Belize LiDAR Survey. Remote Sens. 2014, 6, 8671–8695. [Google Scholar] [CrossRef]
  5. Hare, T.; Masson, M.; Russell, B. High-density LiDAR mapping of the ancient city of Mayapán. Remote Sens. 2014, 6, 9064–9085. [Google Scholar] [CrossRef]
  6. Golden, C.; Murtha, T.; Cook, B.; Shaffer, D.S.; Schroder, W.; Hermitt, E.J.; Firpi, O.A.; Scherer, A.K. Reanalyzing environmental LiDAR data for archaeology: Mesoamerican applications and implications. J. Archaeol. Sci. Rep. 2016, 9, 293–308. [Google Scholar] [CrossRef]
  7. Rosenswig, R.M.; López-Torrijos, R.; Antonelli, C.E.; Mendelsohn, R.R. LiDAR mapping and surface survey of the Izapa state on the tropical piedmont of Chiapas, Mexico. J. Archaeol. Sci. 2013, 40, 1493–1507. [Google Scholar] [CrossRef]
  8. Rosenswig, R.M.; López-Torrijos, R.; Antonelli, C.E. LiDAR data and the Izapa polity: New results and methodological issues from tropical Mesoamerica. Archaeol. Anthropol. Sci. 2015, 7, 487–504. [Google Scholar] [CrossRef]
  9. Evans, D.H.; Fletcher, R.J.; Pottier, C.; Chevance, J.B.; Soutif, D.; Tan, B.S.; Im, S.; Ea, D.; Tin, T.; Kim, S.; et al. Uncovering archaeological landscapes at Angkor using LiDAR. Proc. Natl. Acad. Sci. USA 2013, 110, 12595–12600. [Google Scholar] [CrossRef] [PubMed]
  10. Evans, D. Airborne laser scanning as a method for exploring long-term socio-ecological dynamics in Cambodia. J. Archaeol. Sci. 2016, 74, 164–175. [Google Scholar] [CrossRef]
  11. Hutson, S.R. Adapting LiDAR data for regional variation in the tropics: A case study from the Northern Maya Lowlands. J. Archaeol. Sci. Rep. 2015, 4, 252–263. [Google Scholar] [CrossRef]
  12. Prufer, K.M.; Thompson, A.E.; Kennett, D.J. Evaluating airborne LiDAR for detecting settlements and modified landscapes in disturbed tropical environments at Uxbenká, Belize. J. Archaeol. Sci. 2015, 57, 1–13. [Google Scholar] [CrossRef]
  13. Hutson, S.R.; Kidder, B.; Lamb, C.; Vallejo-Cáliz, D.; Welch, J. Small buildings and small budgets: Making LiDAR work in Northern Yucatan, Mexico. Adv. Archaeol. Pract. 2016, 4, 268–283. [Google Scholar] [CrossRef]
  14. Ebert, C.E.; Hoggarth, J.A.; Awe, J.J. Integrating Quantitative LiDAR analysis and settlement survey in the Belize River Valley. Adv. Archaeol. Pract. 2016, 4, 284–300. [Google Scholar] [CrossRef]
  15. Reese-Taylor, K.; Hernández, A.A.; Esquivel, A.F.F.; Monteleone, K.; Uriarte, A.; Carr, C.; Acuña, H.G.; Fernandez-Diaz, J.C.; Peuramaki-Brown, M.; Dunning, N. Boots on the ground at Yaxnohcah ground-truthing LiDAR in a complex tropical landscape. Adv. Archaeol. Pract. 2016, 4, 314–338. [Google Scholar] [CrossRef]
  16. Pingel, T.J.; Clarke, K.; Ford, A. Bonemapping: A LiDAR processing and visualization technique in support of archaeology under the canopy. Cartogr. Geogr. Inf. Sci. 2015, 42, 18–26. [Google Scholar] [CrossRef]
  17. Magnoni, A.; Stanton, T.W.; Barth, N.; Fernandez-Diaz, J.C.; León, J.F.O.; Ruíz, F.P.; Wheeler, J.A. Detection thresholds of archaeological features in airborne LiDAR data from Central Yucatán. Adv. Archaeol. Pract. 2016, 4, 232–248. [Google Scholar] [CrossRef]
  18. Bennett, R.; Welham, K.; Ford, A. A comparison of visualization techniques for models created from airborne laser scanned data. Archaeol. Prospect. 2012, 19, 41–48. [Google Scholar] [CrossRef]
  19. Challis, K.; Forlin, P.; Kincey, M. A generic toolkit for the visualization of archaeological features on airborne LiDAR elevation data. Archaeol. Prospect. 2011, 18, 279–289. [Google Scholar] [CrossRef]
  20. Devereux, B.J.; Amable, G.S.; Crow, P. Visualisation of LiDAR terrain models for archaeological feature detection. Antiquity 2008, 82, 470. [Google Scholar] [CrossRef]
  21. Harmon, J.M.; Leone, M.P.; Prince, S.D.; Snyder, M. LiDAR for archaeological landscape analysis: A case study of two eighteenth-century Maryland plantation sites. Am. Antiquity 2006, 71, 649–670. [Google Scholar] [CrossRef]
  22. Millard, K.; Burke, C.; Stiff, D.; Redden, A. Detection of a low-relief 18th-century British siege trench using LiDAR vegetation penetration capabilities at Fort Beauséjour—Fort Cumberland National Historic Site, Canada. Geoarchaeology 2009, 24, 576–588. [Google Scholar] [CrossRef]
  23. Štular, B.; Kokalj, Ž.; Oštir, K.; Nuninger, L. Visualization of LiDAR-derived relief models for detection of archaeological features. J. Archaeol. Sci. 2012, 39, 3354–3360. [Google Scholar] [CrossRef]
  24. Atlas Hidrológico. Available online: http://www.insivumeh.gob.gt/hidrologia/ATLAS_HIDROMETEOROLOGICO/Atlas_Hidrologico/isoyetas.jpg (accessed on 25 November 2016).
  25. Willey, G.R.; Smith, A.L.; Tourtellot, G., III; Graham, I. Excavations at Seibal, Department of Peten, Guatemala: Introduction: The Site and Its Setting; Harvard University: Cambridge, MA, USA, 1975. [Google Scholar]
  26. Tourtellot, G., III. Excavations at Seibal, Department of Peten, Guatemala: Peripheral Survey and Excavation, Settlement and Community Patterns; Harvard University: Cambridge, MA, USA, 1988. [Google Scholar]
  27. Munson, J. Building on the Past: Temple Histories and Communities of Practice at Caobal, Petén, Guatemala. Ph.D. Thesis, University of Arizona, Tucson, AZ, USA, 2012. [Google Scholar]
  28. Inomata, T.; MacLellan, J.; Triadan, D.; Munson, J.; Burham, M.; Aoyama, K.; Nasu, H.; Pinzon, F.; Yonenobu, H. Development of sedentary communities in the Maya lowlands: Coexisting mobile groups and public ceremonies at Ceibal, Guatemala. Proc. Natl. Acad. Sci. USA 2015, 112, 4268–4273. [Google Scholar] [CrossRef] [PubMed]
  29. Inomata, T.; Triadan, D.; Aoyama, K.; Castillo, V.; Yonenobu, H. Early ceremonial constructions at Ceibal, Guatemala, and the origins of lowland Maya civilization. Science 2013, 340, 467–471. [Google Scholar] [CrossRef] [PubMed]
  30. Fernandez-Diaz, J.C.; Carter, W.E.; Shrestha, R.L.; Glennie, C.L. Now you see it… now you don’t: Understanding airborne mapping LiDAR collection and data product generation for archaeological research in Mesoamerica. Remote Sens. 2014, 6, 9951–10001. [Google Scholar] [CrossRef]
  31. Fernandez-Diaz, J.C.; Carter, W.E.; Glennie, C.; Shrestha, R.L.; Pan, Z.; Ekhtari, N.; Singhania, A.; Hauser, D.; Sartori, M. Capability assessment and performance metrics for the Titan multispectral mapping LiDAR. Remote Sens. 2016, 8, 936. [Google Scholar] [CrossRef]
  32. Fountain, A.G.; Fernandez-Diaz, J.C.; Levy, J.; Gooseff, M.; Van Horn, D.J.; Morin, P.; Shrestha, R. High-resolution elevation mapping of the McMurdo Dry Valleys, Antarctica and surrounding regions. Earth Syst. Sci. Data 2017. [Google Scholar] [CrossRef]
  33. LASer (LAS) File Format Exchange Activities. Available online: https://www.asprs.org/committee-general/laser-las-file-format-exchange-activities.html (accessed on 1 February 2017).
  34. McCoy, M.D.; Asner, G.P.; Graves, M.W. Airborne LiDAR survey of irrigated agricultural landscapes: An application of the slope contrast method. J. Archaeol. Sci. 2011, 38, 2141–2154. [Google Scholar] [CrossRef]
  35. Pingel, T.; Clarke, K. Perceptually shaded slope maps for the visualization of digital surface models. Cartogr. Int. J. Geogr. Inf. Geovisual. 2014, 49, 225–240. [Google Scholar] [CrossRef]
  36. Chase, A.S.Z. Beyond Elite Control: Water Management at Caracol. Bachelor’s Thesis, Harvard University, Cambridge, MA, USA, 2012. [Google Scholar]
  37. Kokalj, Ž.; Zakšek, K.; Oštir, K. Application of sky-view factor for the visualisation of historic landscape features in LiDAR-derived relief models. Antiquity 2011, 85, 263–273. [Google Scholar] [CrossRef]
  38. Zakšek, K.; Oštir, K.; Kokalj, Ž. Sky-view factor as a relief visualization technique. Remote Sens. 2011, 3, 398–415. [Google Scholar] [CrossRef]
  39. Chiba, T.; Kaneta, S.; Suzuki, Y. Red relief image map: New visualization method for three dimensional data. Int. Arch. Photogramm. Remote Sens. Spat. Inf. Sci. 2008, 37, 1071–1076. [Google Scholar]
  40. Chiba, T.; Suzuki, Y. Visualization of airborne laser mapping data: Production and development of red relief image map. Adv. Surv. Technol. 2008, 96, 32–42. (In Japanese) [Google Scholar]
  41. Yokoyama, R.; Shirasawa, M.; Pike, R.J. Visualizing topography by openness: A new application of image processing to digital elevation models. Photogramm. Eng. Remote Sens. 2002, 68, 257–266. [Google Scholar]
  42. Sky-View Factor Based Visualization. Available online: http://iaps.zrc-sazu.si/en/svf#v (accessed on 15 January 2017).
  43. Antonarakis, A.S.; Richards, K.S.; Brasington, J. Object-based land cover classification using airborne LiDAR. Remote Sens. Environ. 2008, 112, 2988–2998. [Google Scholar] [CrossRef]
  44. Bork, E.W.; Su, J.G. Integrating LiDAR data and multispectral imagery for enhanced classification of rangeland vegetation: A meta analysis. Remote Sens. Environ. 2007, 111, 11–24. [Google Scholar] [CrossRef]
  45. Lee, A.C.; Lucas, R.M. A LiDAR-derived canopy density model for tree stem and crown mapping in Australian forests. Remote Sens. Environ. 2007, 111, 493–518. [Google Scholar] [CrossRef]
  46. Millard, K.; Richardson, M. Wetland mapping with LiDAR derivatives, SAR polarimetric decompositions, and LiDAR–SAR fusion using a random forest classifier. Can. J. Remote Sens. 2013, 39, 290–307. [Google Scholar] [CrossRef]
  47. Naidoo, L.; Cho, M.; Mathieu, R.; Asner, G. Classification of savanna tree species, in the Greater Kruger National Park region, by integrating hyperspectral and LiDAR data in a random forest data mining environment. ISPRS J. Photogramm. Remote Sens. 2012, 69, 167–179. [Google Scholar] [CrossRef]
  48. Van Leeuwen, M.; Nieuwenhuis, M. Retrieval of forest structural parameters using LiDAR remote sensing. Eur. J. For. Res. 2010, 129, 749–770. [Google Scholar] [CrossRef]
  49. Liu, X.; Li, Y.; Gao, W.; Xiao, L. Double polarization SAR image classification based on object-oriented technology. J. Geogr. Inf. Syst. 2010, 2, 113. [Google Scholar] [CrossRef]
  50. Ryherd, S.; Woodcock, C. Combining spectral and texture data in the segmentation of remotely sensed images. Photogramm. Eng. Remote Sens. 1996, 62, 181–194. [Google Scholar]
  51. Syed, S.; Dare, P.; Jones, S. Automatic classification of land cover features with high resolution imagery and LiDAR data: An object-oriented approach. In Proceedings of the SSC2005 Spatial Intelligence, Innovation and Praxis: The National Biennial Conference of the Spatial Sciences Institute, September 2005; Spatial Sciences Institute: Melbourne, Auatralia, 2005; pp. 512–522. [Google Scholar]
  52. Verhagen, P.; Drăguţ, L. Object-based landform delineation and classification from DEMs for archaeological predictive mapping. J. Archaeol. Sci. 2012, 39, 698–703. [Google Scholar] [CrossRef]
  53. UAVSAR. Available online: https://uavsar.jpl.nasa.gov/cgi-bin/product.pl?jobName=Aguatc_03901_10014_009_100202_L090_CX_01#data (accessed on 1 October 2016).
  54. UAVSAR. Available online: https://uavsar.jpl.nasa.gov/cgi-bin/product.pl?jobName=Aguatc_31602_10014_011_100202_L090_CX_01#data (accessed on 1 October 2016).
  55. AIRSAR. Available online: https://airsar.asf.alaska.edu/data/ts/ts1789/ (accessed on 1 October 2016).
  56. Brennan, R.; Webster, T.L. Object-oriented land cover classification of LiDAR-derived surfaces. Can. J. Remote Sens. 2006, 32, 162–172. [Google Scholar] [CrossRef]
  57. Kim, S.b.; Ouellette, J.D.; van Zyl, J.J.; Johnson, J.T. Detection of inland open water surfaces using dual polarization L-band radar for the soil moisture active passive mission. IEEE Trans. Geosci. Remote Sens. 2016, 54, 3388–3399. [Google Scholar] [CrossRef]
  58. Matgen, P.; Hostache, R.; Schumann, G.; Pfister, L.; Hoffmann, L.; Savenije, H.H.G. Towards an automated SAR-based flood monitoring system: Lessons learned from two case studies. Phys. Chem. Earth Parts A/B/C 2011, 36, 241–252. [Google Scholar] [CrossRef]
  59. Giustarini, L.; Hostache, R.; Matgen, P.; Schumann, G.J.; Bates, P.D.; Mason, D.C. A change detection approach to flood mapping in urban areas using TerraSAR-X. IEEE Trans. Geosci. Remote. Sens. 2013, 51, 2417–2430. [Google Scholar] [CrossRef]
  60. Henry, J.B.; Chastanet, P.; Fellah, K.; Desnos, Y.L. Envisat multi-polarized ASAR data for flood mapping. Int. J. Remote Sens. 2006, 27, 1921–1929. [Google Scholar] [CrossRef]
  61. Lin, Z.; Kaneda, H.; Mukoyama, S.; Asada, N.; Chiba, T. Detection of subtle tectonic–geomorphic features in densely forested mountains by very high-resolution airborne LiDAR survey. Geomorphology 2013, 182, 104–115. [Google Scholar] [CrossRef]
  62. Razak, K.A.; Straatsma, M.W.; Van Westen, C.J.; Malet, J.; De Jong, S.M. Airborne laser scanning of forested landslides characterization: Terrain model quality and visualization. Geomorphology 2011, 126, 186–200. [Google Scholar] [CrossRef]
  63. Zielke, O.; Klinger, Y.; Arrowsmith, J.R. Fault slip and earthquake recurrence along strike-slip faults—Contributions of high-resolution geomorphic data. Tectonophysics 2015, 638, 43–62. [Google Scholar] [CrossRef]
  64. Shimoda, I.; Haraguchi, T.; Chiba, T.; Shimoda, M. The advanced hydraulic city structure of the royal city of Angkor Thom and vicinity revealed through a high-resolution Red Relief Image Map. Archaeol. Discov. 2015, 4, 22. [Google Scholar]
Figure 1. Map of the Pasión region showing the extent of the LiDAR coverage and the locations of archaeological sites.
Remotesensing 09 00563 g001
Figure 2. Laser shots per m2 measured as the number of first returns. Note that multiple test flights over the Ceibal center created strips of dense shots.
Remotesensing 09 00563 g002
Figure 3. Data used for vegetation classification, showing an area around the Ceibal Park. (a) Canopy Density Model (CDM). (b) Window averaged Canopy Height Model (CHM). (c) Window standard deviation Canopy Height Model (SD CHM). (d) Intensity Difference Model (IDM). (e) UAVSAR. (f) IKONOS. The object based image analysis (OBIA) classification primarily used LiDAR-derived data (CDM, CHM, SD CHM, and IDM). The UAVSAR data were used for the delineation of water, and IKONOS data were consulted occasionally.
Remotesensing 09 00563 g003
Figure 4. Flow chart of the OBIA vegetation classification steps.
Remotesensing 09 00563 g004
Figure 5. Comparison of visualization techniques of the LiDAR-derived DEM in pasture and low secondary vegetation. (a) Red Relief Image Map (RRIM). (b) Az. 315°/El. 45° hillshade. (c) Hillshade PCA. (d) Sky View Factor (SVF). (e) Slope gradient. (f) SVF (gray) and slope gradient (red) overlay. (g) Moving-window elevation difference. (h) Archaeological feature plots over RRIM.
Remotesensing 09 00563 g005
Figure 6. Comparison of visualization techniques of the LiDAR-derived DEM in rainforest. (a) Red Relief Image Map (RRIM). (b) Az. 315°/El. 45° hillshade. (c) Hillshade PCA. (d) Sky View Factor (SVF). (e) Slope gradient. (f) SVF (gray) and slope gradient (red) overlay. (g) Moving-window elevation difference. (h) Archaeological feature plots over slope gradient (structures = red circles; platforms = green squares; depressions = blue triangles). A causeway leading to a circular building is visible in all images.
Remotesensing 09 00563 g006
Figure 7. The results of the OBIA vegetation classification. Some areas exhibit straight edges because they correspond to divisions of land ownerships.
Remotesensing 09 00563 g007
Figure 8. Examples of vegetation types (photos Nasu, Ranchos, and Pinzón). (a) Northern edge of the Ceibal Park with rainforest, pasture, and milpa. (b) Undisturbed rainforest. (c) Uncut high secondary vegetation. (d) Partially-cut high secondary vegetation. (e) Uncut medium-high secondary vegetation. (f) Partially-cut medium-high secondary vegetation. (g) Low secondary vegetation. (h) High grass. (i) Milpa.
Remotesensing 09 00563 g008
Figure 9. Point cloud profiles of different vegetation types (Orange = ground points; green = vegetation points; grid in meters). (a) Undisturbed rainforest. (b) Uncut high secondary vegetation. (c) Uncut medium-high secondary vegetation. (d) Dense low secondary vegetation. (e) Dense high grass.
Remotesensing 09 00563 g009
Figure 10. LiDAR data of a forested area in a northern sector of Group C of Ceibal. (a) Red Relief Image Map (RRIM). (b) Az. 315°/El. 45° hillshade with an overlay of the Harvard map; circles and squares indicate structures and possible structures that are not in the Harvard map. (c) Elevation profile of structures and terrain with vertical exaggeration.
Remotesensing 09 00563 g010
Figure 11. LiDAR data of a pasture. (a) RRIM showing groups of structures. (b) View of the groups from south (photo Ranchos). (c) Archaeological feature plots over a Az. 315°/El. 45° hillshade. (d) Elevation profiles of structures with vertical exaggeration.
Remotesensing 09 00563 g011
Figure 12. LiDAR data of an oil palm plantation. (a) RRIM showing a probable group of structures. (b) View of an oil palm plantation (not the same area) (photo Nasu). (c) Point cloud profile showing palm trees and probable structures (Orange = ground points; green = vegetation points).
Remotesensing 09 00563 g012
Figure 13. 1 m raster indicating the counts of ground points/m2 for a northwestern sector of the Ceibal Park with rainforest and a close-up of an area. Areas along the upper and left edges of the left image are outside the park limits and include pastures, milpas, and low secondary vegetation. Note significant patches with no ground point in the regular flight area. In the area of test flights, occluded regions are smaller but still present.
Remotesensing 09 00563 g013
Table 1. Datasets used for the current and previous studies for the analysis of vegetation in the region.
DatasetAcquisitionHorizontal ResolutionCoverageUse
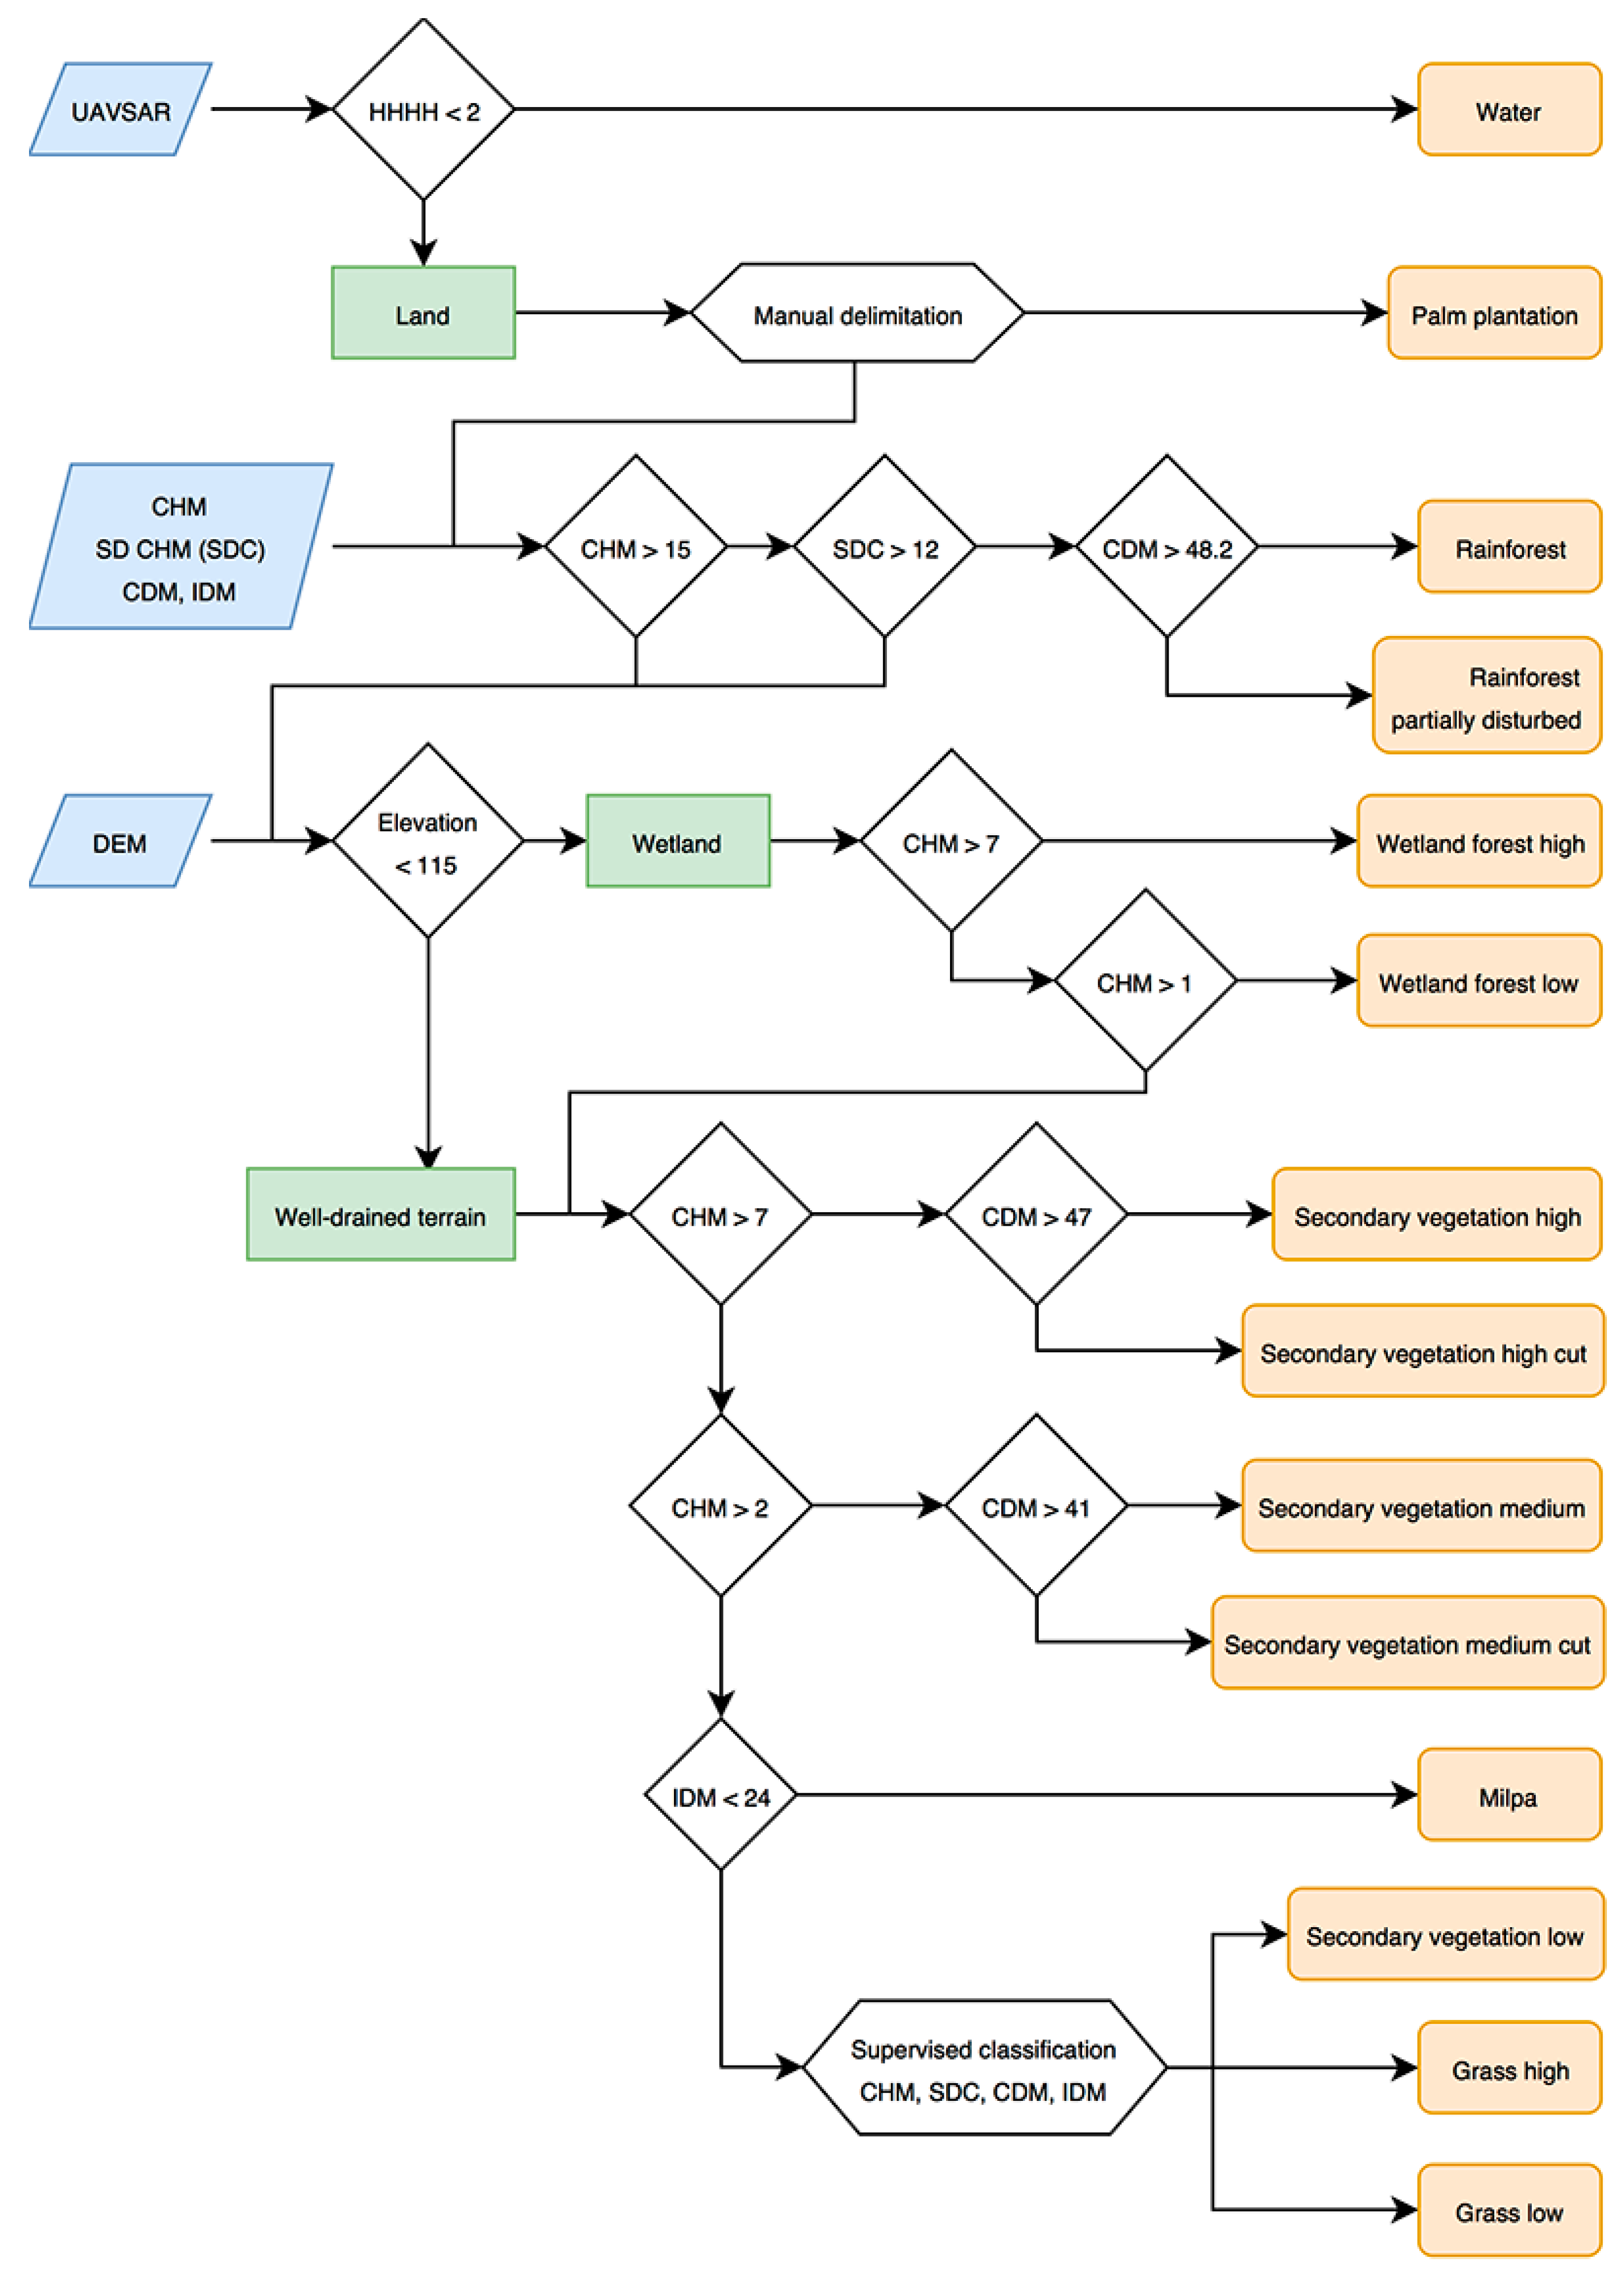
LiDAR-derived Canopy Density Model (CDM)20154 m441 km2OBIA (Classification of dense and sparse vegetation)
LiDAR-derived window averaged Canopy Height Model (CHM)20154 m441 km2OBIA (Vegetation classification by height)
LiDAR-derived window standard deviation of CHM (SD CHM)20154 m441 km2OBIA (Separation of rainforest and secondary vegetation)
LiDAR-derived Intensity Difference Model (IDM)20154 m441 km2OBIA (Primarily the identification of agricultural fields)
LiDAR-derived DEM20150.5 m460 km2OBIA (Delineation of wetlands)
Uninhabited Aerial Vehicle Synthetic Aperture Radar (UAVSAR)20106 m1637 km2 (439 km2 of the LiDAR area)OBIA (Delineation of water)
IKONOS2006 and 20074 m (red, green, blue, and NIR) and 1 m (panchromatic)104 km2 within the LiDAR areaPrevious studies and occasional comparison with OBIA
Orthophotos20060.5 mEntire LiDAR areaPrevious studies and occasional comparison with OBIA
Airborne Synthetic Aperture Radar (AIRSAR)20045 m452 km2 (254 km2 of the LiDAR area)Previous studies
Landsat 7 and 8Multiple dates30 m for most bandsEntire LiDAR areaPrevious studies
Table 2. Numbers of features identified in different visualizations of the LiDAR-derived DEM.
TechniquesStructuresPlatformsDepressions
Harvard map44N/AN/A
RRIM4948
Hillshade4648
PCA4648
SVF3538
Slope gradient4547
SVF + Slope g.4548
Moving-window ED3428
Table 3. The results of vegetation classification with the basic statistics of the LiDAR-derived data.
Vegetation TypeNoteArea (km2)CHM (m) 1STD CHM 1CDM 1IDM 1
MeanS.d.MeanS.d.MeanS.d.MeanS.d.
Rainforest 23.3021.566.9018.676.3048.891.9129.884.00
Rainforest partially disturbed 1.8816.866.6920.116.8246.755.1029.024.27
Secondary vegetation high12 to 30 years old. Includes disturbed rainforest.25.1111.165.0311.995.5847.584.5328.513.40
Secondary vegetation high cutIncludes reforested areas.4.839.075.2614.217.0141.209.9626.994.79
Secondary vegetation medium3 to 15 years old.26.394.252.706.683.4344.826.1326.942.75
Secondary vegetation medium cutIncludes reforested areas, orchards, cohune palm forests, and settlements with trees.21.033.103.629.815.5927.4512.9724.374.96
Secondary vegetation low1 to 10 years old. Includes very dense vegetation without LiDAR penetration and wetland grass.31.270.871.282.812.9035.359.0825.401.87
Grass highIncludes 1 year old recovery vegetation, densely covered agricultural fields, and wetland grass.50.510.411.172.103.1723.518.3525.421.73
Grass lowIncludes pasture, agricultural fields with low plants, and wetland grass.172.610.371.382.333.8612.778.4725.552.10
MilpaIncludes maize fields and open grounds.6.730.721.302.603.4324.068.8821.423.95
Palm plantation 10.670.471.481.603.1622.7411.0525.771.44
Wetland forest high 17.028.863.769.174.7447.453.7827.722.47
Wetland forest low 43.824.092.876.203.6044.298.3826.292.09
Water 6.160.622.272.695.487.3614.3825.431.02
1 The mean and standard deviation (S.d.) for each data category are calculated for the values of 4 m raster cells belonging to the category after the removal of anomalous values and the normalization to the 0–50 range.
Table 4. LiDAR canopy penetration statistics by vegetation type.
AreaShots/m2Return/m2Ground Return/m2Returns/ShotGround Return/ShotGround Return/Return
Vegetation Type
Areas without test flights
Rainforest17.0426.340.561.553.3%2.1%
Rainforest partially disturbed17.3527.491.641.589.4%6.0%
Secondary vegetation high15.8723.341.091.476.9%4.7%
Secondary vegetation high cut15.9424.073.911.5124.5%16.2%
Secondary vegetation medium16.9823.062.351.3613.9%10.2%
Secondary vegetation medium cut17.4722.208.871.2750.8%40.0%
Secondary vegetation low18.8320.585.831.0930.9%28.3%
Grass high19.4719.9910.101.0351.9%50.5%
Grass low18.2118.3712.791.0170.2%69.6%
Milpa19.0623.0611.141.2158.4%48.3%
Palm plantation17.9918.588.671.0348.2%46.6%
Wetland forest high17.6124.431.191.396.8%4.9%
Wetland forest low17.5921.782.191.2412.4%10.0%
Areas with test flights
Rainforest68.58126.232.841.844.1%2.3%
Rainforest partially disturbed72.13134.178.021.8611.1%6.0%
Secondary vegetation high61.80104.787.121.7011.5%6.8%
Secondary vegetation high cut56.87109.9319.491.9334.3%17.7%
Secondary vegetation medium cut51.8461.9327.621.1953.3%44.6%
Secondary vegetation low67.4571.8519.551.0729.0%27.2%
Grass high62.5268.7635.261.1056.4%51.3%
Grass low64.3768.4142.481.0666.0%62.1%
Milpa58.8776.6727.171.3046.2%35.4%
Wetland forest high68.45104.123.621.525.3%3.5%
Wetland forest low70.1788.197.301.2610.4%8.3%
Table 5. Ground-truthing results.
AreaLiDAR AnalysisGround-Truthing 1Accuracy 1
IdentificationCountTar.Pos.Dis.FieldDet.Fal.Fal.
Ver.Ver.IDedAcc.Pos.Neg.
Vegetation Type
Areas without test flights (low point density)
RainforestStructure950494812269%1%31%
Possible str.71766 100%0%0%
Rainforest partially disturbedStructure271091375%8%25%
Possible str.30
Secondary vegetation highStructure440413921770%4%30%
Possible str.281532 100%67%0%
Secondary vegetation high cutStructure971313 381%0%19%
Possible str.5066 100%0%0%
Secondary vegetation mediumStructure1711010 100%0%0%
Possible str.156
Secondary vegetation medium cutStructure608676251086%7%14%
Possible str.2631156 100%120%0%
Secondary vegetation lowStructure2272424 100%0%0%
Possible str.21522 100%0%0%
Grass highStructure6294040 1375%0%25%
Possible str.303963 100%50%0%
Grass lowStructure5336519497228885%4%15%
Possible str.1878724626 100%57%0%
MilpaStructure4932020 774%0%26%
Possible str.18122 100%0%0%
Palm plantationStructure157
Possible str.142
Wetland forest highStructure0
Possible str.0
Wetland forest lowStructure0
Possible str.2
Outside the classified areaStructure57377 750%0%50%
Possible str.15511 100%0%0%
Areas with test flights (high point density)
RainforestStructure40713121286%7%14%
Possible str.15411 100%0%0%
Rainforest partially disturbedStructure1811 100%0%0%
Secondary vegetation highStructure1499 100%0%0%
Secondary vegetation medium cutStructure655 100%0%0%
Possible str.1
Secondary vegetation lowStructure544 100%0%0%
Possible str.2
Grass highStructure282121 100%0%0%
Possible str.3
Grass lowStructure12541180%20%20%
MilpaStructure1088 280%0%20%
Possible str.5
1 Tar. ver. = Features identified in the LiDAR data and targeted for ground verification. Pos. ver. = Positively verified. Dis. = Discarded (not structures). Field IDed = features not detected in LiDAR data but identified in the field. Det. acc. = Detection accuracy (Pos. ver./[Pos. ver. + Field IDed]). Fal. pos. = False positive rate (Dis./[Pos. ver. + Field IDed]). Fal. neg. = False negative rate (Field IDed/[Pos. ver. + Field IDed]).

