
High-Rise Building Layover Exploitation with Non-Local Frequency Estimation in SAR Interferograms


1
School of Geosciences and Info-Physics, Central South University, Changsha 410083, China
2
Department of Land Surveying and Geo-Informatics, Hong Kong Polytechnic University, Hong Kong, China
*
Author to whom correspondence should be addressed.
Remote Sens. 2017, 9(6), 579; https://doi.org/10.3390/rs9060579
Submission received: 22 May 2017
/
Revised: 22 May 2017
/
Accepted: 7 June 2017
/
Published: 10 June 2017
(This article belongs to the Section Remote Sensing in Geology, Geomorphology and Hydrology)
Abstract
:The wide application of high-resolution SAR data, such as TanDEM-X and TerraSAR-X, has resulted in an increase of the data processing difficulty of interferograms, especially in urban areas with serious layovers caused by high-rise buildings. In this paper, a new method based on frequency estimation is proposed to extract and compensate the building layover phase without considering the building structure. We use a non-local algorithm to estimate the high-accuracy frequency in the range direction, which is utilized to extract the layover areas of a building. Then, a two-step method for estimating local frequencies is used for layover phase removal. Efficient frequency estimation and building extraction is demonstrated on real data in comparison with traditional methods. The results of the removal approach with both simulated and real TanDEM-X and TerraSAR-X images are presented to prove the potential of the method.
1. Introduction
The increased resolution of the new generation of SAR satellites such as TerraSAR-X, TanDEM-X, and COSMO-SkyMed offers the opportunity for urban measurement. Compared to ERS (20 m), ENVISAT (20 m) and Radarsat-2 (3 m), the resolution of the data acquired by these modern SAR sensors have been able to reach metric or sub-metric level. For instance, the TerraSAR-X launched in 2013 under staring spotlight mode is able to capture images with a resolution of 0.25 and 0.8 m in the azimuth and range directions, respectively. These high-resolution SAR images provide more information about ground objects. Micro-reliefs (such as rocks, buildings, etc.) that cannot be observed in low-resolution images, can be observed in these high resolution SAR images. Detailed information is expected to widen the data applications but also increase the difficulty and complexity of data processing. For example, interferograms of urban areas always have serious layovers in high-rise buildings areas. The signal superposition in a single pixel generally introduces great difficulties in the recognition and analysis of object features in these areas [1,2]. The generation of a DEM from a single interferogram requires phase unwrapping as an essential step towards the final products. However, this procedure often performs incorrectly when it is applied to urban areas because of the complex topography and discontinuities of building layover. Furthermore, the D-InSAR (detection of ground deformation with differential InSAR) technique needs DEM to remove associated terrain fringe patterns. However, the existing free DEM such as SRTM can only reach a resolution of 30 m and does not contain building information. Additionally, the building information cannot be recovered without additional acquisitions viewed from the opposite direction due to shadows and layover. Thus, the residual phase of buildings cannot be removed completely by the D-InSAR technique. This hinders further processing and analysis of the interferogram. Although in Persistent Scatterer Interferometry (PSI) technology, the residual topographic error related to buildings can be estimated by analyzing a stack of interferograms, the building layover is still problematic when processing a single interferogram.
Existing researches mainly focus on building parameters (length, height and direction) estimation and 3-D reconstruction from InSAR images under regular structures (e.g., cuboids and prisms) [3,4,5,6]. Zhang et al. extracted the edges and lines of buildings from the amplitude data [7]. Feng et al. proposed a method using only a single image for building reconstruction, in which the building structure elements are recovered with the intensity information [8]. Thiele et al. used both the interferometric phase and amplitude data to extract building layover and estimate building parameters [5]. Rossi et al. calculated the number of occurrences of pixels in the image during the geocoding stage in the InSAR processor and the layover extraction was achieved by processing the mapping counter. A further exploitation was conducted to calculate the principal slope of the layover patch by using the local frequency [2]. The limitation of these approaches is that the image intensity is not always stable as it depends on the structure and materials of a building. In addition, the target buildings in these methods are distributed independently and with simple structures, which can avoid overlapping. However, urban areas are always characterized by complex structures and the dense distribution of buildings, thereby making building detection extraordinarily difficult.
Therefore, in this paper, we propose a bottom-up method to detect building layovers from an InSAR image based on local frequency without requiring complementary information. Furthermore, we attempt to remove building layover from the interferogram, which has not been achieved yet in a single interferogram scheme. Firstly, the features of building layover in InSAR signature are discussed. The building layover is detected in the range frequency domain and the non-local strategy is applied to estimate the high-accuracy frequency results. A two-step frequency estimation approach is applied to remove the high-density (HD) fringe pattern of buildings from the low-density (LD) fringe pattern of the terrain phase. This is ultimately expected to improve the phase unwrapping result for a single interferogram in urban areas and will be investigated as part of our future work. Our method attempts to utilize the potential of the fringe frequency to process building information. The experimental results using both simulated and real data show that this proposed method can effectively detect and remove the building layover in interferograms.
2. Building Signature
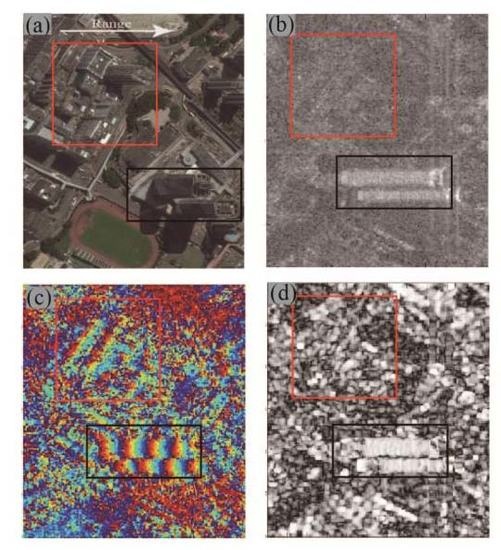
As shown in Figure 1, after being generated by a pair of co-registered SLC images, the signature of buildings shows different characteristics in such images of: intensity (Figure 1b), interferometric phase (Figure 1c), and coherence (Figure 1d). The region we chose contains several medium-rise buildings to demonstrate the complexity of practical buildings in most urban situations. The sub-image is cut from a TerraSAR-X image of Hong Kong with a resolution of 1.36 m × 2.02 m (slant range × azimuth). The height of ambiguity here is 20 m.
The intensity directly relates to the reflectivity, which is a physical parametric of ground objects [9]. Thus, every kind of material causing scattering within the resolution cell can affect the intensity. In the given example (Figure 1b), the two high-rise buildings located in the black box show clear outlines and high intensity. However, the layover of these buildings characterized by a linear pattern is not homogeneous in every pixel. This is mainly caused by the difference between the material with which the windows and the walls are constructed. On the other hand, the buildings in the red box can hardly be distinguished from their neighborhood, because of the dense cluster of buildings. Hence, even for one building, the layover appearance in intensity image is not homogeneous [2]. Therefore, by using intensity-driven adaptive neighborhoods (IDAN), an irregular window generates a biased estimation of the local frequency in regions that contain only few adjacent similar pixels [10]. Furthermore, it is difficult to use only intensity information to obtain ideal layover detection results [5].
In phase images, the signature is caused by the differences of the distance between the surface objects and the sensor, rather than the materials of objects. As shown in Figure 1c, in the layover area of high-rise buildings (black box), the phase fringes characterized by a linear ramp are consistent with a descending slope in the range direction along the building facades. The ramp has a constant gradient corresponding to the vertical wall face in relation to the sensor. Owing to the side-looking imaging geometry of SAR sensors, the orientation of the phase fringe in layover area is the same with the range direction. Hence, these phase fringes are well visible. However, the dense cluster of buildings leads to signature aliasing of the phase and this decreases the coherence. For example, in the red box in Figure 1c, only a part of the phase fringe can be recognized in the layover area. This also increases the difficulty of information extraction.
Coherence is an important index of interferometry that directly corresponds to the quality of phase. Therefore, the layover area of high-rise buildings has high coherence when the phase of wall is dominant in layover patch, and this can be easily observed in skyscrapers. The shadow areas have low coherence due to the strong phase noise.
In our context, to deal with the building information in interferograms, reliable estimation of phase gradient is necessary. Previous approaches based on local frequency estimation have been proved to be efficient in InSAR processing such as phase unwrapping and coherence estimation [11,12].
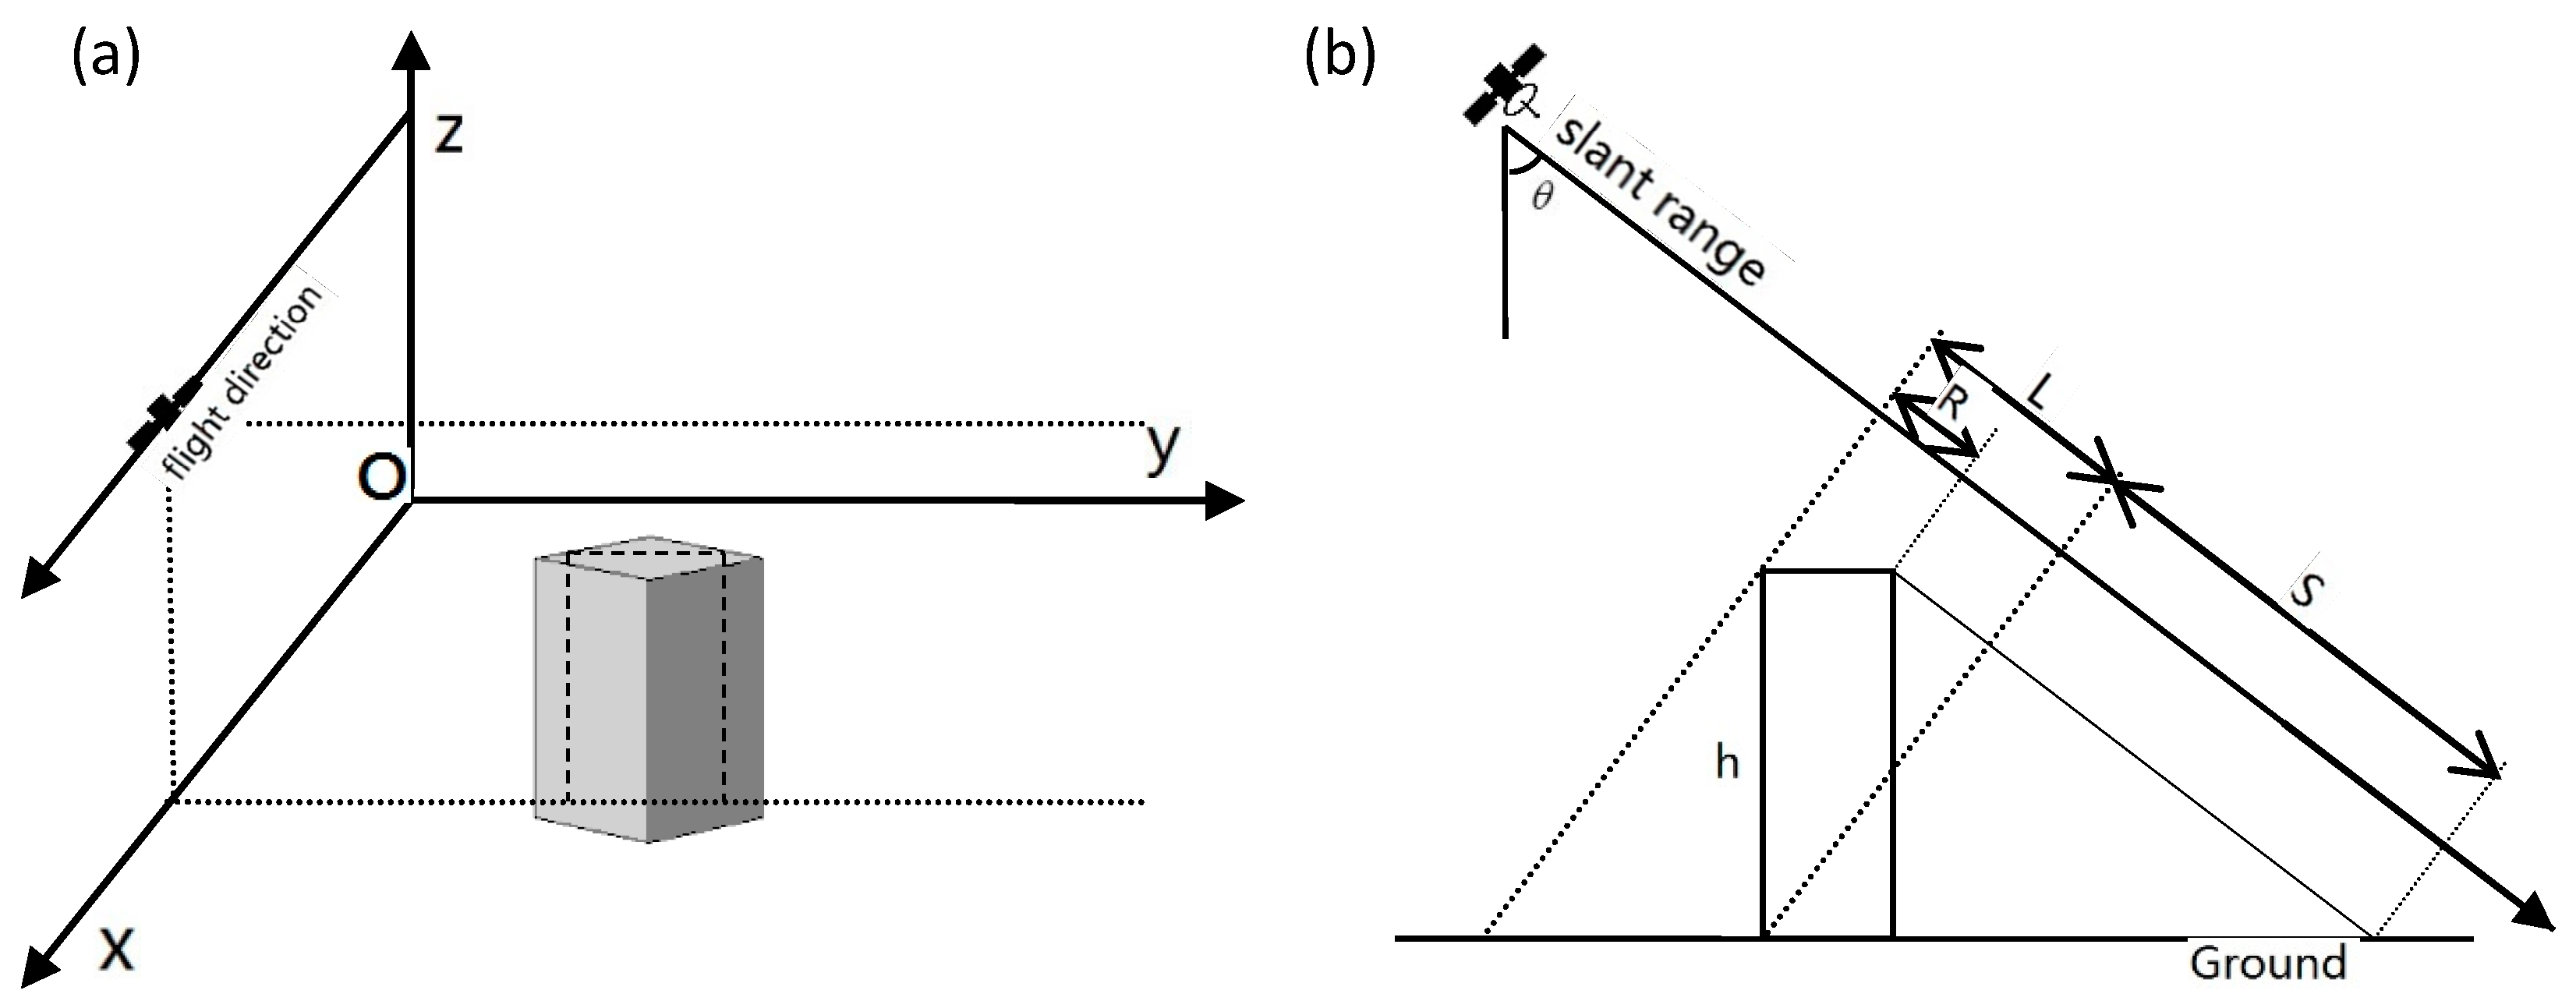
In interferograms, due to the oblique side-looking imaging geometry of SAR sensors, the phase slope derived from the building altitude in InSAR images is only reflected in the range direction [5]. As indicated in Figure 2a, x, y, and z represent the azimuth, horizontal, and vertical direction, respectively. In Figure 2a, the thick dashed line represents the scattering features of buildings in SAR images (see details in Figure 2b). Assuming in Figure 2a building with a flat roof and vertical walls is well separated from the other buildings, in which case the fringe frequency of building layover is only related to three parameters, the height of ambiguity, the incidence angle, and the pixel resolution in the range direction [1]. Then, the ideal frequency in the range direction can be obtained from:
where is the assumed height of ambiguity, d is the pixel resolution in the range direction, and is the incidence angle. Equation (1) indicates that, for high-rise buildings with a vertical wall in an interferogram, the layover phase has the same local frequency in the range direction. This is the reason for computing the building height based on extraction of the layover length [5]. Naturally, building overlays, uneven roof surfaces, and complicated ground surfaces in real urban areas can be expected to change the frequency characteristics of layover. However, the local frequency in layover can still be distinguished due to the huge difference in the slope between the building and the terrain. Therefore, it is valid to extract a building layover patch using local fringe frequency estimation.
3. Proposed Methodology
In this section, the crucial steps of building layover extraction are discussed. Then, we propose an approach to eliminate building layover based on the results of targeted layover area. Finally, we provide the workflow of the proposed approach. To guarantee the effectiveness of our method, this study focuses on the high-rise buildings that have a dominant signal of wall in interferograms.
3.1. Local Frequency Estimation and Building Layover Patch Detection
Current approaches, such as MUISC and maximum likelihood, basically use rectangular sliding windows to estimate the local frequency [13,14]. They also test a group of different subwindows to determine the best size of the window [12,15]. These methods are based on the assumption that the pixels within the window are uniformly distributed. If the texture and edge pixels within in the window are calculated with the same criteria, this assumption will cause loss of information and resolution [13]. The method proposed by Gabriel et al. measures the local frequency with an irregular window defined by the IDAN [13]. The autocorrelation function in the approach provides a way to analyze the local frequency of discontinuous phase signals. This method has been successfully used in estimating the 2-D local frequency without losing resolution. However, because of its intensity-driven constraint, the results introduce high variance in regions with unstable intensity.
In this paper, we propose to improve the frequency estimation approach by using the non-local strategy to choose homogeneous pixels. Buades et al. first proposed the theory of non-local means and applied it to image denoising [16]. Deledalle et al. introduced the non-local means into the InSAR parameter estimation [10]. The key step of this method is to calculate data-driving weights from similarity patches between the center pixel and each pixel in the searching window. It is valid to ensure that the pixels with the same statistical property as the center pixel in the window can obtain higher weights. Hence, to improve the local frequency information, we define the irregular window by choosing a set of pixels with high weights, which is adapted to the scale and the feature of the local structure. Detailed algorithm concerning non-local estimation can be found in the paper by Deledalle et al. [10].
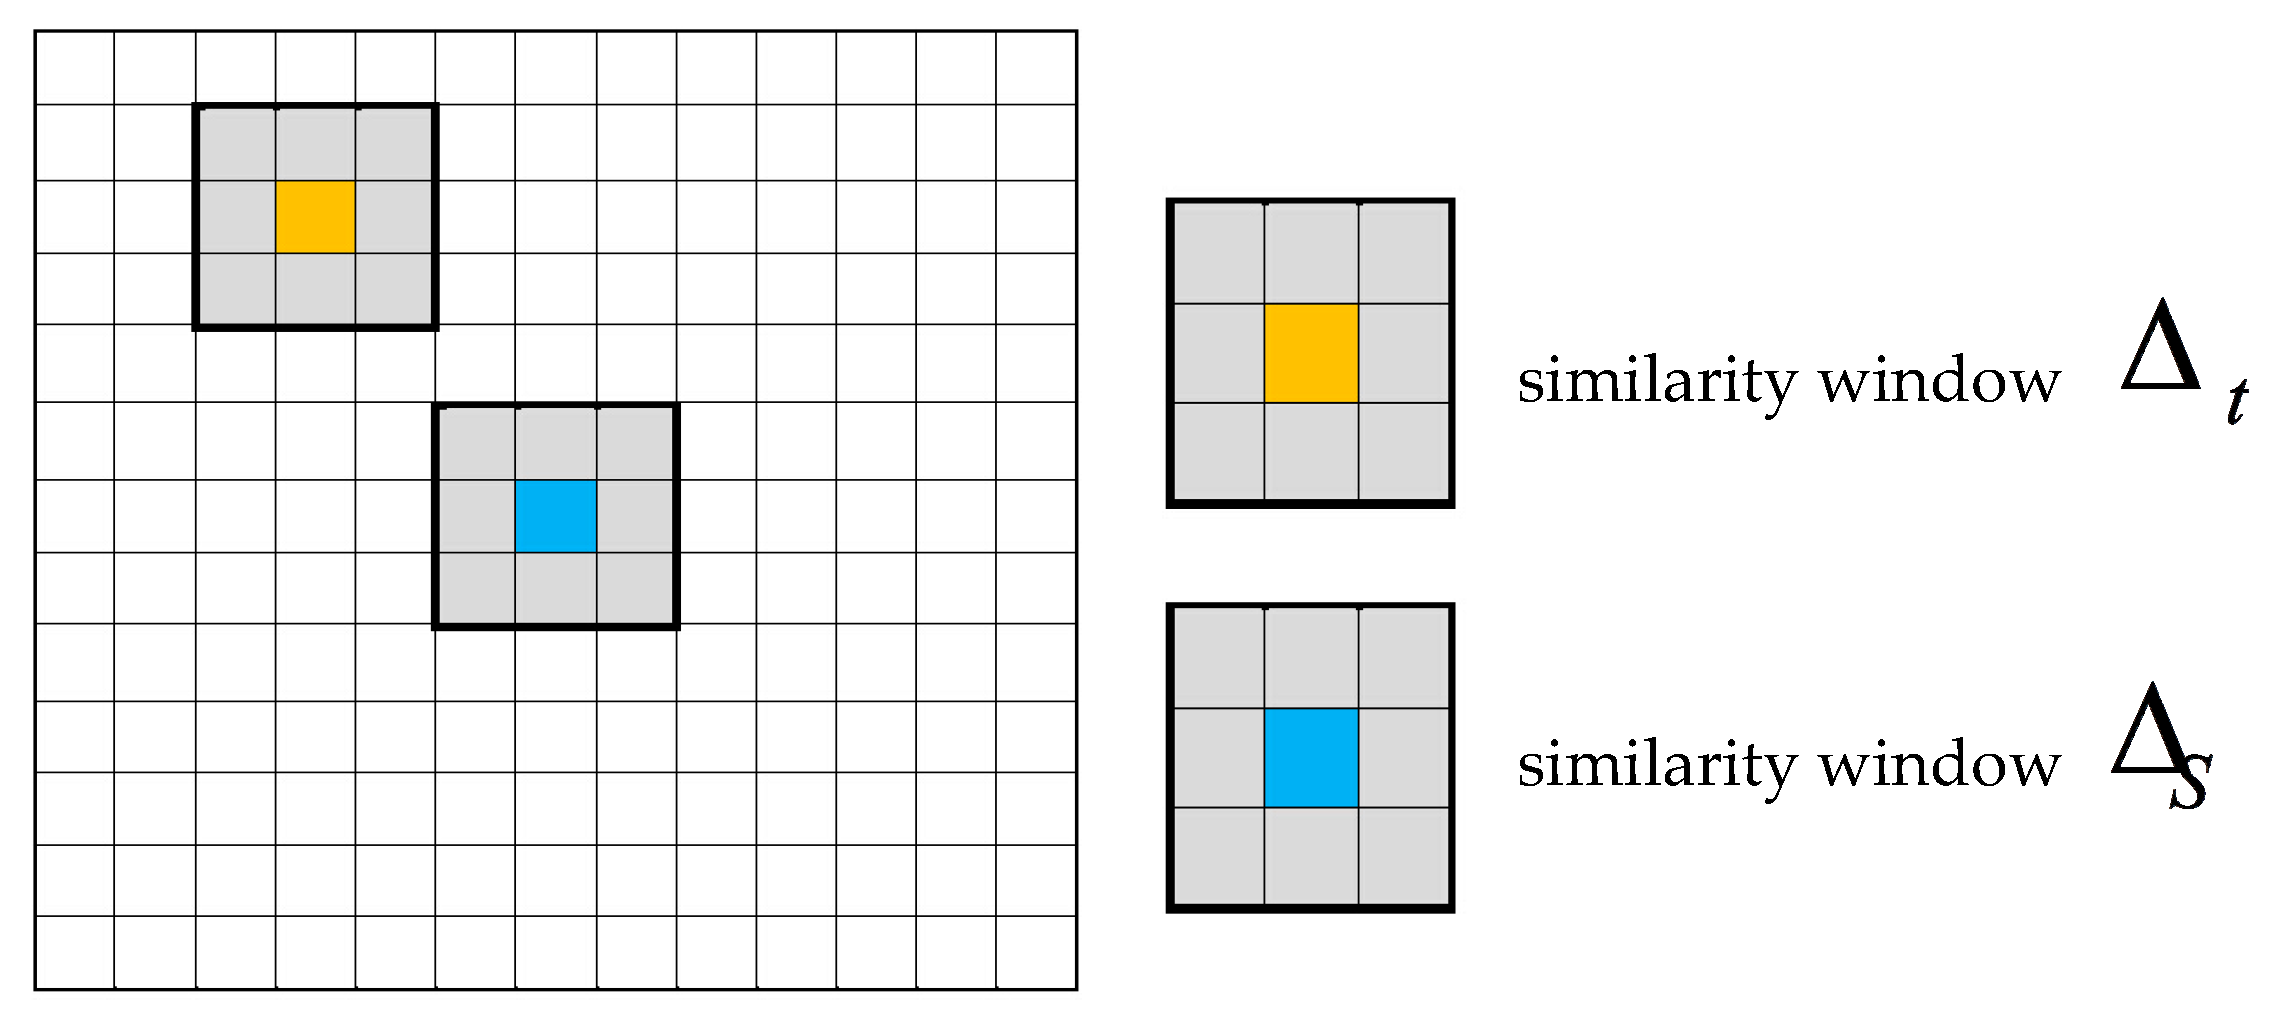
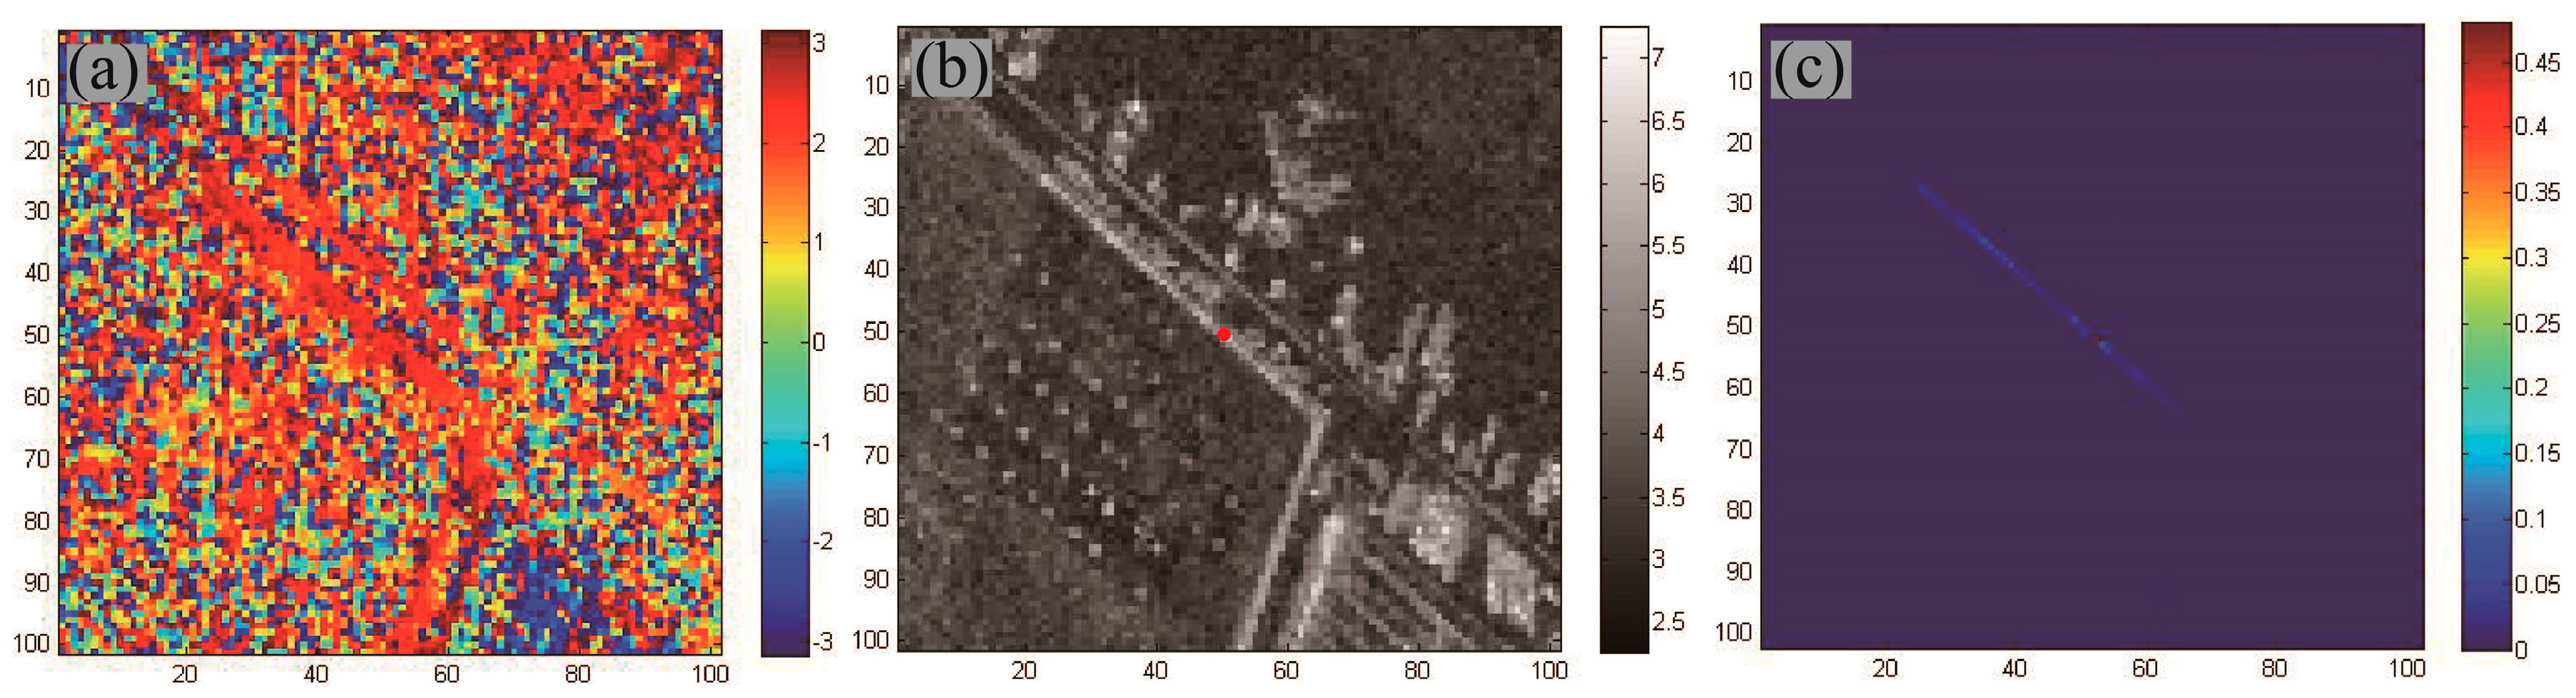
The building detection begins with the 2-D local frequency estimation for the whole scene. As shown in Figure 3, a square searching window is set centered at each pixel in the image. For every pixel t in , the weight obtained by comparing the two patches and is calculated and sorted in the order from high to low. The weight of the two patches is obtained by the method detailed in Deledalle et al. 2011 [10]. The size of in this study is set as 19 × 19 and the patch size is 3 × 3. As shown in Figure 4c, the pixels on the building edges have higher weights as the reference point, whereas the weights of pixels from non-homogeneous areas remain low.
To determine the irregular window, a threshold needs to be set to separate pixels with high similarity values. Hu et al. proposed a method to determine the threshold adaptively [17]. A user-selected homogeneous area and a heterogeneous area were sampled and their similarity values were calculated. The two probability density functions of the similarity values are then used to determine the threshold T. Thus, all pixels with weights higher than T were selected as homogeneous pixels to estimate the frequency by the following equation [13]:
where denotes the autocorrelation function, and denotes the delay of the location between and . That means the pixel pairs in the irregular window are selected by the coordinate difference to perform correlation calculation. Finally, the local frequency in the range direction is given as follows:
where N denotes the number of phases that are delayed. However, there is a mass of residuals caused by phase noise in the frequency result of the proposed method, especially in decorrelation areas, such as water. The drastic changes in the decorrelation phase often cause the local frequency to approach the extrema (0.5, −0.5) of the estimator [13]. These residuals, which are much greater than the local frequency in the layover area, have to be removed in order to decrease the difficulty of segmentation. The residuals are removed by filtering the result by the threshold set by an ideal frequency obtained from Equation (1). For instance, if the ideal frequency evaluates to −0.0818, we set 0.1 as the threshold and the frequency with a higher absolute value than the threshold will be set to zero. The results are presented in the experimental section. In the segmentation step, the building layover patches can be easily extracted by setting a threshold. However, it is necessary to set the threshold manually based on different datasets. Therefore, we used the K-Means method to classify the results [1] and used K = 3 as the ideal value to obtain the desired result. After removing the residuals and segmentation, the binary image of the building layover patch still contains much noise. In this case, morphological opening in the range and azimuth direction is used to obtain the final classification result. In addition, the parameters of the morphological opening were set manually according to the datasets.
3.2. Layover Removal
In urban areas, each wall of the building is usually perpendicular to the horizontal plane, leading to a much higher slope than the topography. Consequently, the fringe pattern density of a high-rise building is larger than that of the neighboring areas. Therefore, the building phase signal consists of two components:
- (1)
- The LD phase, corresponding to sparse fringe patterns of the topography.
- (2)
- The HD phase, corresponding to the dense fringe pattern generated by the high-rise building. This is a superposition of the phase fringe contained by the layover, roof, and possible overlay of buildings.
The original phase signal can be defined as
where is the phase noise. The LD and HD components are associated with the spatial resolution of the fringe pattern, rather than the segmentation of the frequency domain [13].
3.2.1. LD Frequency Estimation
To guarantee the precision of layover removal, the compensation of underlying terrain phase (LD phase) in layover patches is needed. However, several phases with different frequencies overlap in layover areas. It is a superposition of the signals of layover, roof and the ground. In this case, using only the information in layover patch to achieve phase decomposition for the above components is impossible with a sole interferogram. However, the LD phase can still be estimated by the neighborhood of these patches. It can be accomplished by using 2-D local frequency estimation such as MUISC and maximum likelihood [12,18,19]. Thus, in the first step of the proposed method, the terrain fringe pattern corresponding to the LD phase is removed based on a modified version of the Maximum-Likelihood Estimation (MLE). MLE is a traditional approach to detect peaks by performing a 2-D Fourier transform in a sliding rectangular window, in which the quantization effect of the 2-D Discrete Fourier Transform (DFT) generates high variance in the result. Hence, we used a Chirp-Z transform to achieve interpolation, which can decrease the sampling interval in the main lobes of the spectrum and thereby improve the estimation precision. In the layover area p(m, n), the local frequency result of the LD phase can be calculated by the following steps:
Step 1: Select a rectangular window W centered on pixel (m, n), and use the 2-D FFT to transform the signal in the window into the frequency domain. Preliminary estimation result can be obtained through peak detection in the spectrum.
Step 2: Apply a 128 × 128 Chirp-Z transform centered on to calculate the spectral offset. The final estimation result can be expressed by
Then, in each pixel of the building layover, the terrain fringe is simulated and removed from the surrounding pixels (k, l) by the following function:
where N is the sample number and is the constant phase in the subwindow calculated by (7).
For the signal in the analysis window, only one dominant frequency with the maximum amplitude in the frequency domain can be estimated by MLE [20]. Consequently, the size of the analysis window has a direct impact on the accuracy of frequency estimation. More specifically, a small window generates a bias result distorted by the building layover fringe pattern, whereas an overlarge window introduces mismatches of the terrain fringe pattern compared with the neighborhood. In order to ensure the result can fit the frequency of adjacent areas and recover as much real terrain as possible, we compute the optimal size of the window from the result in Section 3.1. Firstly, we set subwindows with the size of 7 × 7 centered on each pixel, which belongs to the building layover in the binary image, and calculate the proportion of pixels which do not belong to layover (pixels with the value 0 in binary image). When the ratio is less than the threshold, the window expands by one pixel to recalculate the ratio. The expansion of the window is iterated until either the proportion exceeds a predefined limit or the window reaches the maximum size we specify. Based on the result of the building layover patch, the number M of pixels in the maximum layover patch can be easily obtained. Hence, the maximum window size is set according to M and the proportion coefficient. For instance, the value of M in our experiment is about 1600. As the proportion coefficient is set to 0.8, the maximum size of the window is calculated from the square root of M/(1 − 0.8). Thus, we set the maximum size of the window as 91 × 91 in this experiment.
3.2.2. HD Frequency Estimation
After the terrain phase is removed, still contains and as denoted in Equation (4). According to the characteristics of the phase in the building layover such as the constant orientation and slope, the pixels in the small homogeneous region within the building layover patch are assumed to originate from the same statistical population. In order to extract and remove precisely, the non-local strategy described in Section 3.1 was used in the second step of frequency estimation. Contrary to the method applied for layover detection, the frequencies in both the range and azimuth directions need to be estimated. Then is removed based on Equation (7). The final result was obtained by summing the terrain phase and the phase residual .
3.3. Workflow
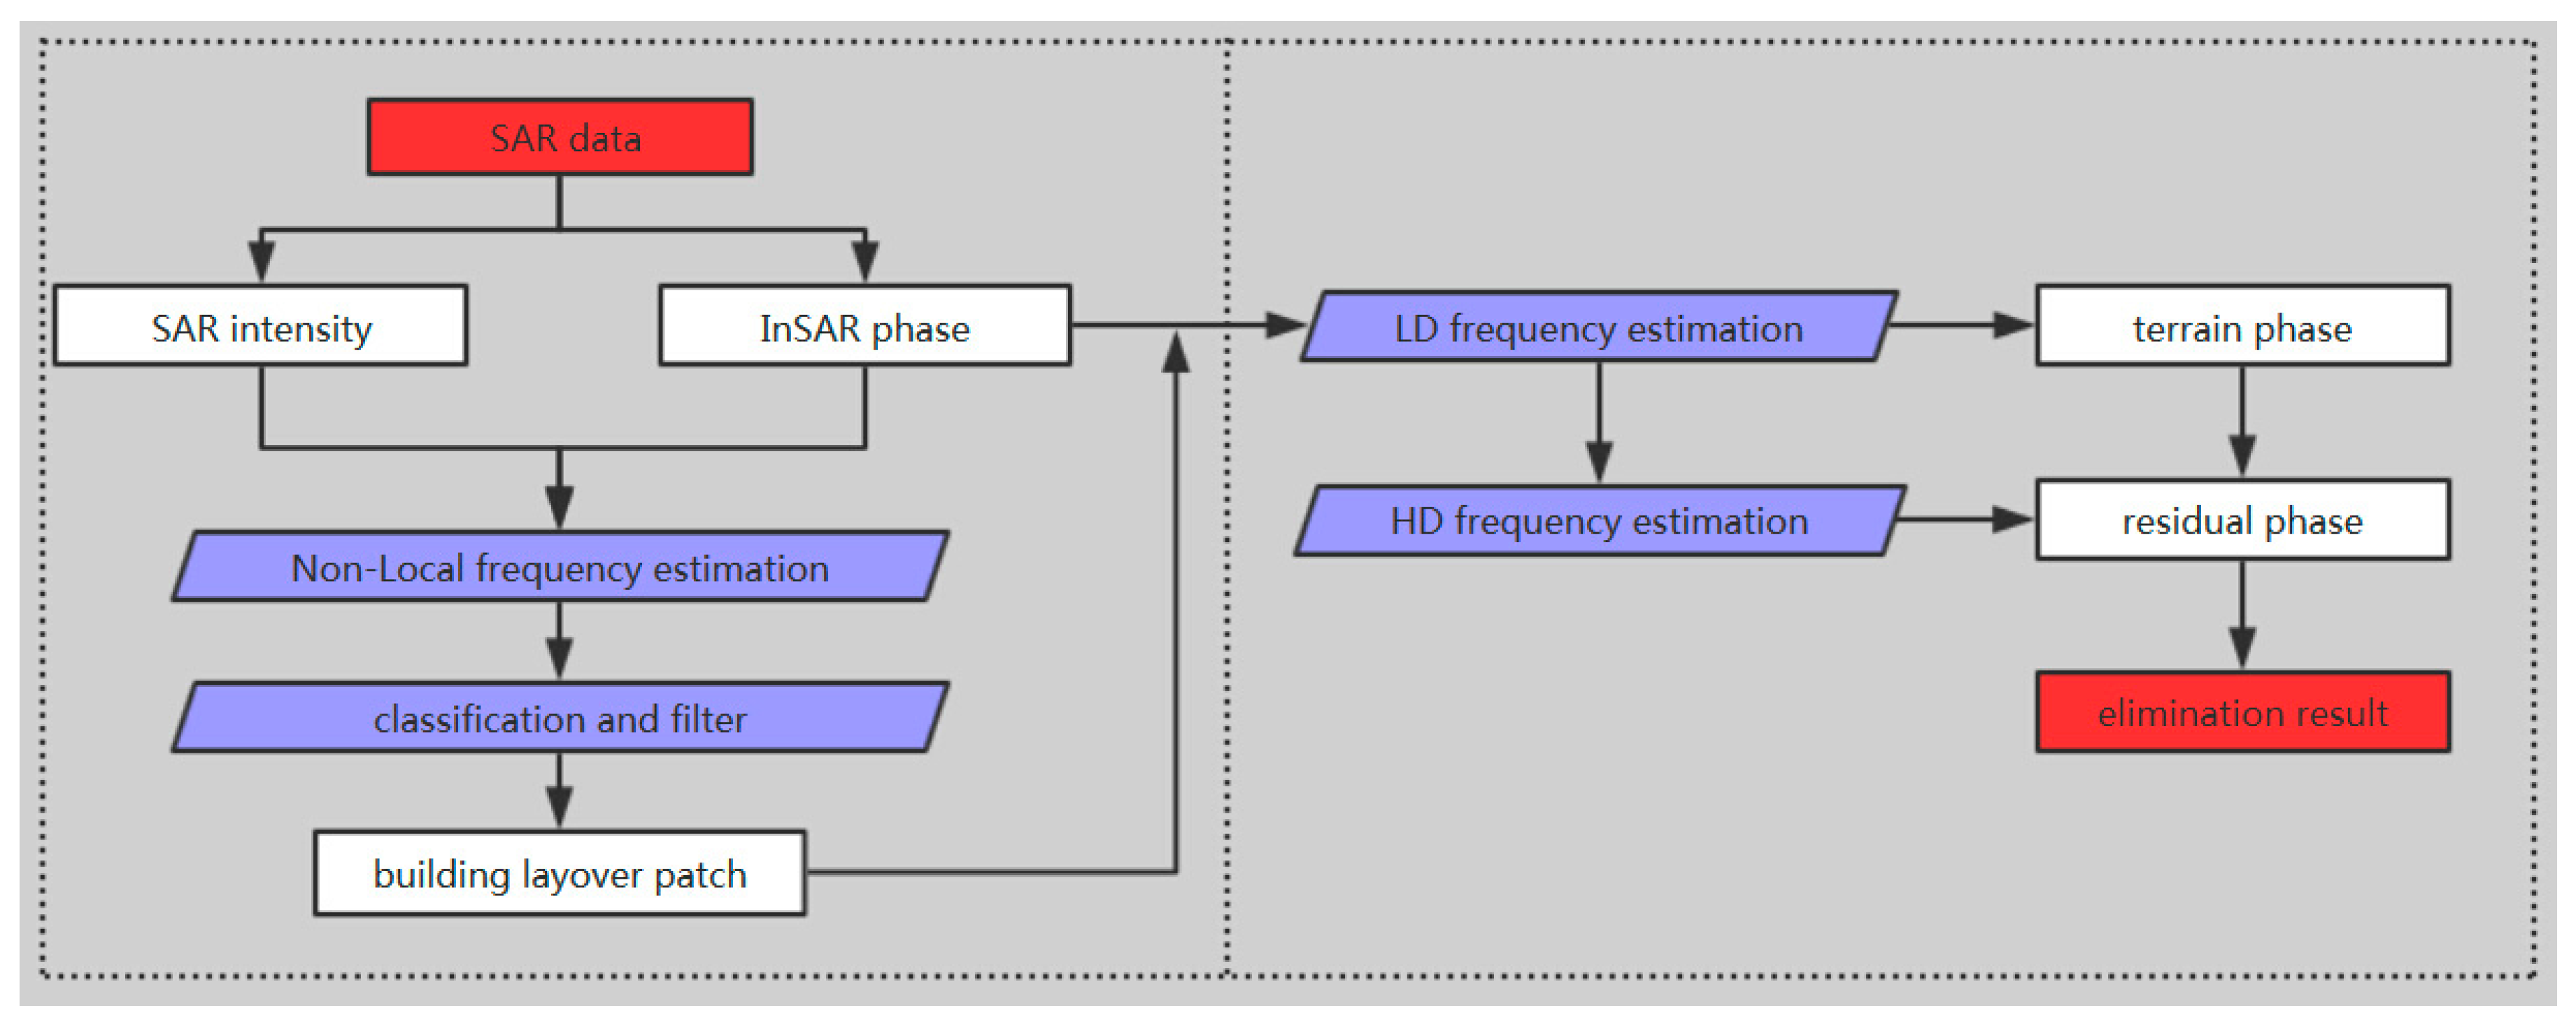
As shown in Figure 5, the proposed method is composed of two main parts: building layover patch detection and removal.
- (1)
- First, the interferogram provided by two co-registered SLC images is used to calculate the local frequency in the range direction. An improved estimation method using a non-local strategy is proposed to obtain a high-accuracy result and preserve the edge of the building layover. The final output is obtained by applying a classification method and morphology filtering.
- (2)
- Second, a two-step method is applied to eliminate building layover phases. We estimate the main terrain fringe pattern with an adaptive boxcar window. After these fringe patterns are removed, the non-local algorithm is used to estimate the secondary frequency produced by the phase of the building. We obtain the final result by removing the associated phase of the building from the initial interferogram.
4. Experiments and Discussion
In this section, we first specify the SAR data sets that were used, after which the procedure of the proposed method is expounded in detail.
4.1. Test Data
In this study, a pair of SAR images acquired by TerraSAR-X/TanDEM-X in the bi-static mode was selected for the verification experiment. The images were acquired over an area of Hong Kong and the parameters are listed in Table 1. As this dataset in the bi-static mode was almost simultaneously acquired, the error resulting from atmospheric delay and temporal decorrelation in this interferogram can be completely ignored. In order to show details of the test results, two sub-images covering Tung Chung near the Hong Kong international airport and Tsing Yi in Kowloon were cropped from the interferogram. The optical images of the target areas (Figure 6a,b) show many high-rise buildings and different terrains. The maximum altitude of the buildings is more than 150 m. Because the height of ambiguity is 20 m, we can see relatively dense fringes due to building layover in the interferograms (Figure 6c,d). In addition, due to the wall dominance in the buildings with an irregular distribution, the overlaying fringes increases the difficulty of data processing [2]. As shown in Figure 6a, the terrain around the buildings almost has no altitude difference and the fringe patterns of buildings are separate from those of mountain areas. On the contrary, the buildings in Figure 6b are located on the ridge of the mountain; hence, the fringe patterns of the ground and buildings overlap with each other in the interferogram. These two areas have rather different and typical characteristics of the areas surrounding the buildings; thus, the datasets were chosen for the sake of assessing the performance and the applicability of our method.
4.2. Non-Local Frequency Estimation
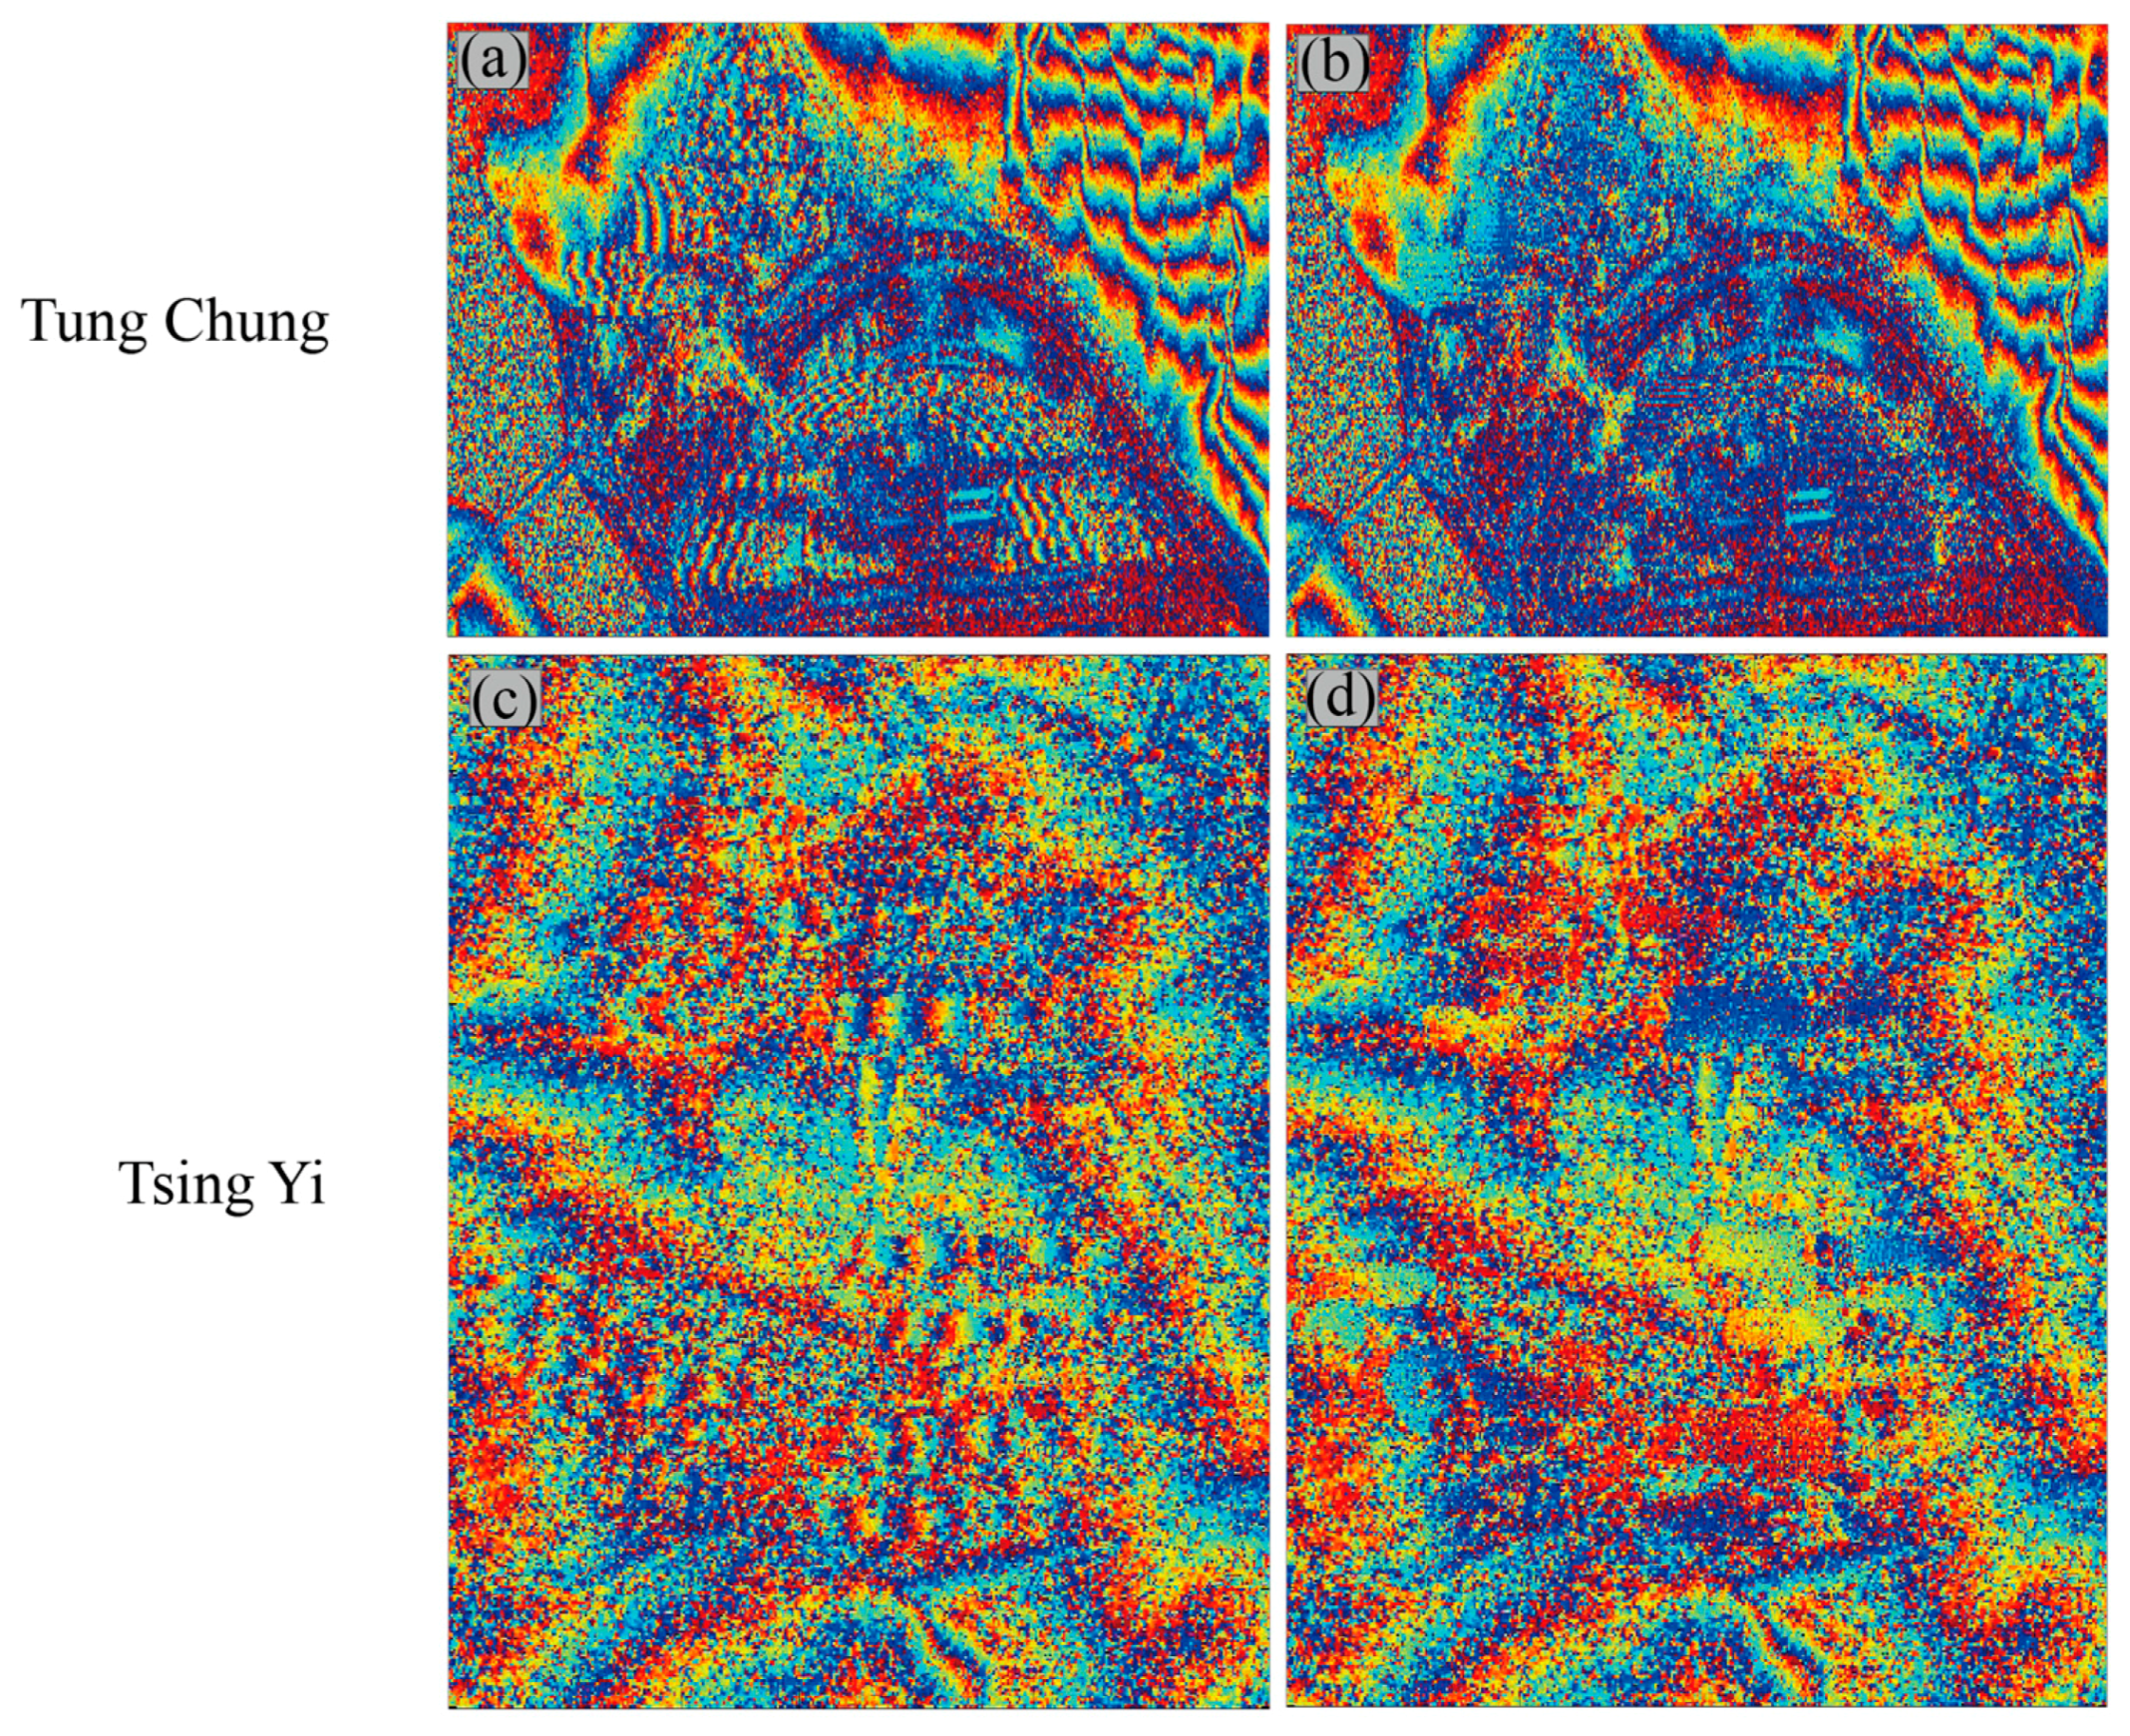
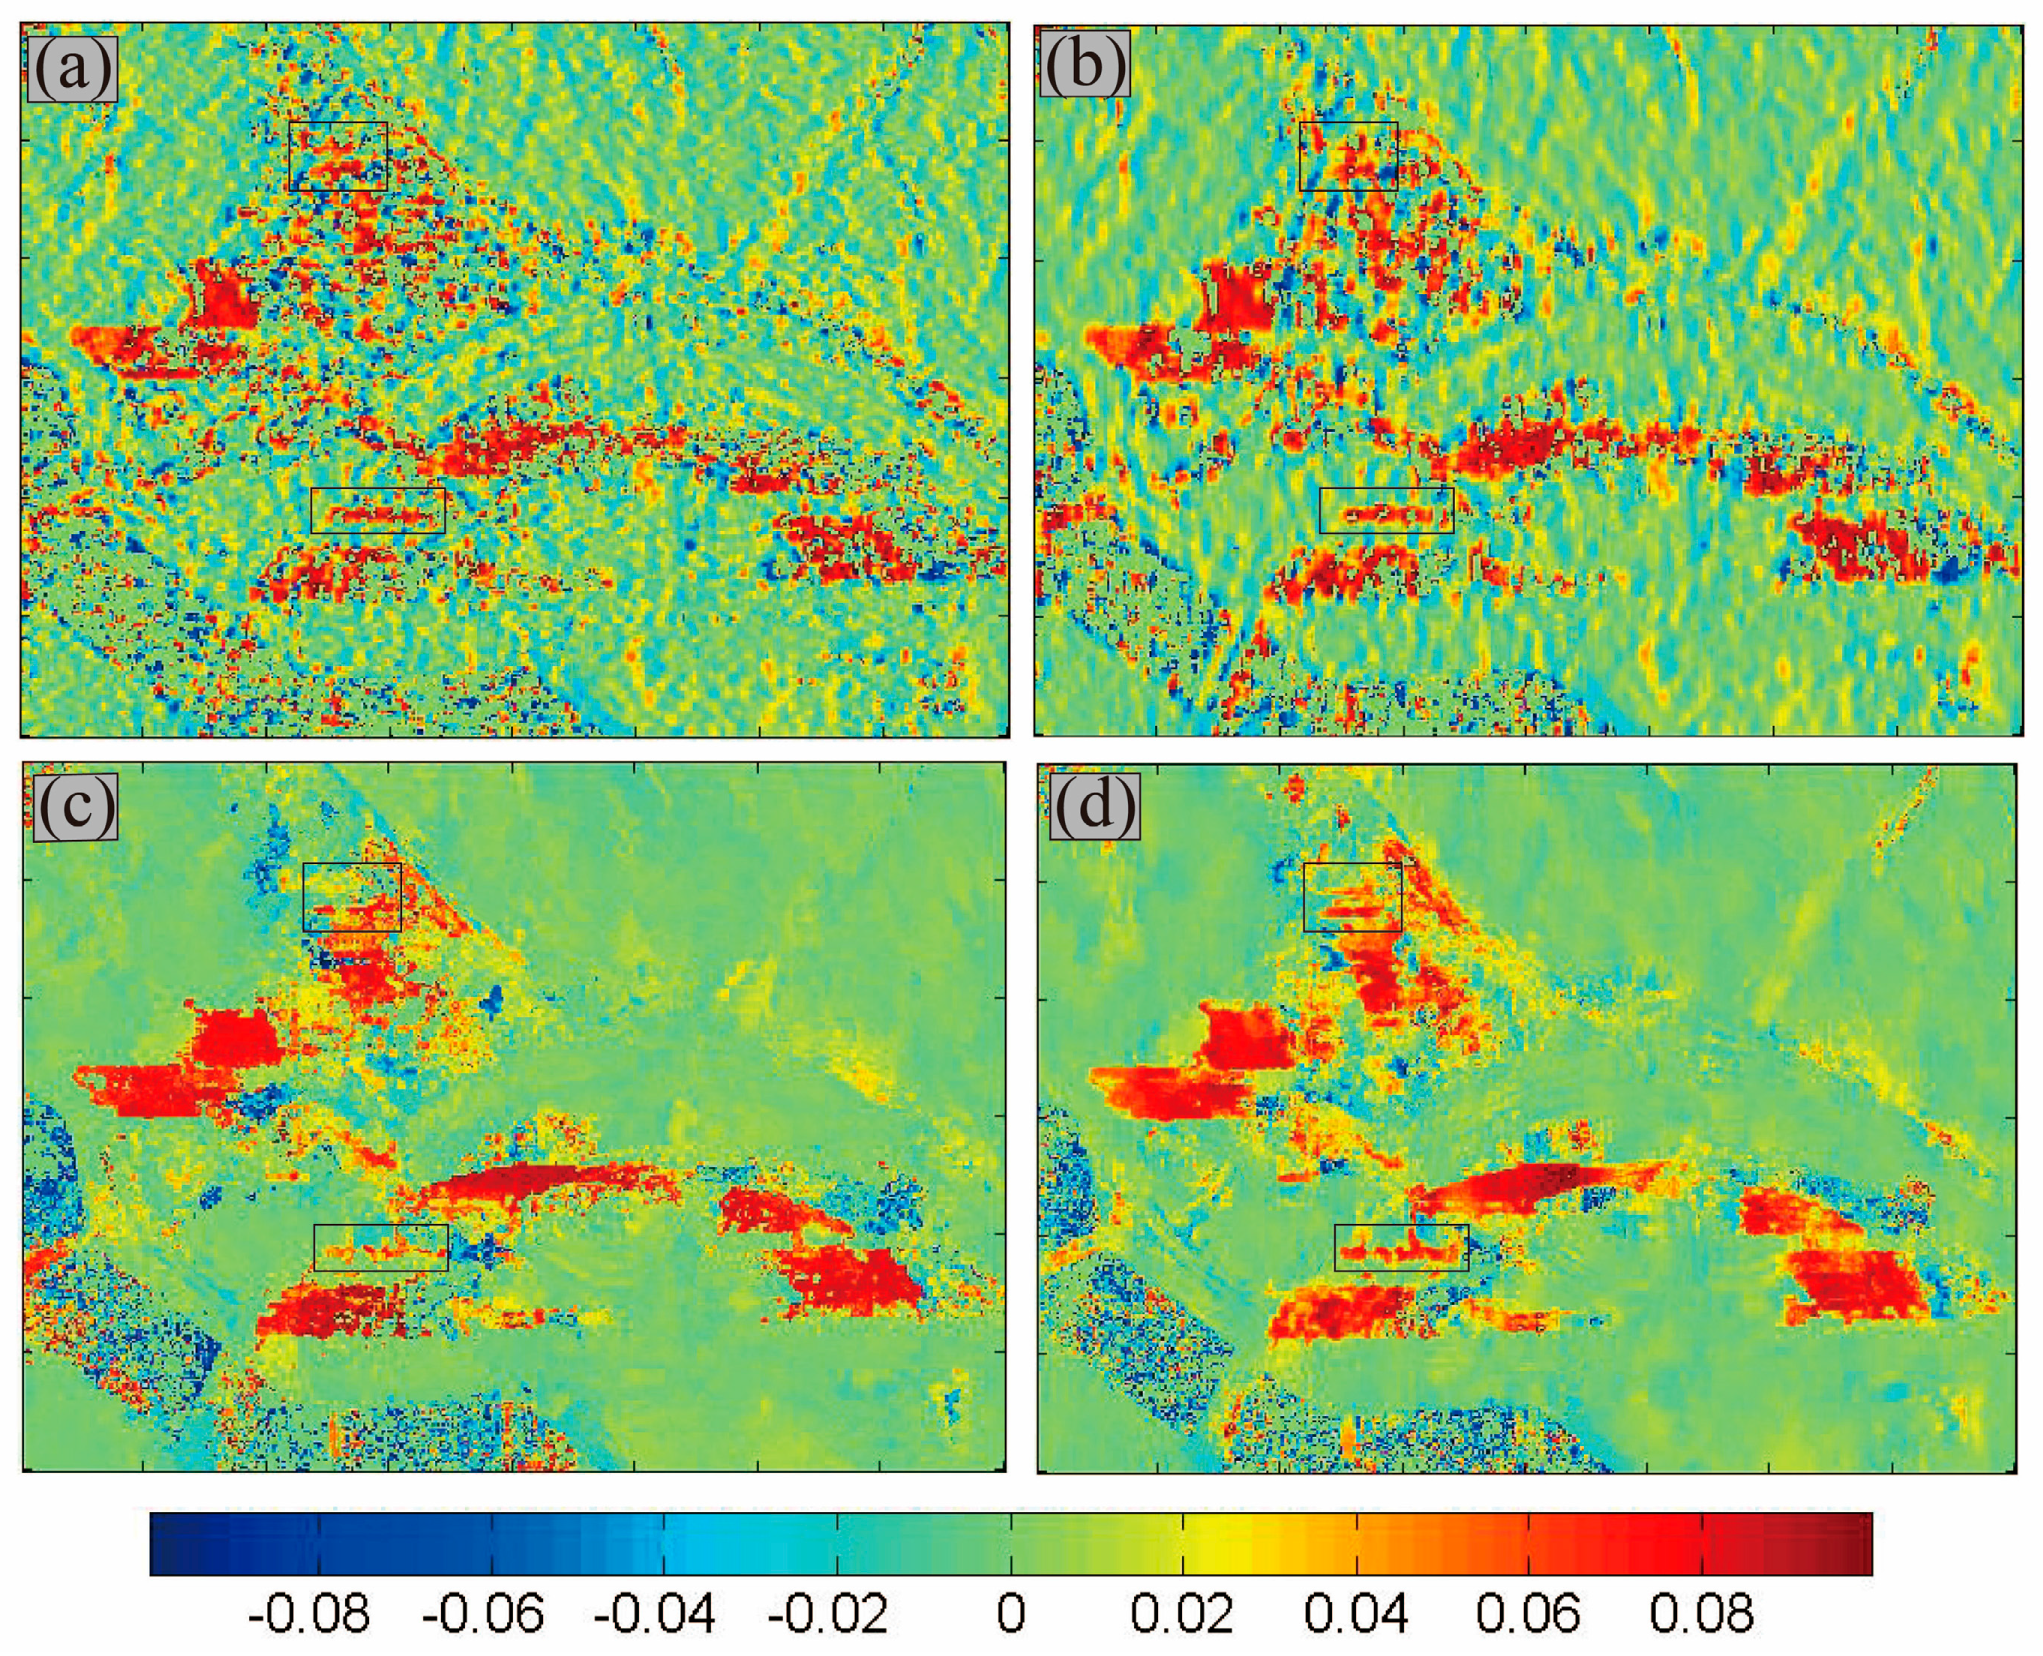
Figure 7 shows the local frequency result in the range direction computed from different estimation methods over the Tung Chung area. The traditional results obtained by MLE and IDAN are shown in Figure 7a–c. For comparison, the local frequency is computed by MLE with window sizes of 7 × 7 and 3 × 7, respectively. It can be observed that the proposed method (Figure 7d) can preserve more details in the local frequency and provide a more clear result of building edges.
Because of the Nyquist–Shannon criterion [13], the estimation result is within (−0.5, 0.5), whereas the local frequency caused by the terrain and buildings is much smaller. The estimation error caused by the low coherence phase was excluded by filtering the frequency result with the threshold obtained by Equation (1) and the result is shown in Figure 7. From the interferogram (Figure 6c), it can be observed that the phase fringes outside the building layover main change in azimuth direction. Hence, the change of range frequency in Figure 7 is too small to distinguish. Otherwise, the layover areas become more recognizable after threshold processing. The processed result of MLE shown in Figure 7a,b shows that this method often fails to estimate the correct local frequency in building areas. Many zero values appear after processing by using the threshold because of the difference between the estimated and the ideal frequencies. Even though the 3 × 7 boxcar window can improve the resolution in the azimuth direction, the results calculated by MLE are not sufficiently robust for building extraction. Using the IDAN can obtain a significantly improved result compared to MLE (Figure 7c), but it still cannot preserve building edges. The black boxes in Figure 7 show that the proposed method can provide a more optimal result. This is obvious in the smaller areas of building layovers, where the frequency features of IDAN cannot reflect the shape of the building structure. Especially, in areas with densely located buildings, our method can obtain a clear boundary under the condition of signal aliasing. This confirms that the presented approach is a good choice to extract building layover.
4.3. Building Layover Detection
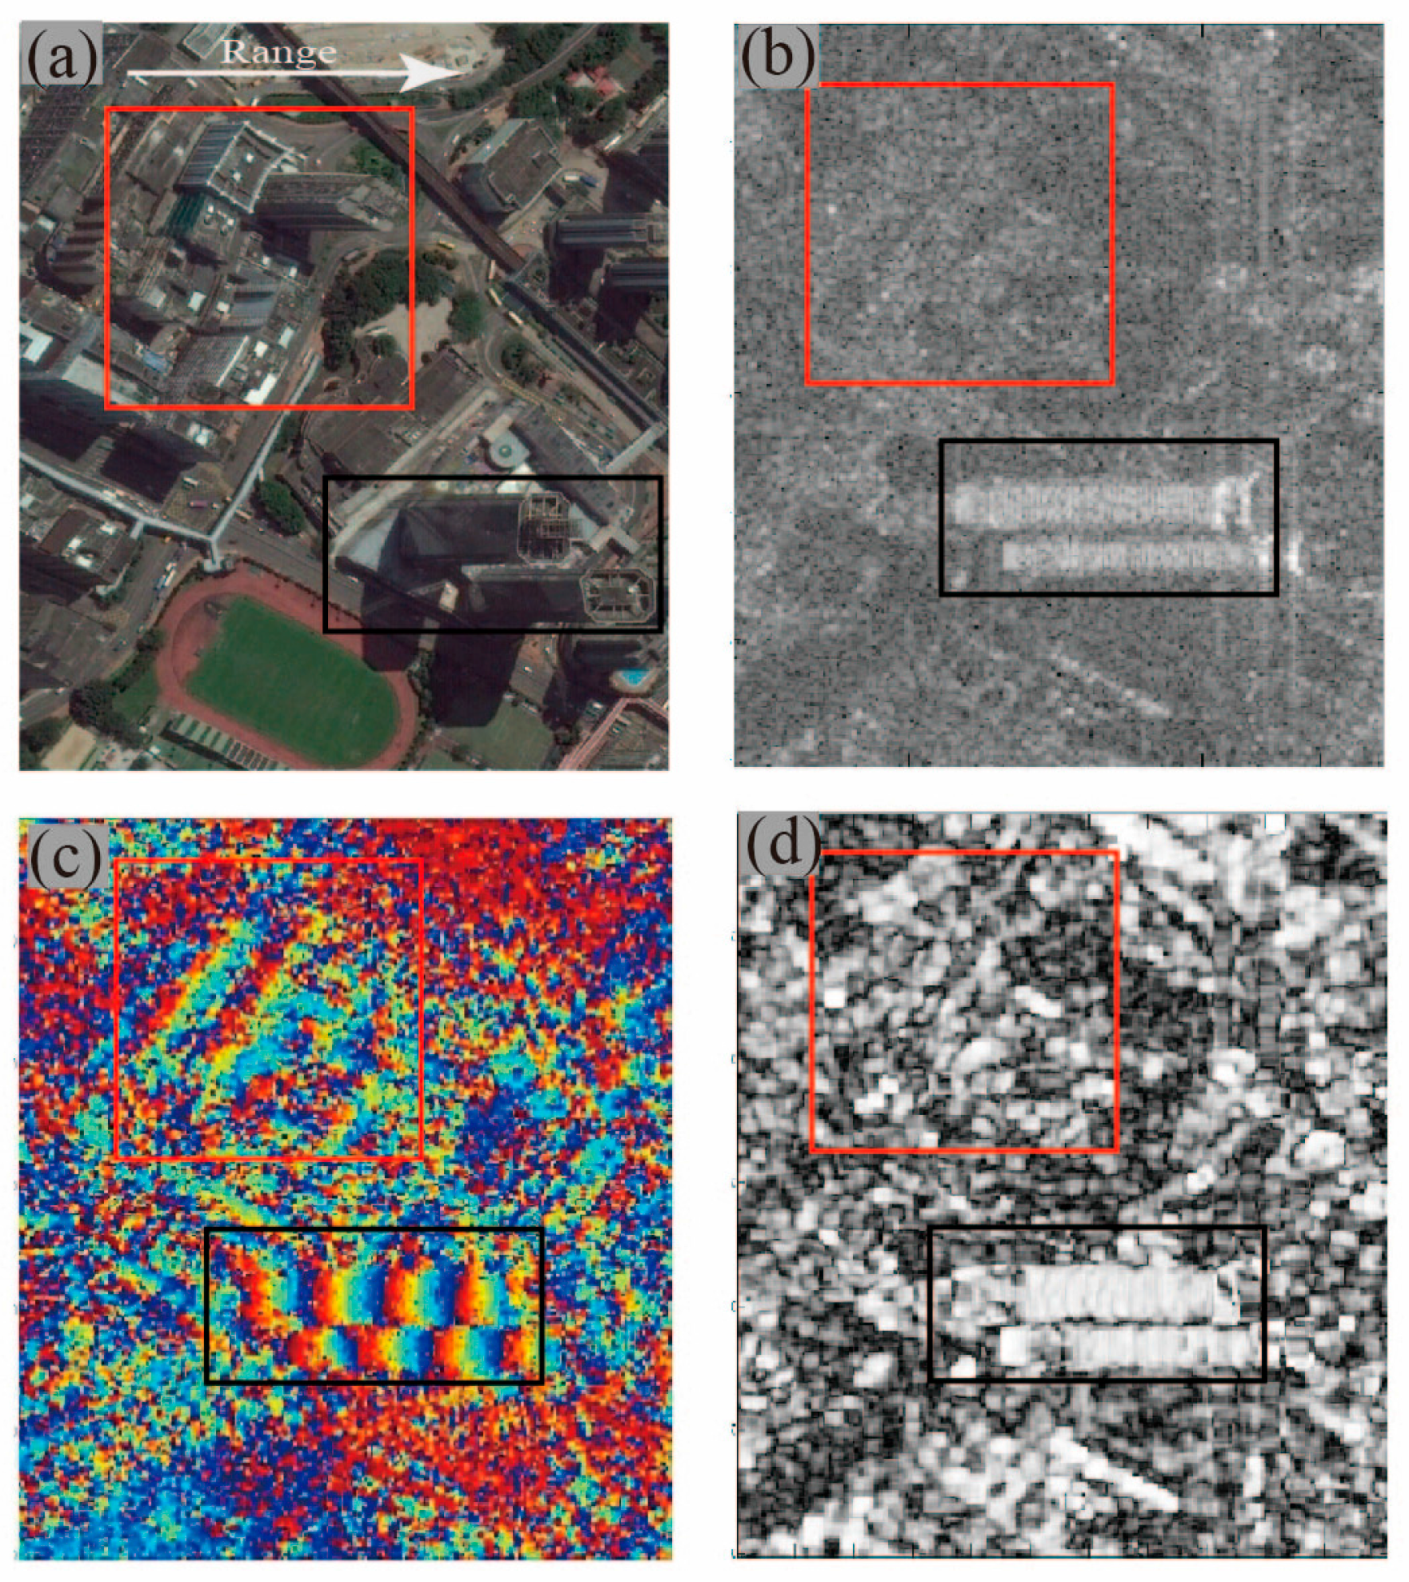
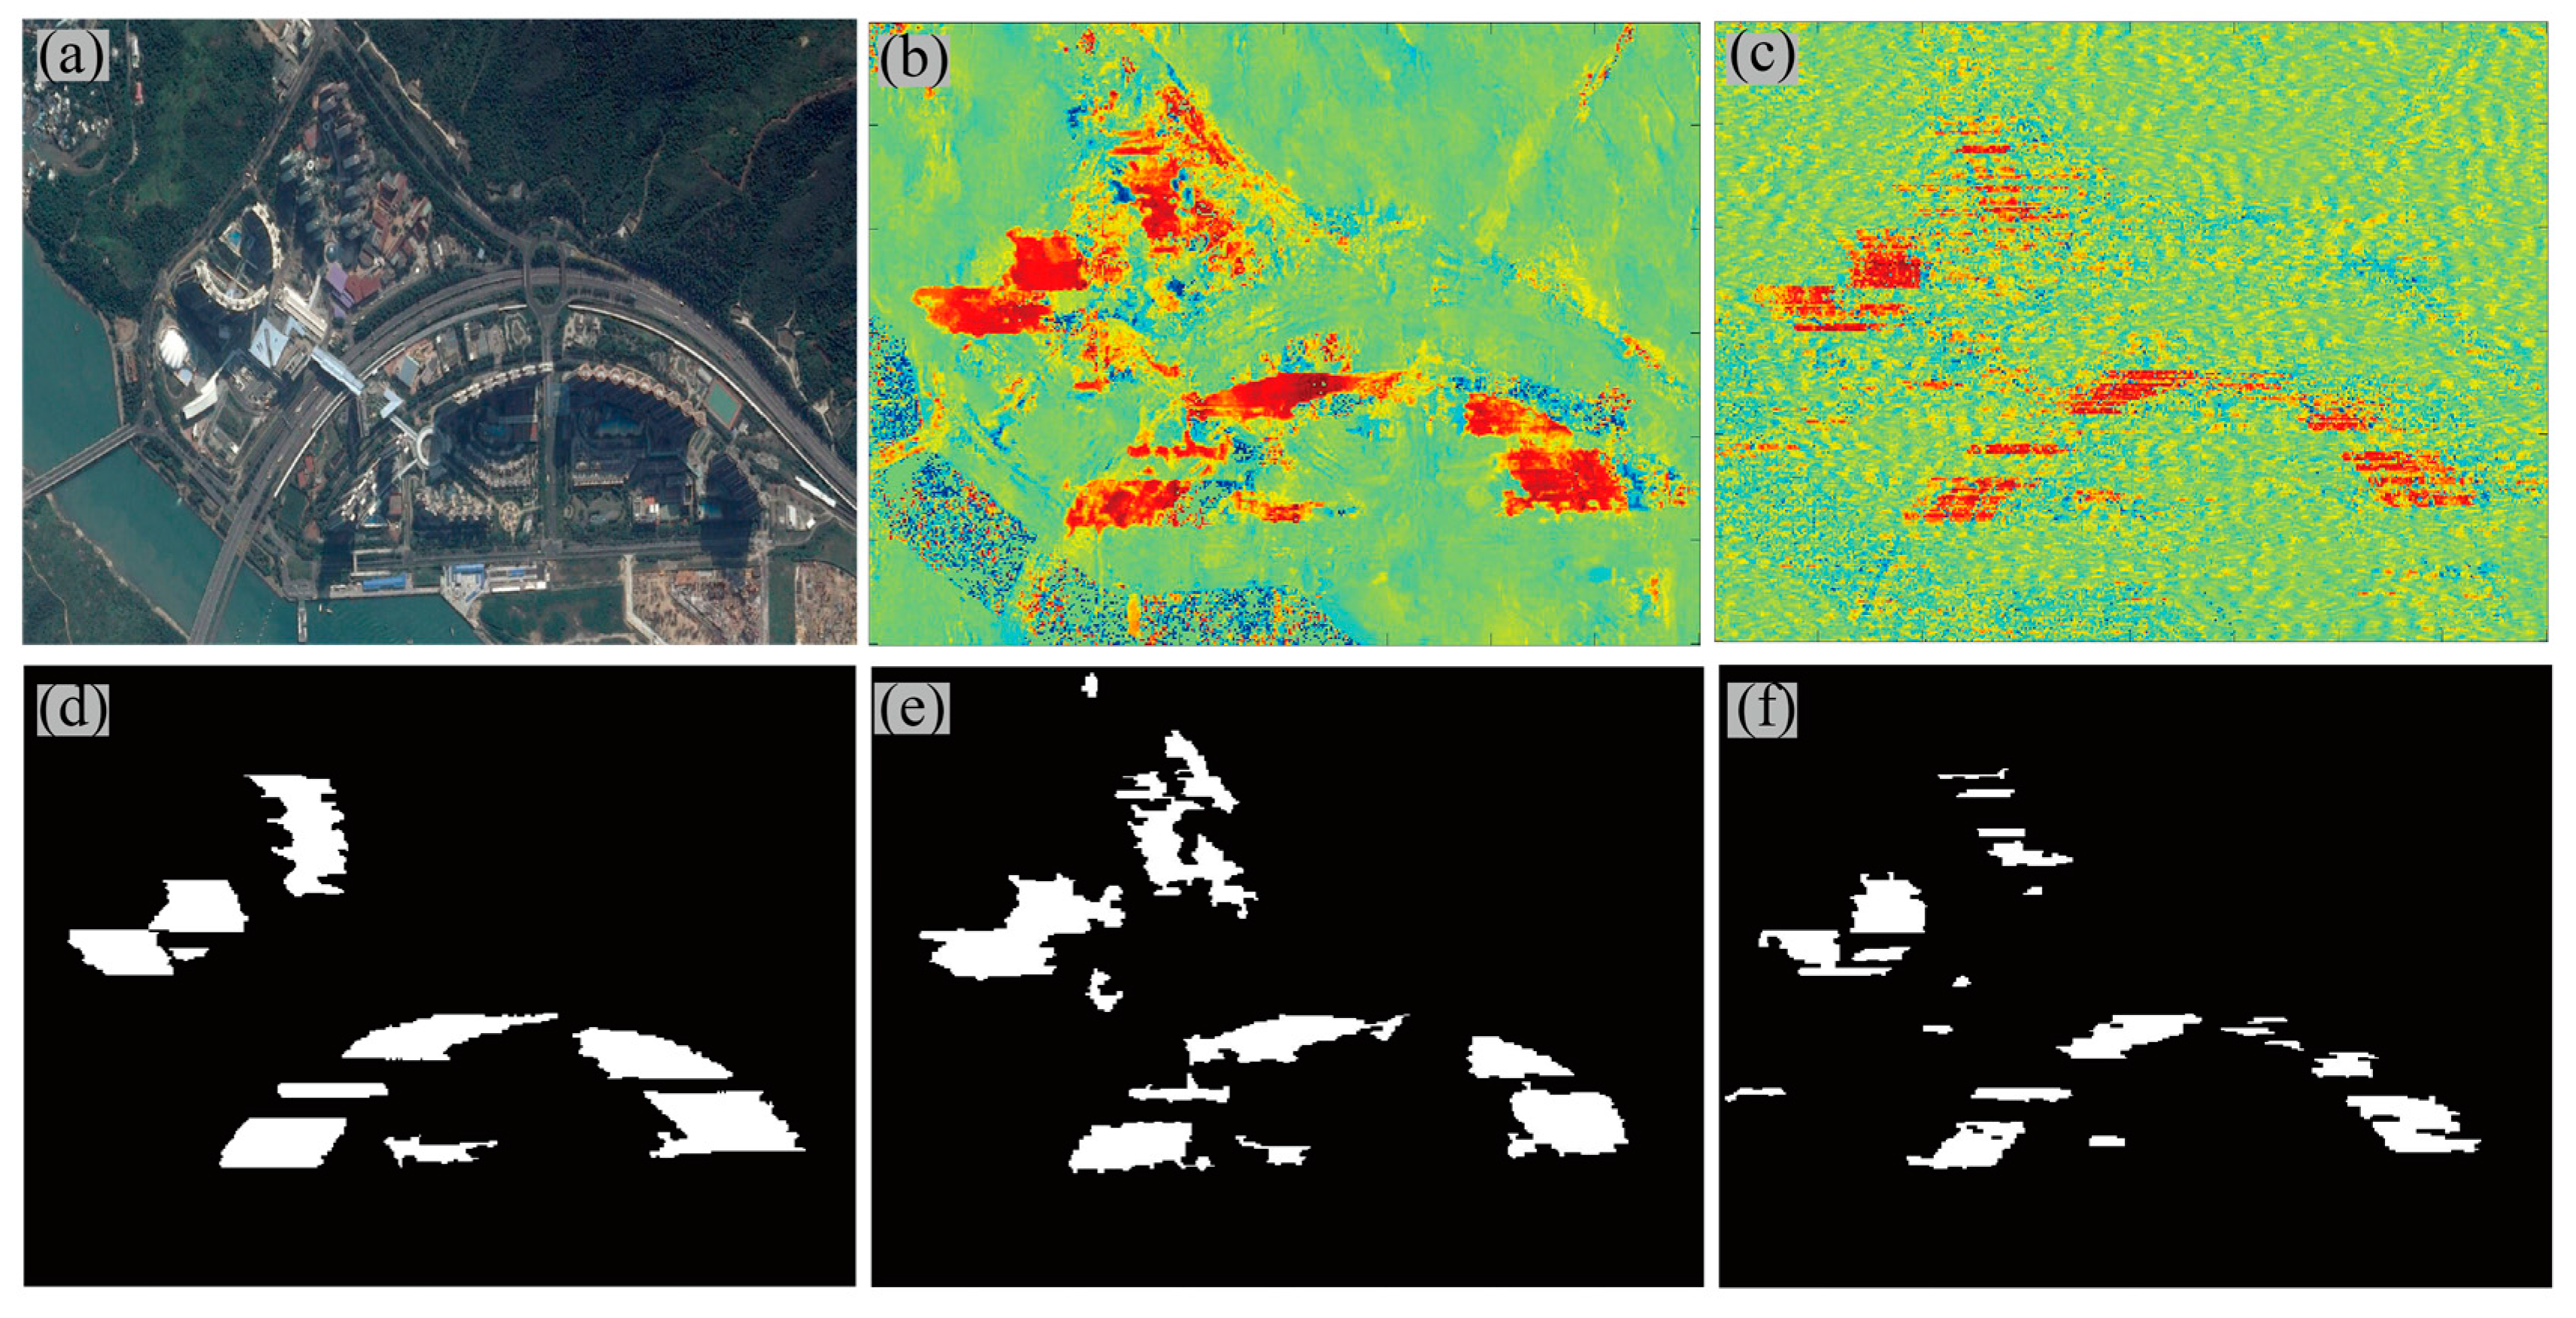
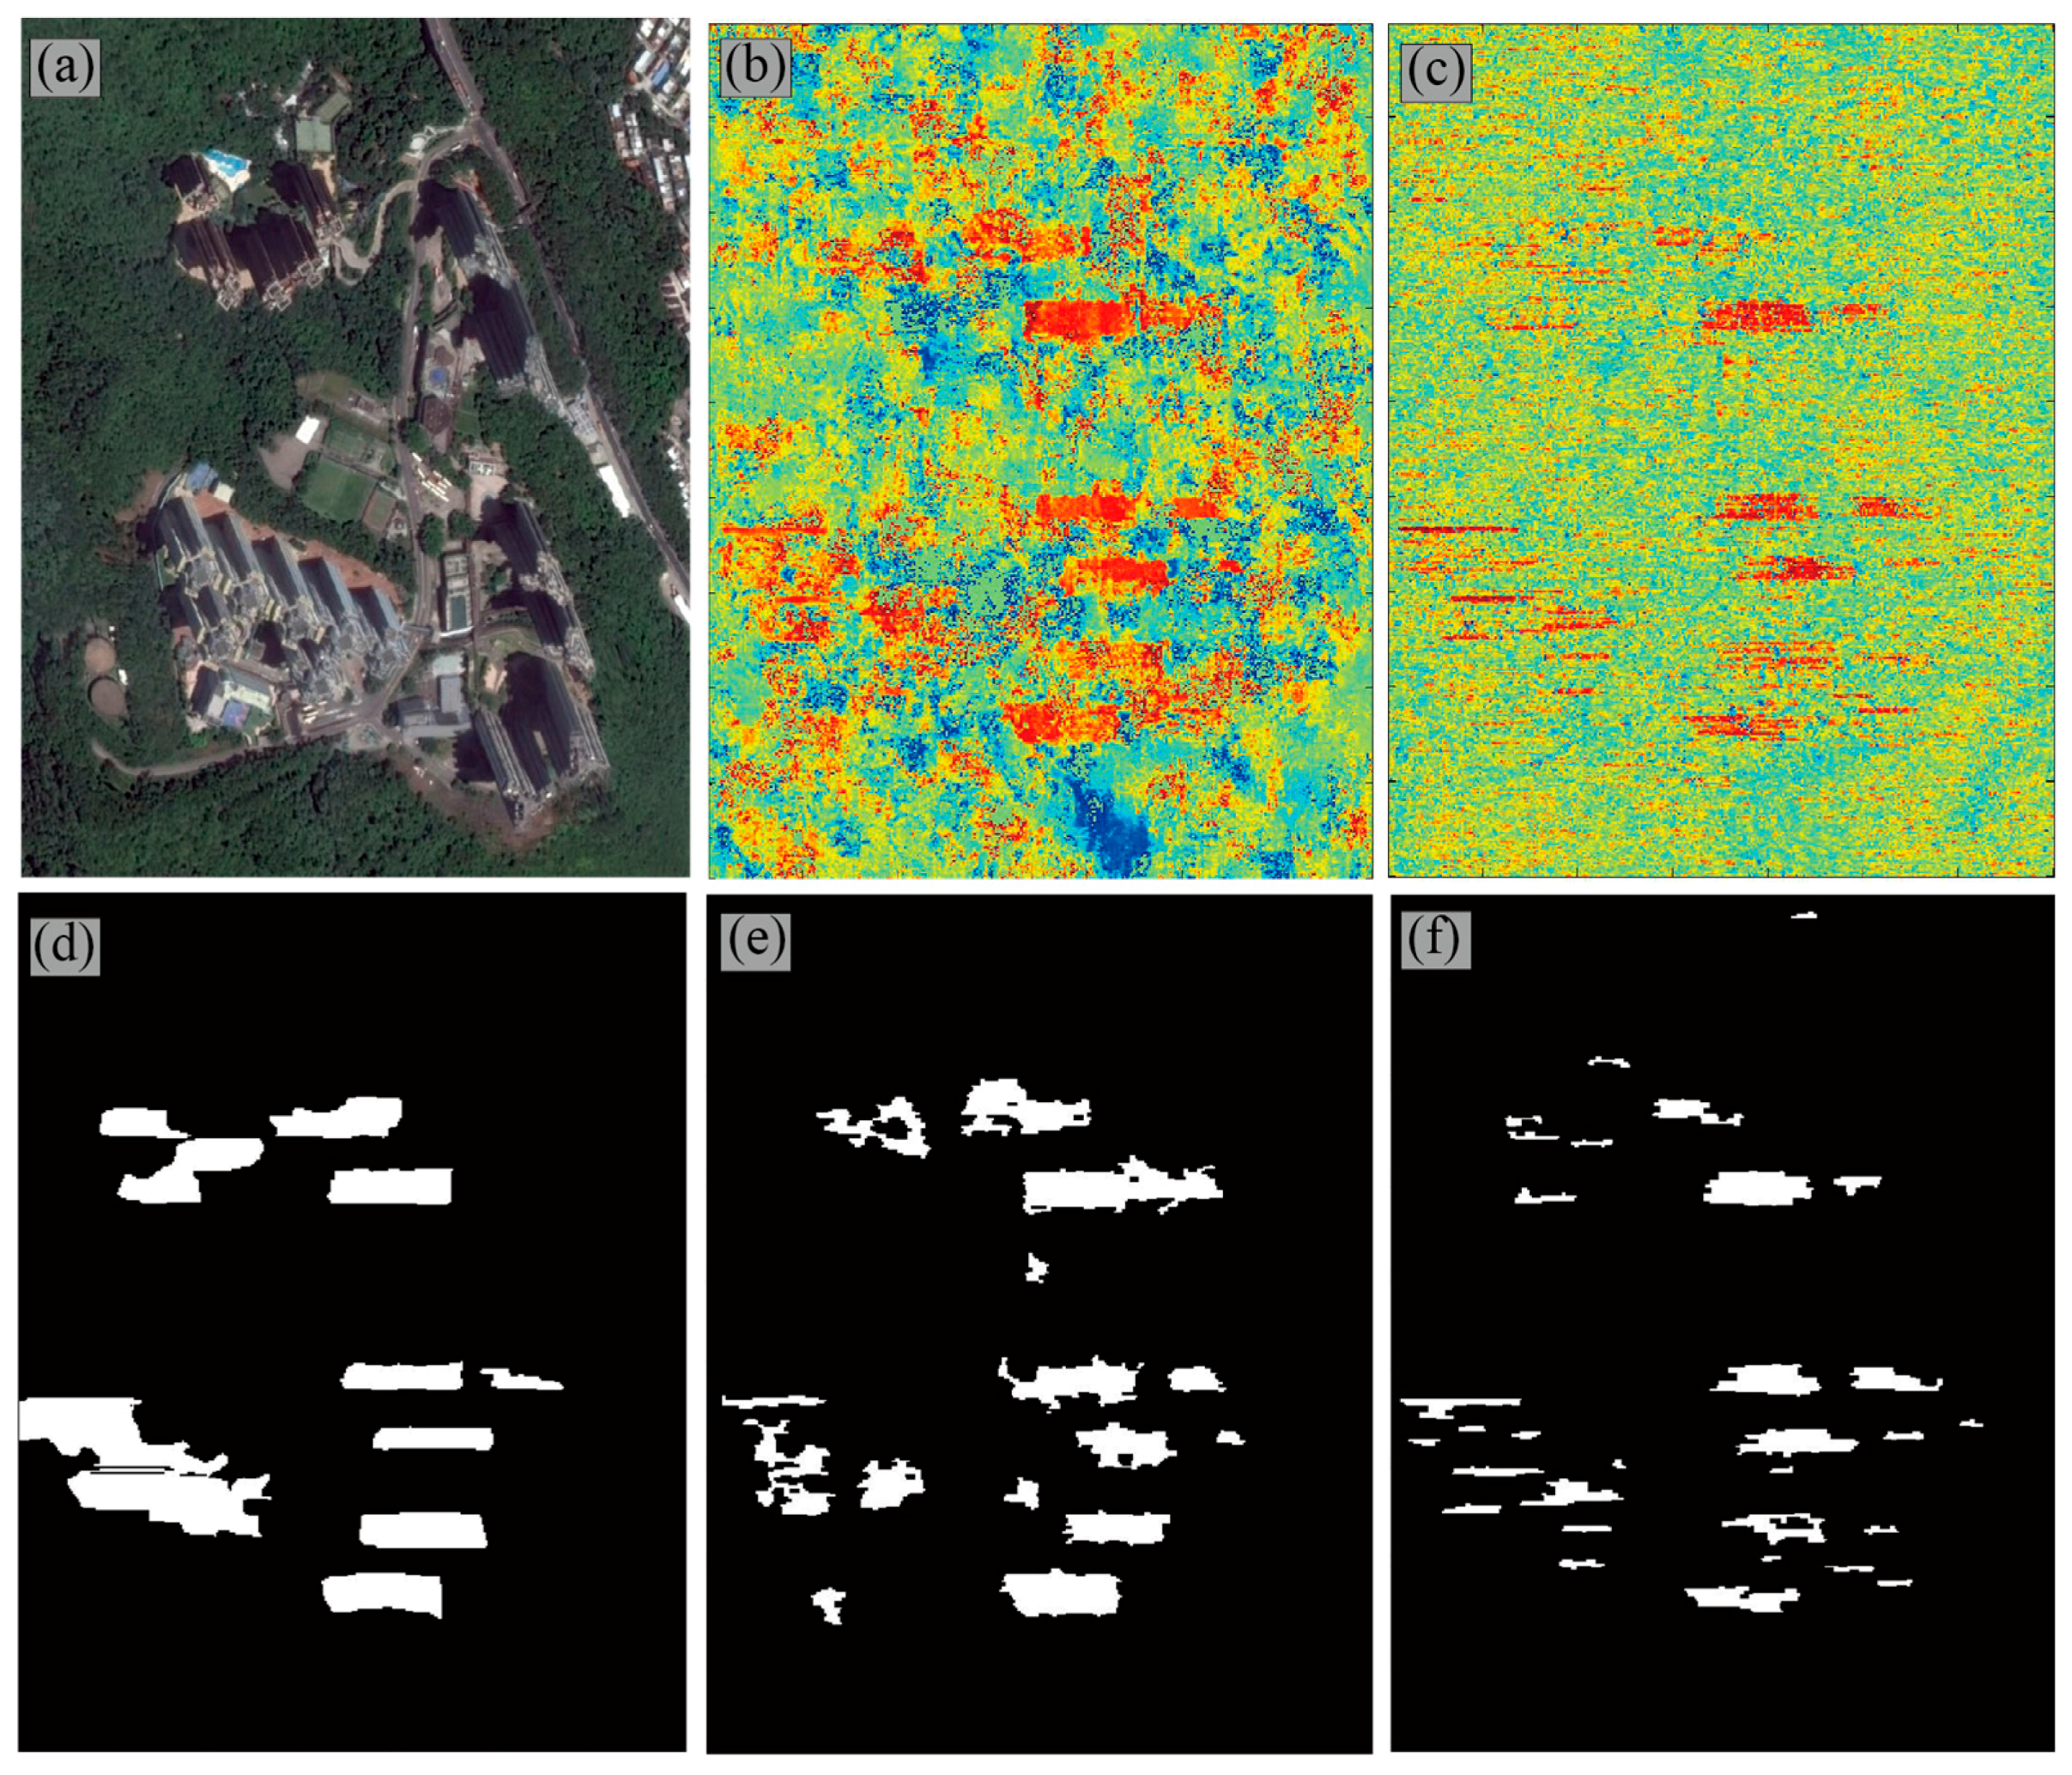
Image classification and morphology filtering can be used to obtain the final result of the building layover patch. The results of the ramp detector [5] are compared with the proposed method (Figure 8 and Figure 9). We artificially extract the layover patches from the intensity images to approximate the real range (Figure 8 and Figure 9). As aforementioned, due to the similar material, some ground objects that do not belong to buildings may mislead this work. Hence, we also consider the optical image and the building distributions in map to avoid the erroneous extraction and make the reference approximate the real range as much as possible. It has to be mentioned that this manual extraction is only reliable on the high-rise building with a clear boundary in intensity images such as these skyscrapers in our experimental areas. In the optical images (Figure 8a and Figure 9a), we can see high-rise buildings distributed in a complicated arrangement. Therefore, it is difficult to restore the building shapes by using common structures of building layover such as a parallelogram. In the interferograms, the fringe pattern is affected by a large amount of noise for two main reasons:
- (1)
- The overlapping of layover phases caused by buildings in high-density areas affects the quality of fringe patterns, and it also changes the local frequency of building layover. Moreover, as shown in optical images, this is impossible to avoid in urban areas.
- (2)
- The phase of ground objects in the layover areas, such as trees and water, reduces the phase coherence greatly. In Figure 8a, this area contains a large range of vegetation, which increases the difficulty of data processing.
In interferograms, a phase profile in the range direction at each pixel is considered as a local ramp. Then, the ramp detector is used to calculate the difference between the real and synthetic ramps at every pixel of the phase image. Thus, under the condition that the phases are polluted for the above reasons, the ramp detector obtains the building layover areas as a combination of strips rather than the complete shapes shown in Figure 8c and Figure 9c. After using the morphological filtering for recovery, the result still cannot reflect the shape of the layover (Figure 8f and Figure 9f). With our approach, in contrast to the profile analysis in the ramp detector, the homogeneous neighborhood can extract building areas as complete planes and preserve the boundaries (Figure 8e and Figure 9e). Although the phase aliasing caused by complicated building locations and speckle noise affect the quality of the interferogram, the ranges of the building layover are well extracted by our approach.
In order to compare these two detectors, we use two assessment criteria: the root mean square error (RMSE) and structural similarity (SSIM) to evaluate the results in each area. They are defined by the following functions
where by
where are the experiment results of these two detectors; is the manual extraction result; and denote the mean and variance calculation, respectively; and , , are constants. In practice, a slide window is used to calculate the mean value, variance and covariance at each pixel (x, y) for SSIM computation, and SSIM is obtained by mean operation of finally. The results listed in Table 2 show that the proposed method has a lower RMSE but higher SSIM than the ramp detector, which means the result of the frequency detector achieves a higher similarity compared with the artificial result.
4.4. Building Layover Removal
4.4.1. Synthetic Test
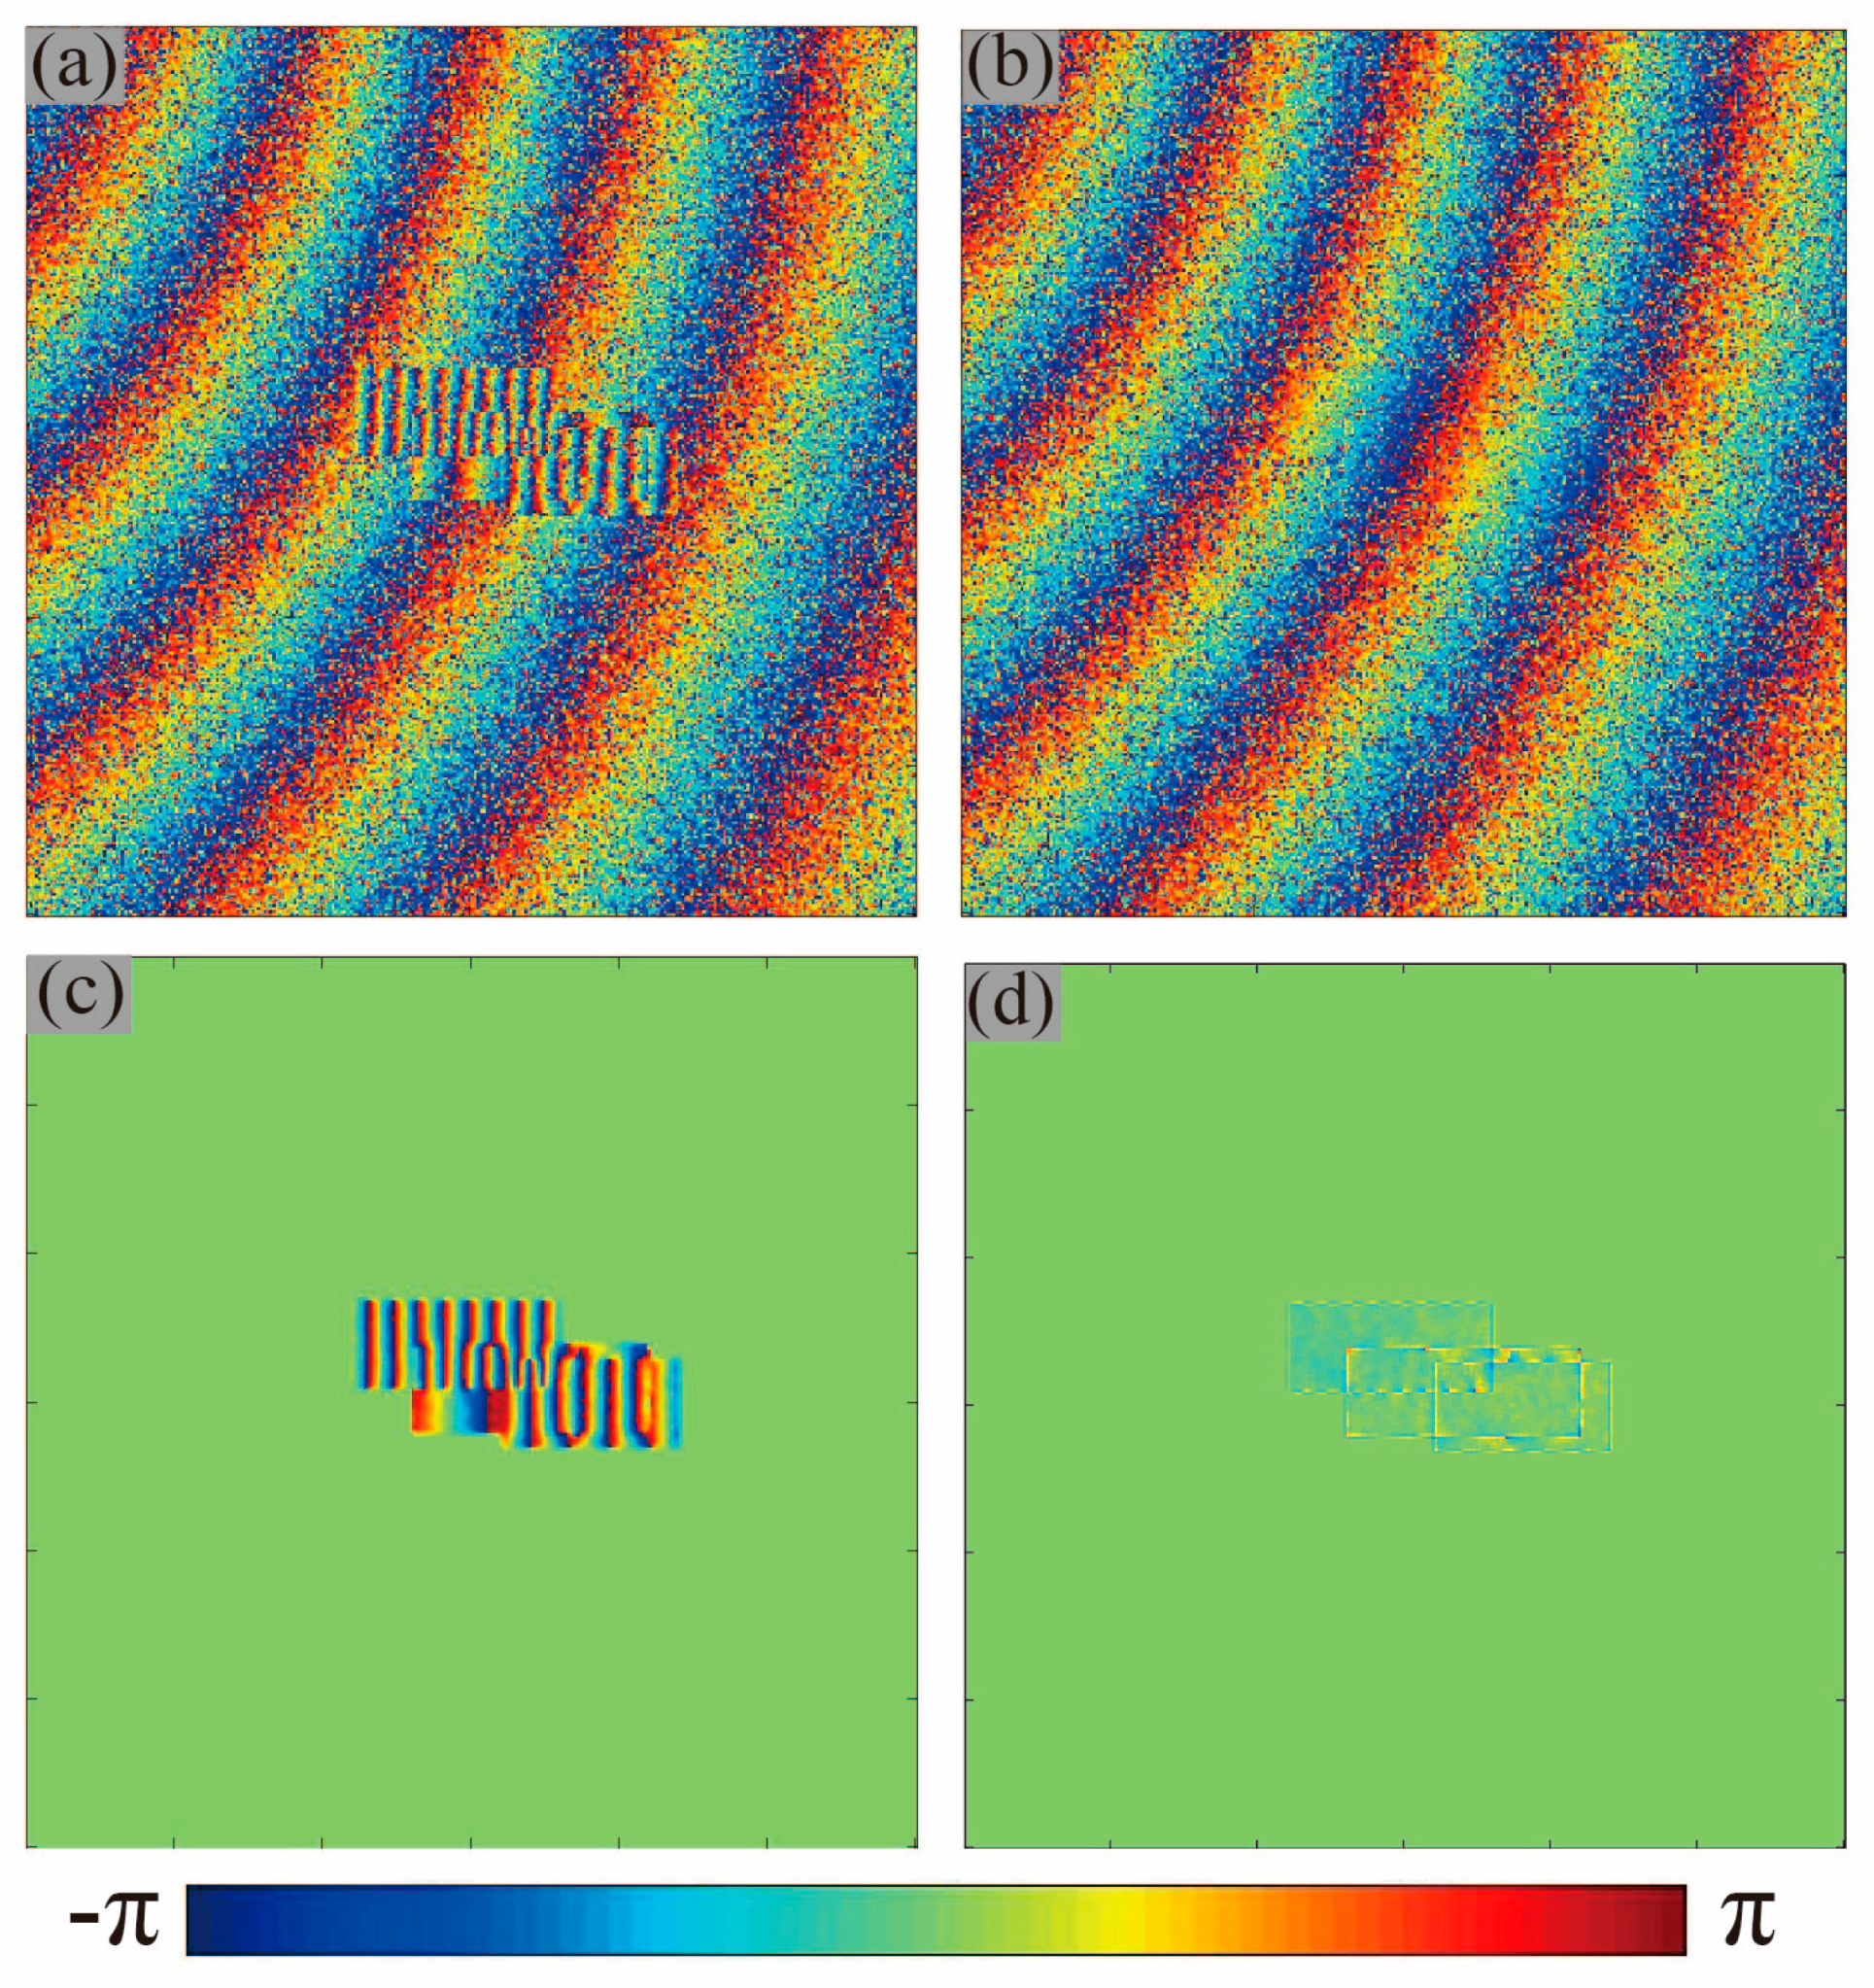
The effectiveness of the proposed method was demonstrated by carrying out a synthetic experiment. We first simulated a “true” DEM, with a resolution of 3 × 3 m and size of 300 × 300 pixels based on fractal theory [21]. Then, the original interferogram was simulated with the “true” DEM and the TerraSAR-X imaging geometry parameters listed in Table 3. As shown in Figure 10a, several phase signals with a different frequency range have overlapped in the interferogram. We considered this signal superposition as the complicated phase of dominant walls of high-rise buildings in the real data. Since the number of pixels in the overlapping area is about 4600, the size of the estimation windows for LD phase simulation was set to be 7 × 7–151 × 151.
Figure 10 shows the experimental results. The final simulated interferogram with noise is shown in Figure 10a, and the output of the removal procedure is shown in Figure 10b,c. The results showed that the proposed method removes most of the phase fringes with high density from the interferogram, and simultaneously recovers the potential phase fringes of the terrain. We further compared the removal result to the original interferogram (without high-rise building signal superposition) and calculated the phase residual (see Figure 10d). We can see that most of the phase residuals were in the range of (−0.5, 0.5) rad, demonstrating the ability of the proposed method to remove high-rise building topographic phase signals. The method was further evaluated by calculating the RMSE of the phase residuals. The RMSE value is only 0.333 rad. According to the height of ambiguity (28 m), the altitude error of the recovered terrain is about 1.48 m, which again demonstrates the effectiveness of our method. Some discontinuities can be seen to have appeared on the edges of overlapping patches. Those residuals with large values are caused by the phase discontinuities of different frequencies.
4.4.2. Real Data Test
The proposed removal method was applied to real InSAR data after confirming the target area in the detection step. The proposed procedure can remove the phase caused by buildings and recover potential terrain phases simultaneously. The LD phase corresponding to the local terrain was simulated by setting the size of the estimation windows to 7 × 7–91 × 91. The final result of the removal is shown in Figure 11b,d. As expected, the intensive phase fringes caused by high-rise buildings were removed completely, and the phase of the area covered by layover is recovered to fit the neighborhood.
In the result of the Tung Chung area (Figure 11b) with smooth terrain, the phase recovered by the LD frequency corresponds well to the surrounding area. In the area beside the mountain, the terrain phase is consistent with the variation in the mountain trend. However, as shown in Figure 11d, it is still not possible to fit a part of the recovered terrain phase to the environment. The main reasons for the bias are: (1) the surrounding terrain phase has complex variation; and (2) the analysis window selected in the LD frequency estimation cannot adapt the local phase of the terrain. Although we set the criteria to calculate an adaptive window size in the removal step, a single criterion cannot be adapted to all situations of the local terrain phase with different complexity. We plan to solve this problem in a future study.
5. Conclusions
We proposed an improved approach based on the non-local frequency estimation to extract the layover patch of the interferometric phase. Our approach can be effectively applied to areas with buildings distributed in a complicated arrangement and with great differences in terrain altitude. It also provides a new strategy for building research.
A new method for building layover phase removal is proposed to reduce the difficulty of image interpretation and enhance the reliability of subsequent processing. Firstly, the traditional method of local frequency estimation was used to obtain and separate the LD frequency according to terrains. Then, a secondary frequency estimation based on the proposed non-local strategy was used to achieve layover phase extraction. After simulation and removing the phase derived from building layover, the final result was obtained. The method completely eliminates the building layover phase and recovers the phase in layover areas. Despite the difficulty presented by verifying the precision and accuracy, the method still provides interferograms without interference of the building layover. Hence, this method can be used for processing data such as D-InSAR and for assisting phase unwrapping to avoid the negative influence of high-rise buildings.
We plan to expand the application of the new method in phase unwrapping and D-InSAR technology in the future. In phase unwrapping, dense fringes caused by high-rise buildings often introduce errors in solutions. The results can be improved by separating the layover phases from interferograms before unwrapping. In D-InSAR technology, residual phases caused by building layover cannot be eliminated when using common DEM data. The proposed method can be used to improve the deformation detection in D-InSAR. Lastly, since the frequency estimation is influenced by signal aliasing caused by the dense distribution of buildings, we expect to conduct in-depth research on the characteristics of the local frequency in these areas. Our main goal is to analyze and classify the frequency characteristics of buildings with different structures and overlapping situations. Therefore, we aim to extend the proposed method to interferograms extensively for various applications such as building reconstruction, DEM estimation and ground surface deformation mapping.
Acknowledgments
This work is supported by the Shenghua Yuying fund of Central South University and the National Natural Science Foundation of China (41474007 and 41404013) and the Fundamental Research Funds of Central South University (2014zzts049) and the Major Project of High Resolution Earth Observation System of China (Civil Part) (No. 03-Y20A11-9001-15/16). The TSX/TDX images are provided by DLR Category project (LAN1705, LAN2172). The authors would like to thank the four anonymous reviewers for their constructive remarks and suggestions.
Author Contributions
Jun Zhu, Zhiwei Li, and Bing Xu conceived the research work; Jun Zhu wrote the first draft of the paper; and Xiaoli Ding, Zhiwei Li, and Jianjun Zhu contributed to the experimental implementation and interpretation of the results. All authors contributed to writing and revising the paper.
Conflicts of Interest
We declare that we do not have any commercial or associative interest that represents a conflict of interest in connection with the work submitted.
References
- Dubois, C.; Thiele, A.; Hinz, S. Building detection and building parameter retrieval in InSAR phase images. ISPRS J. Photogramm. Remote Sens. 2016, 114, 228–241. [Google Scholar] [CrossRef]
- Rossi, C.; Eineder, M. High-resolution InSAR building layovers detection and exploitation. IEEE Trans. Geosci. Remote Sens. 2015, 53, 6457–6468. [Google Scholar] [CrossRef]
- Shahzad, M.; Zhu, X.X. Automatic detection and reconstruction of 2-D/3-D building shapes from spaceborne TomoSAR point clouds. IEEE Trans. Geosci. Remote Sens. 2016, 54, 1292–1310. [Google Scholar] [CrossRef]
- Sportouche, H.; Tupin, F.; Denise, L. Extraction and three-dimensional reconstruction of isolated buildings in urban scenes from high-resolution optical and SAR spaceborne images. IEEE Trans. Geosci. Remote Sens. 2011, 49, 3932–3946. [Google Scholar] [CrossRef]
- Thiele, A.; Wurth, M.; Even, M.; Hinz, S. Extraction of building shape from tandem-x data. In Proceedings of the International Archives of the Photogrammetry, Remote Sensing and Spatial Information Sciences, Volume XL-1/W1, ISPRS Hannover Workshop, Hannover, Germany, 21–24 May 2013; Volume 1, pp. 345–350. [Google Scholar]
- Thiele, A.; Cadario, E.; Schulz, K.; Thonnessen, U.; Soergel, U. Building recognition from multi-aspect high-resolution InSAR data in urban areas. IEEE Trans. Geosci. Remote Sens. 2007, 45, 3583–3593. [Google Scholar] [CrossRef]
- Zhang, F.; Shao, Y.; Zhang, X.; Balz, T. Building L-Shape Footprint Extraction from High Resolution Sar Image. In Proceedings of the 2011 Joint Urban Remote Sensing Event, Munich, Germany, 11–13 April 2011; pp. 273–276. [Google Scholar]
- Feng, D.; Chen, W. Structure filling and matching for three-dimensional reconstruction of buildings from single high-resolution SAR image. IEEE Geosci. Remote Sens. Lett. 2016, 13, 752–756. [Google Scholar] [CrossRef]
- Lee, J.; Hoppel, K.W.; Mango, S.; Miller, A.R. Intensity and phase statistics of multilook polarimetric and interferometric SAR imagery. IEEE Trans. Geosci. Remote Sens. 1994, 32, 1017–1028. [Google Scholar]
- Deledalle, C.-A.; Denis, L.; Tupin, F. Nl-InSAR: Nonlocal interferogram estimation. IEEE Trans. Geosci. Remote Sens. 2011, 49, 1441–1452. [Google Scholar] [CrossRef]
- Spagnolini, U. 2-D phase unwrapping and instantaneous frequency estimation. IEEE Trans. Geosci. Remote Sens. 1995, 33, 579–589. [Google Scholar] [CrossRef]
- Jiang, M.; Ding, X.; Li, Z.; Tian, X.; Wang, C.; Zhu, W. InSAR coherence estimation for small data sets and its impact on temporal decorrelation extraction. IEEE Trans. Geosci. Remote Sens. 2014, 52, 6584–6596. [Google Scholar] [CrossRef]
- Vasile, G.; Trouvé, E.; Petillot, I.; Bolon, P.; Nicolas, J.-M.; Gay, M.; Chanussot, J.; Landes, T.; Grussenmeyer, P.; Buzuloiu, V. High-resolution sar interferometry: Estimation of local frequencies in the context of alpine glaciers. IEEE Trans. Geosci. Remote Sens. 2008, 46, 1079–1090. [Google Scholar] [CrossRef]
- Trouve, E.; Nicolas, J.-M.; Maitre, H. Improving phase unwrapping techniques by the use of local frequency estimates. IEEE Trans. Geosci. Remote Sens. 1998, 36, 1963–1972. [Google Scholar] [CrossRef]
- Cai, B.; Liang, D.; Dong, Z. A new adaptive multiresolution noise-filtering approach for SAR interferometric phase images. IEEE Geosci. Remote Sens. Lett. 2008, 5, 266–270. [Google Scholar]
- Buades, A.; Coll, B.; Morel, J.-M. A non-local algorithm for image denoising. In Proceedings of the 2005 IEEE Computer Society Conference on Computer Vision and Pattern Recognition, Washington, DC, USA, 20–26 June 2005; pp. 60–65. [Google Scholar]
- Hu, J.; Guo, R.; Zhu, X.; Baier, G.; Wang, Y. Non-local means filter for polarimetric SAR speckle reduction-experiments using TerraSAR-x data. ISPRS Ann. Photogram. Remote Sens. Spat. Inf. Sci. 2015, 2, 71. [Google Scholar] [CrossRef]
- Zebker, H.A.; Chen, K. Accurate estimation of correlation in InSAR observations. IEEE Geosci. Remote Sens. Lett. 2005, 2, 124–127. [Google Scholar] [CrossRef]
- Trouvé, E.; Caramma, M.; Maître, H. Fringe detection in noisy complex interferograms. Appl. Opt. 1996, 35, 3799. [Google Scholar] [CrossRef] [PubMed]
- Guarnieri, A.M.; Tebaldini, S. Ml-based fringe-frequency estimation for InSAR. IEEE Geosci. Remote Sens. Lett. 2010, 7, 136–140. [Google Scholar] [CrossRef]
- Hanssen, R.F. Radar Interferometry: Data Interpretation and Error Analysis; Springer Science & Business Media: Beriln, Germany, 2001; Volume 2. [Google Scholar]
Figure 1.
Building signals in an urban area: (a) buildings in optical images; (b) interferometric intensity data; (c) interferometric phase data; and (d) coherence.
Figure 1.
Building signals in an urban area: (a) buildings in optical images; (b) interferometric intensity data; (c) interferometric phase data; and (d) coherence.

Figure 2.
Building in the oblique side-looking imaging geometry of SAR sensors: (a) O-xyz coordinate system; and (b) building features in the slant range of a SAR image. L: Layover; R: Roof; S: Shadow; H: Height.
Figure 2.
Building in the oblique side-looking imaging geometry of SAR sensors: (a) O-xyz coordinate system; and (b) building features in the slant range of a SAR image. L: Layover; R: Roof; S: Shadow; H: Height.

Figure 3.
Searching window at each site.

Figure 4.
Similarity measurement: (a) noisy interferogram; (b) corresponding intensity, where the test pixel is marked by the red point; and (c) similarity measurement results.
Figure 4.
Similarity measurement: (a) noisy interferogram; (b) corresponding intensity, where the test pixel is marked by the red point; and (c) similarity measurement results.

Figure 5.
Workflow of the proposed method.

Figure 6.
Range of the experimental regions: (a) optical image (Tung Chung, source: Google earth); (b) optical image (Tsing Yi, source: Google earth); (c) interferogram (Tung Chung); and (d) interferogram (Tsing Yi).
Figure 6.
Range of the experimental regions: (a) optical image (Tung Chung, source: Google earth); (b) optical image (Tsing Yi, source: Google earth); (c) interferogram (Tung Chung); and (d) interferogram (Tsing Yi).
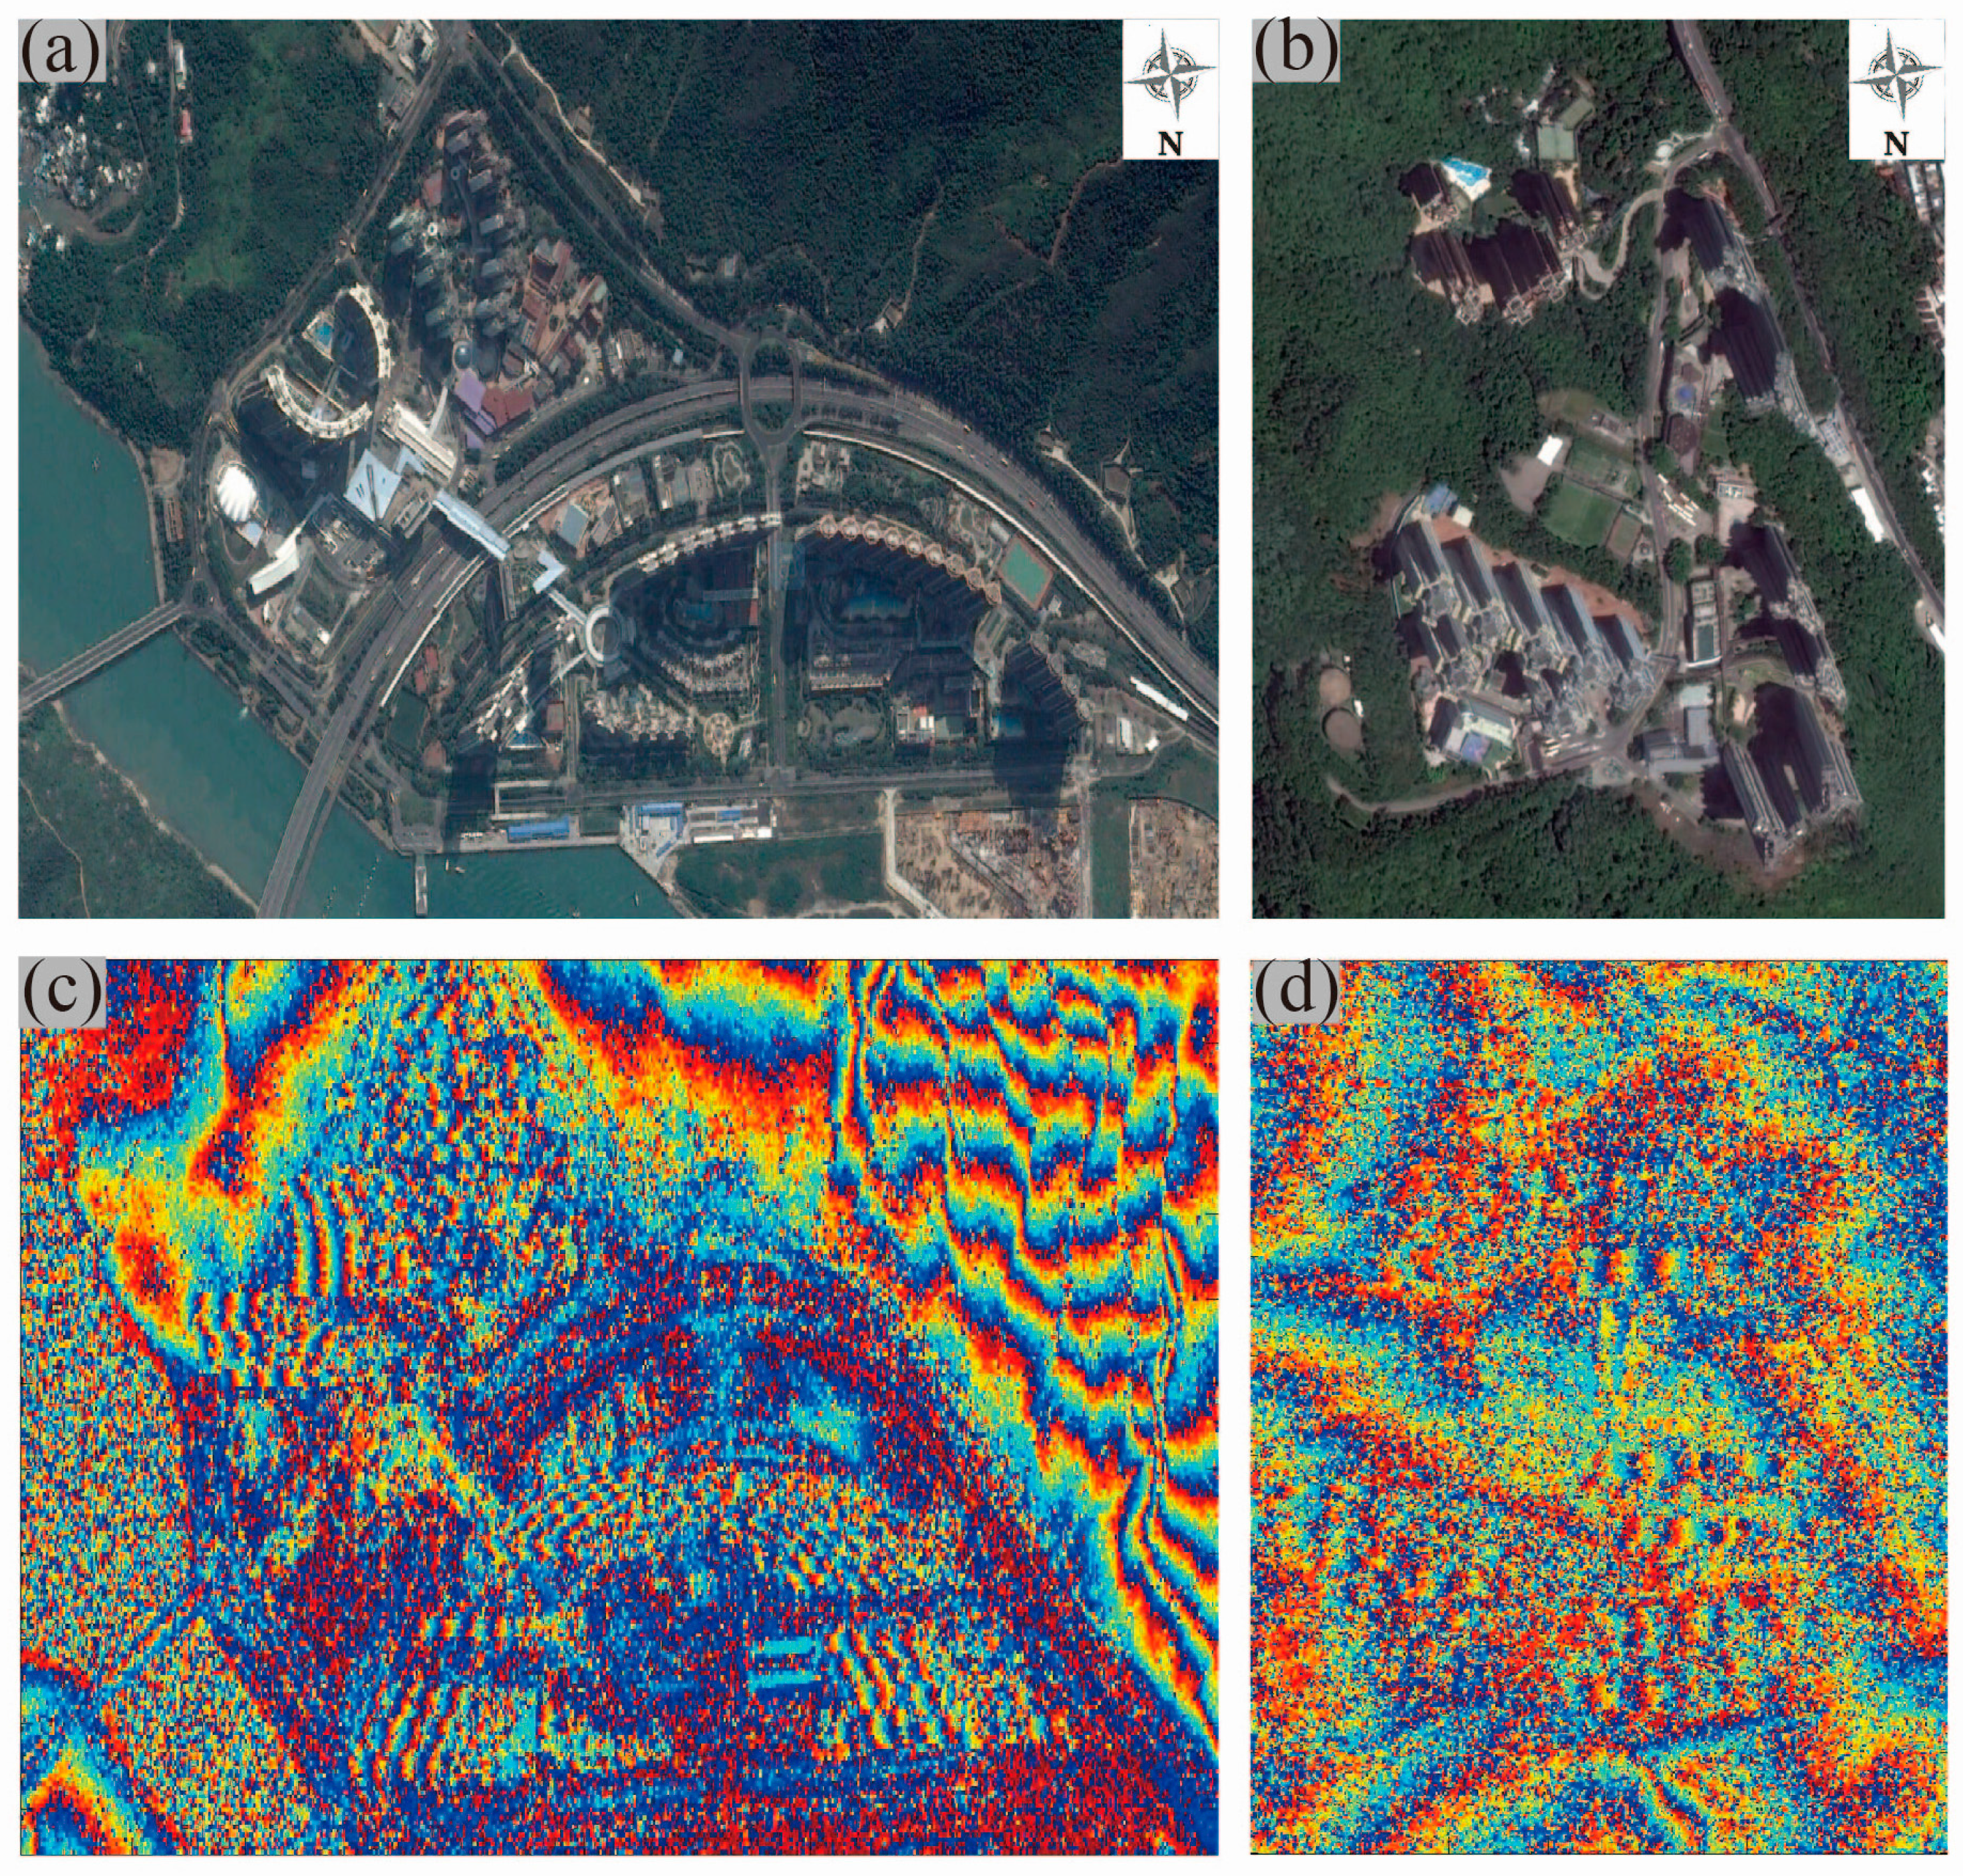
Figure 7.
Result of local frequency estimation in the range direction after setting a threshold: (a) MLE with 3 × 7; (b) MLE with 7 × 7; (c) IDAN with 90 pixels; and (d) non-local with 90 pixels.
Figure 7.
Result of local frequency estimation in the range direction after setting a threshold: (a) MLE with 3 × 7; (b) MLE with 7 × 7; (c) IDAN with 90 pixels; and (d) non-local with 90 pixels.

Figure 8.
Building layover detection result of Tung Chung: (a) optical images; (b) frequency result in the range direction obtained by the proposed method; (c) result of the ramp detector; (d) artificial extracting result; (e) final result of the proposed method; and (f) final result of the ramp detector.

Figure 9.
Building layover detection of Tsing Yi: (a) optical images; (b) frequency result in the range direction obtained by the proposed method; (c) result of the ramp detector; (d) artificial extracting result; (e) final result of the proposed method; and (f) final result of ramp detector.
Figure 9.
Building layover detection of Tsing Yi: (a) optical images; (b) frequency result in the range direction obtained by the proposed method; (c) result of the ramp detector; (d) artificial extracting result; (e) final result of the proposed method; and (f) final result of ramp detector.

Figure 10.
Result of building layover removal in simulated data: (a) simulated interferogram; (b) removal result; (c) extraction of overlapping phase; and (d) phase residual of terrain.
Figure 10.
Result of building layover removal in simulated data: (a) simulated interferogram; (b) removal result; (c) extraction of overlapping phase; and (d) phase residual of terrain.

Figure 11.
Result of building layover removal in real data: left (a,c) noisy interferogram; and right (b,d) removal result.
Figure 11.
Result of building layover removal in real data: left (a,c) noisy interferogram; and right (b,d) removal result.

Table 1.
Parameters of the used SAR dataset.
| Sensor | Acquisition Date | Incidence Angle | Perpendicular Baseline | Pixel Spacing | |
|---|---|---|---|---|---|
| TerraSAR-X | 1 January 2013 | 36.10° | 285.56 m | Range: 2.73 m | 20 m |
| TanDEM-X | Azimuth: 4.05 m |
Table 2.
Performance assessment for two areas.
| Frequency Detector | Ramp Detector | ||
|---|---|---|---|
| Tung Chung | RMSE | 0.1954 | 0.2075 |
| SSIM | 0.8694 | 0.8678 | |
| Tsing Yi | RMSE | 0.2498 | 0.2535 |
| SSIM | 0.8570 | 0.8527 | |
Table 3.
Parameters for TerraSAR-X data simulation.
| Satellite Altitude | Incidence Angle | Perpendicular Baseline | Pixel Spacing | |
|---|---|---|---|---|
| 510 km | 33° | 200 m | Range: 3 m Azimuth: 3 m | ~28 m |
© 2017 by the authors. Licensee MDPI, Basel, Switzerland. This article is an open access article distributed under the terms and conditions of the Creative Commons Attribution (CC BY) license (http://creativecommons.org/licenses/by/4.0/).
Share and Cite
MDPI and ACS Style
Zhu, J.; Ding, X.; Li, Z.; Zhu, J.; Xu, B. High-Rise Building Layover Exploitation with Non-Local Frequency Estimation in SAR Interferograms. Remote Sens. 2017, 9, 579. https://doi.org/10.3390/rs9060579
AMA Style
Zhu J, Ding X, Li Z, Zhu J, Xu B. High-Rise Building Layover Exploitation with Non-Local Frequency Estimation in SAR Interferograms. Remote Sensing. 2017; 9(6):579. https://doi.org/10.3390/rs9060579
Chicago/Turabian StyleZhu, Jun, Xiaoli Ding, Zhiwei Li, Jianjun Zhu, and Bing Xu. 2017. "High-Rise Building Layover Exploitation with Non-Local Frequency Estimation in SAR Interferograms" Remote Sensing 9, no. 6: 579. https://doi.org/10.3390/rs9060579
Note that from the first issue of 2016, this journal uses article numbers instead of page numbers. See further details here.