Poppy Crop Height and Capsule Volume Estimation from a Single UAS Flight


School of Land and Food, University of Tasmania, Private Bag 76, Hobart, TAS 7001, Australia
*
Author to whom correspondence should be addressed.
Remote Sens. 2017, 9(7), 647; https://doi.org/10.3390/rs9070647
Submission received: 8 March 2017
/
Revised: 14 June 2017
/
Accepted: 20 June 2017
/
Published: 22 June 2017
(This article belongs to the Special Issue Remote Sensing of Smallholder Subsistence Agriculture Using Satellites and UAVs)
Abstract
:The objective of this study was to estimate poppy plant height and capsule volume with remote sensing using an Unmanned Aircraft System (UAS). Data were obtained from field measurements and UAS flights over two poppy crops at Cambridge and Cressy in Tasmania. Imagery acquired from the UAS was used to produce dense point clouds using structure from motion (SfM) and multi-view stereopsis (MVS) techniques. Dense point clouds were used to generate a digital surface model (DSM) and orthophoto mosaic. An RGB index was derived from the orthophoto to extract the bare ground spaces. This bare ground space mask was used to filter the points on the ground, and a digital terrain model (DTM) was interpolated from these points. Plant height values were estimated by subtracting the DSM and DTM to generate a Crop Height Model (CHM). UAS-derived plant height (PH) and field measured PH in Cambridge were strongly correlated with R2 values ranging from 0.93 to 0.97 for Transect 1 and Transect 2, respectively, while at Cressy results from a single flight provided R2 of 0.97. Therefore, the proposed method can be considered an important step towards crop surface model (CSM) generation from a single UAS flight in situations where a bare ground DTM is unavailable. High correlations were found between UAS-derived PH and poppy capsule volume (CV) at capsule formation stage (R2 0.74), with relative error of 19.62%. Results illustrate that plant height can be reliably estimated for poppy crops based on a single UAS flight and can be used to predict opium capsule volume at capsule formation stage.
1. Introduction
UAS-based remote sensing technology has demonstrated the potential for precision agriculture by providing data at high temporal and spatial resolution [1]. In precision agriculture, remote sensing has been used to monitor crop growth and health by computing a range of spectral vegetation indices [2,3,4,5,6,7,8,9]. However, recently more attention has been given to the use of crop height modelling for yield estimation [10,11,12]. In this context, several studies have shown that crop productivity, in certain crop types (e.g., maize, potato, barley, wheat, corn, rice, sunflower and poppy [11,13,14,15,16,17,18,19,20,21,22], can be assessed from biophysical characteristics, such as crop height and biomass. Crop height is an important factor for yield estimation and crop management [11,19,20,21,22,23]. Crop height is a significant indicator of yield estimation in maize [10], whereas, in barley, crop height has been utilised to estimate biomass [11]. In the case of poppy crops, only a single study has looked at the use of remote sensing methods, in which crop height and Leaf Area Index (LAI) were found to be two suitable indicators for estimating opium yield [21].
UAS have become a viable and cost-effective alternative to manned airborne or satellite remote sensing for precision agriculture, given their ability to collect high spatial resolution data at critical times during the growing season [1,24,25,26,27]. Moreover, UAS aerial photography allows overlapping imagery to be collected, which is widely used for three-dimensional (3D) image reconstruction and facilitates change analysis [11,28,29,30,31]. Three-dimensional measurements of crop structure are possible by generating Crop Surface Models (CSMs), which enable crop height measurement [11,26,27,32]. Availability of CSM at high spatial resolution and high vertical accuracy is of increasing importance for site-specific precision agriculture. The change in height values between the DTM at the time of sowing and DSM at crop maturity can be used to derive plant height, which can improve understanding of the relation between plant height, biomass, and yield [11,32].
For the reliability and accuracy of estimated crop biomass or crop yield, the availability of timely information on crop height is important. In recent years, automated image orientation technique Structure from Motion (SfM) complemented by dense image-matching through Multi-View Stereo (MVS) has become a popular technique to derive 3D information about terrain and vegetation from UAS images [11,26,27,29,32,33,34,35]. The SfM-MVS workflow starts with automated image feature detection and identification followed by feature matching between overlapping images. Next, SfM-MVS uses bundle adjustment algorithms to simultaneously estimate the 3D geometry, the different camera poses (extrinsic calibration) and the camera intrinsic parameters (intrinsic calibration) [34,35,36,37]. The output of the SfM stage is a sparse, unscaled 3D point cloud in arbitrary units along with camera models and orientation [29,30,34,37]. The 3D point cloud can be registered to a projected coordinate system by identifying and incorporating ground control points in the bundle adjustment [26,27,29,38]. A dense image matching algorithm is then employed to extract a dense 3D point cloud from the images [29,34,35,36,39,40,41,42].
The SfM-MVS workflow has been successfully applied for estimation of crop height [11,18,26,32]. DTMs have been produced with imagery acquired at the sowing stage, and subsequent DSMs have been derived from UAS imagery at several critical crop stages [11]. The vertical difference of both surface models (DSMs) and the DTM was used to estimate the crop height. A challenge with this method is that it requires either a precise DTM or at least two flights to collect the DTM before crop sowing and crop DSM during the growing season. It is not always feasible to collect a DTM at the start of the growing season, and, therefore, our study aims to estimate crop height from a single UAS flight.
In this study, we focus on a high-value alkaloid poppy crop (Papaver somniferum L.), grown for pharmaceutical applications, to demonstrate the application of UAS-based crop height assessment. In earlier studies, different physiological indicators, such as plant height, have been assessed to predict opium yield [20,21,43,44,45,46,47,48]. Spectral indices have been reported to estimate capsule volume and showed a significant correlation between NDVI and capsule volume from flowering till harvesting stage [7]. In most fields, poppy crop growth is spatially highly heterogeneous and requires a substantial amount of data collection to develop models for yield estimation [45]. Several studies have highlighted this phenomenon based on field observation of poppy crops grown under controlled conditions [43,45,48,49,50]. Few studies have used remote sensing technologies for poppy yield estimation [7,21]. Data collected from field measurements, particularly physical measurements of the crop, provide reference information on crop growth. The spatial coverage of detailed field measurements is often limited, however remote sensing techniques can help to identify the spatial variability of key yield indicators at a much broader scale. This paper aims to investigate the potential use of low-cost image acquisition using a UAS-based platform for the estimation of poppy crop height and capsule volume. More specifically, the first objective of our study is to develop a new approach that facilitates crop height estimation from a single UAS flight. The second objective is to assess the potential of UAS-based CSM to predict poppy capsule volume (CV) using plant height as the predictor variable.
2. Materials and Methods
2.1. Study Area
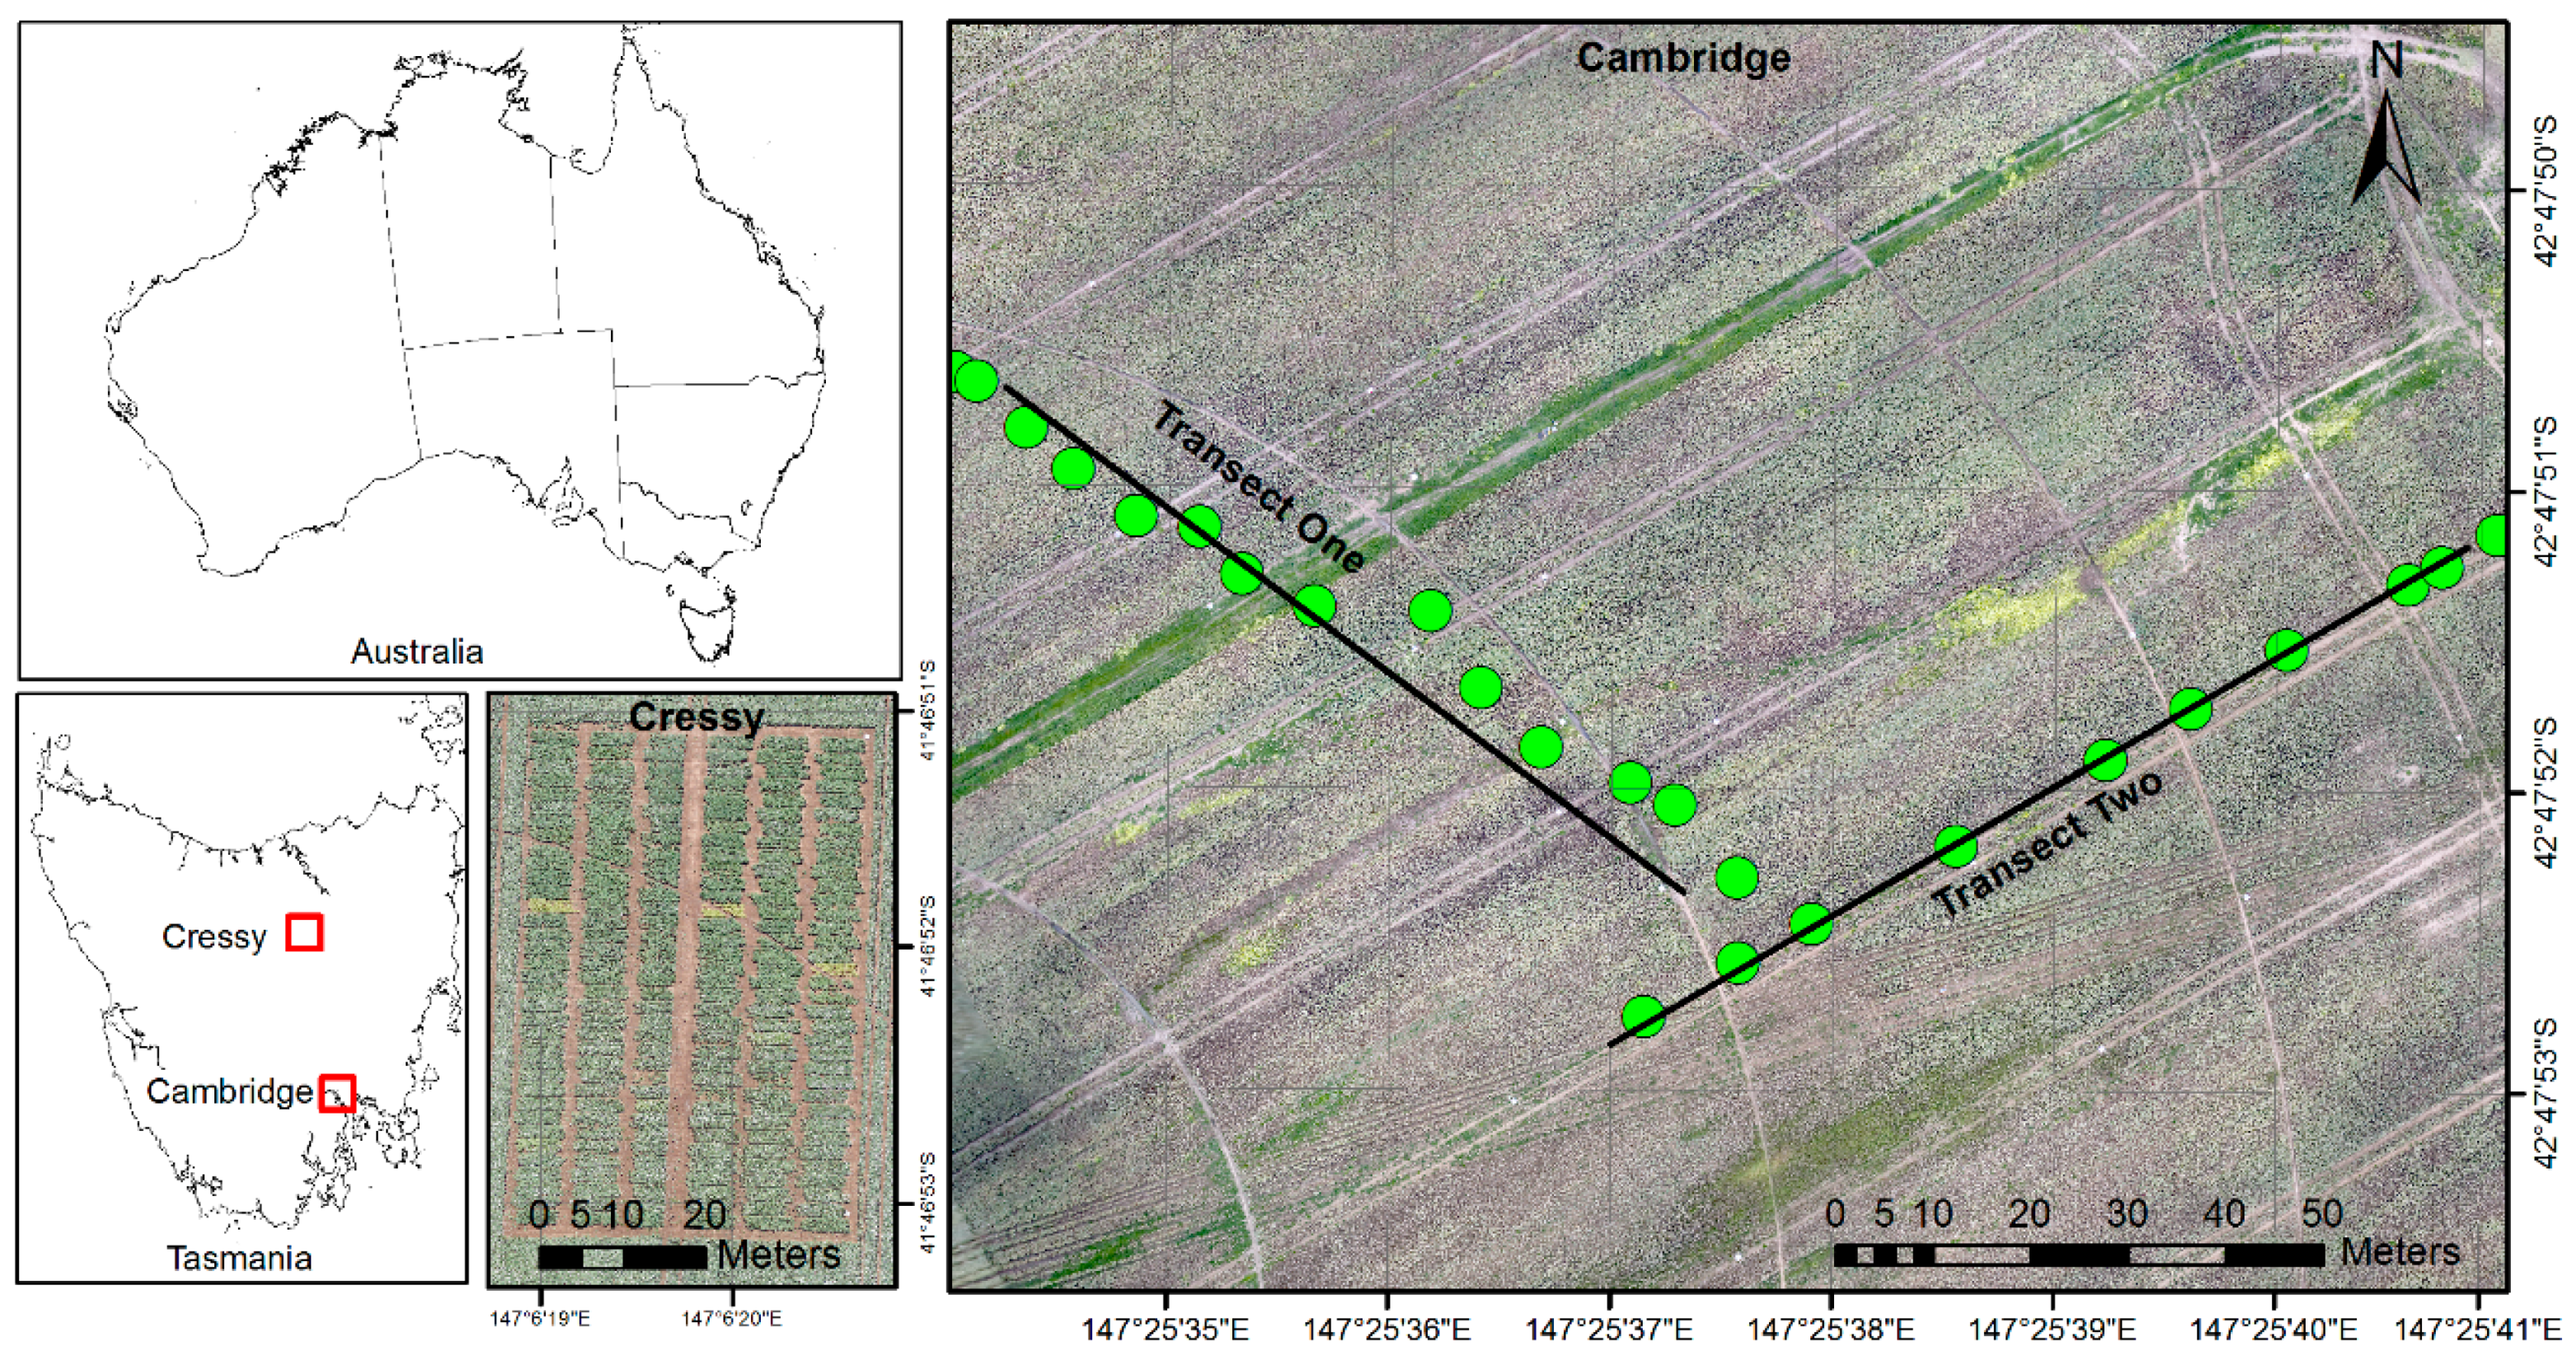
This research was conducted in Tasmania, Australia on opium poppy, which was grown for the pharmaceutical industry subject to government licensing. Two different field sites were selected for this study (Figure 1).
The first study area was a commercial poppy crop located at Cambridge, Tasmania (42°47’50”S, 147°25′33′′E, altitude 32 m) and the total sown area was ~16 hectares. The field was irrigated with a centre pivot irrigation system. Poppy seed was sown in late July 2014 in a well-cultivated field using seed drills, with seedling emergence in the following 1–2 weeks. Flowering occurred in November, with capsule formation starting in late December and poppy capsules were harvested in late January 2015. The crop was sown with a seed drill to maintain a row distance of 6 cm with a seeding density of 80 seeds per square meter.
The second study area was located in Cressy, Tasmania (41°41′S, 147°05′E) and the assessment was conducted in the subsequent field season. Many aspects of the crop were similar to the Cambridge site. The Cressy field was also irrigated with a centre pivot system, seed was sown in mid-August 2015 in a well-cultivated field using a seed drill, and the months of flowering, capsule formation and harvest (late January 2016) were the same. However, the crop was sown with a higher density (90 seeds per square meter) in 210 separate sample plots. This site was used to conduct an independent UAS campaign to verify the robustness of the single flight method.
2.2. Data Collection
2.2.1. Field Measurement
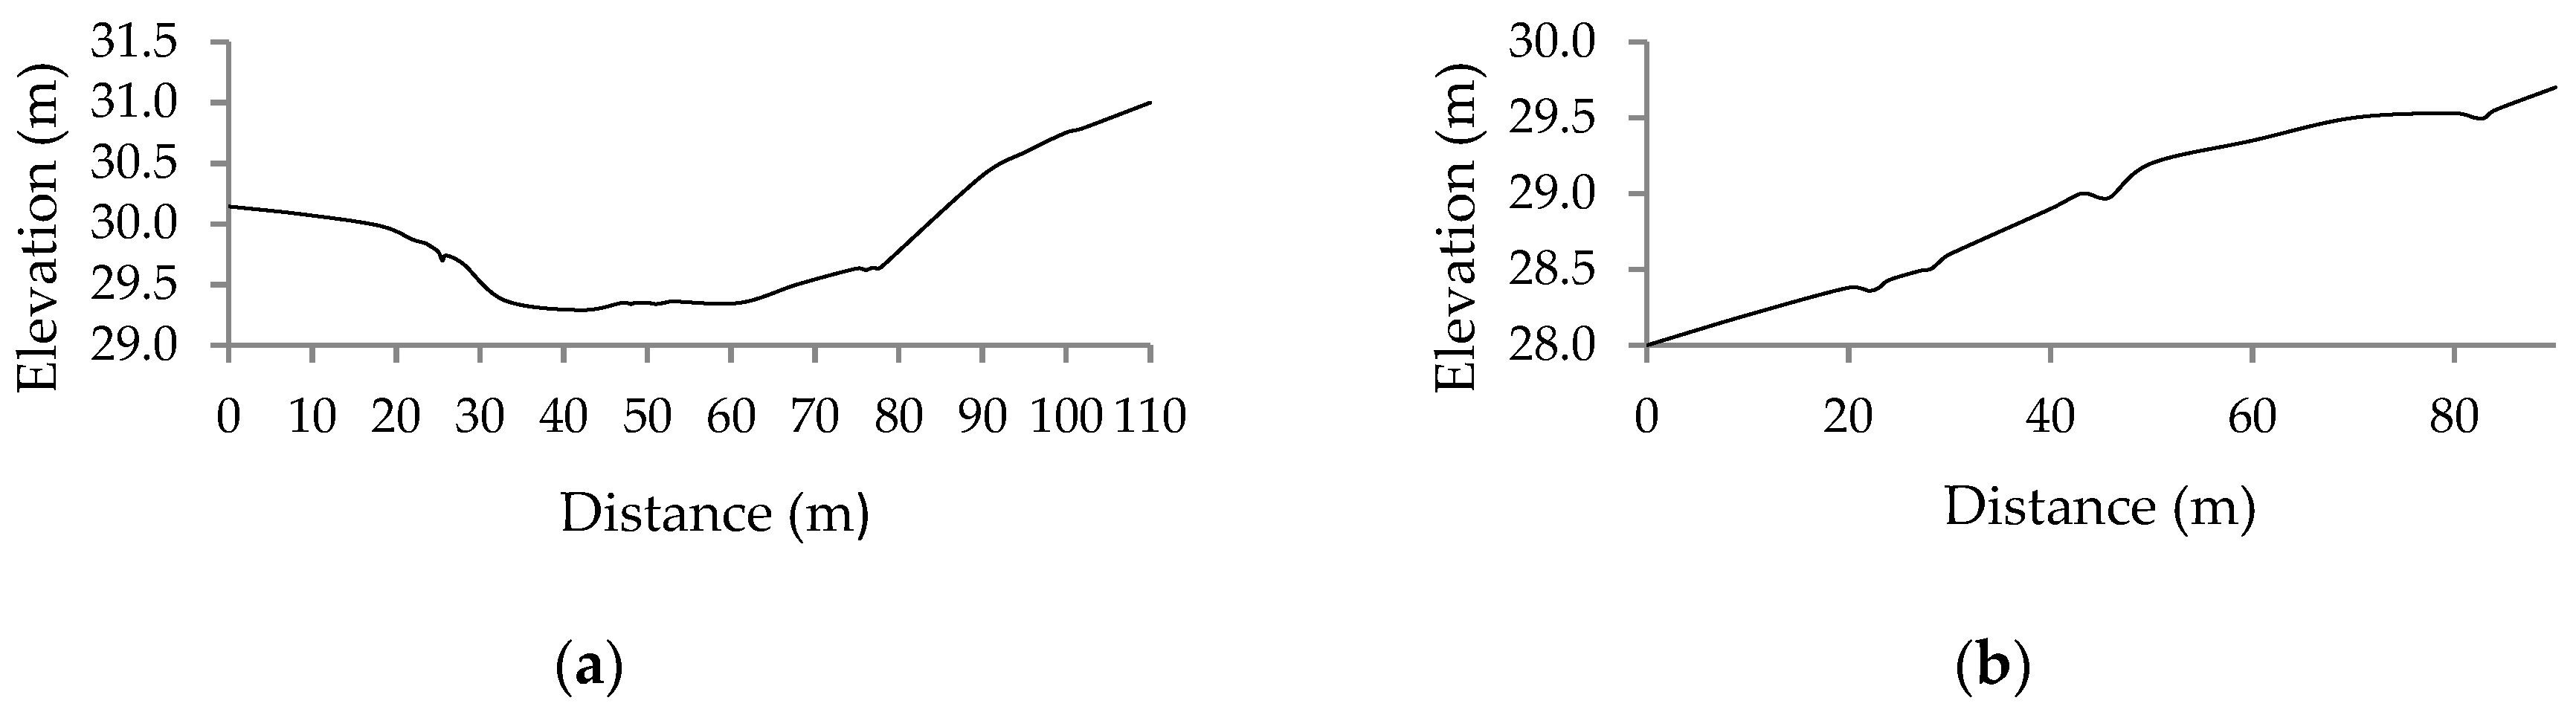
For the Cambridge site, physical data were collected at four time points (Table 1). Field measurements were conducted along two transects, each a total length of ~90 m. Transect 1 (T1) was selected based on topographical variation, as it crossed a drainage channel in the field (Figure 2a). In contrast, Transect 2 (T2) was located in a part of the field with less topographical variability (Figure 2b). The location of both transects is shown in Figure 1. Field data collection was organised in 25 (0.25 m × 0.25 m) sample plots (sampled at every 5 to 8 m in each transect), which included the physical measurements of 125 plants along the two transects. Sampling plots were selected randomly along the transect lines and were marked to allow for repeat data collection at different growth stages, i.e., flowering, capsule development and capsule formation (Table 1). At each sample plot, physical parameters including the number of plants and capsules, horizontal and vertical dimensions of each capsule, and plant height (PH) were measured using Vernier calipers and steel measuring tape, respectively (Figure 3). Average plant height and average capsule dimensions per plot were determined. Capsule volume was calculated by assuming the capsule to be an ellipsoid [19]. Linear regression was computed for plant height (PH) at three stages against capsule volume (CV) at the capsule formation stage (Table 1). For capsule volume estimation, an empirical relationship between crop height and capsule volume was developed from the field observations at capsule formation stage. This relationship was used to estimate capsule volume using UAS acquired plant height information.
For the Cressy site, two assessment periods were included (Table 1). Field measurement was conducted from 210 (5 m × 1.8 m) sample plots, with data obtained from 20 plants per plot. Plant height was measured at capsule formation stage (3 December 2015).
2.2.2. GPS Survey
Accurate GPS coordinates of each sample plot and Ground Control Points (GCPs) were measured with survey-grade dual frequency RTK GPS (2–4 cm absolute coordinate accuracy). Photo targets generated with Agisoft Photoscan were printed on 0.5 m × 0.5 m plastic boards and were distributed in the field to be used as GCPs for UAS-based image processing [29]. Twenty GCPs were distributed evenly in the both experiment area. For the Cambridge site, fourteen GCPs were used as constraints in the bundle block and were used to automatically georeference the whole camera network, while six GCPs were used for the validation of processed imagery results. For the Cressy site, five GCPs were used for 3D model construction, whereas, 15 GCPs were used for model validation.
2.2.3. UAS Campaign
In this study, three UAS campaigns were conducted (Table 1). We used an OktoKopter UAS platform to acquire the imagery [29]. An OktoKopter is a multi-rotor platform and has a total take-off weight of 3 kg. This platform has a camera stabiliser gimbal with capacity to carry a payload of up to 2 kg for a flight duration of around 5–10 min, which is sufficient to capture UAV-MVS imagery for a 1–2 ha area. Two separate flights were conducted to cover the whole area. This platform was controlled with an autopilot and navigation-grade GPS receiver to collect (x, y) positions and altitude for the camera stations. The RGB images, with a 5184 × 3456 pixel array, were acquired with a Canon 550D DSLR digital camera (18 Megapixels). The camera was operated with a 20 mm fixed focal length lens on manual focus mode fixed to infinity. The exposure time of the camera was set to a fast shutter speed of 1/1600th of a second to reduce motion blur and the ISO was set to 125 to reduce noise in the image with an aperture of f/2.8. The camera was triggered by the flight controller to capture the image after every ~1.5 s. The images were acquired at an altitude of approximately 50 m with a mean spatial resolution of 1 cm. Finally, the images were acquired along evenly spaced flights with ~90% forward overlap and ~70% side overlap between images in cloudless illumination condition at 12:30 pm to 1:30 pm.
2.3. UAS Data Analysis and DSM Generation
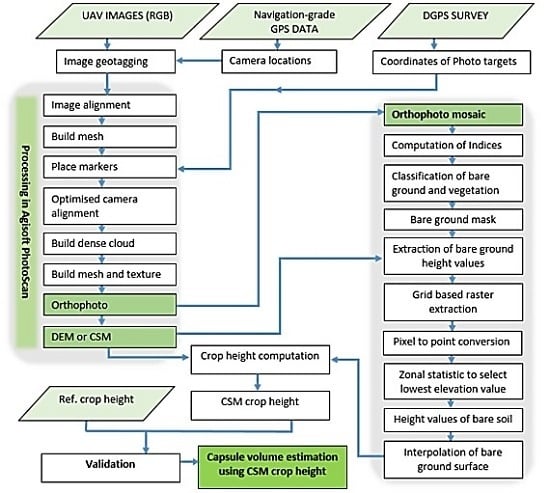
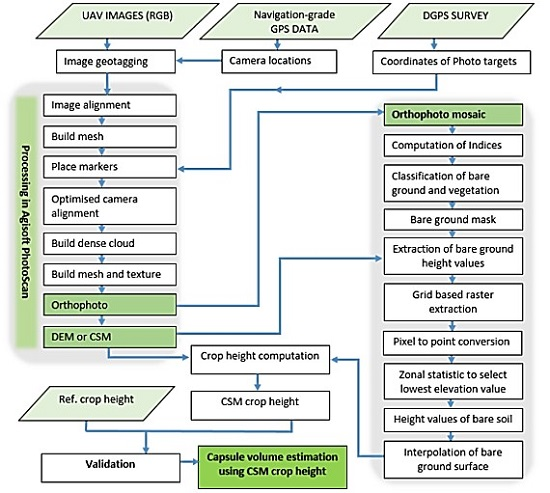
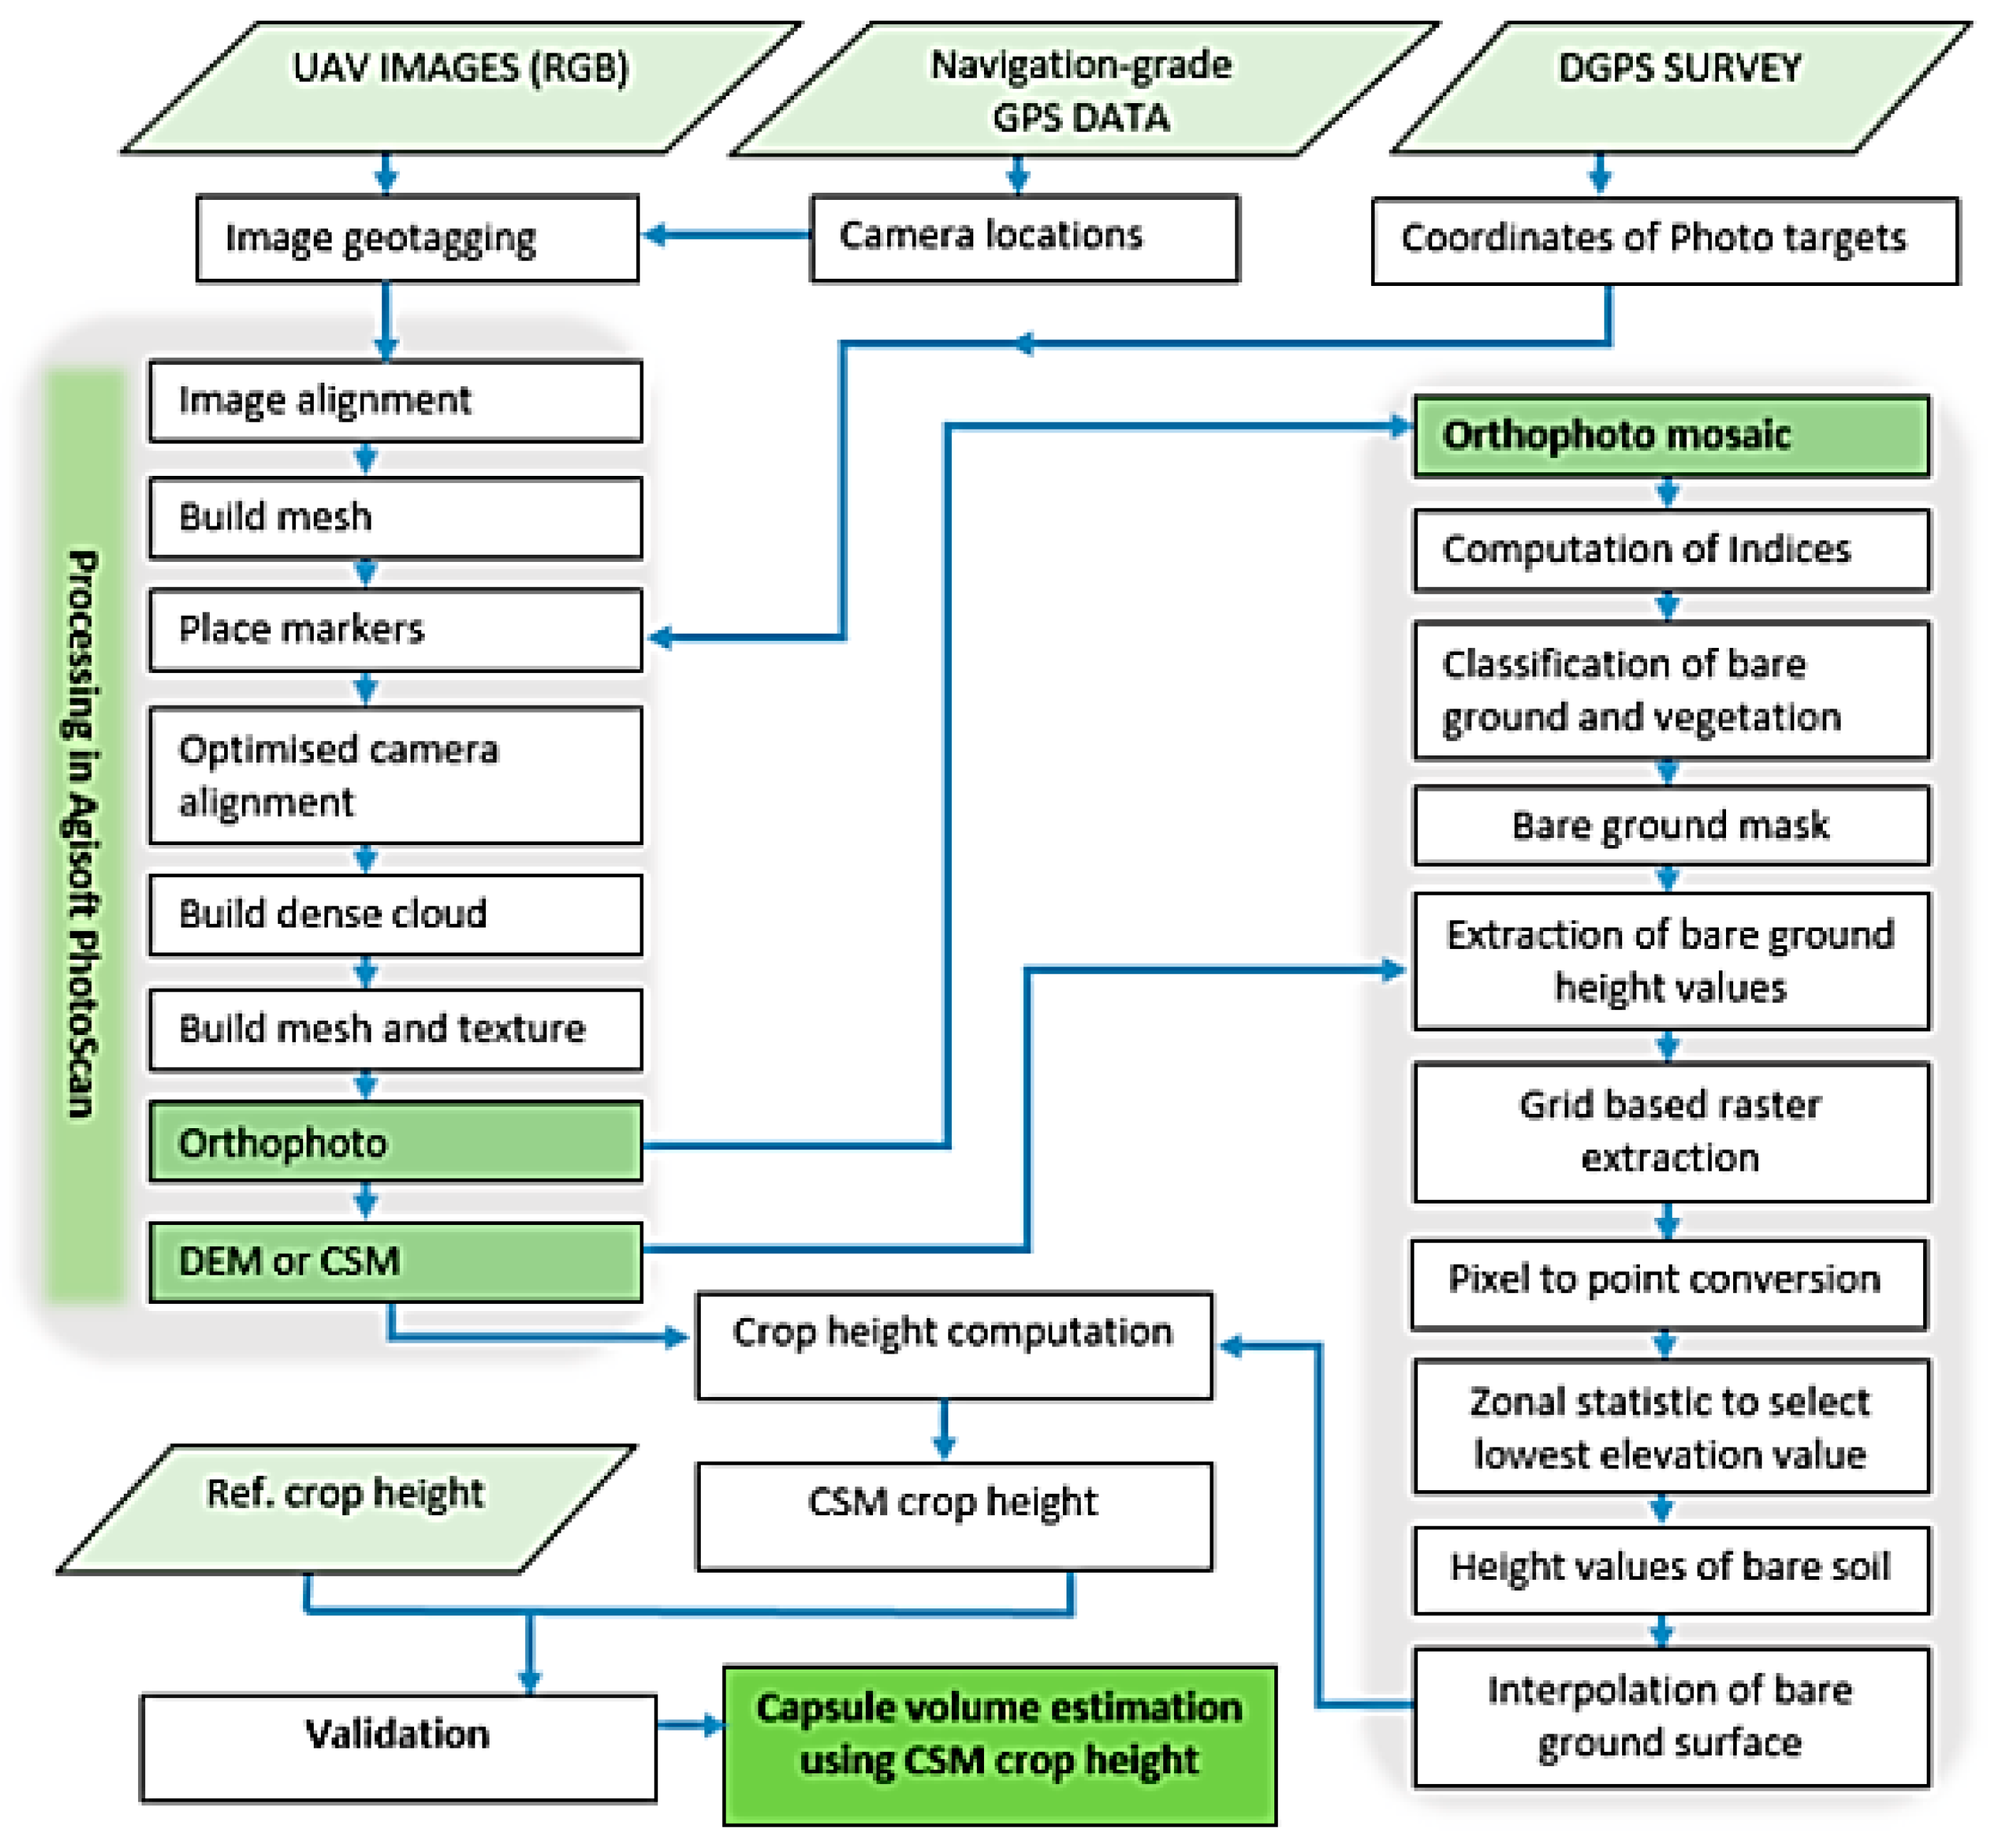
The main methodology of this research is summarised in Figure 4. The study was based on crop height estimation using SfM-MVS image reconstruction approach with Agisoft PhotoScan software [11,28,29,30,31,35]. As detailed further below in Section 2.3.1, UAS images were processed to generate DSMs and orthomosaics of the study areas. As poppy crop growth is relatively dense compared to other crops, it is not always possible to detect bare ground patches within the crop. Therefore, mosaicked orthophotos with R, G, and B bands were used to classify crop and bare soil pixels [32]. The bare soil pixel masks were used to extract the corresponding height values from the 3D model generated using Agisoft PhotoScan. Extracted soil height values were spatially interpolated using a Spline algorithm to generate the DTM surface. DSM (height values of crop) and DTM (height values of ground) data were subtracted to estimate the crop height. The results were compared against field measurements of crop height (at sample plot level) in order to assess the accuracy of the method. Finally, the relationship of plant height and capsule volume developed from the Cambridge field data was used to estimate capsule volumes using UAS determined crop height.
The single flight method for estimation of crop height used at Cambridge (Figure 4), was tested at the Cressy site. In this verification process, comparison was made between a single UAS flight and the traditional methodology for crop height estimation using two separate flight campaigns [26,51]. A bare ground DTM was created by conducting a UAS campaign over the bare field at the time of sowing (17 September 2015). The second flight campaign was conducted at capsule formation stage (3 December 2015) and the UAS images were used to develop a DSM and orthophoto mosaic. Data of proposed (single flight) and traditional CSMs were statistically compared to quantify the accuracy of the new method.
2.3.1. DEM Generation
The workflow involved in processing UAS-mounted RGB camera imagery is represented in Figure 4. UAS-MVS acquired imagery and corresponding GPS data were used to geotag all images. The process of geotagging images speeds the process of extracting orientation information and reducing the computation required for feature identification and feature-matching to estimate camera parameters [30]. Computation of 3D object geometry information from overlapping images is possible using feature matching in multiple views through SfM-MVS algorithms [52].
In this study, we utilized Agisoft PhotoScan Professional Version 1.1.4 to generate 3D models and orthophotographs. The first step is the image feature detection, feature matching, and bundle adjustment. This process results in a sparse point cloud (based on the image features used in the bundle adjustment) and the initial camera locations. The “High Accuracy” and “Reference” pair selection settings were used to achieve accuracy high quality bundle adjustment. The resulting 3D model was used to build a 3D texture model to manually identify the GCP targets. This model was used to position the GCP markers approximately, after which the exact position of the markers was refined in every image [29,30,35]. Based on GCP coordinates measured in the field using RTK GNSS (2–4 cm absolute accuracy), the camera alignment was optimised to generate the dense point cloud. For the production of the dense point cloud, the point quality was set to “High“ and depth filtering setting was set as default “Aggressive”. Finally, the orthophoto and DSM were exported with the standard procedure of Agisoft PhotoScan.
2.4. Vegetation Indices and Bare Ground Pixel Extraction
In Tasmania, poppy crops are sown using seed drills that create areas of bare ground, which in this case was approximately from 0.5 to 1.0 m wide and provides the visibility of ground areas from UAS imagery. Moreover, areas of bare ground were also visible in the orthophoto, either due to wheel tracks of spray equipment, or between plants in areas of weaker growth. The seeding density of 80–90 seeds per square meter with dense growth makes it difficult to classify ground points within the crop. Therefore, an orthophoto mosaic with R, G, and B bands was used to compute RGB indices for the delineation of crop and soil pixels [32]. The Red-Green index [53,54] was computed using DN values (unsigned integer) to classify the crop and bare ground pixels. The output index values ranged between −1.0 to +1.0. Index layer pixels were classified as bare ground when pixel values were below zero and as vegetation when above zero.
The classified bare ground areas were used to mask all bare ground areas throughout the image. Masked areas were used to extract the pixel-based height values from the DSM. To ensure the classification of real ground values, polygon grids of 0.5 × 0.5 m were created and used to extract the height values from masked bare ground areas. Each pixel bare ground height value was converted into a point. To ensure the selection of real ground surface height value, zonal statistics for each zone were calculated in ArcGIS 10.3 to determine the lowest elevation points in each zone. These were used to generate the DTM with spatial Spline interpolation, which minimises the overall surface curvature. This results in a smooth surface that passes exactly through the input points. A CSM is calculated by subtracting the DTM from the DSM [11,32]. For plot-based analysis, a square buffer of 0.25 m was placed around each surveyed point for each sample plot. Finally, from the CSM layer, pixels falling in each sample plot were extracted. Based on the CSM, individual plant heights were extracted solely from crop classified pixels and used for statistical analysis and accuracy assessment.
2.5. Plant Height and Capsule Validation
PH estimates derived from the UAS-CSM at Cambridge were compared to the reference measurements on the ground to assess the accuracy of this method. The height error was calculated as the difference between actual PH measured in the field and estimated PH from the UAS CSM. The root mean square error (RMSE) of the errors was calculated along with the regression fit and the R2 between measured and estimated PH. PH derived from the UAS CSM was used to estimate CV and the simulated results were also verified with field observations. Moreover, Cressy site PH obtained from a single flight and from traditional methodology were compared with field measured data.
3. Results
3.1. Field Measurements
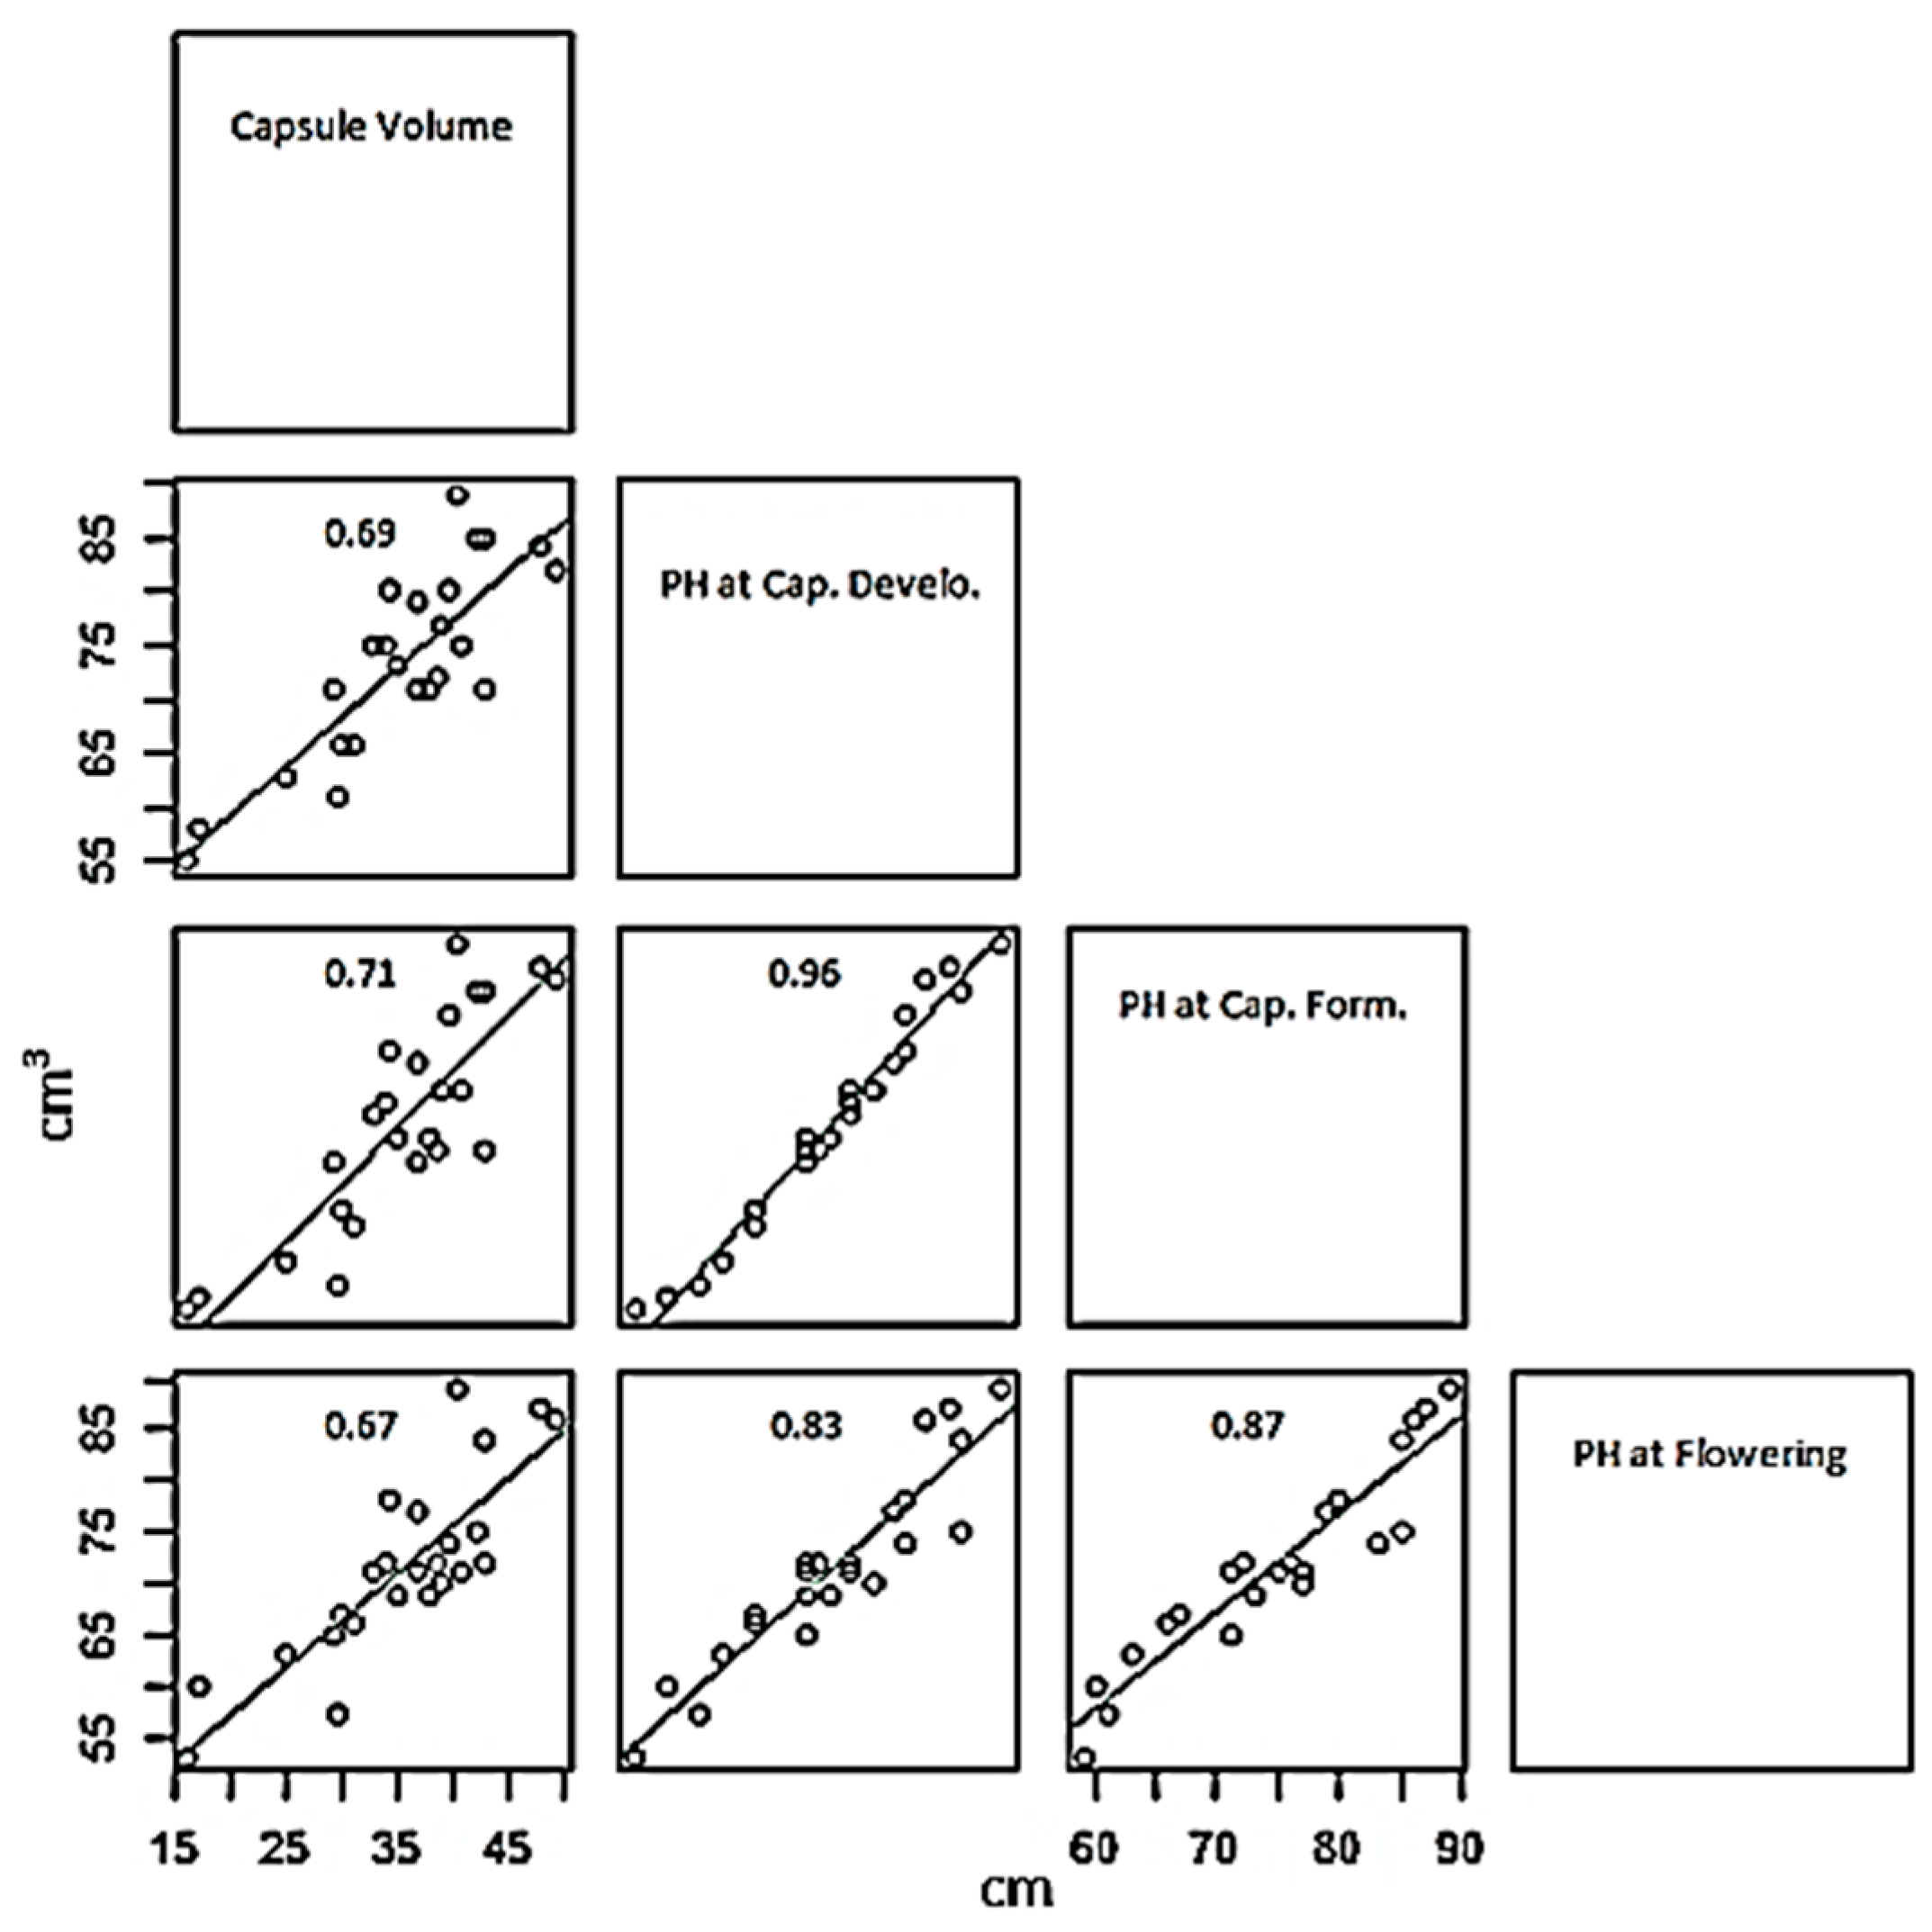
Field-based plant measurements showed that PH at the capsule development stage is the strongest predictor for CV estimation, based on the stages assessed in this study (Figure 5). The highest correlation of PH with CV was observed at capsule formation stage (R2 of 0.71) in T1, whereas, at capsule development and flowering stage the correlations were lower (R2 0.69 and 0.67 respectively). The significant and moderately strong correlation between PH (measured) and CV (measured) observed at capsule formation stage were found for both Transect 1 and 2 data (Figure 6). During the flowering stage, the poppy opium capsule still needs time to develop, however, the increase in plant height stops at this stage and the plant moves towards the next phenological stage.
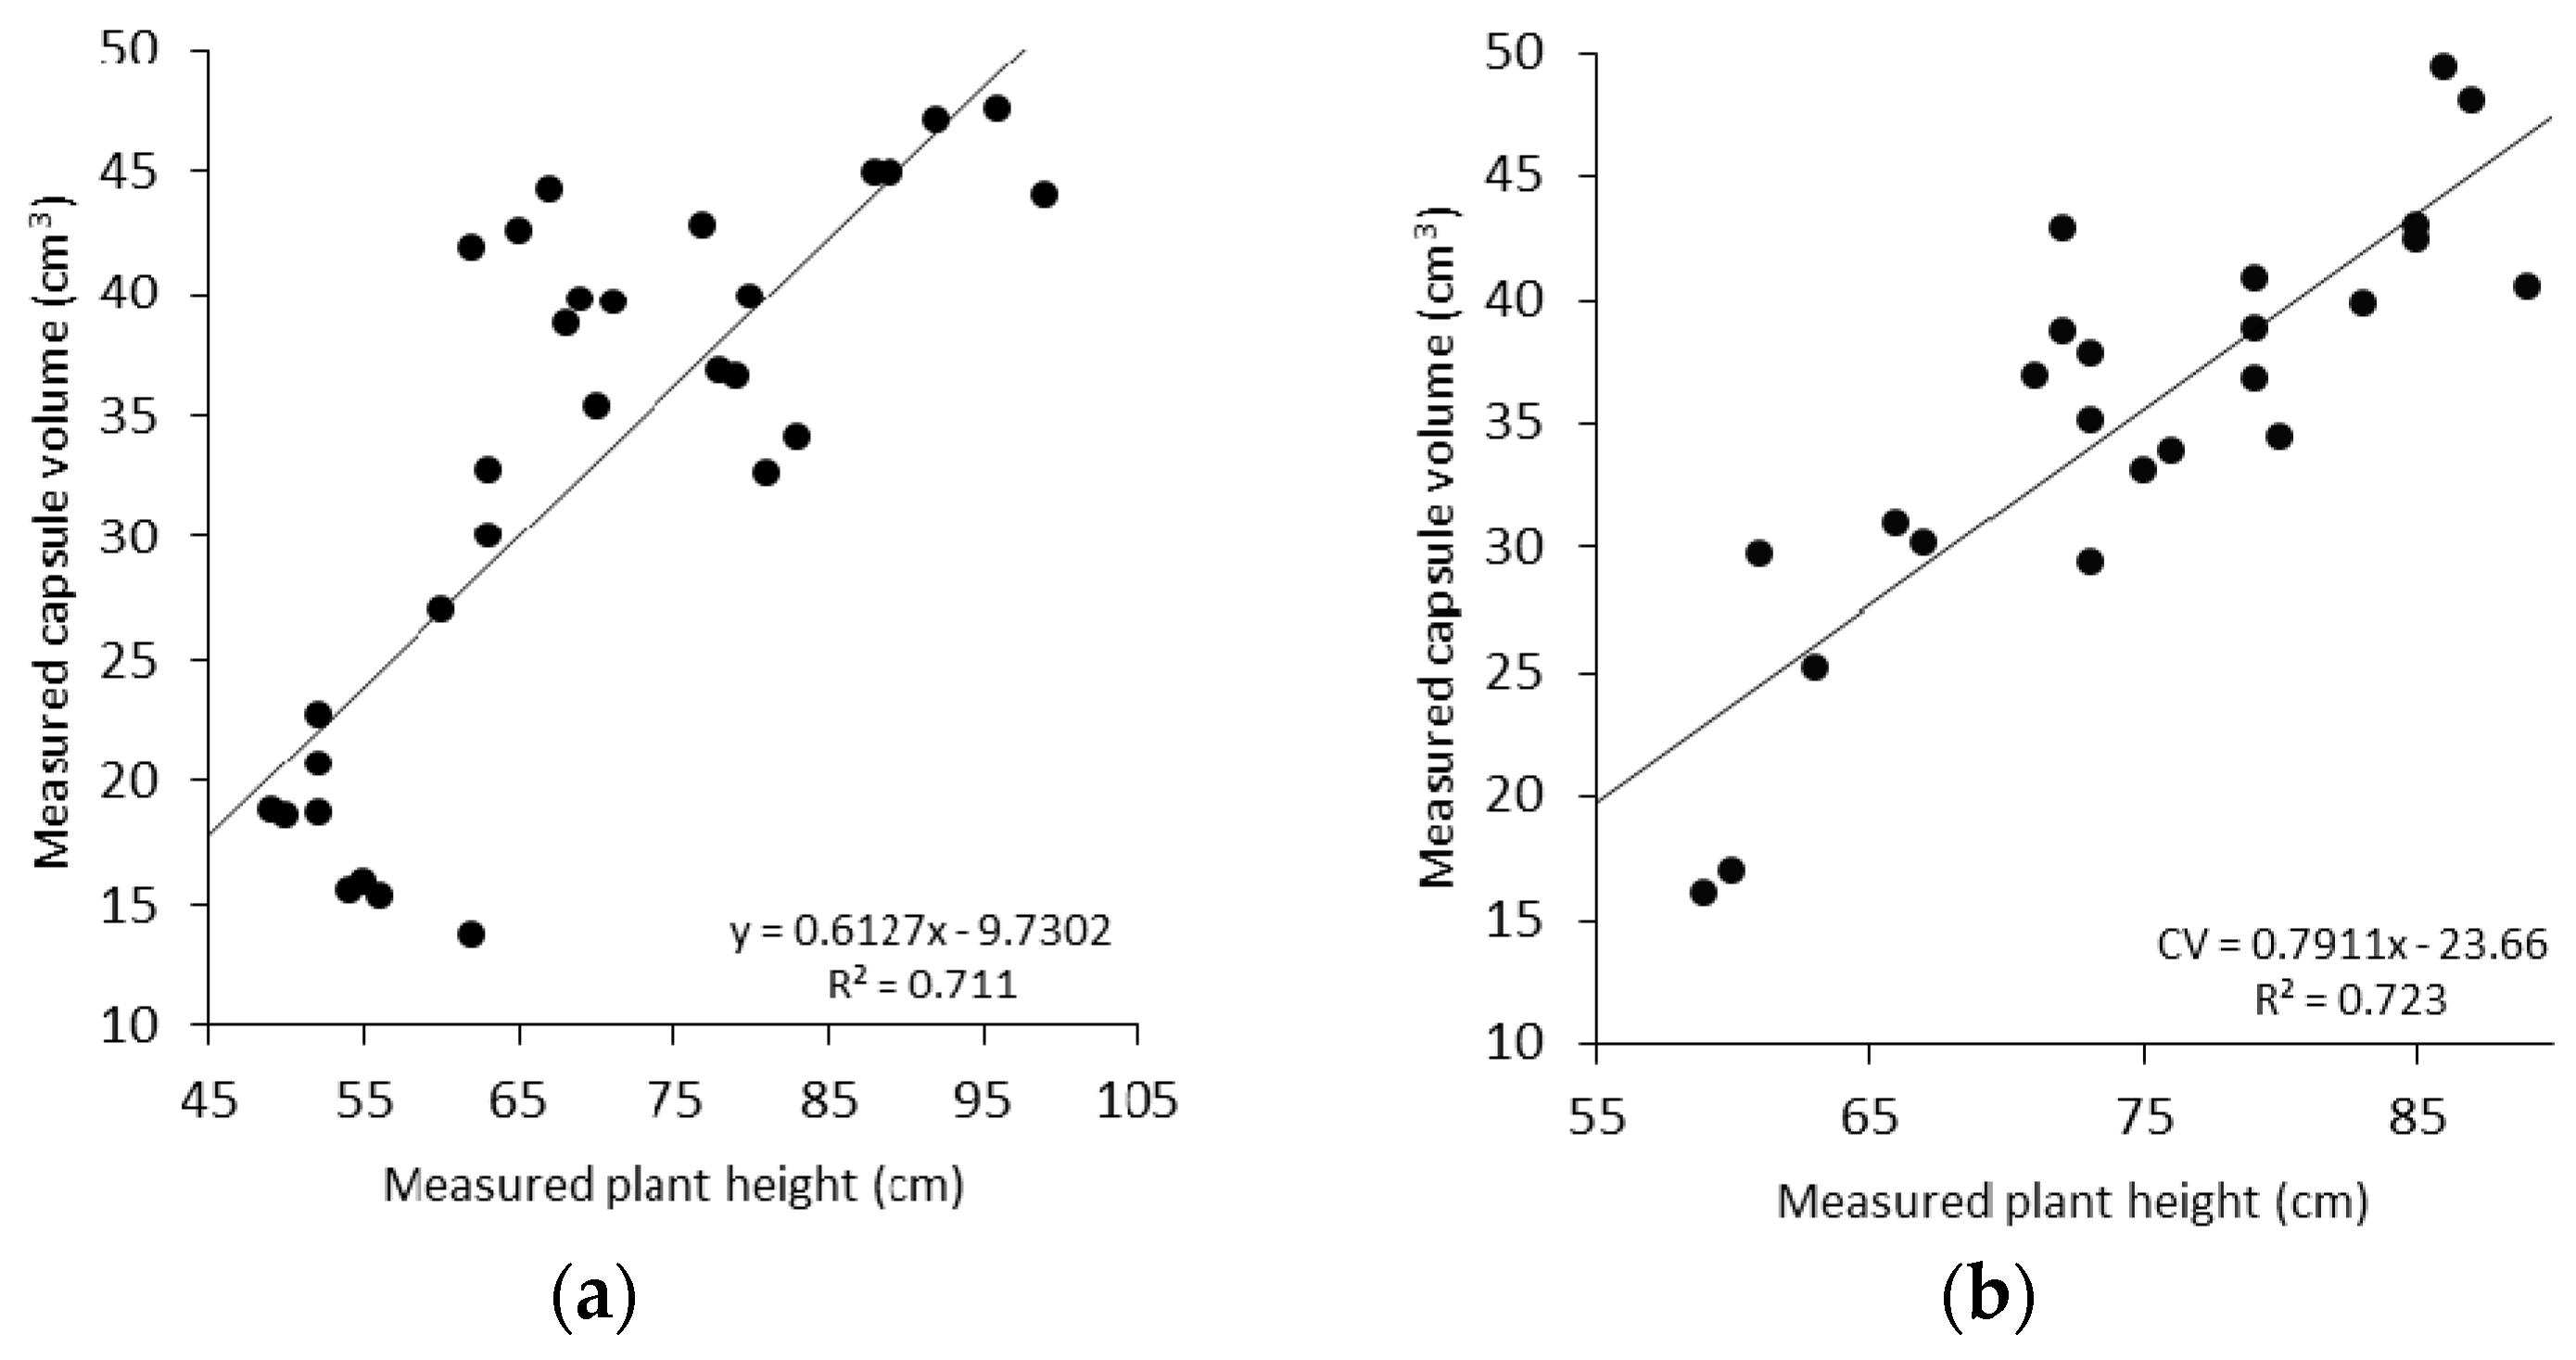
Figure 6 shows a significant relationship between PH and capsule volume at capsule formation stage. We selected this stage for analysis because the yield predication at this stage can be used to appropriately manage the required resources to optimize yield. The relationship is more apparent during the capsule formation stage (as evident from Figure 5), showing an increase in CV with an increase in PH (Figure 6 and Table 2).
High PH is an indicator of vigorous plant growth and typically is associated with multiple and larger capsules per plant. During the capsule formation stage, the correlation between PH and CV at plant level shows R2 = 0.711 at T1 and R2 = 0.723 at T2. Thus, it can be concluded that the PH during flowering and capsule formation stage is the best indicator for capsule volume estimation. The model developed based on T1 field data was validated on T2 and vice versa yielding RMSE of 20.80% and 15.0%, respectively (Table 3).
Data obtained from T1 showed greater variation in CV compared to T2, ranging from 13.71 cm3 to 60 cm3 in T1 and 16.08 cm3 to 49.35 cm3 in T2 (Table 2). Similarly, a wider range of PH was observed in T1, i.e., 49 cm to 110 cm as compared to T2 ranging from 59 to 89 cm.
3.2. Crop Surface Model Generation
The Cambridge site analysis of the 3D model generated in Agisoft PhotoScan with reference to GCPs resulted in an overall RMSE of 7.60 cm. The accuracy of using the Red Green Index to classify vegetation from bare ground was checked by conducting a survey of bare ground patches in the field. In the survey, 152 points were collected from both classes (bare ground and cropping area) and the overall accuracy of classification was 93.72%. Extraction of the actual bare ground surface was achieved by eliminating false classification points. The resultant areas were then used to extract the height values of bare ground from the DSM. The extracted height values were interpolated using a Spline interpolation algorithm to generate the DTM. The height values of DTM pixels were compared with the corresponding surveyed points. For each point, the error was calculated as the difference between actual ground elevations measured in the field using DGPS with the ground elevation obtained from the interpolated DTM layer. The accuracy assessment indicated an overall RMSE of 9 cm. In the case of the Cressy site, the overall RMSE of the surface model derived from the campaign at the sowing stage was 2.5 cm. For the model generated at capsule formation stage, results yielded an overall horizontal RMSE of 6 cm and the vertical RMSE of 4 cm.
3.3. Relationship between CSM-Derived PH and Measured PH
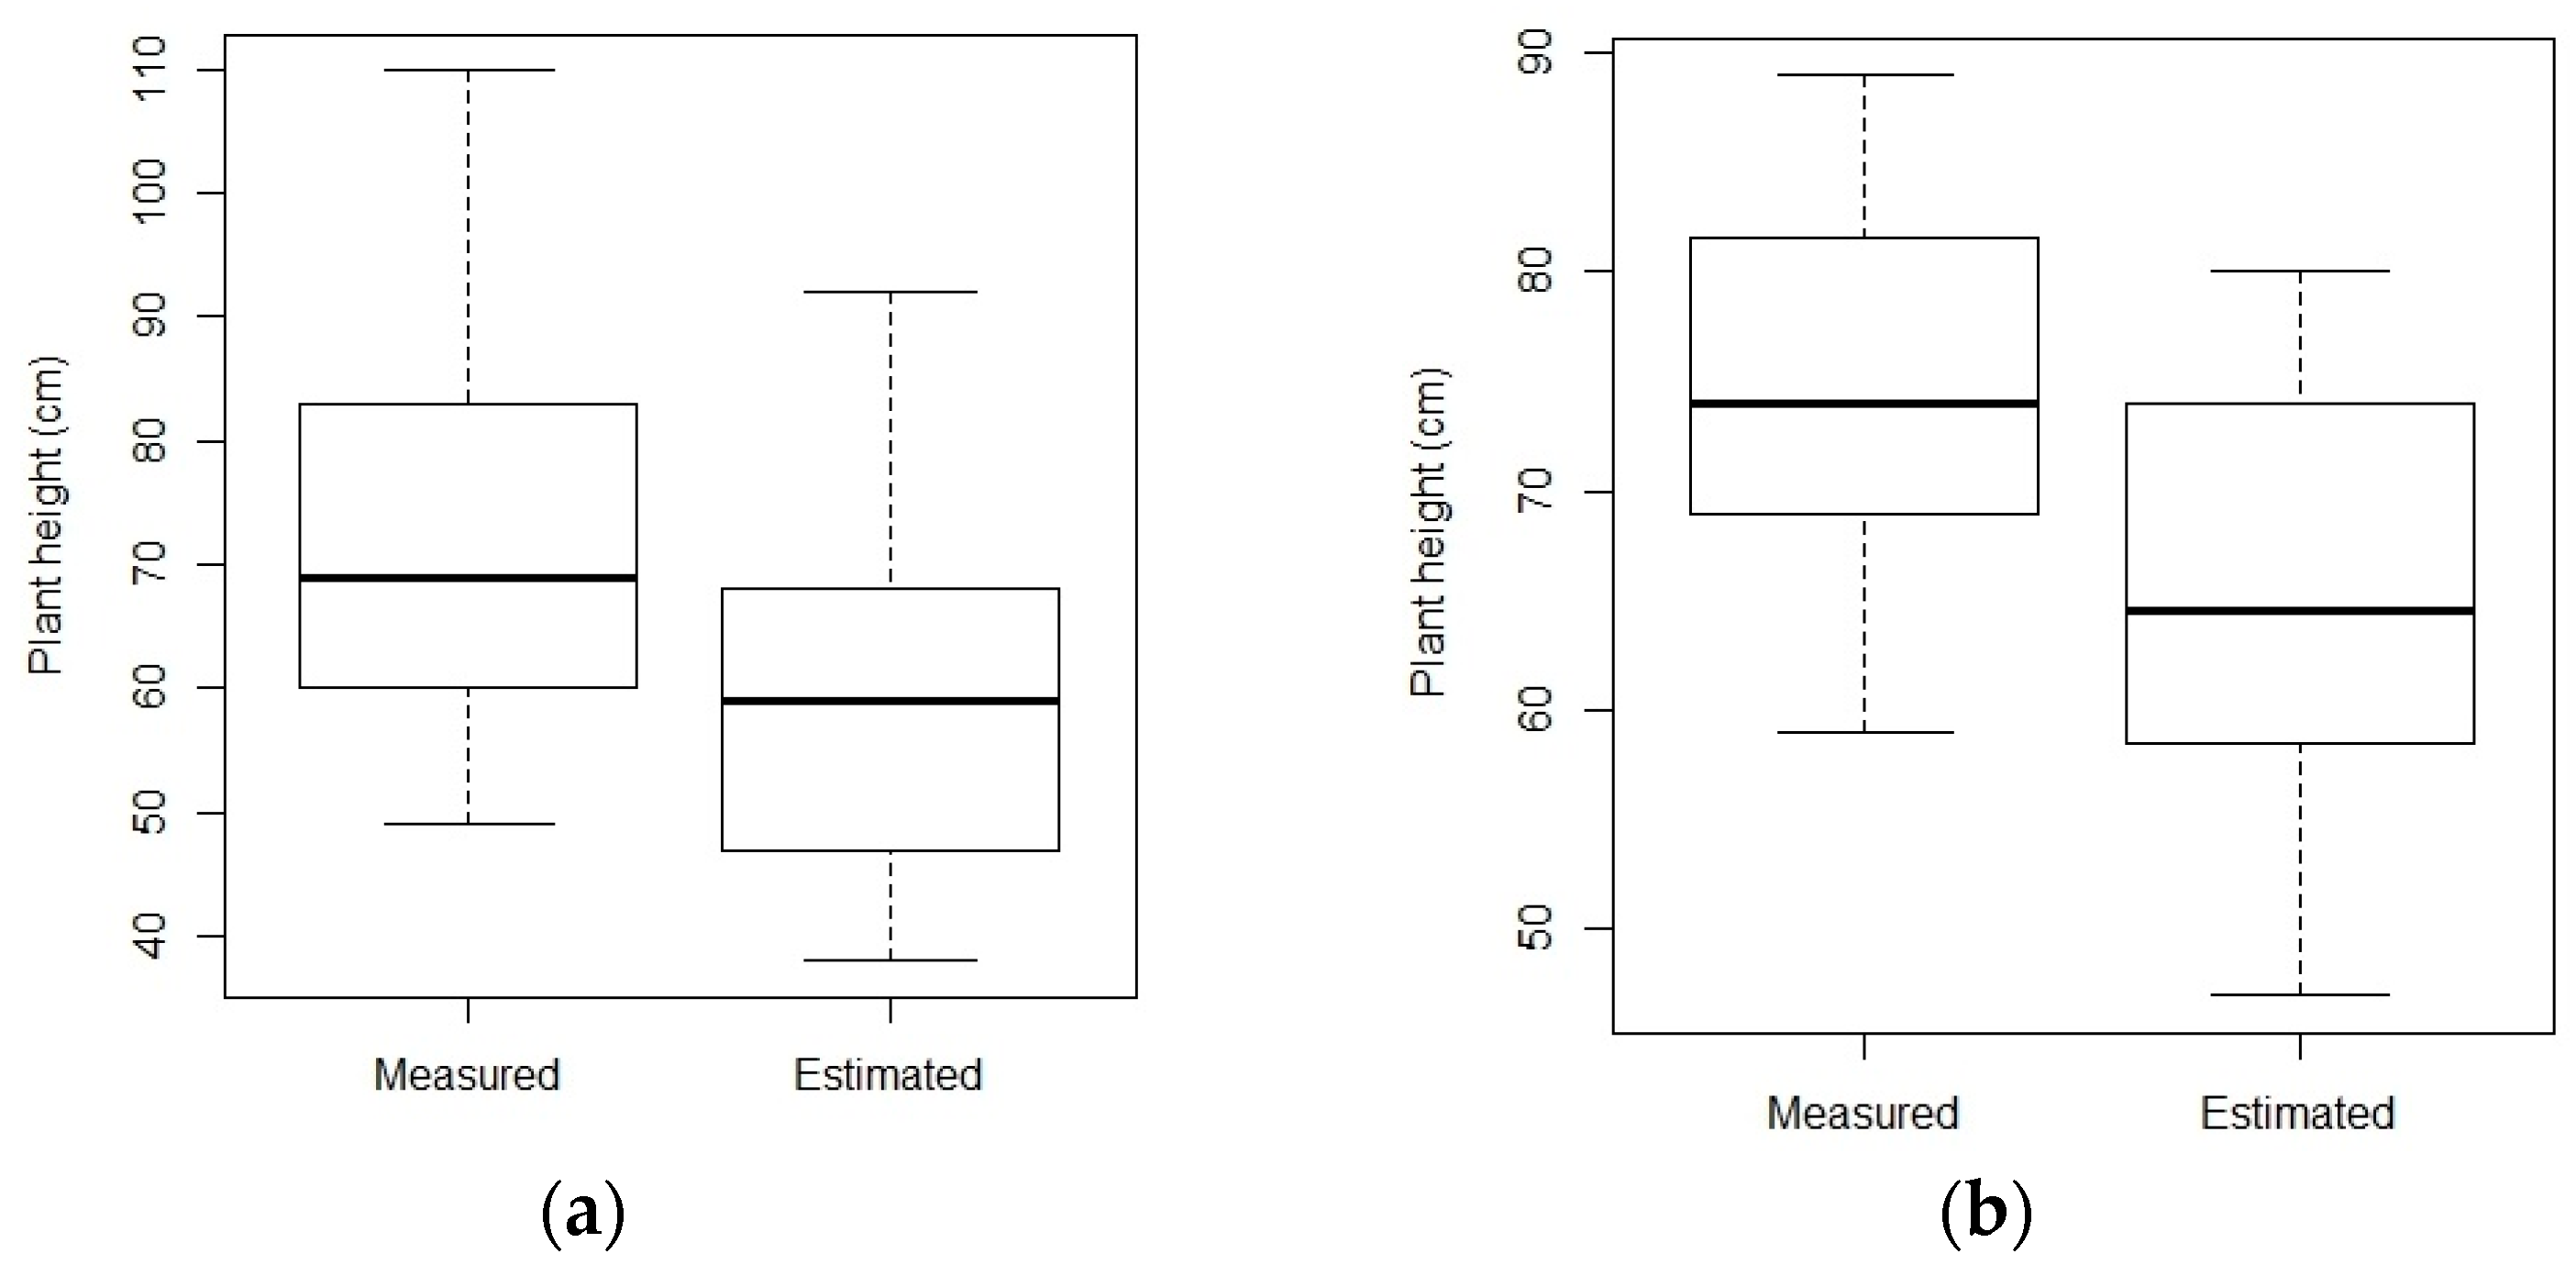
The accuracy of the CSM generated from UAS imagery was calculated using average height values of the pixel on each plant with measured values. The difference between height values obtained from field and CSM were derived to quantify the error in the CSM. The results showed (Table 4 and Figure 7) a clear underestimation of height in both transects, which is a common observation found in previous studies [11]. In both transects, the difference of observed vs estimated mean height was found to be variable, ranging from 12.55 to 9.96 cm. In T1, the difference between measured and estimated CSM height of smaller plants revealed underestimation of approximately 10 cm, and approximately 18 cm for larger plants. In contrast, the values of T2 showed an underestimation of 7 cm for larger plants and 12 cm for smaller plants. RMSE also varied depending on the transects, with the relative error ranging from 13.60% to 18.72% (Table 5).
Figure 8 shows the linear fit and coefficient of determination between measured and estimated plant height at the individual plant level; the results are highly significant with R2 of 0.93 for T1 and 0.97 for T2. The underestimation of plant height in the CSM is likely a result of local averaging in the creation of the grid-based CSM.
3.4. Relationship between Single Flight PH and Traditionally Measured PH
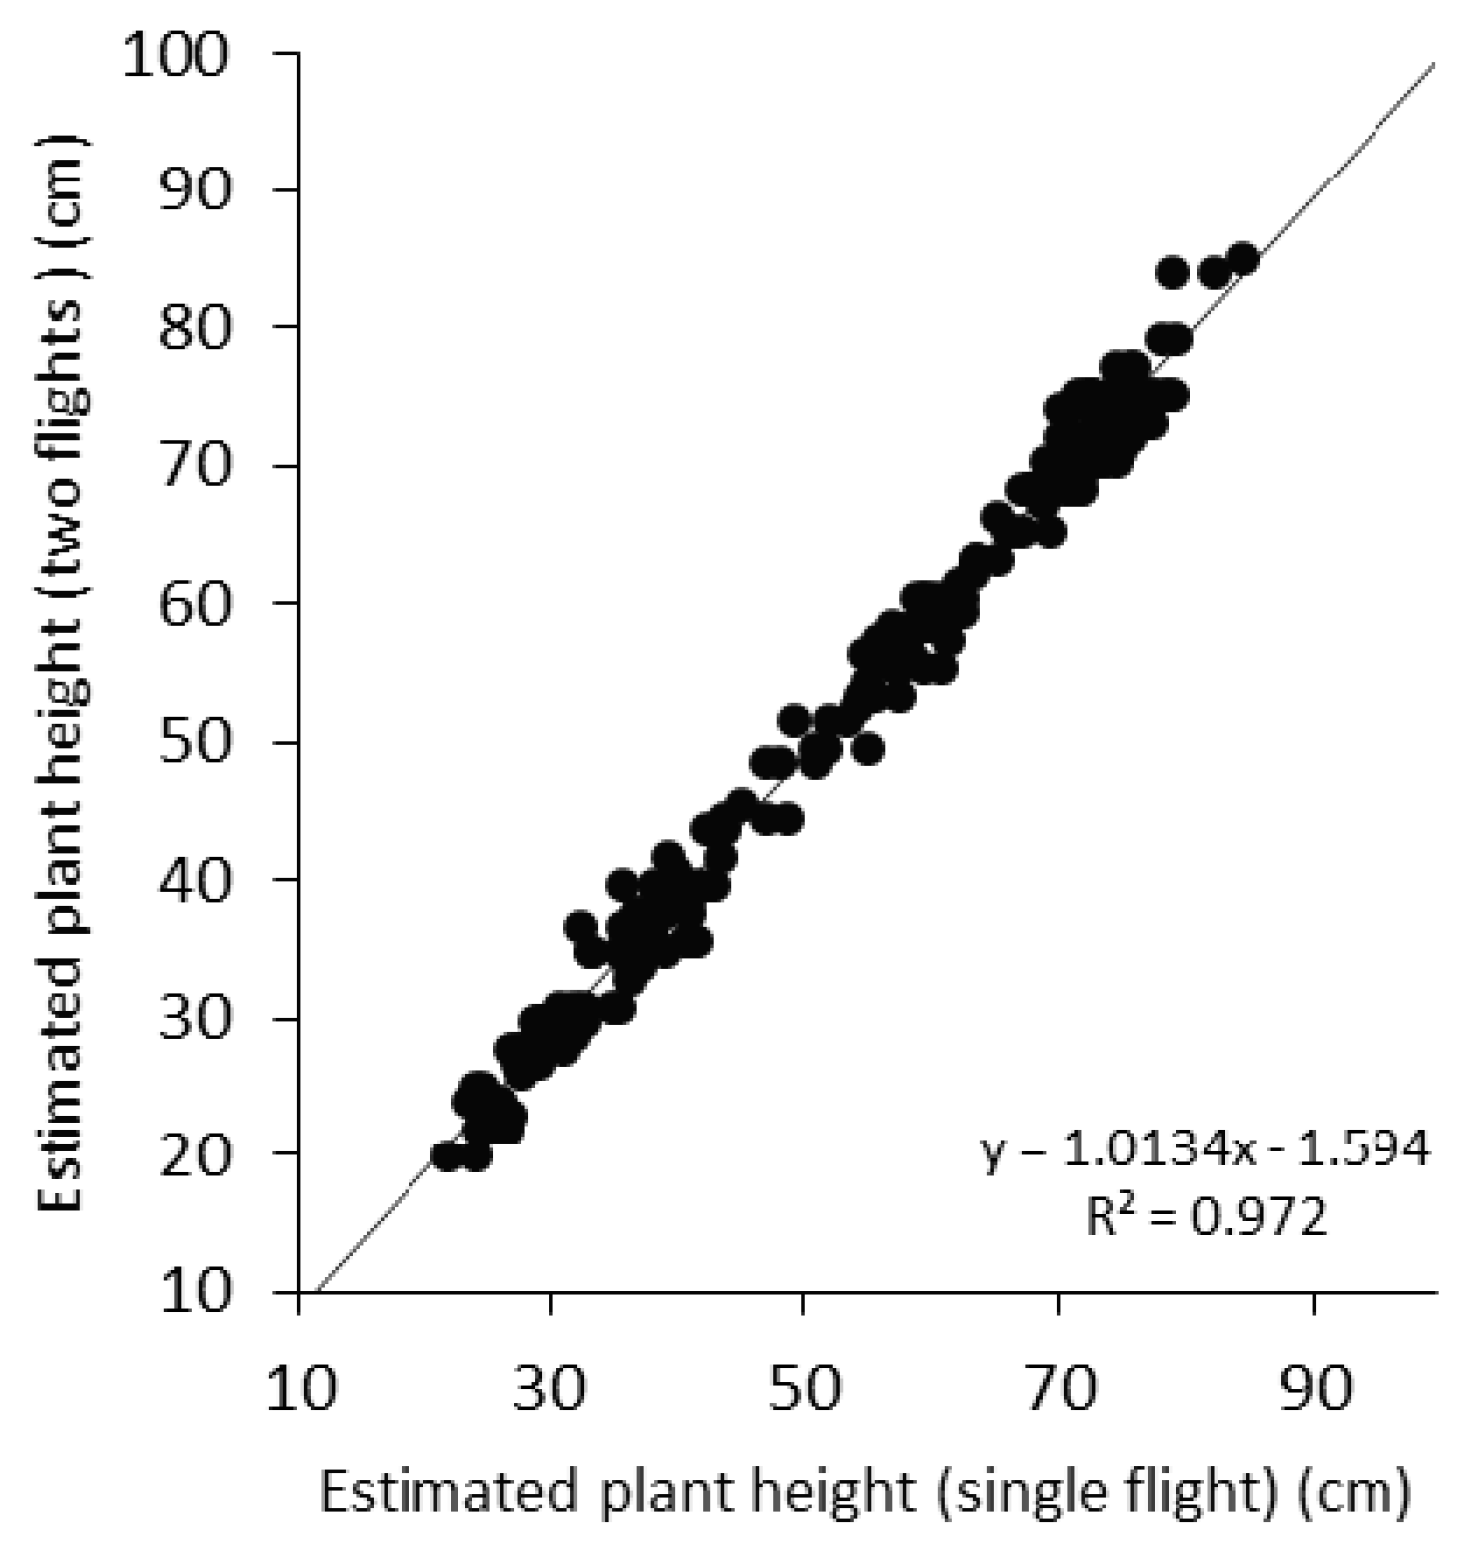
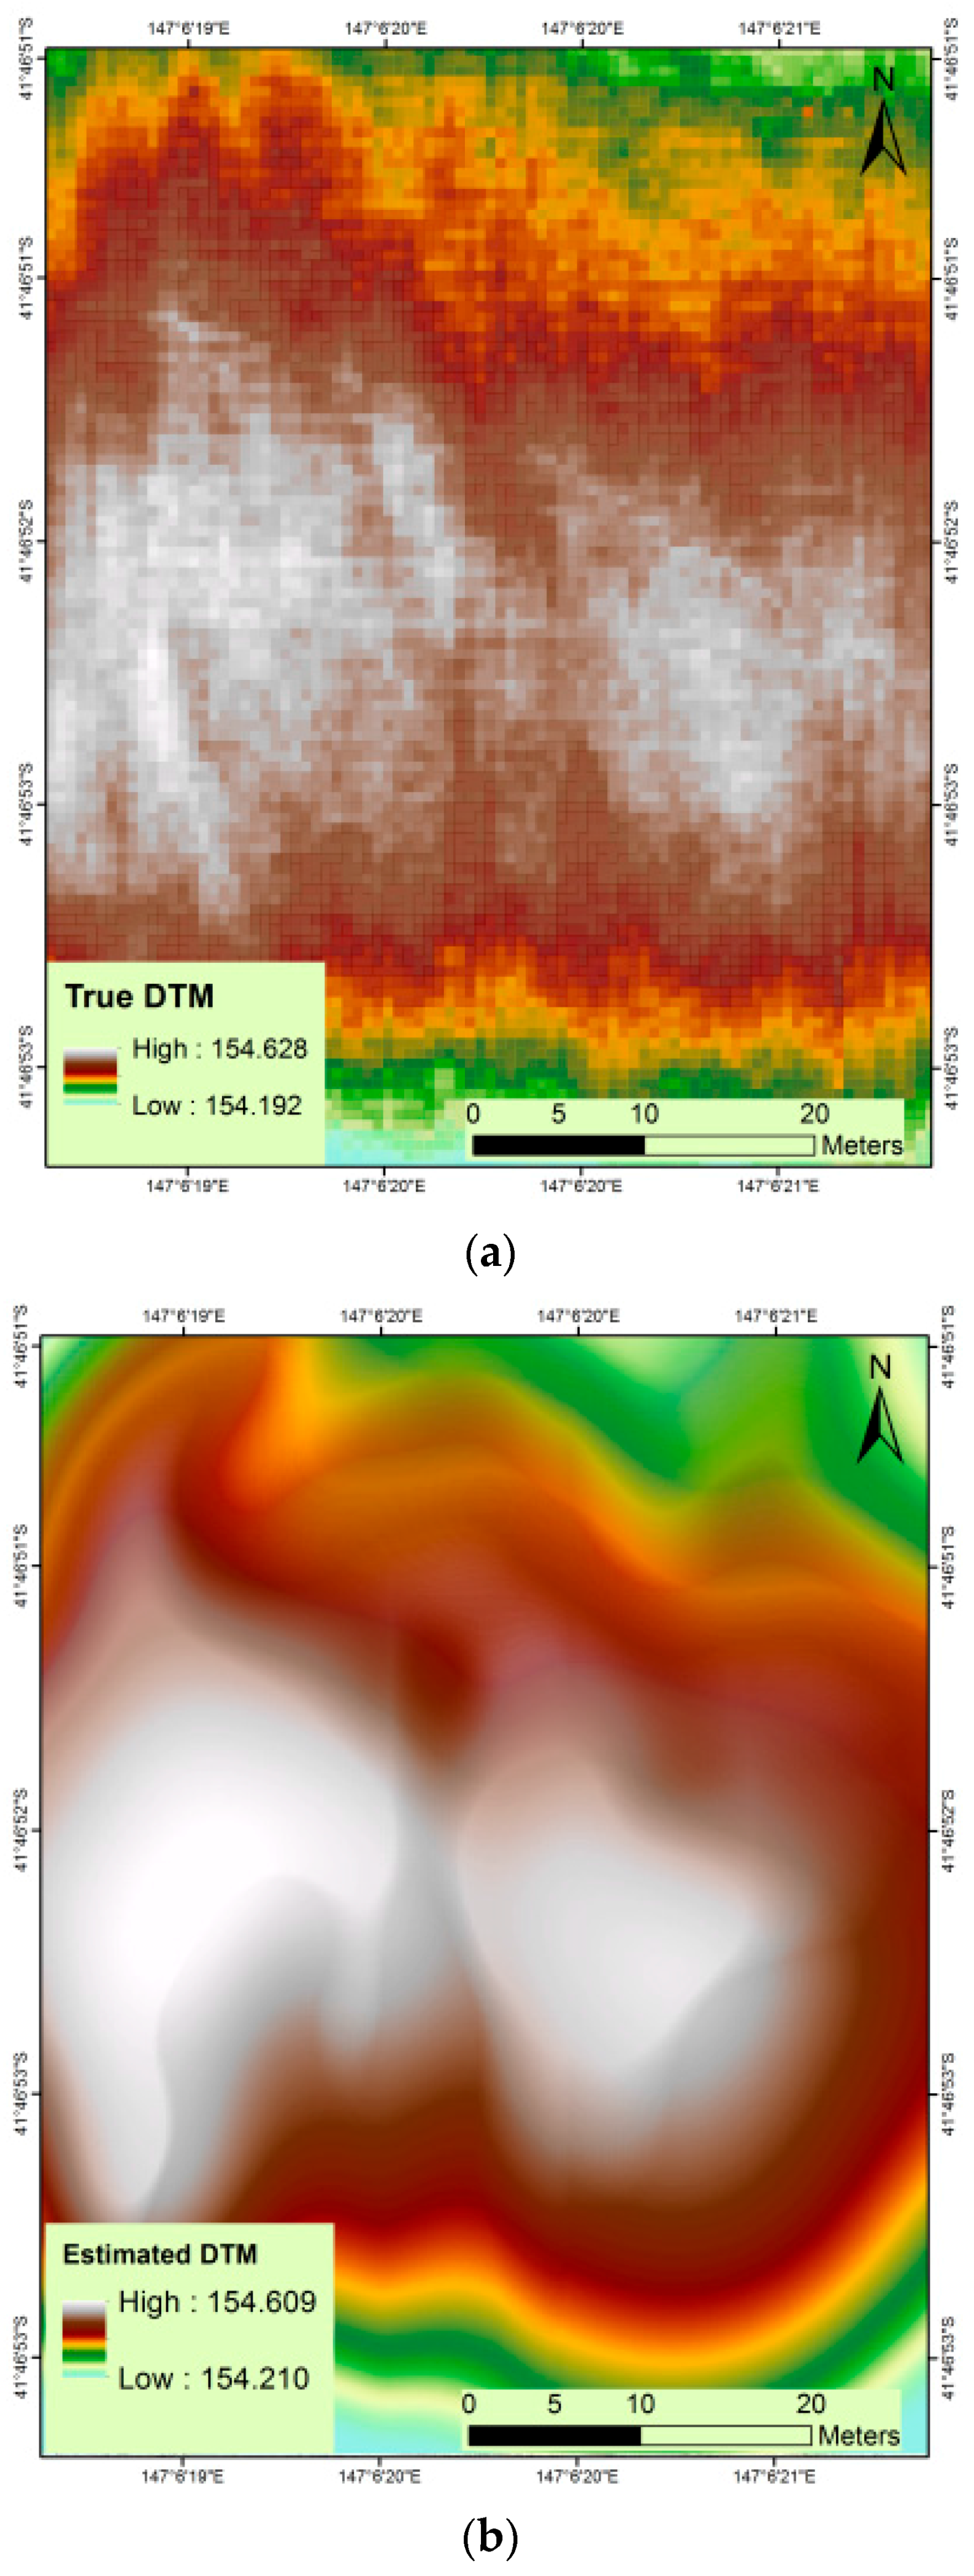
Figure 9c illustrates that the DTM extracted (b) at capsule formation stage varied between −4.3 cm to 4.1 cm compared to the DTM estimated (a) when the field was bare. Moreover, the estimated DTM (single flight) showed smoother boundaries as compared to the true DTM (two flights), which is caused by interpolation. Overall, both DTMs show almost the same elevation values and illustrate the same general spatial variability. It was found that the crop height estimated from a single flight was strongly correlated with the crop height estimated from two flights, with an R2 value of 0.97 (Figure 10), whereas R2 of 0.99 was achieved in the case of two flights in relation to measured values. However, in both methodologies, the difference of mean height was found to be slightly variable, ranging from 58 cm to 59 cm.
The difference of CSM derived height of smaller plants was approximately 3 cm, whereas in larger plants the CSM showed a maximum height of 85 cm and 84 cm based on a single and two-flight method respectively. The accuracy of the proposed one-flight methodology is similar to results of crop height estimation in other studies for other crops [11,28,29,30,31]. Overall, the RMSE varied from the single flight method to two flight method, with the relative error ranging from 11.01% to 10.36%. However, the extracted height values from both methods were lower than the field measured values.
4. Discussion
In this research, the analysis was carried out to estimate capsule volume from plant height determined at different developmental stages, and it was concluded that the capsule formation stage gives the best results in predicting capsule volume (R2 = 0.71), which is in accordance with a previous study [21]. Capsule volume can also be predicted at the flowering stage, but with lower accuracy (R2 = 0.67). The coefficient of determination at the flowering stage was found to be low, as plant development was not uniform (i.e., some plants had progressed to the flowering stage while others remained at the stem elongation stage). This shows that at intermediate developmental stages of the crop the accuracy of the relationship between PH and CV is limited, as reported previously [7].
PH plays an important role in providing information on crop development. Healthier plant development in early stages supports formation of larger capsules [20,45]. The current research shows that plant height information can be estimated using UAS-MVS remote sensing. Apart from apparent advantages of UAS remote sensing, there are many challenges associated with routine operations, such as small payload capacity, low spectral resolution, poor geometric and radiometric performance, low software automation, sensitivity to atmospheric conditions, short flight endurance, and possibility of equipment damage. Moreover, UAS users need to consider cost involved in repairs and maintenance, transportation, weather conditions and regulations for flying small UAS. Thus, multiple flight campaigns are not always possible. The weather, especially in Tasmania, is also a restricting factor. Spring and early summer can have high rainfall, so, it can be difficult to conduct UAS campaigns during this period at the relevant crop stages. Therefore, in this study, a simple and reliable method has been developed and tested for robust estimation of PH, based on a single UAS flight campaign, thereby overcoming the restriction of multiple flight campaigns and providing promising results for precision agriculture.
In this study, the visible ground areas within the field were utilised to detect the elevation of bare ground and were used to interpolate the DTM. The height values of soil points could also be extracted from vegetated imagery [11,27]. The accuracy of the DTM obtained from the single flight method depends on the distribution and size of bare ground patches visible in the mosaicked image. The error analysis of the Cambridge site DTM showed an underestimation, expressed by an RMSE of 9 cm. This indicates that a smaller number of bare ground patches cannot represent an accurate distribution of height values. Moreover, the accuracy of the DTM depends upon the terrain variation in the field. If the topography throughout the field is highly variable, then a large number of bare ground patches are needed to obtain an accurate DTM. In the case of the Cressy site with flatter topography but fewer bare ground patches, similar results were obtained (Figure 10). The Cressy site results illustrate that the difference in DTM extracted at capsule formation stages and DTM generated at sowing stage varied approximately ±4 cm, which is much lower than the result of Cambridge site, and therefore more accurate. An accuracy assessment of the CSM resulted in an RMSE of 12.24 cm for the Cambridge site, whereas, Cressy resulted in RMSE of 5.60 cm, in accordance with the result of previous studies [29,31,35,38].
Crop height is generally underestimated, which is a common issue with vegetation height assessment with SfM-MVS [11]. Crop height estimated from UAS compared with measured crop height resulted in a coefficient of determination of 0.93 in the case of T1, while in T2 it was slightly higher and reached up to 0.97. Cressy site results with a single campaign provide R2 of 0.972, in accordance with a previous study [11]. Results with two flights showed higher R2 of 0.988, in accordance with other findings [55]. Overall, the RMSE also varied depending on topography. In Cambridge farm, the relative error being 13.60% and 18.72% for transect T1 and T2, respectively. Conversely, in Cressy experiment, results illustrates that the crop height extracted with the single flight can provide similar results as compared to two flight campaigns, with the relative error ranging from 11.01% to 10.36%, respectively. This is because topography of Cressy farm was well levelled as compared to Cambridge site. Moreover, well distributed bare soil patches were available to detect, therefore, resulted in better estimation.
UAS remote sensing derived PH estimates used to simulate capsule volume showed the coefficient of determination of R2 = 0.738 with RMSE of 6.95 cm3 with a relative error of 19.62% at T2. The error is slightly higher for UAS derived CV as compared to the field-based model because of underestimation of UAS-derived plant height. The results showed a higher agreement between the estimated capsule volume and estimated plant height. To improve the model prediction for future research, the error inherited from DTM and DSM can be minimised by using an on-board RTK GNSS receiver as it will enable collection of accurate location and position information associated with each image and improve the georeferencing of acquired imagery. Moreover, an important factor is the size and distribution of bare ground patches. A larger number of bare ground patches with larger GCPs can be used to cover the whole variation of terrain, which would improve the accuracy of the DTM and DSM, resulting in a higher accuracy of the CSM.
The poppy capsule volume estimation model used in this study is an empirical model, and if implemented elsewhere, would require a new regression analysis based on field survey data, as the slope and offset of the regression equation would alter based on environmental circumstances and impacts of treatments, such as growth regulators. In Tasmania, poppy is grown as a legal crop and farmers are paid based on the alkaloid output of crops. Therefore, the poppy industry selects specific varieties for cropping, thus, the applicability of this model would need to be investigated on other varieties as well. Other factors that may change the relationship of PH with CV include different soil types, irrigation applications, and nutrients. Crop height estimation using the proposed methodology provides a cost-effective and time-saving way to acquire crop information. The proposed method reduces the time for field campaigns and reduces the cost of each flight campaign (GPS, UAV pilot, transportation, image processing etc.), which can help farm managers and researchers to manage crop zones according to crop requirement and therefore optimise yield.
5. Conclusions
In this study, we used a UAS platform with a standard digital camera and GPS to acquire very high resolution RGB images of poppy crops. Structure from Motion (SfM) and multi-view stereopsis (MVS) methods were used by deploying Agisoft Photoscan software to generate a DSM and orthophoto. This study demonstrates a novel method to estimate plant height using a single-flight UAS survey. The bare ground patches were classified using red green index and were used to extract the height value of the ground and were used to generate a DTM. In Cambridge farm experiment, UAS-derived plant height and field-measured PH was strongly correlated with R2 values ranging from 0.93 to 0.97 for T1 and T2, respectively. In Cressy farm experiment, the extracted crop height from single flight method showed very high correlation with two flight estimated and field measured height, with a R2 value of 0.97 and 0.98, respectively. It can be concluded that to estimate PH and therefore CV, a single flight method can provide almost similar results to that of two flights, saving cost and time. This provides an important approach for CSM generation from a single UAS flight where a prior DTM is unavailable. Moreover, this study estimated poppy capsule volume based on UAS derived crop height. Poppy capsule volume estimation using UAS derived plant height is a novel approach, which has not been formally tested before and has predicted 81% of the capsule volume variation. The coefficient of determination (R2 = 0.73) demonstrates that plant height derived from UAS imagery is a suitable indicator for capsule volume. Capsule volume can be used as a proxy for alkaloid yield [19], which is vital to estimate for the pharmaceutical industry.
Acknowledgments
The authors would like to acknowledge Darren Turner for organising and conducting the UAS field campaign. We thank Iain Clarke for his help in conducting the GPS survey and Zbynek Malenovsk for his help during the UAS and spectral measurement campaign at Cambridge, Tasmania. We thank Tasmanian Alkaloids for organizing access to the Cressy field trial. This research work was supported and funded by the University of Tasmania, Australia. Additionally, we also thank the three anonymous reviewers and guest editors for their valuable feedback to improve the manuscript.
Author Contributions
F.I. conceived and designed the experiment with advice from A.L., K.B. and R.W.; F.I., and A.L. performed the experiment; F.I., analysed the data; F.I. and A.L. contributed to the analysis of the result; and F.I. wrote the paper with the guidance and contributions from A.L., K.B. and R.W.
Conflicts of Interest
The authors declare no conflict of interest.
Abbreviations
The following abbreviations are used in this manuscript:
| CSM | Crop Surface Model |
| DSM | Digital Surface Model |
| CHM | Crop Height Model |
| DTM | Digital Terrain Model |
| PH | Plant Height |
| CH | Crop Height |
| CV | Capsule Volume |
| UAS | Unmanned Aircraft System |
| GPS | Global Positioning System |
| DGPS | Differential Global Positioning System |
| RTK | Real Time Kinematic |
| SfM | structure-from-motion |
References
- Zhang, C.H.; Kovacs, J.M. The application of small unmanned aerial systems for precision agriculture: A review. Precis. Agric. 2012, 13, 693–712. [Google Scholar] [CrossRef]
- Berni, J.A.J.; Zarco-Tejada, P.J.; Suarez, L.; Fereres, E. Thermal and Narrowband Multispectral Remote Sensing for Vegetation Monitoring From an Unmanned Aerial Vehicle. IEEE Trans. Geosci. Remote Sens. 2009, 47, 722–738. [Google Scholar] [CrossRef]
- Saari, H.; Pellikka, I.; Pesonen, L.; Tuominen, S.; Heikkilä, J.; Holmlund, C.; Mäkynen, J.; Ojala, K.; Antila, T. Unmanned aerial vehicle (UAV) operated spectral camera system for forest and agriculture applications. In Proceedings of the SPIE 8174, Remote Sensing for Agriculture, Ecosystems, and Hydrology XIII, Prague, Czech Republic, 19 September 2011; Volume 8174. [Google Scholar]
- Baluja, J.; Diago, M.P.; Balda, P.; Zorer, R.; Meggio, F.; Morales, F.; Tardaguila, J. Assessment of vineyard water status variability by thermal and multispectral imagery using an unmanned aerial vehicle (UAV). Irrig. Sci. 2012, 30, 511–522. [Google Scholar] [CrossRef]
- Stagakis, S.; González-Dugo, V.; Cid, P.; Guillén-Climent, M.L.; Zarco-Tejada, P.J. Monitoring water stress and fruit quality in an orange orchard under regulated deficit irrigation using narrow-band structural and physiological remote sensing indices. ISPRS J. Photogramm. Remote Sens. 2012, 71, 47–61. [Google Scholar] [CrossRef]
- Zarco-Tejada, P.J.; Guillen-Climent, M.L.; Hernandez-Clemente, R.; Catalina, A.; Gonzalez, M.R.; Martin, P. Estimating leaf carotenoid content in vineyards using high resolution hyperspectral imagery acquired from an unmanned aerial vehicle (UAV). Agric. For. Meteorol. 2013, 171, 281–294. [Google Scholar] [CrossRef]
- Waine, T.W.; Simms, D.M.; Taylor, J.C.; Juniper, G.R. Towards improving the accuracy of opium yield estimates with remote sensing. Int. J. Remote Sens. 2014, 35, 6292–6309. [Google Scholar] [CrossRef]
- Brandao, Z.N.; Sofiatti, V.; Bezerra, J.R.C.; Ferreira, G.B.; Medeiros, J.C. Spectral reflectance for growth and yield assessment of irrigated cotton. Aust. J. Crop Sci. 2015, 9, 75–84. [Google Scholar]
- Kaur, R.; Singh, B.; Singh, M.; Thind, S.K. Hyperspectral Indices, Correlation and Regression Models for Estimating Growth Parameters of Wheat Genotypes. J. Indian Soc. Remote Sens. 2015, 43, 551–558. [Google Scholar] [CrossRef]
- Yin, X.; McClure, M.A.; Jaja, N.; Tyler, D.D.; Hayes, R.M. In-season prediction of corn yield using plant height under major production systems. Agron. J. 2011, 103, 923–929. [Google Scholar] [CrossRef]
- Bendig, J.; Bolten, A.; Bennertz, S.; Broscheit, J.; Eichfuss, S.; Bareth, G. Estimating Biomass of Barley Using Crop Surface Models (CSMs) Derived from UAV-Based RGB Imaging. Remote Sens. 2014, 6, 10395–10412. [Google Scholar] [CrossRef]
- Tilly, N.; Hoffmeister, D.; Cao, Q.; Huang, S.; Lenz-Wiedemann, V.; Miao, Y.; Bareth, G. Multitemporal crop surface models: Accurate plant height measurement and biomass estimation with terrestrial laser scanning in paddy rice. J. Appl. Remote Sens. 2014, 8, 83671. [Google Scholar] [CrossRef]
- Erten, E.; Lopez-Sanchez, J.M.; Yuzugullu, O.; Hajnsek, I. Retrieval of agricultural crop height from space: A comparison of SAR techniques. Remote Sens. Environ. 2016, 187, 130–144. [Google Scholar] [CrossRef]
- Hasnain, Z.; Abbas, G.; Saeed, A.; Shakeel, A.; Muhammad, A.; Rahim, M.A. Combining ability for plant height and yield related traits in wheat (Triticum aestivum L.). J. Agric. Res 2006, 44, 167–173. [Google Scholar]
- Gao, S.; Niu, Z.; Sun, G.; Zhao, D.; Jia, K.; Qin, Y. Height Extraction of Maize Using Airborne Full-Waveform LIDAR Data and a Deconvolution Algorithm. IEEE Geosci. Remote Sens. Lett. 2015, 12, 1978–1982. [Google Scholar]
- Sharma, L.K.; Bu, H.; Franzen, D.W.; Denton, A. Use of corn height measured with an acoustic sensor improves yield estimation with ground based active optical sensors. Comput. Electron. Agric. 2016, 124, 254–262. [Google Scholar] [CrossRef]
- Papadavid, G.; Hadjimitsis, D.; Toulios, L.; Michaelides, S. Mapping potato crop height and leaf area index through vegetation indices using remote sensing in Cyprus. J. Appl. Remote Sens. 2011, 5, 53526. [Google Scholar] [CrossRef]
- Li, W.; Niu, Z.; Chen, H.; Li, D.; Wu, M.; Zhao, W. Remote estimation of canopy height and aboveground biomass of maize using high-resolution stereo images from a low-cost unmanned aerial vehicle system. Ecol. Indic. 2016, 67, 637–648. [Google Scholar] [CrossRef]
- Wang, Z.; Acock, M.C.; Liu, Q.; Acock, B. Growth, opium gum yield, and photoperiod response of five opium poppy accessions. HortScience 1999, 34, 1060–1063. [Google Scholar]
- Mahdavi-Damghani, A.; Kamkar, B.; Al-Ahmadi, M.J.; Testi, L.; Muñoz-Ledesma, F.J.; Villalobos, F.J. Water stress effects on growth, development and yield of opium poppy (Papaver somniferum L.). Agric. Water Manag. 2010, 97, 1582–1590. [Google Scholar] [CrossRef]
- Jia, K.; Wu, B.; Tian, Y.; Li, Q.; Du, X. An effective biophysical indicator for opium yield estimation. Comput. Electron. Agric. 2011, 75, 272–277. [Google Scholar] [CrossRef]
- Vega, F.A.; Ramirez, F.C.; Saiz, M.P.; Rosua, F.O. Multi-temporal imaging using an unmanned aerial vehicle for monitoring a sunflower crop. Biosyst. Eng. 2015, 132, 19–27. [Google Scholar] [CrossRef]
- Bernath, J. Complex physio-ecological evaluation of the alkaloid formation of the poppy (Papaver somniferum L.). Herba Hung. 1986, 25, 43–75. [Google Scholar]
- Zarco-Tejada, P.J.; González-Dugo, V.; Berni, J.A.J. Fluorescence, temperature and narrow-band indices acquired from a UAV platform for water stress detection using a micro-hyperspectral imager and a thermal camera. Remote Sens. Environ. 2012, 117, 322–337. [Google Scholar] [CrossRef]
- Gago, J.; Douthe, C.; Coopman, R.E.; Gallego, P.P.; Ribas-Carbo, M.; Flexas, J.; Escalona, J.; Medrano, H. UAVs challenge to assess water stress for sustainable agriculture. Agric. Water Manag. 2015, 153, 9–19. [Google Scholar] [CrossRef]
- Wu, M.; Yang, C.; Song, X.; Hoffmann, W.C.; Huang, W.; Niu, Z.; Wang, C.; Li, W. Evaluation of Orthomosics and Digital Surface Models Derived from Aerial Imagery for Crop Type Mapping. Remote Sens. 2017, 9, 239. [Google Scholar] [CrossRef]
- Verhoeven, G.; Vermeulen, F. Engaging with the Canopy-Multi-Dimensional Vegetation Mark Visualisation Using Archived Aerial Images. Remote Sens. 2016, 8, 752. [Google Scholar] [CrossRef]
- Jaakkola, A.; Hyyppa, J.; Kukko, A.; Yu, X.W.; Kaartinen, H.; Lehtomaki, M.; Lin, Y. A low-cost multi-sensoral mobile mapping system and its feasibility for tree measurements. ISPRS J. Photogramm. Remote Sens. 2010, 65, 514–522. [Google Scholar] [CrossRef]
- Harwin, S.; Lucieer, A. Assessing the Accuracy of Georeferenced Point Clouds Produced via Multi-View Stereopsis from Unmanned Aerial Vehicle (UAV) Imagery. Remote Sens. 2012, 4, 1573–1599. [Google Scholar] [CrossRef]
- Lucieer, A.; de Jong, S.; Turner, D. Mapping landslide displacements using Structure from Motion (SfM) and image correlation of multi-temporal UAV photography. Prog. Phys. Geogr. 2013, 97–116. [Google Scholar] [CrossRef]
- Zarco-Tejada, P.J.; Diaz-Varela, R.; Angileri, V.; Loudjani, P. Tree height quantification using very high resolution imagery acquired from an unmanned aerial vehicle (UAV) and automatic 3D photo-reconstruction methods. Eur. J. Agron. 2014, 55, 89–99. [Google Scholar] [CrossRef]
- Geipel, J.; Link, J.; Claupein, W. Combined Spectral and Spatial Modeling of Corn Yield Based on Aerial Images and Crop Surface Models Acquired with an Unmanned Aircraft System. Remote Sens. 2014, 6, 10335–10355. [Google Scholar] [CrossRef]
- Bendig, J.; Bolten, A.; Bareth, G. UAV-based Imaging for Multi-Temporal, very high Resolution Crop Surface Models to monitor Crop Growth Variability. Photogramm. Fernerkund. Geoinf. 2013, 2013, 551–562. [Google Scholar] [CrossRef]
- Remondino, F.; Del Pizzo, S.; Kersten, T.P.; Troisi, S. Low-cost and open-source solutions for automated image orientation-A critical overview. Euro Mediterr. Conf. 2012, 7616, 40–54. [Google Scholar]
- Harwin, S.; Lucieer, A.; Osborn, J. The impact of the calibration method on the accuracy of point clouds derived using unmanned aerial vehicle multi-view stereopsis. Remote Sens. 2015, 7, 11933–11953. [Google Scholar] [CrossRef]
- Nex, F.; Remondino, F. UAV for 3D mapping applications: A review. Appl. Geomat. 2014, 6, 1–15. [Google Scholar] [CrossRef]
- Smith, M.W.; Carrivick, J.L.; Quincey, D.J. Structure from motion photogrammetry in physical geography. Prog. Phys. Geogr. 2016, 40, 247–275. [Google Scholar] [CrossRef]
- Turner, D.; Lucieer, A.; Wallace, L. Direct georeferencing of ultrahigh-resolution UAV imagery. IEEE Trans. Geosci. Remote Sens. 2014, 52, 2738–2745. [Google Scholar] [CrossRef]
- Doneus, M.; Verhoeven, G.; Fera, M.; Briese, C.; Kucera, M.; Neubauer, W. From deposit to point cloud—A study of low-cost computer vision approaches for the straightforward documentation of archaeological excavations. Geoinf. FCE CTU 2011, 6, 81–88. [Google Scholar] [CrossRef]
- Verhoeven, G.; Doneus, M.; Briese, C.; Vermeulen, F. Mapping by matching: A computer vision-based approach to fast and accurate georeferencing of archaeological aerial photographs. J. Archaeol. Sci. 2012, 39, 2060–2070. [Google Scholar] [CrossRef]
- Mancini, F.; Dubbini, M.; Gattelli, M.; Stecchi, F.; Fabbri, S.; Gabbianelli, G. Using unmanned aerial vehicles (UAV) for high-resolution reconstruction of topography: The structure from motion approach on coastal environments. Remote Sens. 2013, 5, 6880–6898. [Google Scholar] [CrossRef]
- Green, S.; Bevan, A.; Shapland, M. A comparative assessment of structure from motion methods for archaeological research. J. Archaeol. Sci. 2014, 46, 173–181. [Google Scholar] [CrossRef]
- Annett, H.E. Factors influencing alkaloidal content and yield of latex in the opium poppy (Papaver somniferum). Biochem. J. 1920, 14, 618. [Google Scholar] [CrossRef] [PubMed]
- Jain, P.M. Effect of split application of nitrogen on opium poppy. Indian J. Agron. 1990, 35, 240–242. [Google Scholar]
- Kang, H.; Primack, R.B. Temporal variation of flower and fruit size in relation to seed yield in celandine poppy (Chelidonium majus; Papaveraceae). Am. J. Bot. 1991, 78, 711–722. [Google Scholar] [CrossRef]
- Acock, M.; Wang, Z.; Acock, B.; Jones, R. Gum yield as affected by capsule age, firmness, gum collecting methods, and phenotypes in opium poppy. HortScience 1996, 31, 1156–1159. [Google Scholar]
- Khan, R.; Khan, M.M.A.; Singh, M.; Nasir, S.; Naeem, M.; Siddiqui, M.H.; Mohammad, F. Gibberellic acid and triacontanol can ameliorate the opium yield and morphine production in opium poppy (Papaver somniferum L.). Acta Agric. Scand. Sect. B 2007, 57, 307–312. [Google Scholar] [CrossRef]
- Harvest, T.; Brown, P.H.; Fist, A.; Gracie, A.; Gregory, D.; Koutoulis, A. The latex capacity of opium poppy capsules is fixed early in capsule development and is not a major determinant in morphine yield. Ann. Appl. Biol. 2009, 154, 251–258. [Google Scholar] [CrossRef]
- Bernáth, J.; Tétényi, P. The effect of environmental factors on growth, development and alkaloid production of poppy. II. Interaction of light and temperature. Biochem. Phusiol. Pflanz. 1981, 176, 599–605. [Google Scholar] [CrossRef]
- Lisson, S.N. Temperature and photoperiod effects on the growth and development of opium poppy (Papaver somniferum). Aust. J. Exp. Agric. 2007, 47, 742. [Google Scholar] [CrossRef]
- Bendig, J.; Yu, K.; Aasen, H.; Bolten, A.; Bennertz, S.; Broscheit, J.; Gnyp, M.L.; Bareth, G. Combining UAV-based plant height from crop surface models, visible, and near infrared vegetation indices for biomass monitoring in barley. Int. J. Appl. Earth Obs. Geoinf. 2015, 39, 79–87. [Google Scholar] [CrossRef]
- Lucieer, A.; Malenovský, Z.; Veness, T.; Wallace, L. HyperUAS-Imaging Spectroscopy from a Multirotor Unmanned Aircraft System. J. Field Robot. 2014, 31, 571–590. [Google Scholar] [CrossRef]
- Gitelson, A.A.; Kaufman, Y.J.; Stark, R.; Rundquist, D. Novel algorithms for remote estimation of vegetation fraction. Remote Sens. Environ. 2002, 80, 76–87. [Google Scholar] [CrossRef]
- Motohka, T.; Nasahara, K.N.; Oguma, H.; Tsuchida, S. Applicability of green-red vegetation index for remote sensing of vegetation phenology. Remote Sens. 2010, 2, 2369–2387. [Google Scholar] [CrossRef]
- Ehlert, D.; Horn, H.-J.; Adamek, R. Measuring crop biomass density by laser triangulation. Comput. Electron. Agric. 2008, 61, 117–125. [Google Scholar] [CrossRef]
Figure 1.
The general location of the study sites (Cambridge and Cressy) and the overview of the image obtained from unmanned aircraft system (UAS).
Figure 1.
The general location of the study sites (Cambridge and Cressy) and the overview of the image obtained from unmanned aircraft system (UAS).

Figure 2.
Topographical profile of transects at Cambridge farm (ASL): (a) Transect 1; and (b) Transect 2.
Figure 2.
Topographical profile of transects at Cambridge farm (ASL): (a) Transect 1; and (b) Transect 2.

Figure 3.
Overview of the field physical measurement of plant height and capsule height and diameter: (a) diameter of capsule measured with a Vernier caliper; (b) height of capsule measured with Vernier caliper; and (c) height of each plant was measured with measuring tape.
Figure 3.
Overview of the field physical measurement of plant height and capsule height and diameter: (a) diameter of capsule measured with a Vernier caliper; (b) height of capsule measured with Vernier caliper; and (c) height of each plant was measured with measuring tape.
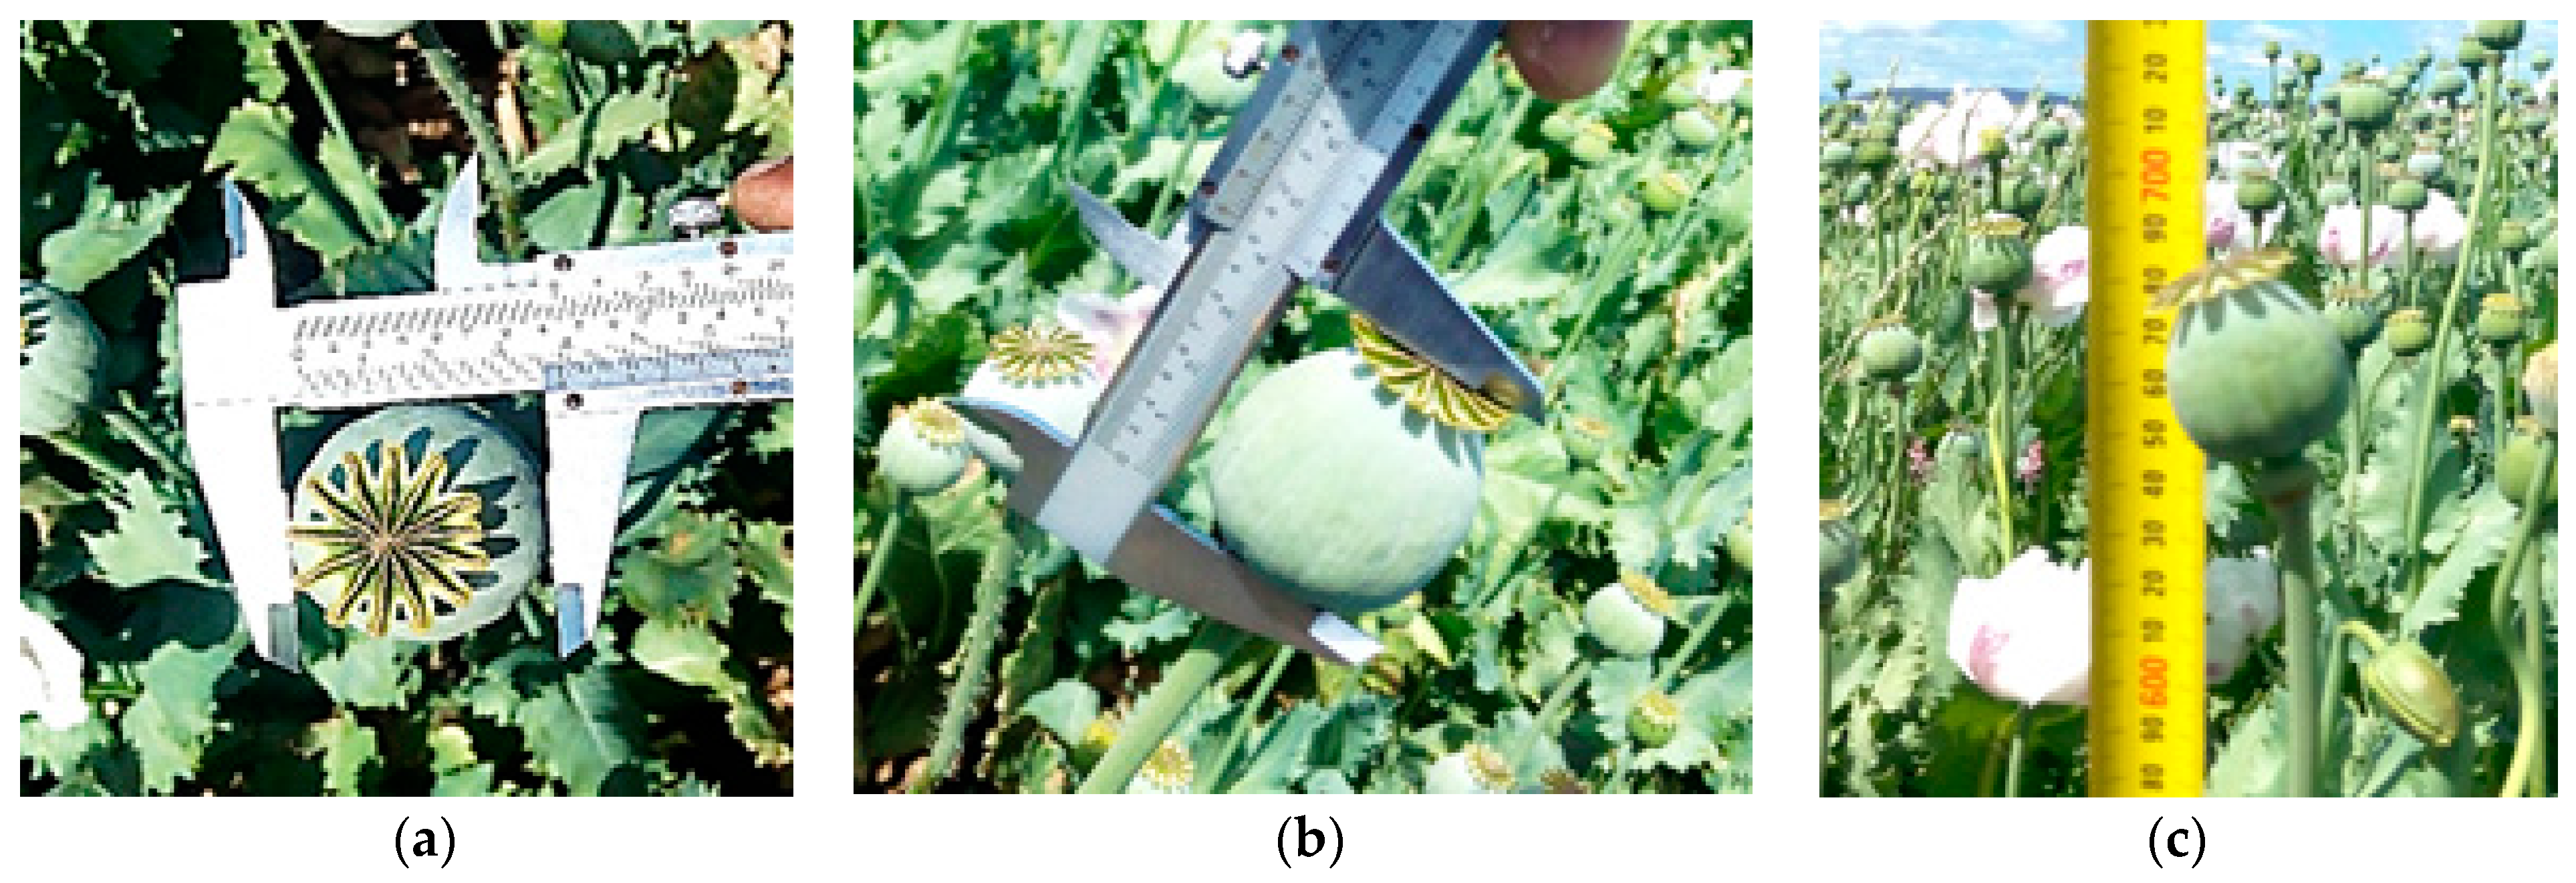
Figure 4.
Flowchart illustrating the main steps for the estimation of plant height and capsule volume using imagery acquired from UAS flight campaign.
Figure 4.
Flowchart illustrating the main steps for the estimation of plant height and capsule volume using imagery acquired from UAS flight campaign.

Figure 5.
The coefficient of determination (R2) for capsule volume (Y axes—cm3) at capsule formation stage and plant height (X axes—cm) at different growth stages, for Transect 1.
Figure 5.
The coefficient of determination (R2) for capsule volume (Y axes—cm3) at capsule formation stage and plant height (X axes—cm) at different growth stages, for Transect 1.

Figure 6.
The empirical relationship between poppy plant height and capsule volume at capsule formation stage: (a) Transect 1 (T1); and (b) Transect 2 (T2).
Figure 6.
The empirical relationship between poppy plant height and capsule volume at capsule formation stage: (a) Transect 1 (T1); and (b) Transect 2 (T2).

Figure 7.
Box plot of the measured and estimated plant height for the two transects at the individual plant level (n = 65 for Transect 1 (a); and n = 60 in Transect 2 (b)).
Figure 7.
Box plot of the measured and estimated plant height for the two transects at the individual plant level (n = 65 for Transect 1 (a); and n = 60 in Transect 2 (b)).

Figure 8.
Linear fit between measured and estimated plant height of two transects at the individual plant level: (a) PH of Transect 1; and (b) PH of Transect 2.
Figure 8.
Linear fit between measured and estimated plant height of two transects at the individual plant level: (a) PH of Transect 1; and (b) PH of Transect 2.

Figure 9.
Map of: DTM generated from UAS flight when the soil was bare (a); and DTM extracted from the flight at capsule formation stage (b); and the difference between (a) and (b,c).
Figure 9.
Map of: DTM generated from UAS flight when the soil was bare (a); and DTM extracted from the flight at capsule formation stage (b); and the difference between (a) and (b,c).

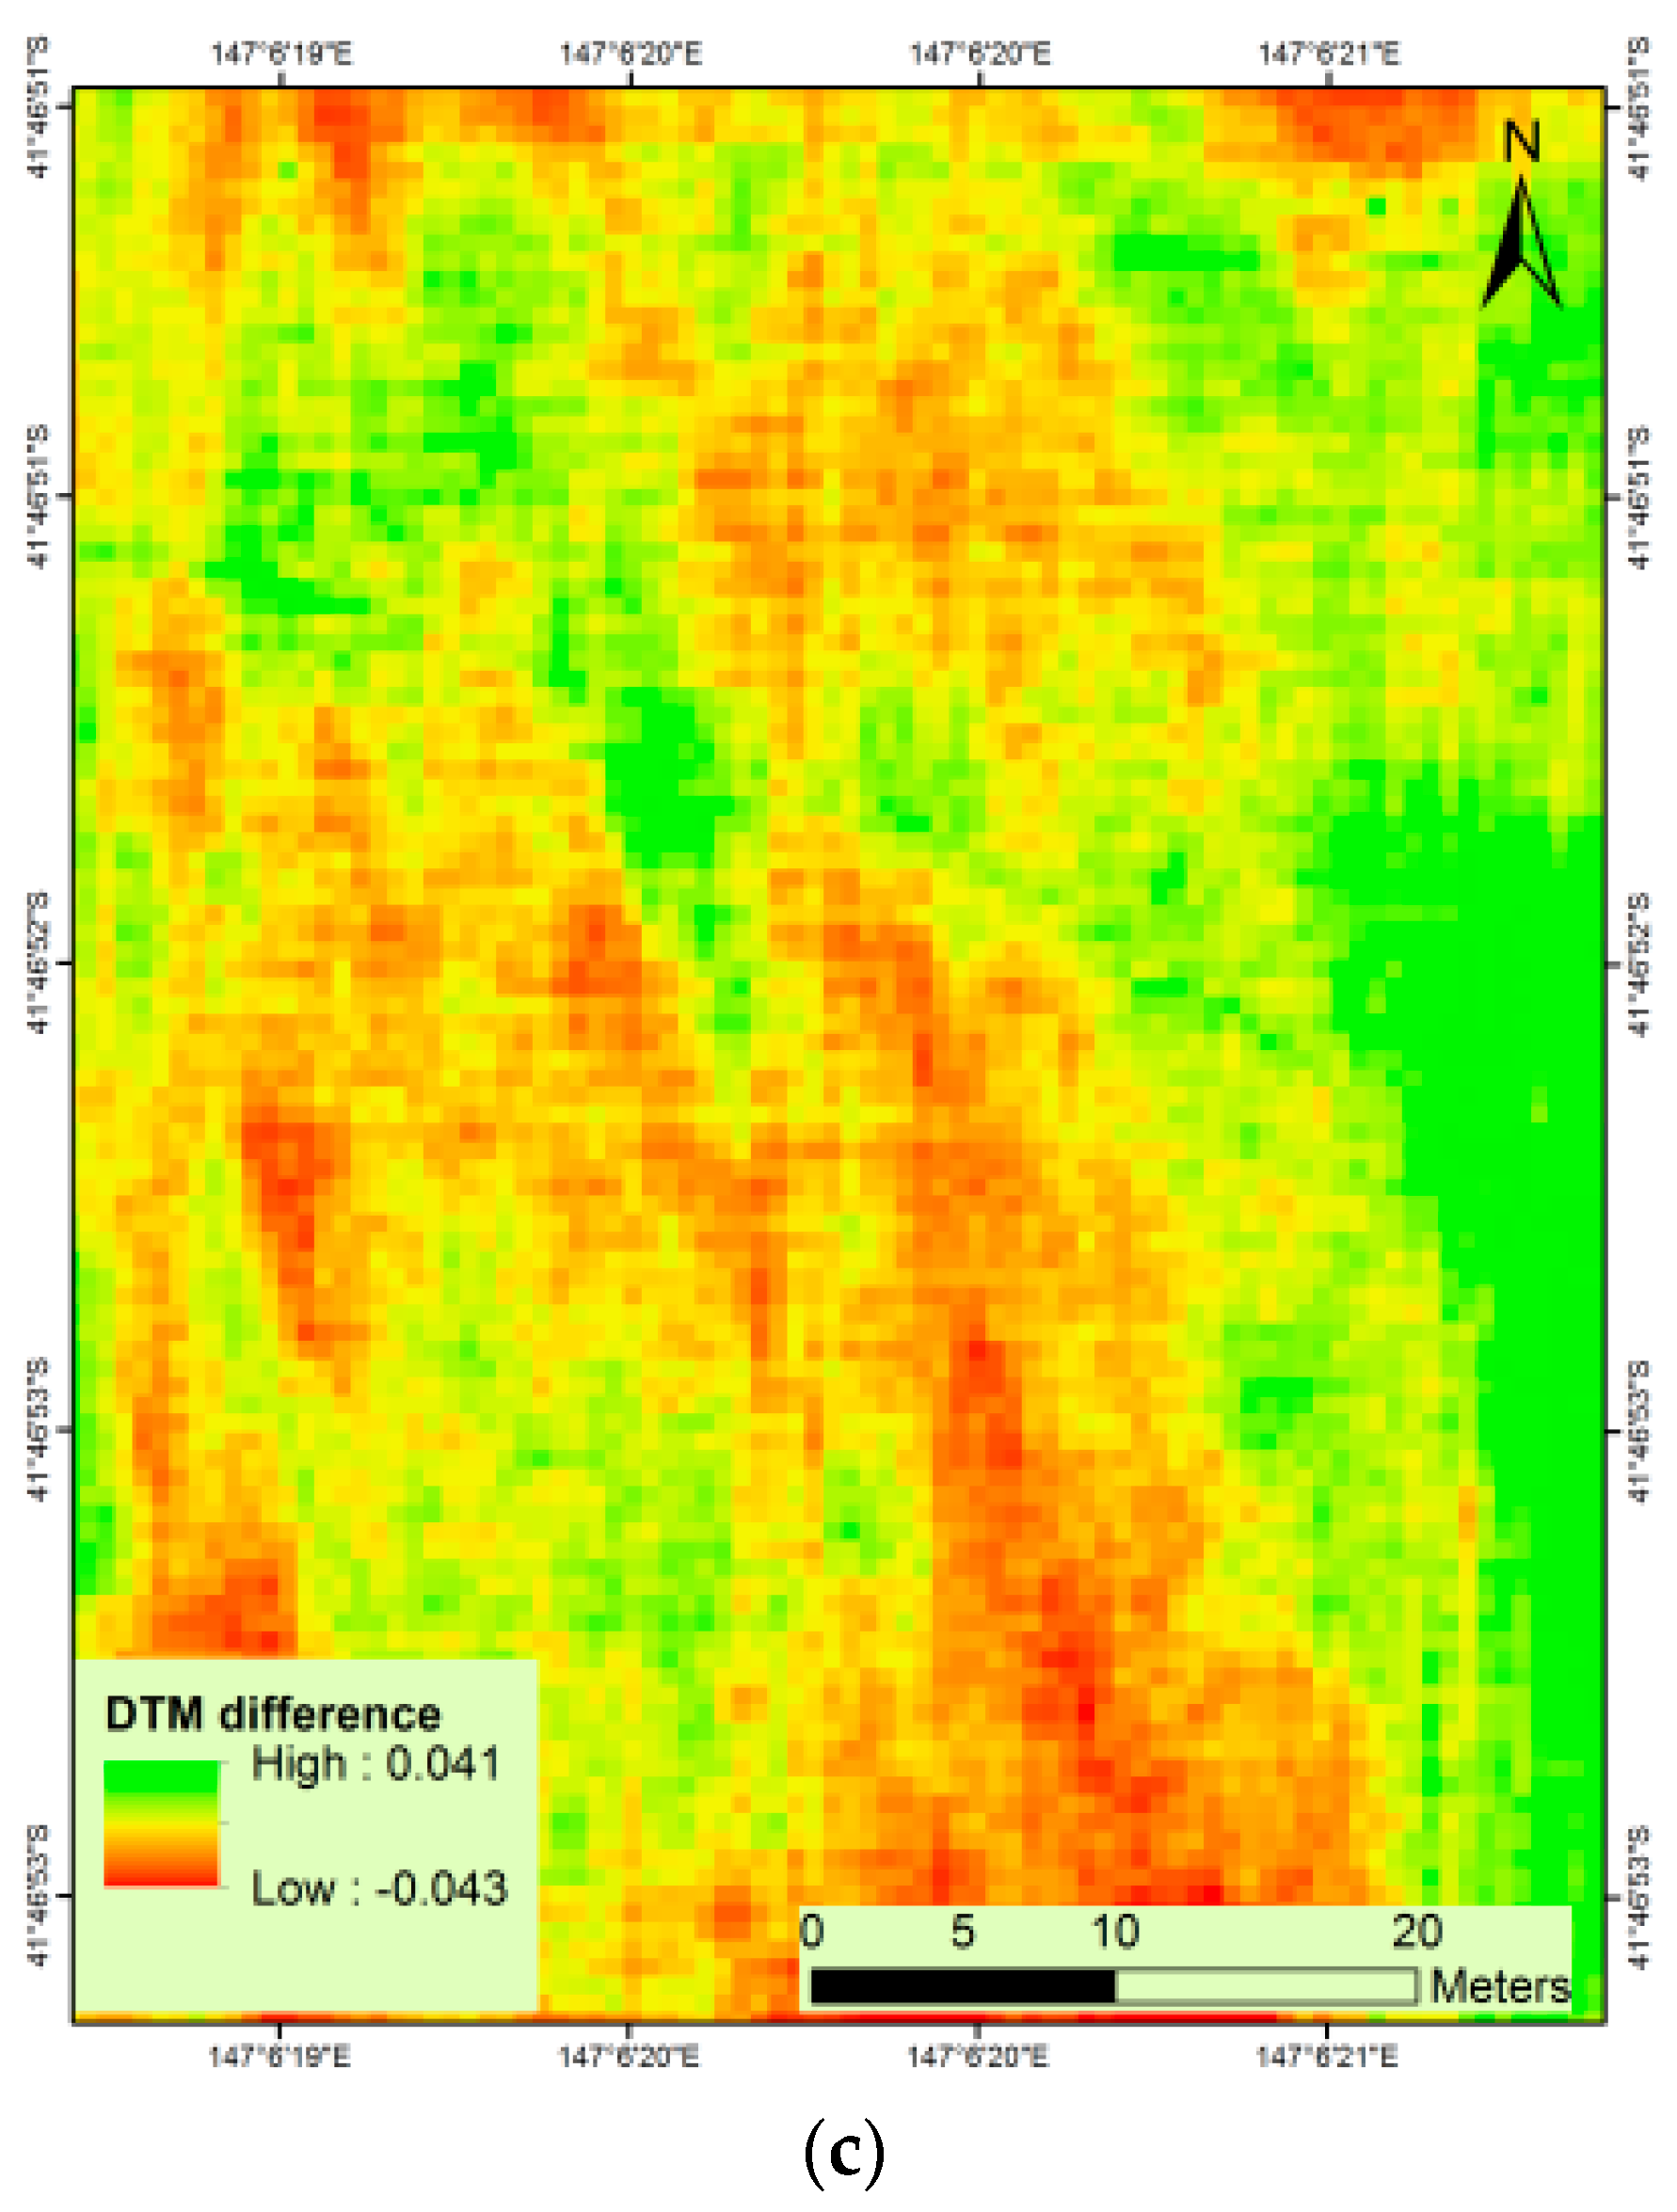
Figure 10.
Linear fit between plant height estimated from single and two flights.

Table 1.
Field assessments and Unmanned Aircraft System (UAS) campaigns at the study locations.
| Survey Date | Growth Stage | Observation |
|---|---|---|
| Cambridge | ||
| 28 November 2014 | Flowering | Physical |
| 16 December 2014 | Capsule development | Physical |
| 21 December 2014 | Capsule formation | Physical |
| 22 December 2014 | Capsule formation | Physical, UAS, GPS |
| Cressy | ||
| 17 September 2015 | Sowing and germination | UAS, GPS |
| 3 December 2015 | Capsule formation | Physical, UAS |
Table 2.
Field measured data of plant height and capsule volume for two transects at individual plant level (n = 65 for T1 and n = 60 for T2). PH, plant height; CV, capsule volume.
Table 2.
Field measured data of plant height and capsule volume for two transects at individual plant level (n = 65 for T1 and n = 60 for T2). PH, plant height; CV, capsule volume.
| Statistics | Transect 1 | Transect 2 | ||
|---|---|---|---|---|
| PH (cm) | CV (cm3) | PH (cm) | CV (cm3) | |
| Min PH | 49.00 | 13.71 | 59.00 | 16.08 |
| Median PH | 69.00 | 36.79 | 74.00 | 36.86 |
| Mean PH | 72.55 | 34.71 | 74.46 | 35.44 |
| Max PH | 110.0 | 60.00 | 89.00 | 49.35 |
Table 3.
Regression of plant height versus capsule volume from field measurement of two transects. T1: Transect 1, T2: Transect 2. N = number of sample; SE = standard error; R2 = coefficient of determination; with p < 0.0001; RMSE = root mean squared error; RMSE = relative root mean square error.
Table 3.
Regression of plant height versus capsule volume from field measurement of two transects. T1: Transect 1, T2: Transect 2. N = number of sample; SE = standard error; R2 = coefficient of determination; with p < 0.0001; RMSE = root mean squared error; RMSE = relative root mean square error.
| Transect | Regression Model | N | SE (cm3) | R2 | RMSE (cm3) | RMSE% |
|---|---|---|---|---|---|---|
| T1 | CV = 0.6127 × PH −9.730 | 65 | 6.33 | 0.71 | 7.23 | 20.80 |
| T2 | CV = 0.7911 × PH −23.66 | 60 | 4.30 | 0.72 | 5.32 | 15.00 |
Table 4.
Measured and estimated plant height (cm) for two transects at the individual plant level PH for Transect 1 and 2 at the Cambridge site.
Table 4.
Measured and estimated plant height (cm) for two transects at the individual plant level PH for Transect 1 and 2 at the Cambridge site.
| Statistics | Transect 1 | Transect 2 | ||
|---|---|---|---|---|
| Measured (cm) | Estimated (cm) | Measured (cm) | Estimated (cm) | |
| Min PH | 49.00 | 38.00 | 59.00 | 47.00 |
| Median PH | 69.00 | 59.00 | 74.00 | 64.50 |
| Mean PH | 72.55 | 60.00 | 74.46 | 64.50 |
| Max PH | 110.0 | 92.00 | 89.00 | 82.00 |
Table 5.
Root mean square error (RMSE) and relative root mean square error (RMSE %) compared with average of measured plant height (PH) for Transect 1 (T1) and Transect 2 (T2) at the Cambridge site.
Table 5.
Root mean square error (RMSE) and relative root mean square error (RMSE %) compared with average of measured plant height (PH) for Transect 1 (T1) and Transect 2 (T2) at the Cambridge site.
| RMSE (cm) | Average PH (cm) | RMSE% | |
|---|---|---|---|
| PH (T1) | 13.58 | 72.54 | 18.72 |
| PH (T2) | 10.12 | 74.45 | 13.60 |
© 2017 by the authors. Licensee MDPI, Basel, Switzerland. This article is an open access article distributed under the terms and conditions of the Creative Commons Attribution (CC BY) license (http://creativecommons.org/licenses/by/4.0/).
Share and Cite
MDPI and ACS Style
Iqbal, F.; Lucieer, A.; Barry, K.; Wells, R. Poppy Crop Height and Capsule Volume Estimation from a Single UAS Flight. Remote Sens. 2017, 9, 647. https://doi.org/10.3390/rs9070647
AMA Style
Iqbal F, Lucieer A, Barry K, Wells R. Poppy Crop Height and Capsule Volume Estimation from a Single UAS Flight. Remote Sensing. 2017; 9(7):647. https://doi.org/10.3390/rs9070647
Chicago/Turabian StyleIqbal, Faheem, Arko Lucieer, Karen Barry, and Reuben Wells. 2017. "Poppy Crop Height and Capsule Volume Estimation from a Single UAS Flight" Remote Sensing 9, no. 7: 647. https://doi.org/10.3390/rs9070647
Note that from the first issue of 2016, this journal uses article numbers instead of page numbers. See further details here.