
Evaluation of Satellite-Based Rainfall Estimates and Application to Monitor Meteorological Drought for the Upper Blue Nile Basin, Ethiopia


Abstract
:
1. Introduction
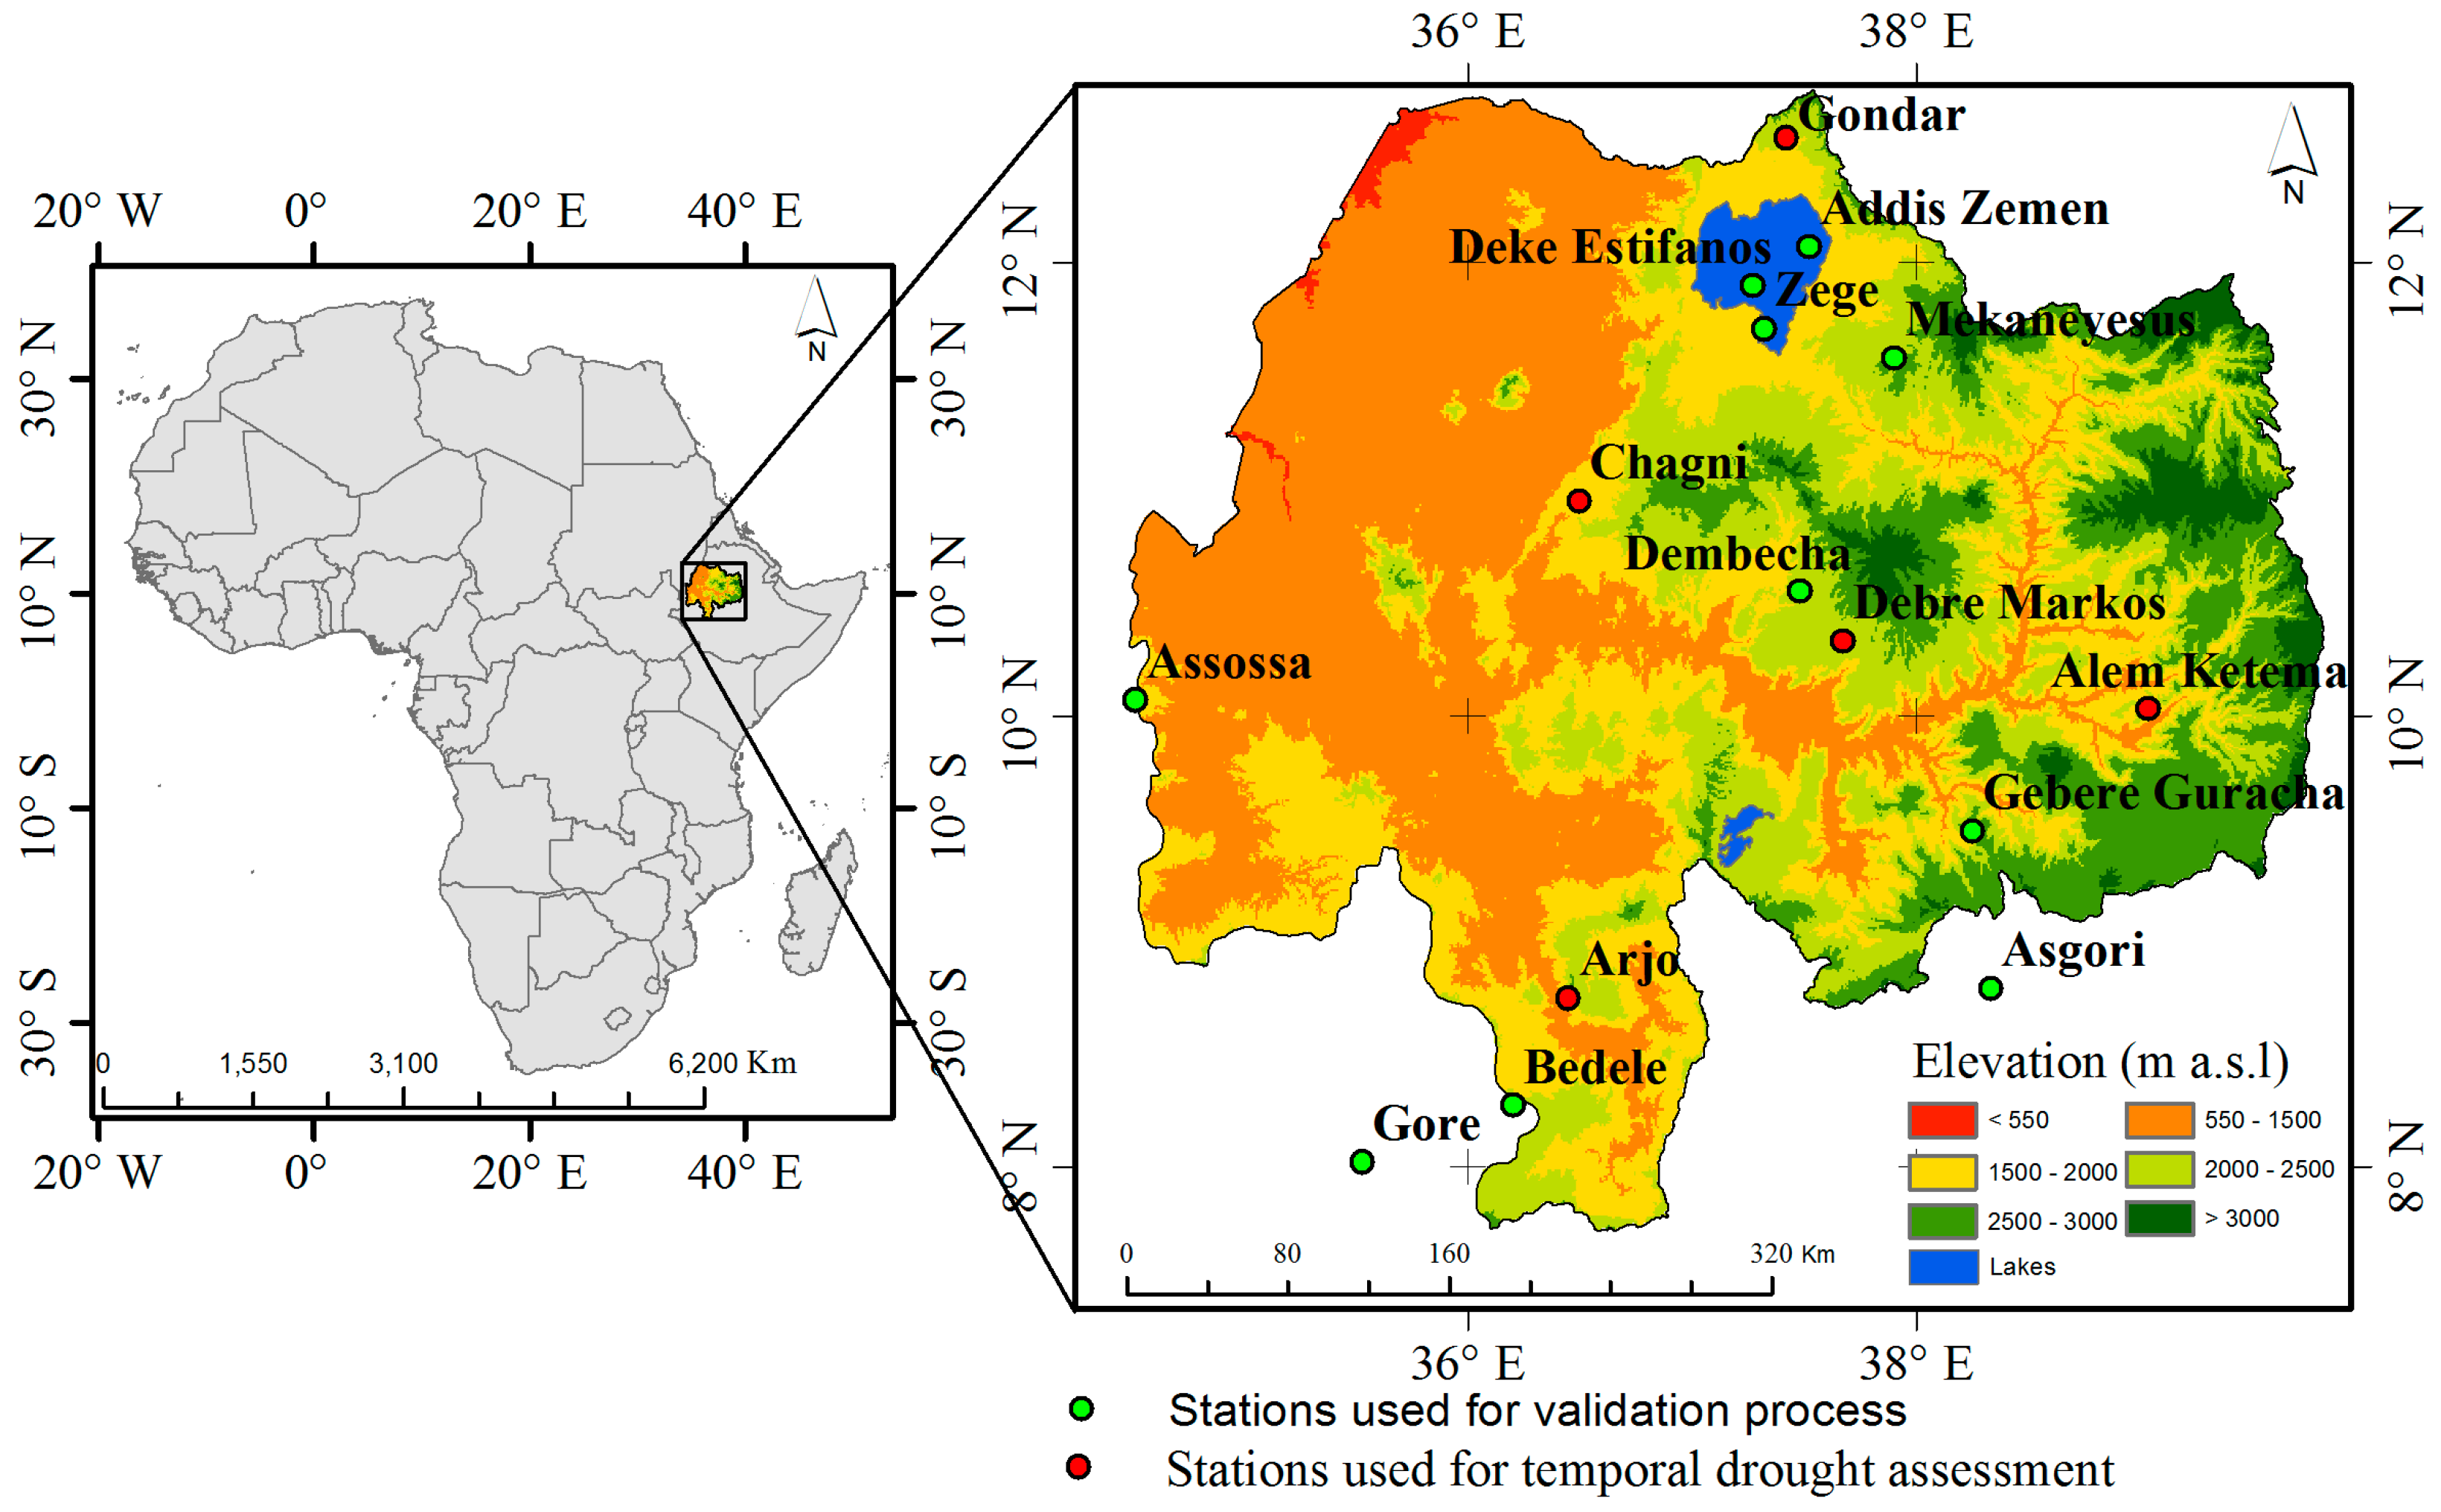
2. Study Area
3. Data Used
3.1. Weather Station Data
3.2. Satellite Data
- CHIRPS was developed by the U.S. Geological Survey (USGS) and the Climate Hazards Group at the University of California, Santa Barbara (UCSB). CHIRPS is a blended product combining a pentadal precipitation climatology, quasi-global geostationary TIR satellite observations from the CPC and the National Climate Forecast System version 2 (CFSv2) [37] and in situ precipitation observations [38].
- ARC incorporates geostationary IR, polar orbiting microwave SSM/I and AMSU-B satellite data and gauge data. ARC uses 3-hourly geostationary IR data centered over Africa from the European Organization for the Exploitation of Meteorological Satellites (EUMETSAT) and quality-controlled GTS gauge observations reporting 24-h rainfall accumulations over Africa [41].
- PERSIANN, developed by the Center for Hydrometeorology and Remote Sensing (CHRS) at the University of California, Irvine (UCI) [42], uses neural network function classification/approximation procedures to compute an estimate of rainfall rate at each 0.25° × 0.25° pixel of the infrared brightness temperature image provided by geostationary satellites. An adaptive training feature facilitates updating of the network parameters whenever independent estimates of rainfall are available. The PERSIANN system was based on geostationary infrared imagery and later extended to include the use of both infrared and daytime visible imagery [29,43,44,45,46,47].
- The TRMM is a joint space mission between NASA and the Japan Aerospace Exploration Agency (JAXA) designed to monitor and study tropical and subtropical precipitation and the associated release of energy. The most widely used outputs are the TMPA 3-hourly (TRMM 3B42) accumulated to daily, and monthly (TRMM3B43) products [39]. The TMPA depends on input from a variety of sensors and sources: the TRMM Precipitation Radar (PR); the TRMM Microwave Imager (TMI); the Advanced Microwave Scanning Radiometer for the Earth Observing System (AMSR-E) on Aqua; the SSM/I and the Special Sensor Microwave Imager/Sounder (SSMIS), both on the Defense Meteorological Satellite Program (DMSP); the AMSU-B and the Microwave Humidity Sounder (MHS), both on the NOAA satellite series; the IR data collected by the international constellation of geosynchronous earth orbit (GEO) satellites; and the GPCP precipitation gauge analysis from the Global Precipitation Climatology Centre (GPCC). Some of these sensors are no longer functional [48]. The Global Precipitation Measurement (GPM) mission is built up on the success of TRMM. GPM advances over TRMM on its extended capability to measure light rain, solid precipitation and the microphysical propertied of precipitation particles [39]. The TRMM 3B42 V7 product (TMPA) have been used in this study.
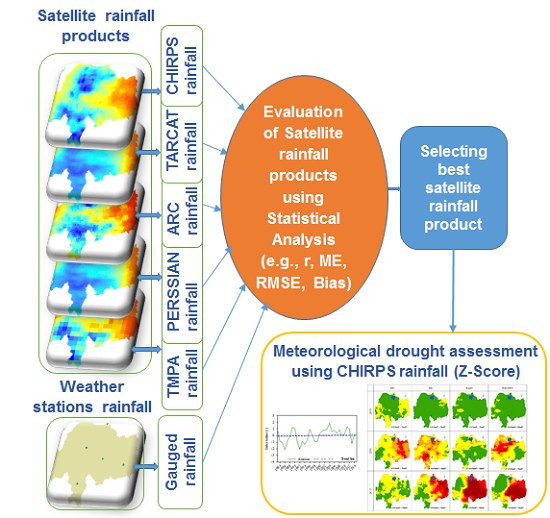
4. Method
4.1. Evaluation of Satellite-Derived Rainfall
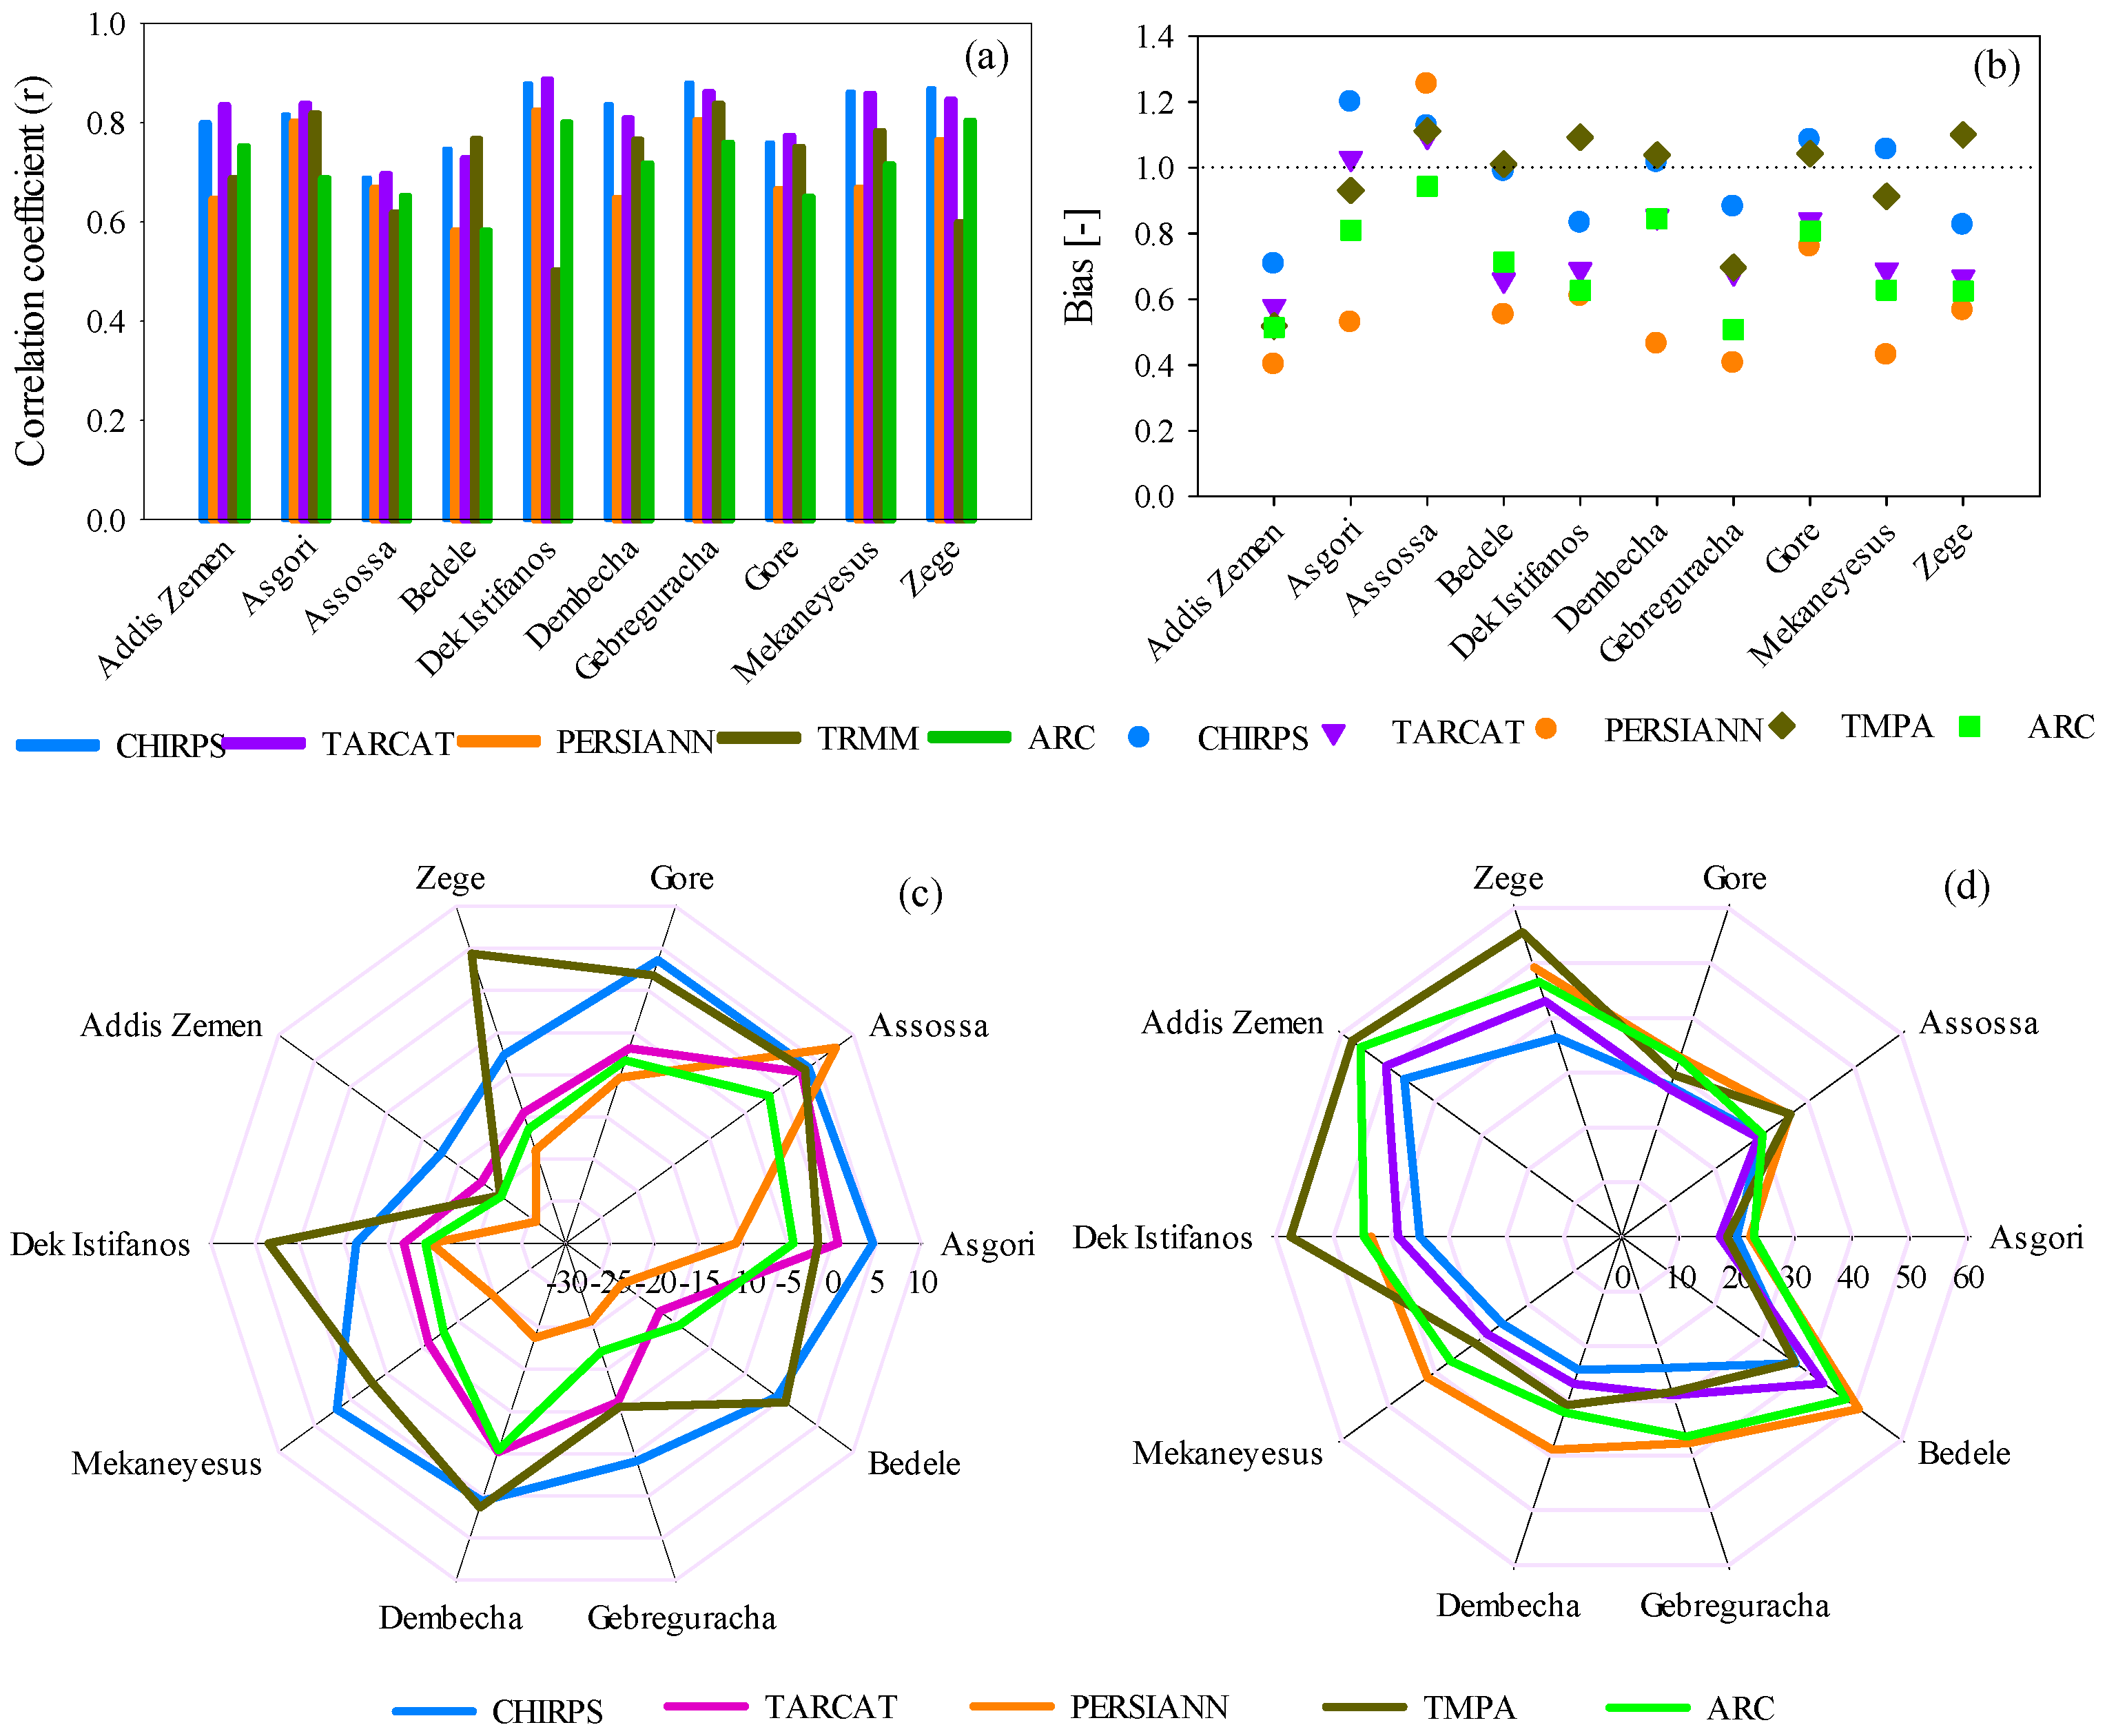
4.2. Evaluation Statistics
4.3. Spatio-Temporal Assessment of Meteorological Drought
5. Results and Discussion
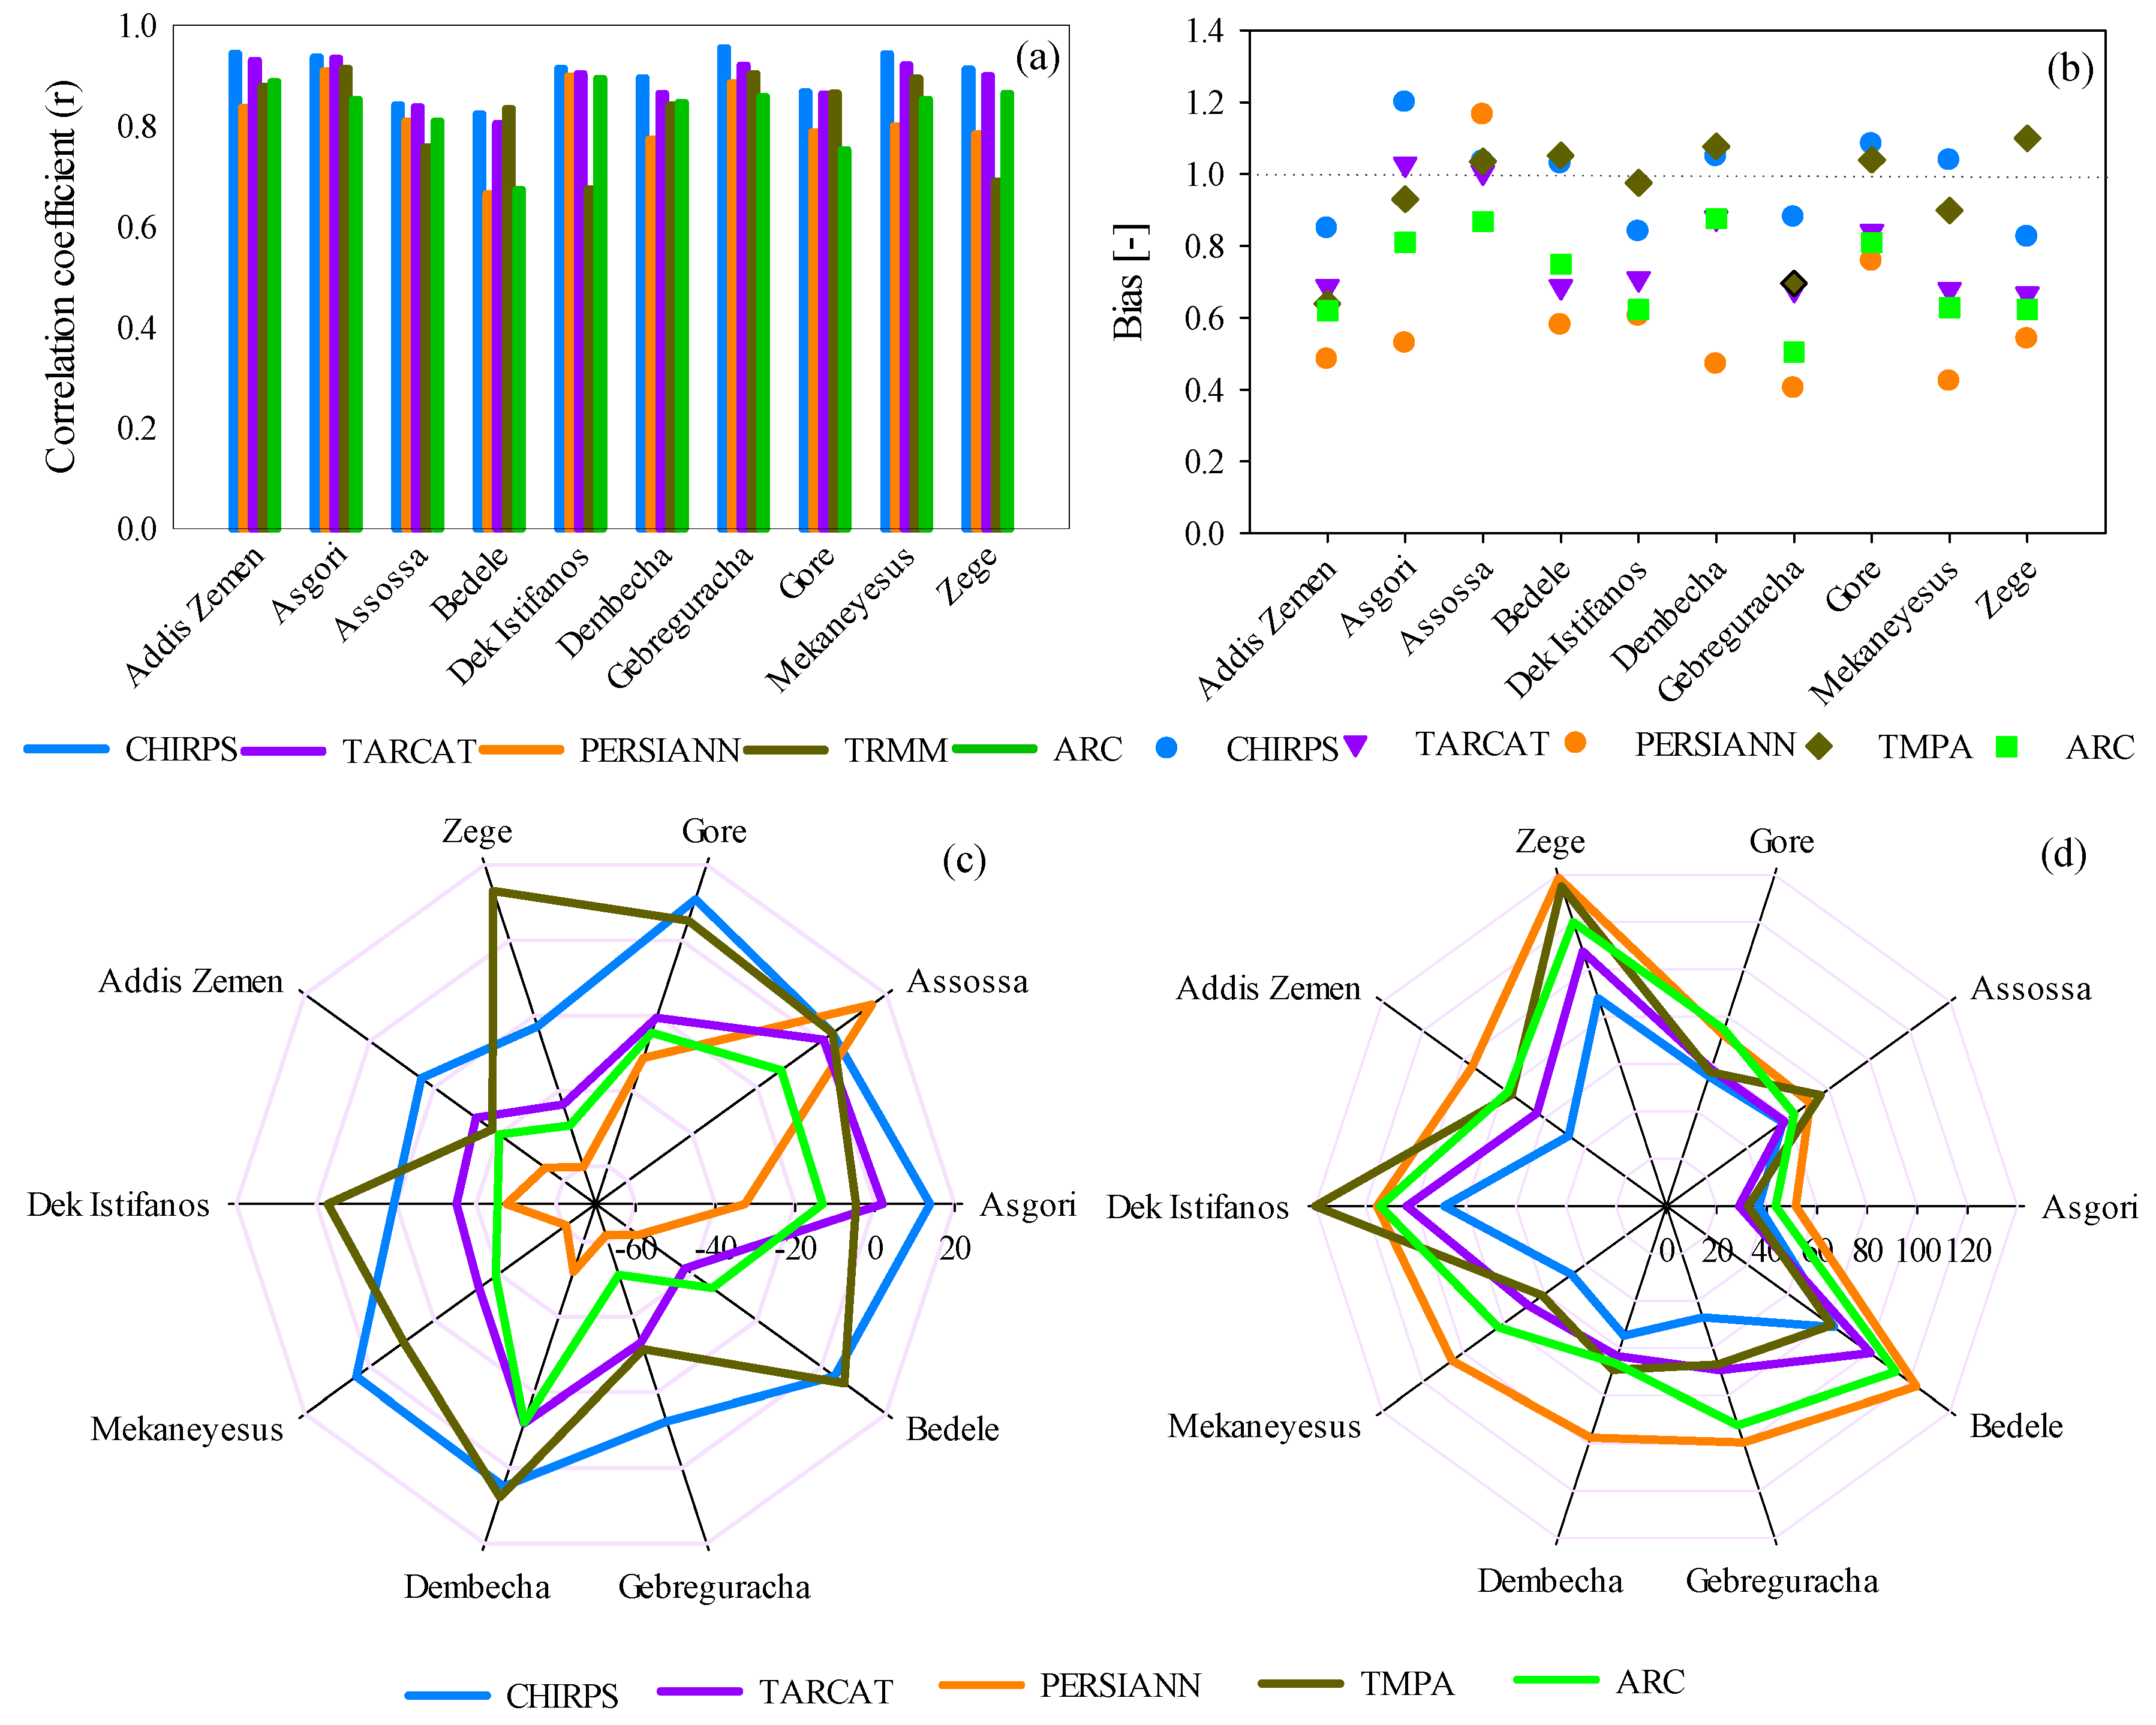
5.1. Evaluation of Satellite Rainfall
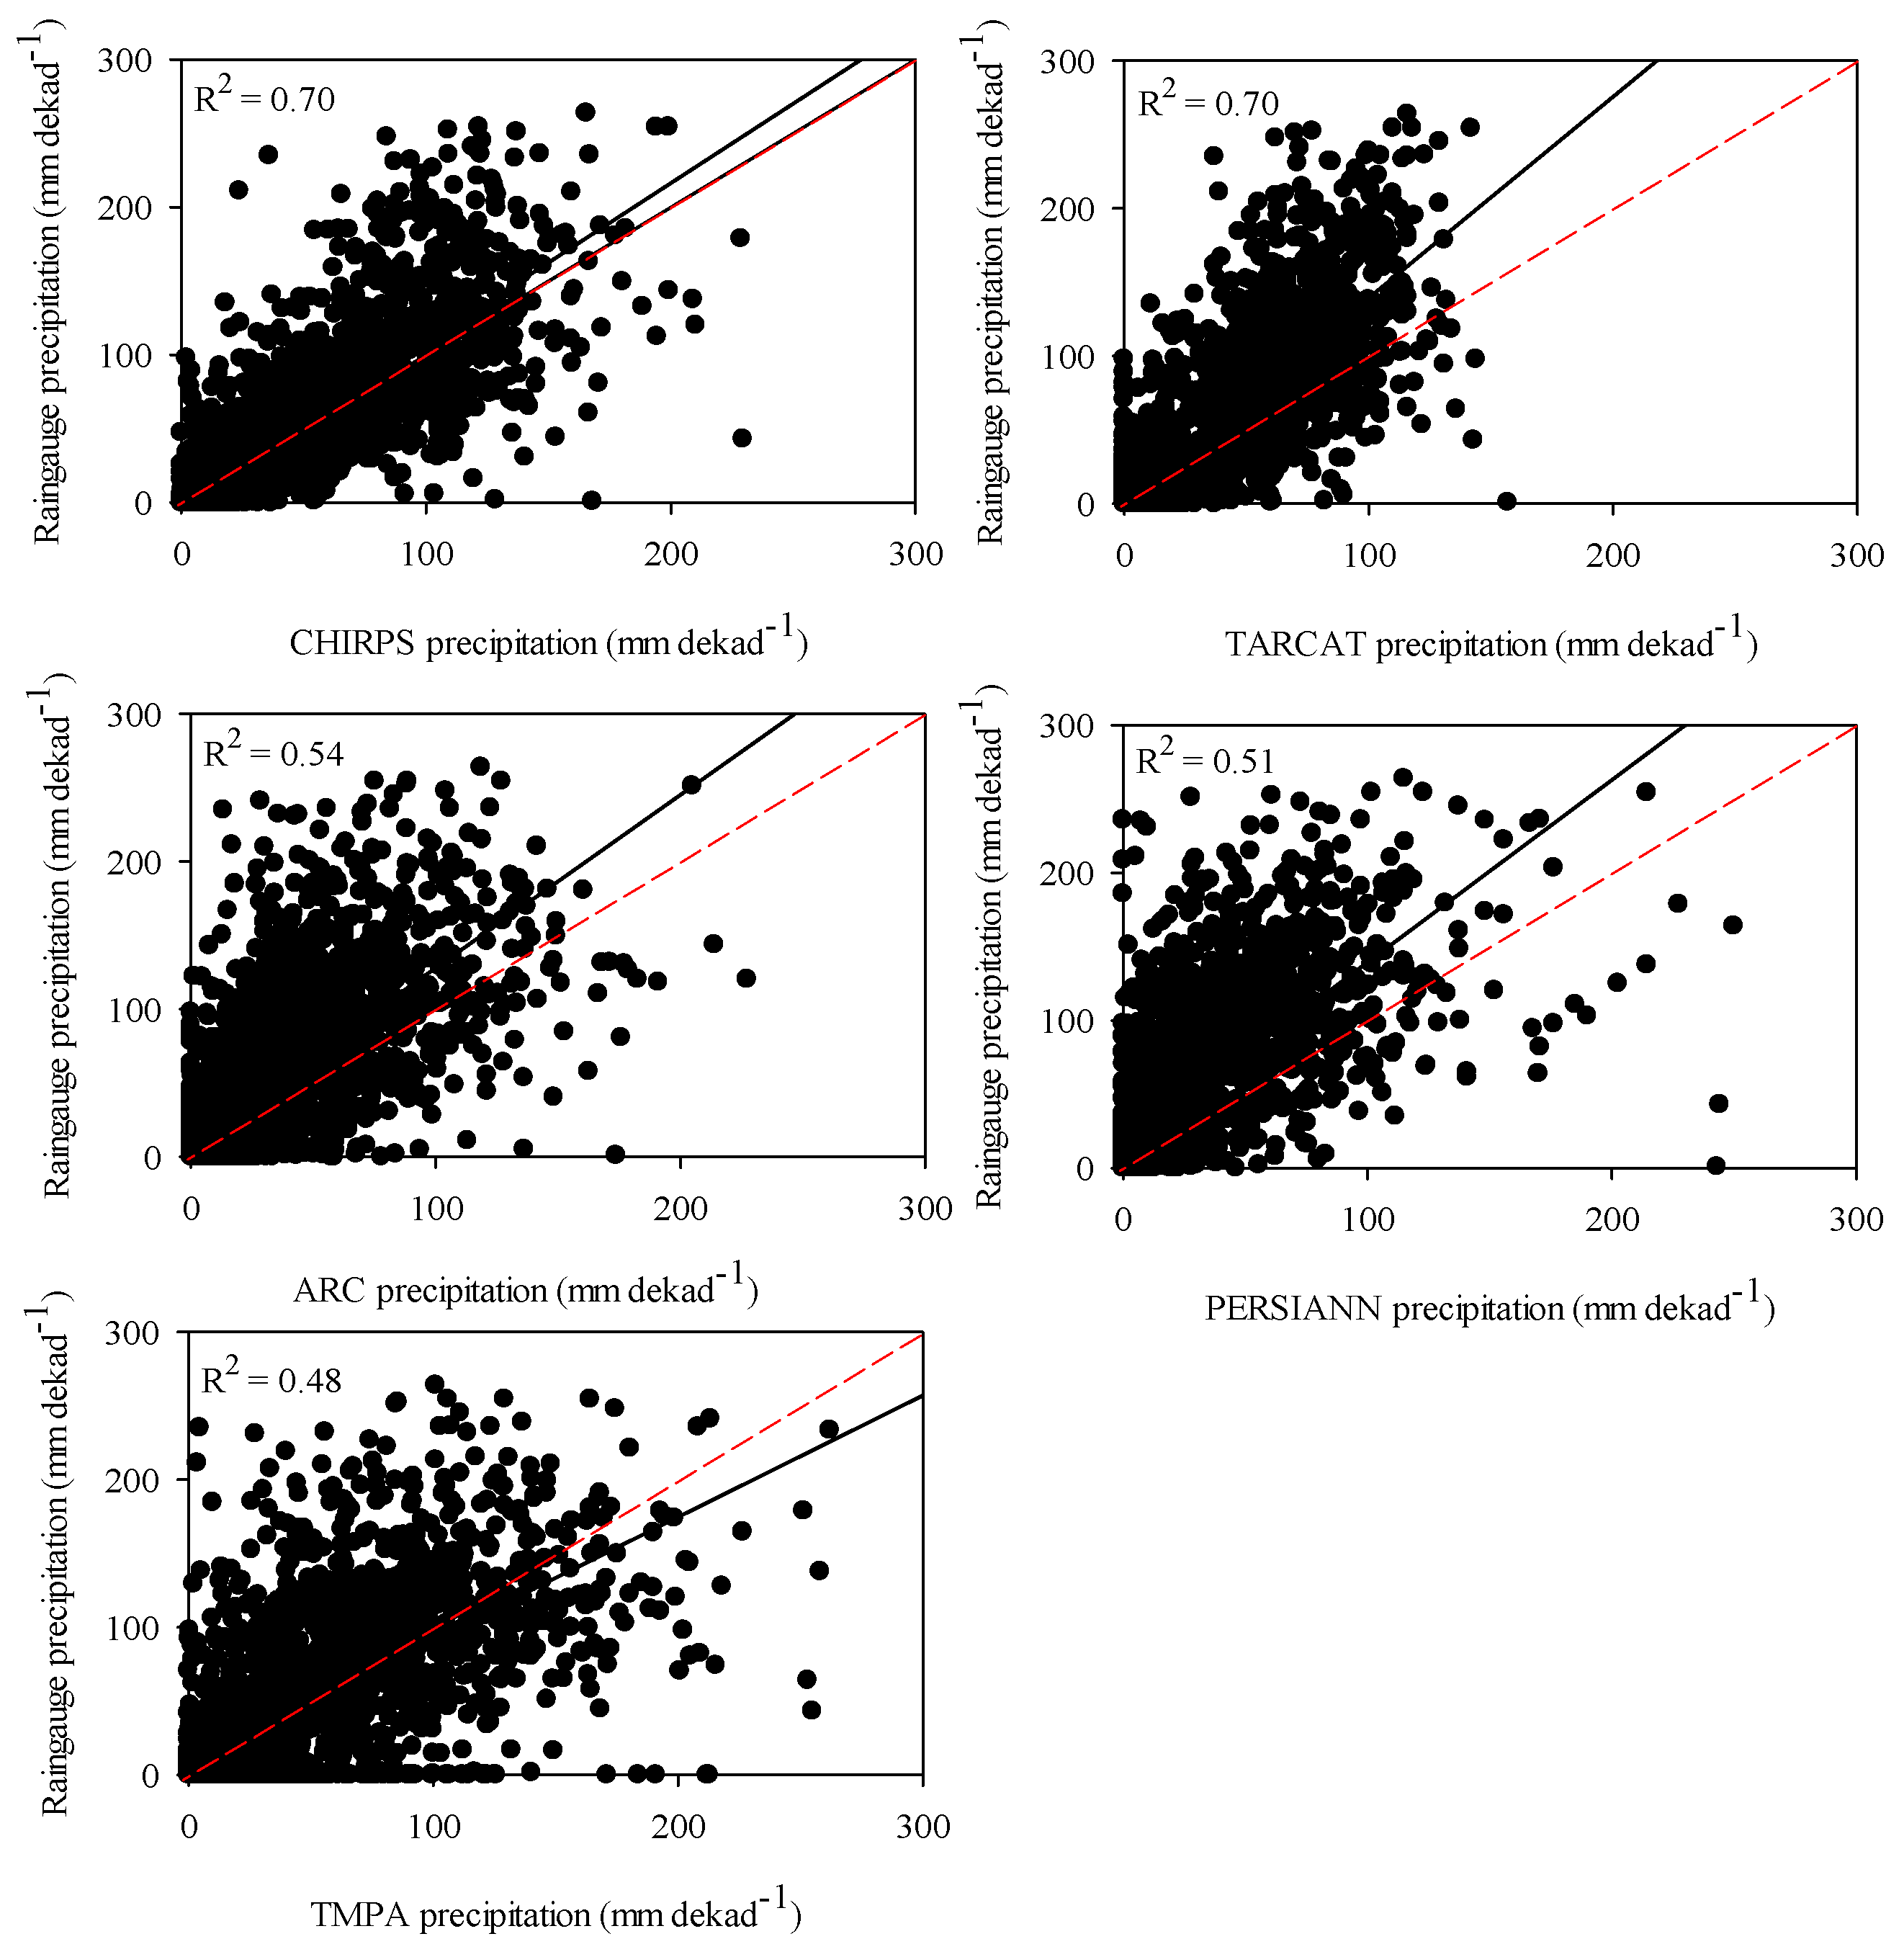
5.1.1. Dekadal Comparison
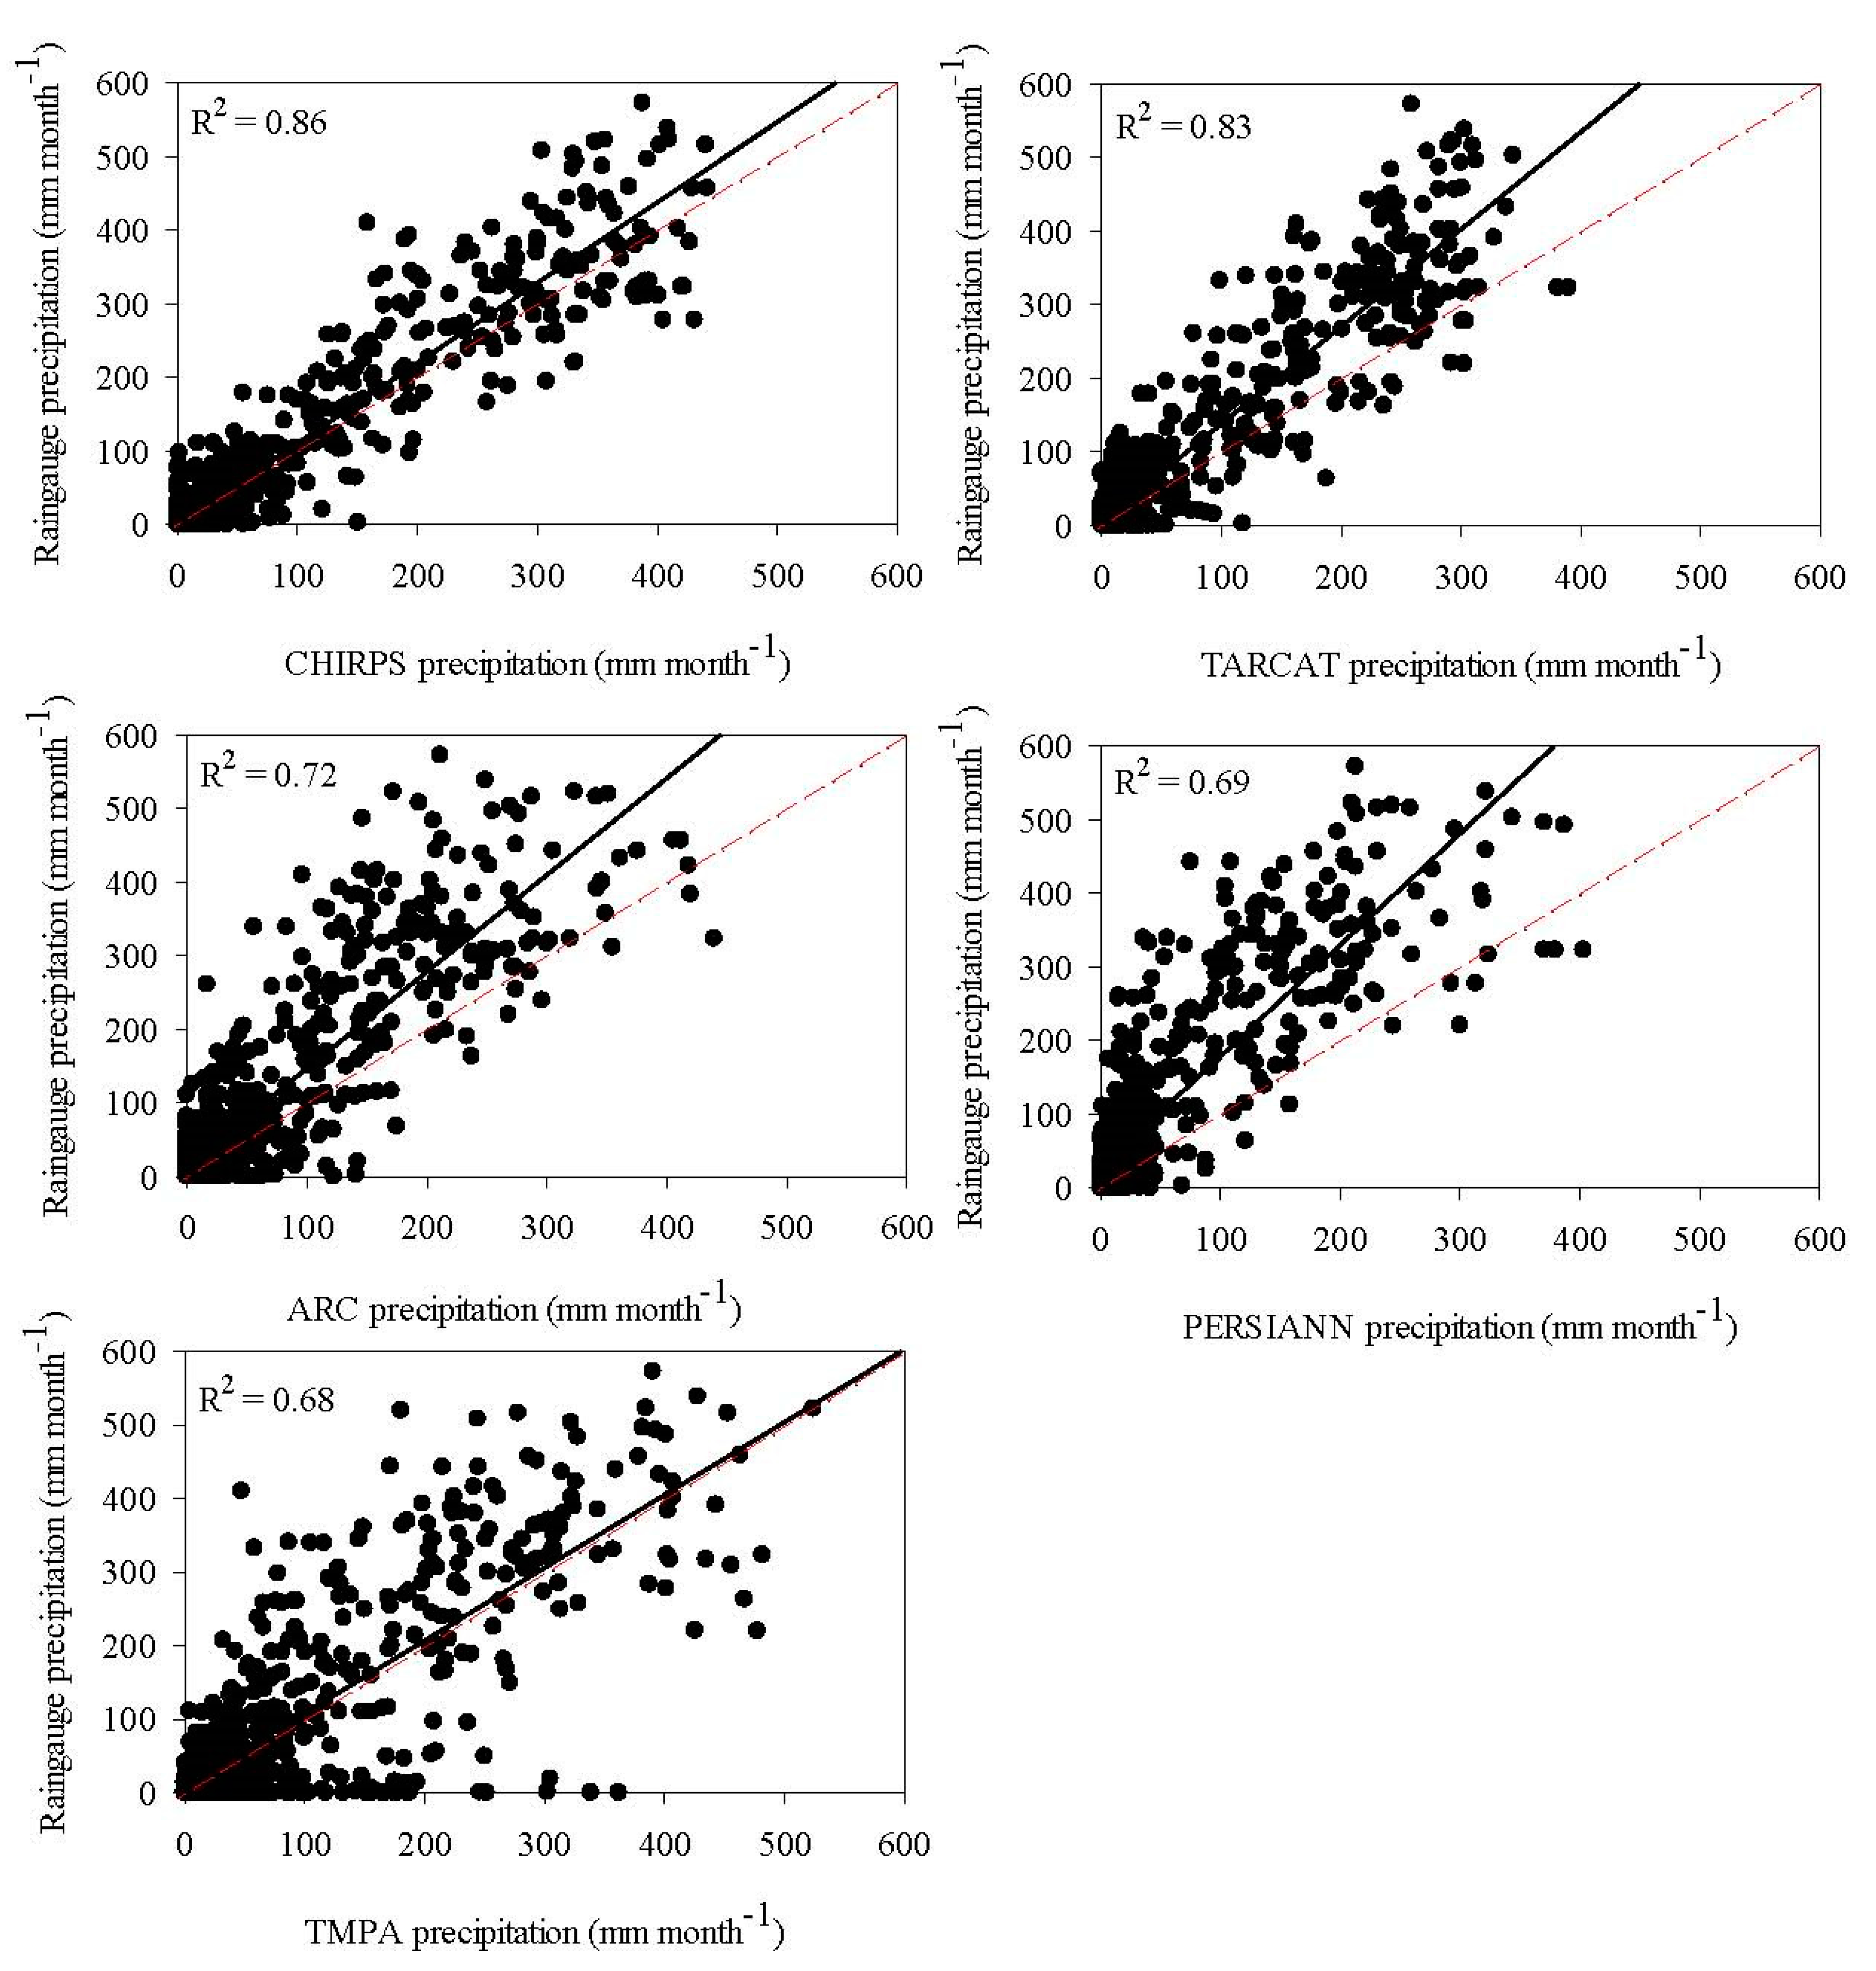
5.1.2. Monthly Comparison
5.1.3. Seasonal Comparison
5.2. Spatio-Temporal Assessment of Meteorological Drought
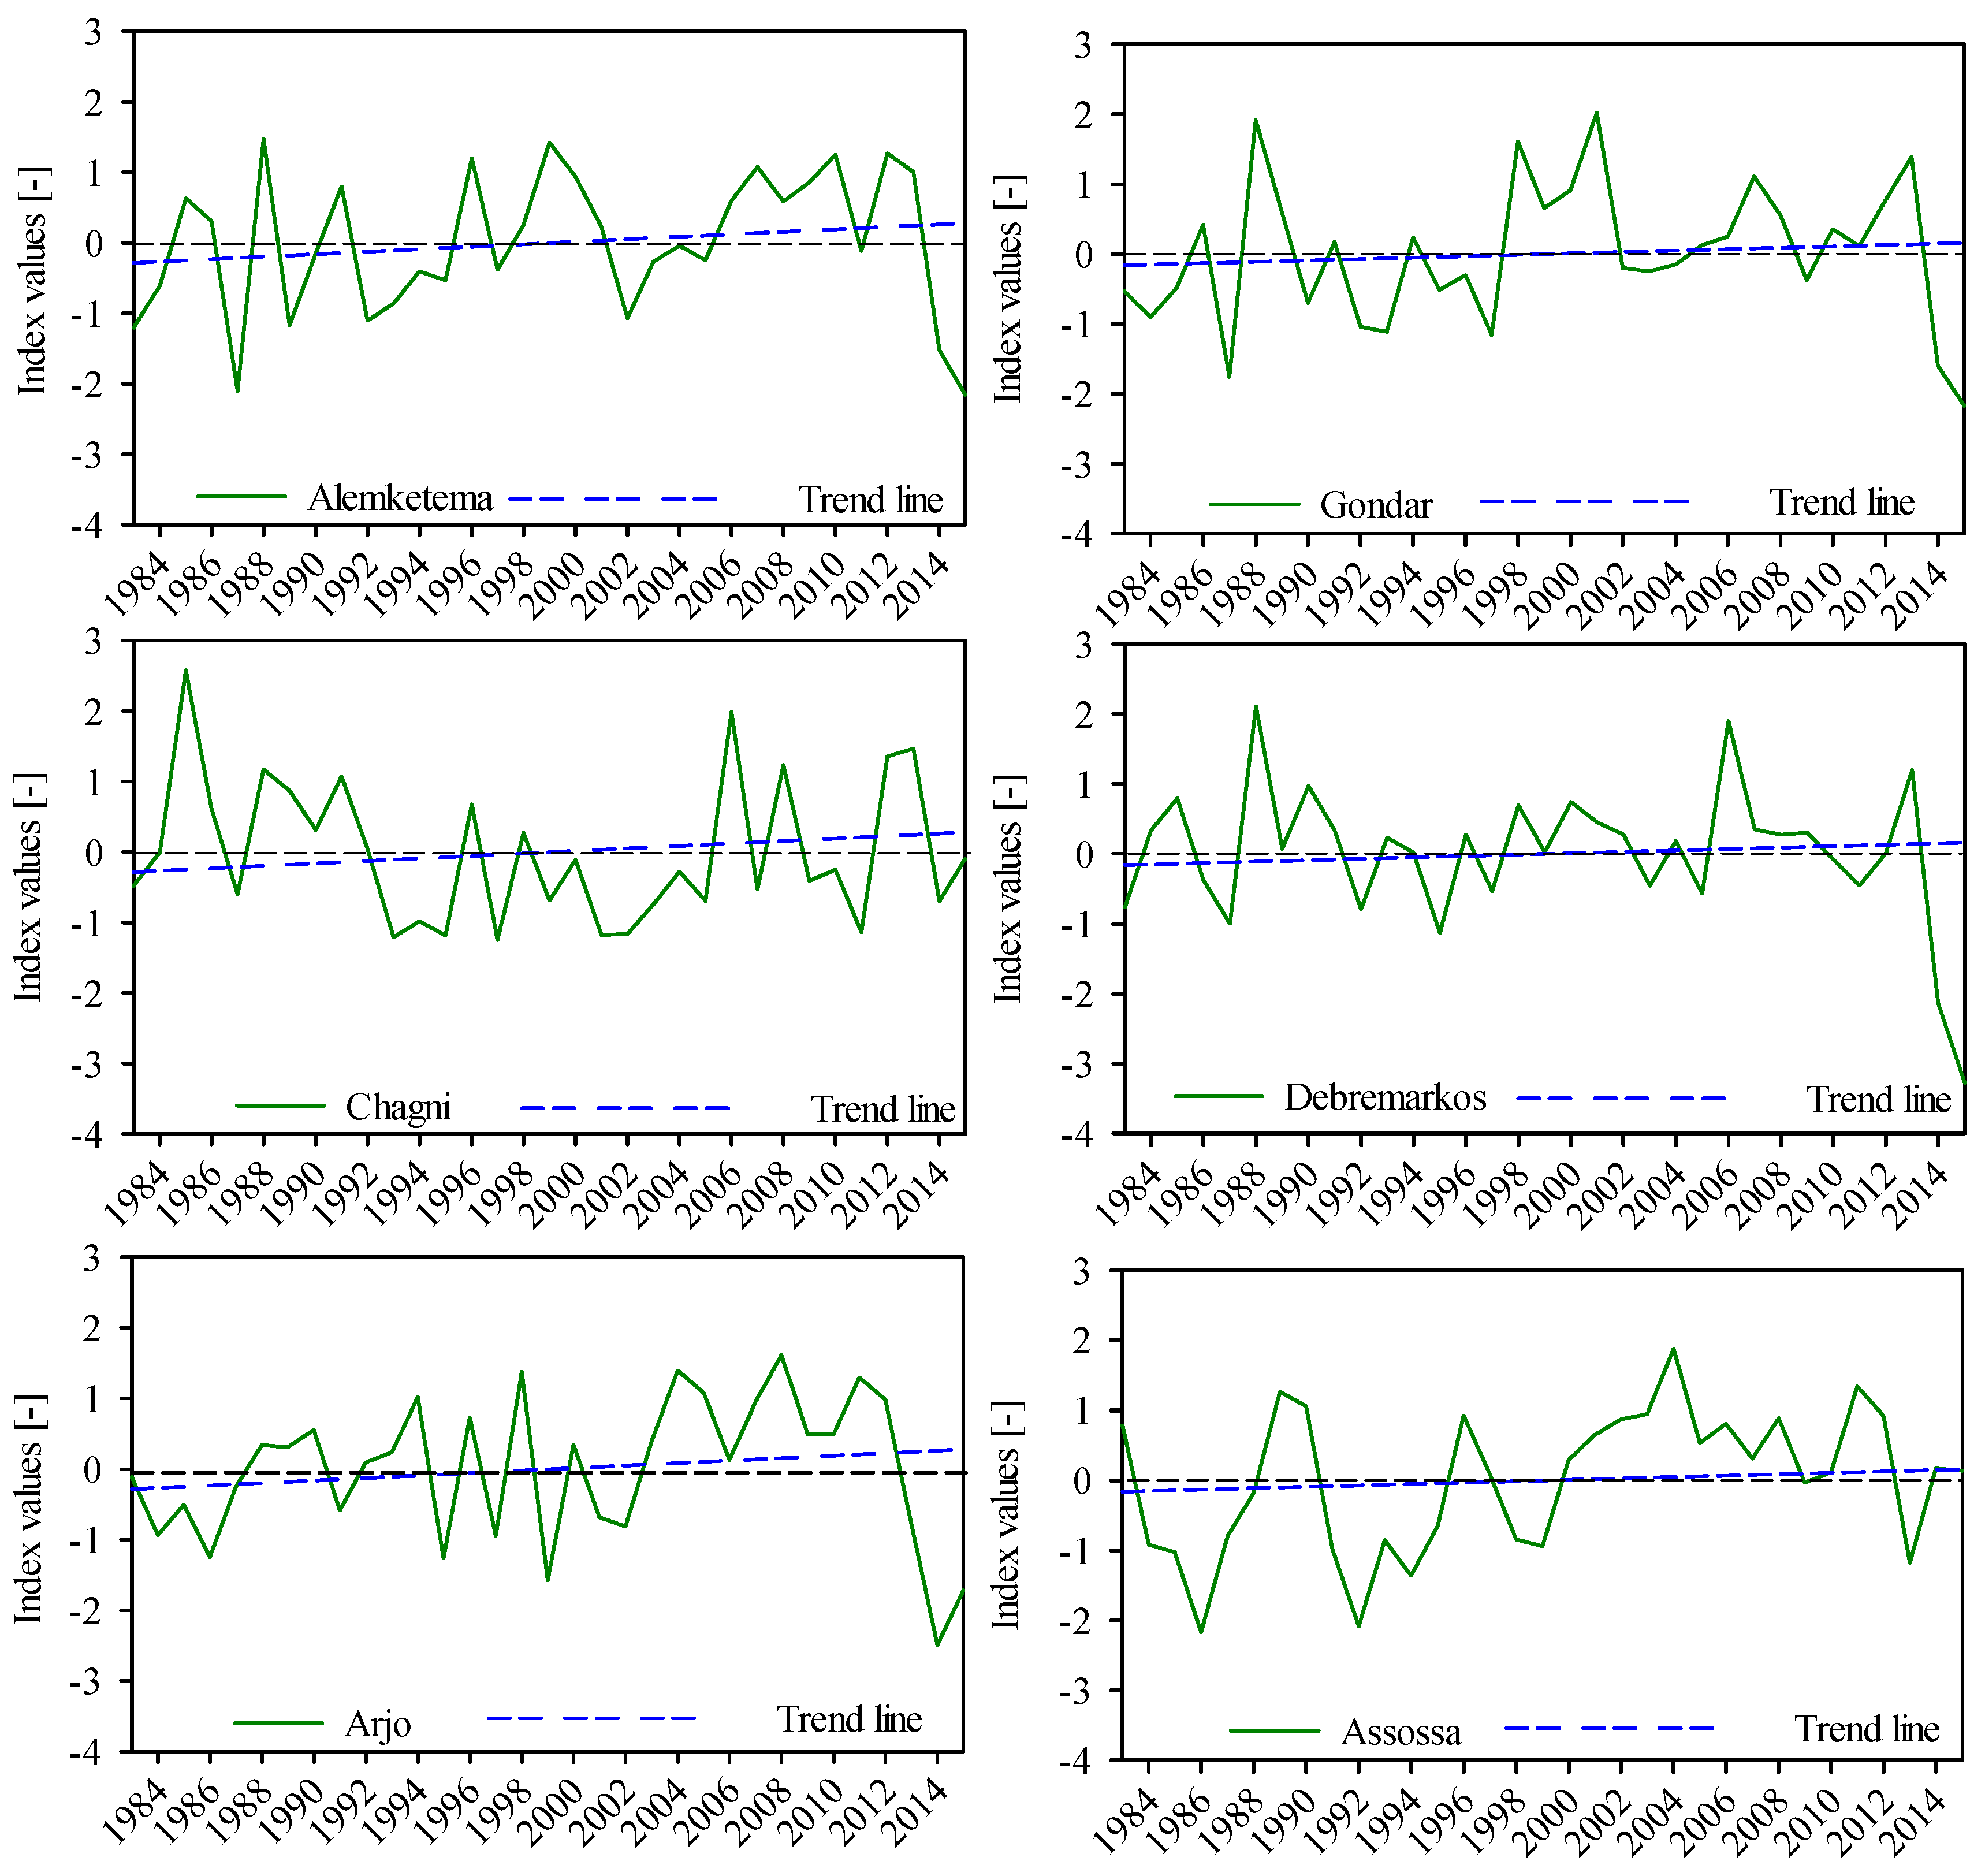
5.2.1. Temporal Drought Assessment
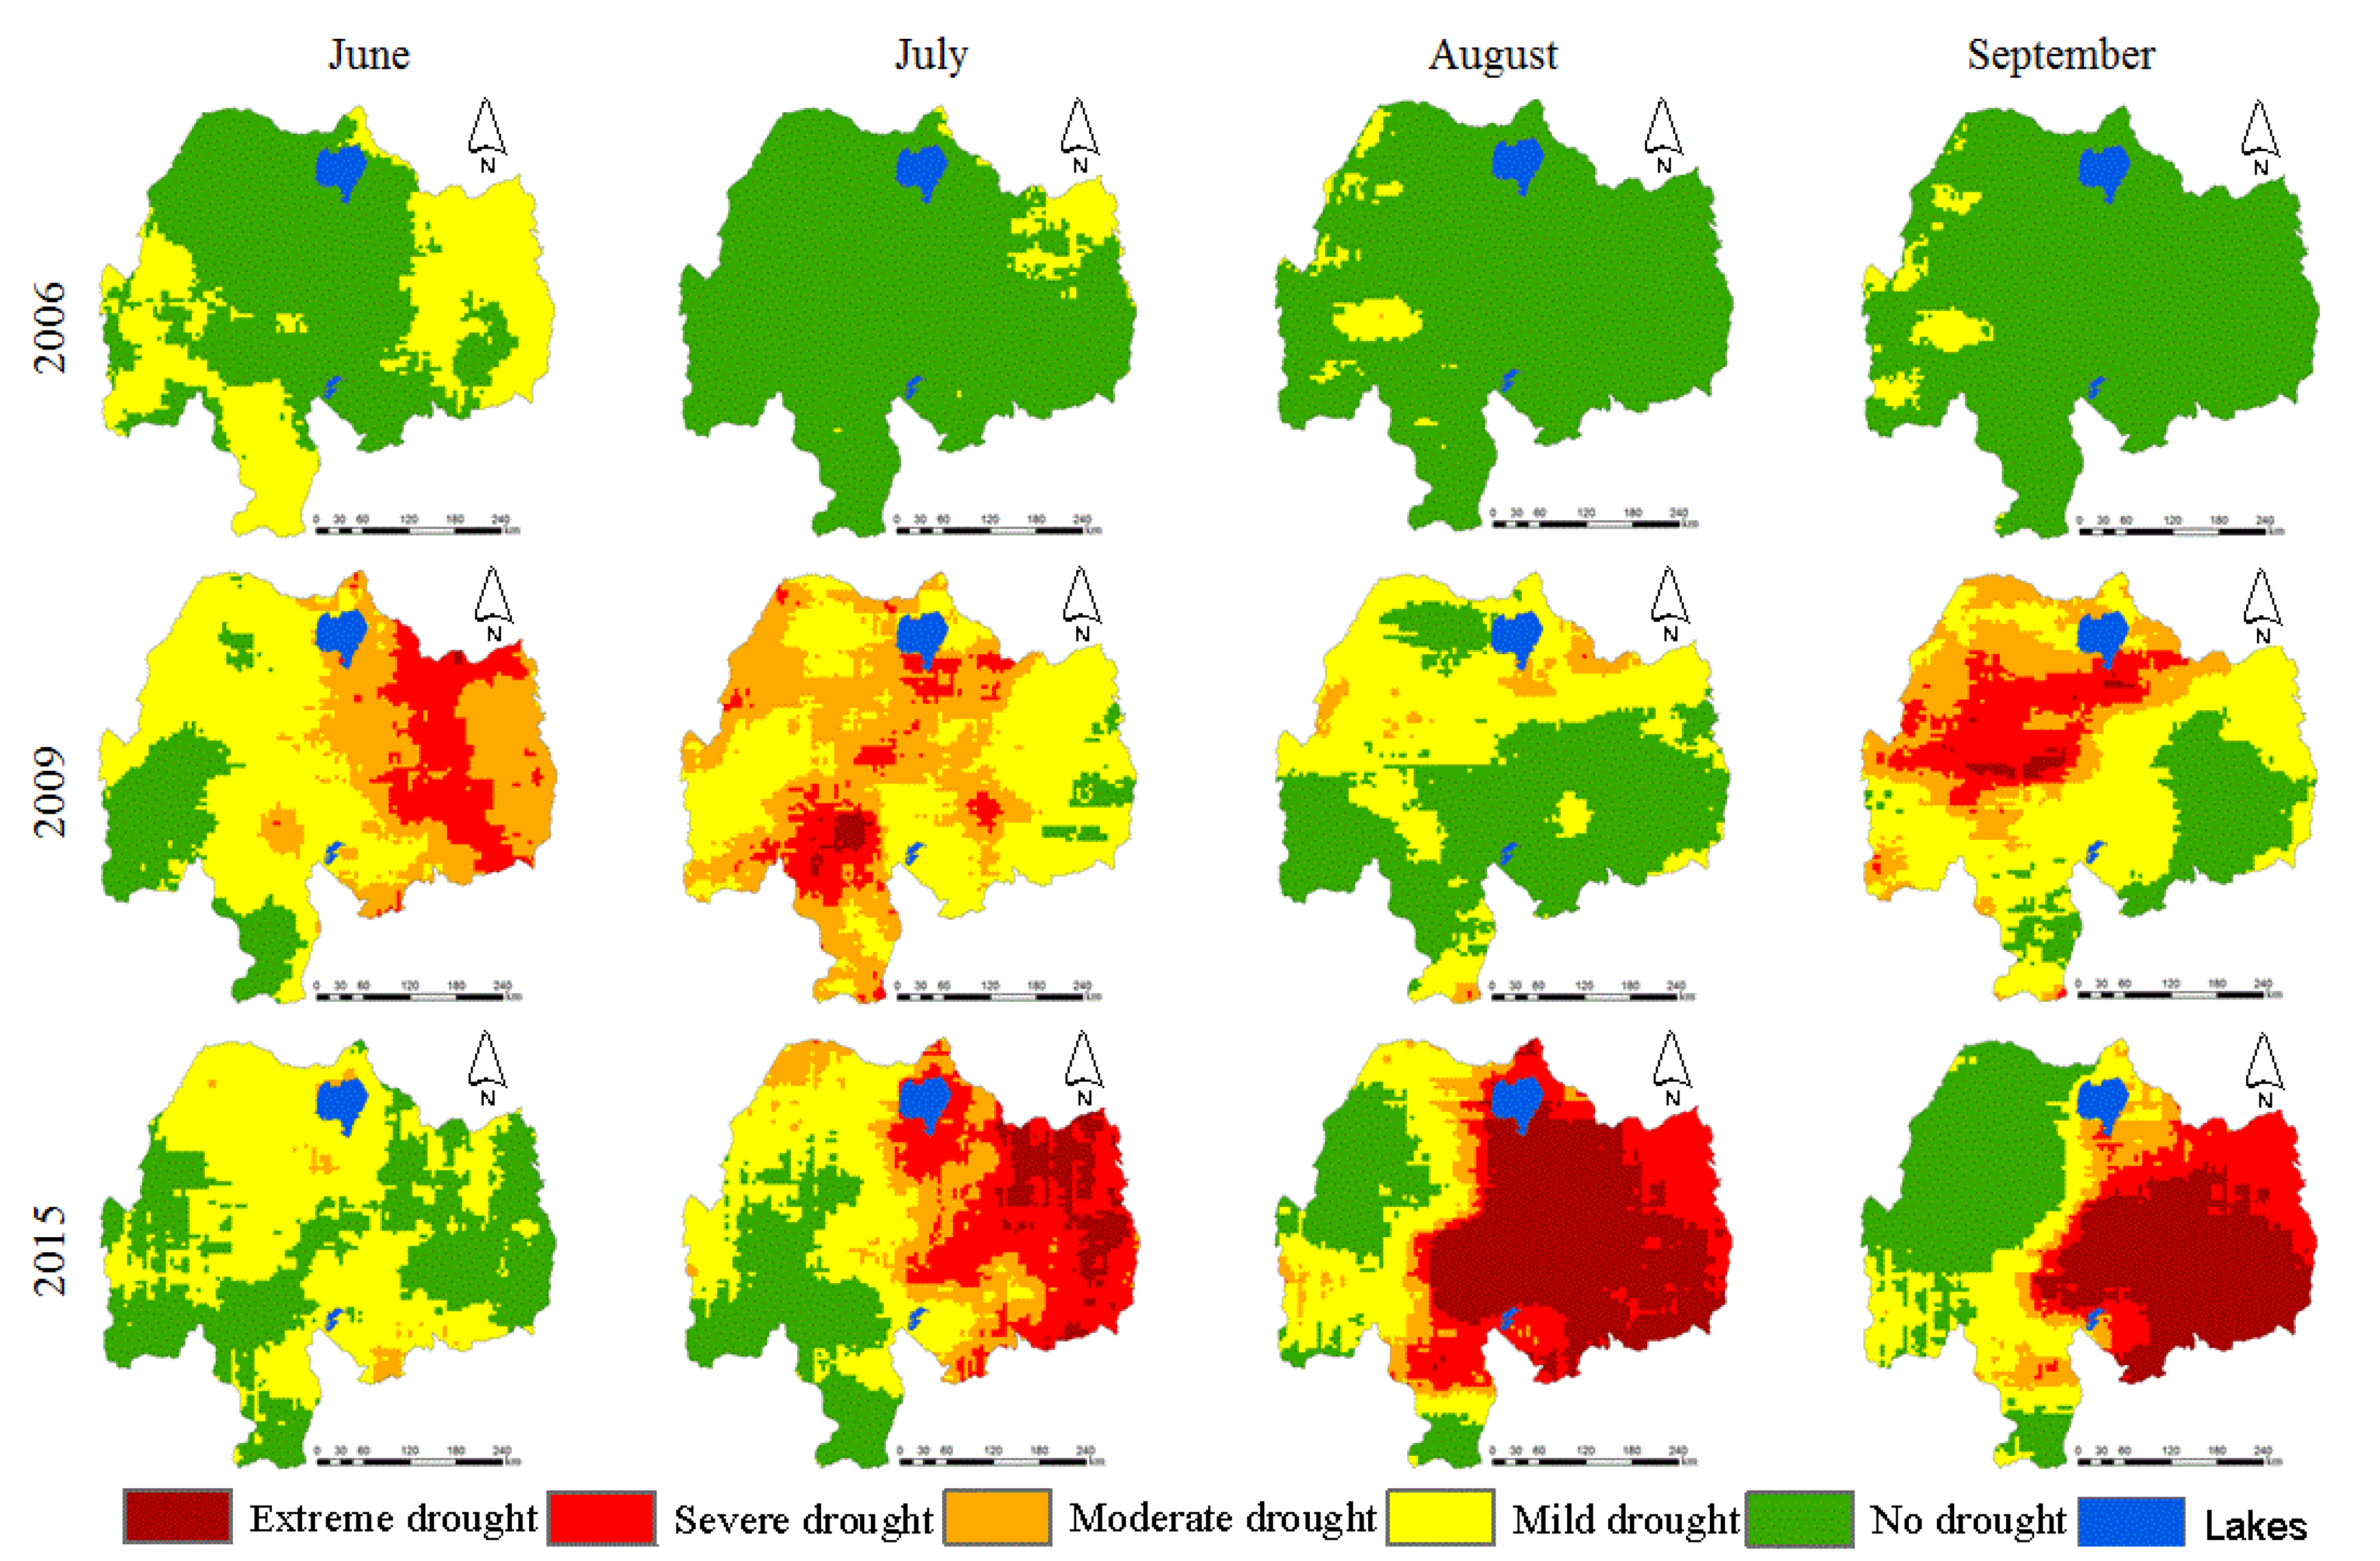
5.2.2. Spatial Drought Assessment
6. Summary and Conclusions
Acknowledgments
Author Contributions
Conflicts of Interest
References
- Sheffield, J.; Wood, F. Drought: Past Problems and Future Scenarios; Earthscan: London, UK, 2012. [Google Scholar]
- Wheaton, E.; Kulshreshtha, S.; Wittrock, V.; Koshida, G. Dry Times: Hard Lessons from the Canadian Drought of 2001 and 2002. Can. Geogr. 2008, 52, 241–262. [Google Scholar] [CrossRef]
- Zhang, A.; Jia, G. Monitoring Meteorological Drought in Semiarid Regions Using Multi-Sensor Microwave Remote Sensing Data. Remote Sens. Environ. 2013, 134, 12–23. [Google Scholar] [CrossRef]
- Mishra, A.K.; Singh, V.P. A review of drought concepts. J. Hydrol. 2009, 391, 202–216. [Google Scholar] [CrossRef]
- Edossa, D.; Babel, S.; Gupta, D. Drought analysis in the Awash River Basin, Ethiopia. Water Resour. Manag. 2009, 24, 1441–1460. [Google Scholar] [CrossRef]
- Viste, E.; Korecha, D.; Sorteberg, A. Recent drought and precipitation tendencies in Ethiopia. Theor. Appl. Climatol. 2013, 112, 535–551. [Google Scholar] [CrossRef]
- Tagel, G.; Van Der Veen, A.; Maathuis, B. Spatial and temporal assessment of drought in the Northern highlands of Ethiopia. Int. J. Appl. Earth Obs. Geoinf. 2011, 13, 309–321. [Google Scholar]
- Bayissa, Y.; Semu, A.; Yunqing, X.; Schalk, J.A.; Shreedhar, M.; Dimitri, P.S.; van Griensven, A.; Tadesse, T. Spatio-temporal assessment of meteorological drought under the influence of varying record length: The case of Upper Blue Nile Basin, Ethiopia. Hydrol. Sci. J. 2015, 60, 1927–1942. [Google Scholar] [CrossRef]
- Guha-Sapir, D.; Vos, F.; Below, R.; Ponserre, S. Annual Disaster Statistical Review 2010: The Numbers and Trends; Université Catholique de Louvain: Brussels, Belgium, 2011. [Google Scholar]
- CSA. Statistical Abstract; FDRE/CSA; Central Statistical Authority: Addis Ababa, Ethiopia, 1999. [Google Scholar]
- Melesse, T.; Hoogmoed, W.B.; Rockström, J.; Savenije, H. Conservation tillage implements and systems for smallholder farmers in semi-arid Ethiopia. Soil Tillage Res. 2009, 104, 185–191. [Google Scholar]
- Bewket, W.; Conway, D. A note on the temporal and spatial variability of rainfall in the drought-prone Amhara region of Ethiopia. Int. J. Climatol. 2007, 27, 1467–1477. [Google Scholar] [CrossRef]
- Seleshi, Y.; Zanke, U. Recent change in rainfall and rainy days in Ethiopia. Int. J. Climatol. 2004, 24, 973–983. [Google Scholar] [CrossRef]
- Trambauer, P.; Maskey, S.; Werner, M.; Pappenberger, F.; Van Beek, L.; Uhlenbrook, S. Identification and simulation of space-time variability of past hydrological drought events in the Limpopo River Basin, Southern Africa. Hydrol. Earth Syst. Sci. Discuss. 2014, 11, 2639–2677. [Google Scholar] [CrossRef]
- Barua, S.; Ng, M.; Perera, C. Comparative evaluation of drought indexes: Case study on the Yarra River catchment in Australia. J. Water Resour. Plan. Manag. 2011, 37, 215–226. [Google Scholar] [CrossRef]
- Wilhite, D.A. Drought as a Natural Hazard: Concepts and Definitions. In Drought: A Global Assessment; Wilhite, D.A., Ed.; Routledge: London, UK, 2000; Volume 1, pp. 3–18. [Google Scholar]
- Narasimhan, B.; Srinivasan, R. Development and evaluation of Soil Moisture Deficit Index (SMDI) and Evapotranspiration Deficit Index (ETDI) for agricultural drought monitoring. Agric. For. Meteorol. 2005, 133, 69–88. [Google Scholar] [CrossRef]
- Valliyodan, B.; Nguyen, H.T. Understanding regulatory networks and engineering for enhanced drought tolerance in plants. Curr. Opin. Plant Biol. 2006, 9, 189–195. [Google Scholar] [CrossRef] [PubMed]
- Wilhite, D.; Buchanan-Smith, M. Drought as Hazard: Understanding the Natural and Social Context. In Drought and Water Crises: Science, Technology, and Management Issues; Wilhite, D.A., Ed.; CRC Press: Boca Raton, FL, USA, 2005; pp. 3–29. [Google Scholar]
- Sepulcre-Canto, G.; Horion, S.; Singleton, A.; Carrao, H.; Vogt, J. Development of a Combined Drought Indicator to detect agricultural drought in Europe. Nat. Hazards Earth Syst. Sci. 2012, 12, 3519–3531. [Google Scholar] [CrossRef]
- Beyene, E.; Meissner, B. Spatio-temporal analyses of correlation between NOAA satellite RFE and weather stations’ rainfall record in Ethiopia. Int. J. Appl. Earth Obs. Geoinf. 2010, 12, S69–S75. [Google Scholar] [CrossRef]
- Korecha, D.; Barnston, A. Predictability of June–September Rainfall in Ethiopia. Mon. Weather Rev. 2007, 135, 628–650. [Google Scholar] [CrossRef]
- Hirpa, F.; Gebremichael, M.; Hopson, T. Evaluation of High-Resolution Satellite Precipitation Products over Very Complex Terrain in Ethiopia. J. Appl. Meteorol. Climatol. 2010, 49, 1044–1051. [Google Scholar] [CrossRef]
- Tadesse, T.; Senay, G.; Berhan, G.; Regassa, T.; Beyene, S. Evaluating A Satellite-Based Seasonal Evapotranspiration Product and Identifying Its Relationship with Other Satellite-Derived Products and Crop Yield: A Case Study for Ethiopia. J. Appl. Meteorol. Climatol. 2015, 40, 39–54. [Google Scholar] [CrossRef]
- Dinku, T.; Chidzambwa, S.; Ceccato, P.; Connor, S.; Ropelewski, C. Validation of high-resolution satellite rainfall products over complex terrain. Int. J. Remote Sens. 2008, 29, 4097–4110. [Google Scholar] [CrossRef]
- Romilly, T.; Gebremichael, M. Evaluation of satellite rainfall estimates over Ethiopian river basins. Hydrol. Earth Syst. Sci. 2011, 15, 1505–1514. [Google Scholar] [CrossRef]
- Bitew, M.; Gebremichael, M.; Ghebremichael, L.; Bayissa, Y. Evaluation of High-Resolution Satellite Rainfall Products through Streamflow Simulation in a Hydrological Modeling of a Small Mountainous Watershed in Ethiopia. J. Hydrometeorol. 2012, 13, 338–350. [Google Scholar] [CrossRef]
- Bitew, M.; Gebremichael, M. Evaluation of satellite rainfall products through hydrologic simulation in a fully distributed hydrologic model. Water Resour. Res. 2011, 47, W06526. [Google Scholar] [CrossRef]
- Sorooshian, S.; Hsu, K.; Gao, X.; Gupta, H.; Imam, B.; Braithwaite, D. Evaluation of PERSIANN System Satellite-Based Estimates of Tropical Rainfall. Bull. Am. Meteorol. Soc. 2000, 81, 2035–2046. [Google Scholar] [CrossRef]
- Qin, Y.; Chen, Z.; Shen, Y.; Zhang, S.; Shi, R. Evaluation of Satellite Rainfall Estimates over the Chinese Mainland. Remote Sens. 2014, 6, 11649–11672. [Google Scholar] [CrossRef]
- Moctar, D.; Sander, J. Evaluation and comparison of satellite-based rainfall products in Burkina Faso, West Africa. Int. J. Remote Sens. 2016, 37, 3995–4014. [Google Scholar]
- Toté, C.; Patricio, D.; Boogaard, H.; Wijngaart, R.; Tarnavsky, E.; Funk, C. Evaluation of Satellite Rainfall Estimates for Drought and Flood Monitoring in Mozambique. Remote Sens. 2015, 7, 1758–1776. [Google Scholar] [CrossRef]
- Yilma, A.; Awulachew, S. Characterization and Atlas of the Blue Nile Basin and Its Sub Basins; International Water Management Institute (IWMI): Colombo, Sri Lanka, 2009. [Google Scholar]
- Conway, D. The climate and hydrology of the Upper Blue Nile River. Geogr. J. 2000, 166, 49–62. [Google Scholar] [CrossRef]
- Kebede, S.; Travi, Y.; Alemayehu, T.; Marc, V. Water balance of Lake Tana and its sensitivity to fluctuations in rainfall, Blue Nile basin, Ethiopia. J. Hydrol. 2006, 316, 233–247. [Google Scholar] [CrossRef]
- Mellander, P.; Gebrehiwot, S.; Gärdenäs, A.; Bewket, W.; Bishop, K. Summer rains and dry seasons in the Upper Blue Nile Basin: the predictability of half a century of past and future spatiotemporal patterns. PLoS ONE 2013, 8, e68461. [Google Scholar] [CrossRef] [PubMed]
- Saha, S.; Moorthi, S.; Pan, H.; Wu, X.; Wang, J.; Nadiga, S.; Tripp, P.; Kistler, R.; Woollen, J.; Behringer, D. The NCEP climate forecast system reanalysis. Bull. Am. Meteorol. Soc. 2010, 1, 1–146. [Google Scholar] [CrossRef]
- Funk, C.; Peterson, P.; Landsfeld, M.; Pedreros, D.; Verdin, J.; Rowland, J.; Romero, B.; Husak, G.; Michaelsen, J.; Verdin, A.; et al. A Quasi-Global Precipitation Time Series for Drought Monitoring. Available online: pubs.usgs.gov/ds/832/ (accessed on 20 February 2017).
- Maidment, R.; Grimes, D.; Allan, R.; Tarnavsky, E.; Stringer, M.; Hewison, T.; Roebeling, R.; Black, E. The 30 year TAMSAT African Rainfall Climatology And Time series (TARCAT) data set. J. Geophys. Res. 2014. [Google Scholar] [CrossRef]
- Tarnavsky, E.; Grimes, D.; Maidment, R.; Black, E.; Allan, R.; Stringer, M.; Chadwick, R.; Kayitakire, F. Extension of the TAMSAT Satellite-based Rainfall Monitoring over Africa and from 1983 to present. J. Appl. Meteorol. Climatol. 2014. [Google Scholar] [CrossRef]
- Novella, N.; Thiaw, W. African rainfall climatology version 2 for famine early warning systems. J. Appl. Meteorol. Climatol. 2013, 52, 588–606. [Google Scholar] [CrossRef]
- Ashouri, H.; Hsu, K.; Sorooshian, S.; Braithwaite, D.; Knapp, K.; Cecil, L.; Nelson, B.; Prat, O. PERSIANN-CDR: Daily Precipitation Climate Data Record from Multisatellite Observations for Hydrological and Climate Studies. Bull. Am. Meteorol. Soc. 2015, 96, 69–83. [Google Scholar] [CrossRef]
- Hsu, K.; Gao, X.; Sorooshian, S.; Gupta, H. Precipitation Estimation from Remotely Sensed Information Using Artificial Neural Networks. J. Appl. Meteorol. 1997, 36, 1176–1190. [Google Scholar] [CrossRef]
- Hsu, K.; Gupta, H.; Gao, X.; Sorooshian, S. Estimation of Physical Variables from Multiple Channel Remotely Sensed Imagery Using a Neural Network: Application to Rainfall Estimation. Water Resour. Res. 1999, 35, 1605–1618. [Google Scholar] [CrossRef]
- Hsu, K.; Gupta, H.; Gao, X.; Sorooshian, S. Rainfall Estimation from Satellite Imagery. In Artificial Neural Networks in Hydrology; Govindaraju, R.S., Rao, A.R., Eds.; Kluwer Academic Publishers: Dordrecht, The Netherlands, 2000; Chapter 11; pp. 209–234. [Google Scholar]
- Sorooshian, S.; Gao, X.; Hsu, K.; Maddox, R.; Hong, Y.; Imam, B.; Gupta, H. Diurnal Variability of Tropical Rainfall Retrived from Combined GOES and TRMM Satellite Information. J. Clim. 2002, 15, 983–1001. [Google Scholar] [CrossRef]
- Sorooshian, S.; Nguyen, P.; Sellars, S.; Braithwaite, D.; AghaKouchak, A.; Hsu, K. Satellite-Based Remote Sensing Estimation of Precipitation for Early Warning Systems, Extreme Natural Hazards, Disaster Risks and Societal Implications; Ismail-Zadeh, A., Fucugauchi, J.U., Kijko, A., Takeuchi, K., Zaliapin, I., Eds.; Cambridge University Press: Cambridge, UK, 2014; pp. 99–111. [Google Scholar]
- Huffman, G.; Bolvin, D. TRMM and Other Data Precipitation Data Set Documentation. 2013. Available online: ftp://meso-a.gsfc.nasa.gov/pub/trmmdocs/3B42_3B43_doc.pdf (accessed on 18 February 2017).
- McKee, T.; Doesken, N.; Kleist, J. The relationship of drought frequency and duration to time scales. In Proceedings of the 8th Conference of Applied Climatology, Anaheim, CA, USA, 17–22 January 1993; Meterological Society: Boston, MA, USA; pp. 179–184. [Google Scholar]
- Khadr, M. Temporal and spatial analysis of meteorological drought characteristics in the upper Blue Nile river region. Hydrol. Res. 2017, 48, 265–276. [Google Scholar] [CrossRef]


| Satellite Rainfall Product | Temporal Coverage | Spatial Resolution | Temporal Resolution |
|---|---|---|---|
| CHIRPS Version 2.0 1 | 1981–present | 0.05 (~5 km) | Daily |
| TARCAT Version 2.0 2 | 1983–present | 0.0375° (~4 km) | Dekadal |
| ARC Version 2.0 3 | 1983–present | 0.1° (~10 km) | Daily |
| PERSIANN-CDR 4 | 1983–present | 0.25° (~27 km) | Daily |
| TMPA 3B42 Version 7.0 5 | 1998–present | 0.25° (~27 km) | 3-hourly |
| SPI Values | Drought Category |
|---|---|
| −2.00 and less | Extreme drought |
| −1.50 to −1.99 | Severe drought |
| −1.00 to −1.49 | Moderate drought |
| 0 to −0.99 | Near normal or mild drought |
| Above 0 | No drought |
| Data Set | r | ME | Bias | RMSE |
|---|---|---|---|---|
| CHIRPS | 0.79 | −27.93 | 0.88 | 93.27 |
| PERSIANN | 0.64 | −95.21 | 0.59 | 145.05 |
| TARCAT | 0.73 | −73.04 | 0.69 | 122.79 |
| TMPA | 0.71 | −34.34 | 0.85 | 108.61 |
| ARC | 0.73 | −91.52 | 0.61 | 134.77 |
© 2017 by the authors. Licensee MDPI, Basel, Switzerland. This article is an open access article distributed under the terms and conditions of the Creative Commons Attribution (CC BY) license (http://creativecommons.org/licenses/by/4.0/).
Share and Cite
Bayissa, Y.; Tadesse, T.; Demisse, G.; Shiferaw, A. Evaluation of Satellite-Based Rainfall Estimates and Application to Monitor Meteorological Drought for the Upper Blue Nile Basin, Ethiopia. Remote Sens. 2017, 9, 669. https://doi.org/10.3390/rs9070669
Bayissa Y, Tadesse T, Demisse G, Shiferaw A. Evaluation of Satellite-Based Rainfall Estimates and Application to Monitor Meteorological Drought for the Upper Blue Nile Basin, Ethiopia. Remote Sensing. 2017; 9(7):669. https://doi.org/10.3390/rs9070669
Chicago/Turabian StyleBayissa, Yared, Tsegaye Tadesse, Getachew Demisse, and Andualem Shiferaw. 2017. "Evaluation of Satellite-Based Rainfall Estimates and Application to Monitor Meteorological Drought for the Upper Blue Nile Basin, Ethiopia" Remote Sensing 9, no. 7: 669. https://doi.org/10.3390/rs9070669