Parallel Seasonal Patterns of Photosynthesis, Fluorescence, and Reflectance Indices in Boreal Trees

1
Department of Biological Sciences, University of Alberta, Edmonton, AB T6G 2E9, Canada
2
Department of Earth and Atmospheric Sciences, University of Alberta, Edmonton, AB T6G 2E3, Canada
3
School of Natural Resources, University of Nebraska, Lincoln, NE 68583, USA
*
Authors to whom correspondence should be addressed.
Remote Sens. 2017, 9(7), 691; https://doi.org/10.3390/rs9070691
Submission received: 19 May 2017
/
Revised: 28 June 2017
/
Accepted: 30 June 2017
/
Published: 5 July 2017
(This article belongs to the Special Issue Remote Sensing of Vegetation Fluorescence and Photosynthetic Efficiency)
Abstract
:Tree species in the boreal forest cycle between periods of active growth and dormancy alter their photosynthetic processes in response to changing environmental conditions. For deciduous species, these changes are readily visible, while evergreen species have subtler foliar changes during seasonal transitions. In this study, we used remotely sensed optical indices to observe seasonal changes in photosynthetic activity, or photosynthetic phenology, of six boreal tree species. We evaluated the normalized difference vegetation index (NDVI), the photochemical reflectance index (PRI), the chlorophyll/carotenoid index (CCI), and steady-state chlorophyll fluorescence (FS) as a measure of solar-induced fluorescence (SIF), and compared these optical metrics to gas exchange to determine their efficacy in detecting seasonal changes in plant photosynthetic activity. The NDVI and PRI exhibited complementary responses. The NDVI paralleled photosynthetic phenology in deciduous species, but not in evergreens. The PRI closely paralleled photosynthetic activity in evergreens, but less so in deciduous species. The CCI and FS tracked photosynthetic phenology in both deciduous and evergreen species. The seasonal patterns of optical metrics and photosynthetic activity revealed subtle differences across and within functional groups. With the CCI and fluorescence becoming available from satellite sensors, they offer new opportunities for assessing photosynthetic phenology, particularly for evergreen species, which have been difficult to assess with previous methods.
Keywords:
boreal; phenology; photosynthesis; chlorophyll fluorescence; NDVI; PRI; CCI; SIF; winter downregulation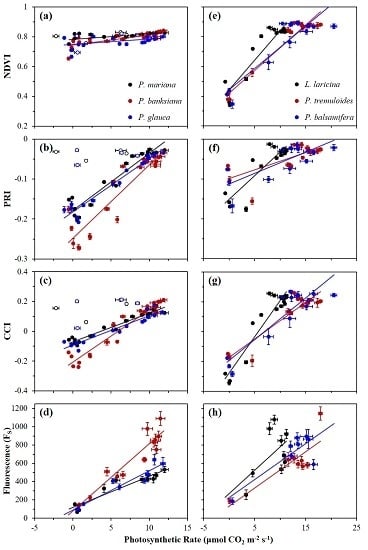
1. Introduction
Forests cover approximately 4 billion hectares of the earth’s land surface [1]; the circumpolar boreal forest accounts for approximately one-quarter (1132 million hectares) of that total [2]. The boreal region, known to be a substantial store of carbon [3], is experiencing a significant change in climate. The combined effects of increasing atmospheric carbon dioxide (CO2) levels and increasing temperatures associated with climate change will impact a number of plant processes [4], and these effects are amplified at higher latitudes. These changes in climate are expected to impact growing-season length, and directly influence phenology by altering the timing of seasonal transitions that are defined by changing temperatures and photoperiod [5].
In boreal forests, tree species cycle between periods of active growth and dormancy in response to a changing temperature and day-length [5]. Different vegetation types utilize contrasting mechanisms to deal with extreme seasonal variation. For deciduous species, the onset of dormancy is easily observed by changing of leaf coloring and leaf senescence, while spring activation is marked by budburst and greening of canopies. Evergreens, however, have subtler changes in foliage during seasonal transitions. To maintain their leaves going into dormancy and to avoid winter damage, needles undergo a cold hardening [6], which involves the adjustment of leaf pigments pools, primarily carotenoids and chlorophylls, in order to dissipate excess light energy during dormancy. These adjustments are then reversed leading into the growing season [7].
In addition to these seasonal changes, plants regulate photosynthetic processes in response to changing environmental conditions on shorter timescales. Under favorable conditions, light absorbed by chlorophyll is used to drive photosynthesis through photochemistry [8]. Under stress, plants have several mechanisms to dissipate excess light energy in the form of heat, known as non-photochemical quenching (NPQ) [9]. One method of dissipation is through the xanthophyll cycle, the interconversion of three carotenoid pigments to distribute absorbed light energy between productive photochemistry and non-destructive energy dissipation [9]. A small fraction of absorbed light can also be dissipated through re-emission as chlorophyll fluorescence at a longer wavelength than what is absorbed [8]. Fluorescence is driven by the amount of absorbed photosynthetically active radiation (APAR), but is also modified by NPQ [10].
Chlorophyll fluorescence acts rapidly, dissipating energy within nanoseconds in response to changing light, and adjusting to steady-state levels over minutes [11], whereas the xanthophyll cycle acts on timescales from minutes to hours [12]. Pigment pool sizes and foliage structure adjust on longer timescales, from hours to seasons [13,14,15]. Together, these mechanisms of energy regulation provide several possible ways of assessing changing photosynthetic activity through optical remote sensing.
The normalized difference vegetation index (NDVI) is often used to track changing vegetation “greenness” as a surrogate for photosynthetic activity, and has been shown to track long-term changes in growing-season length and productivity in high latitudes [16]. In deciduous vegetation, the NDVI tracks seasonal phenology of green biomass, from budburst to senescence [17]. The NDVI utilizes reflectance in red and near-infrared wavelengths to estimate the fraction of photosynthetically active radiation (fPAR) that is absorbed by green plant material [18]. Though the NDVI can detect structural changes, such as the leaf area index and fPAR [17,18], it misses less visible changes in physiological processes controlling photosynthetic activity, particularly in evergreen species [15,19] that see little change in greenness from spring budburst through the growing season and into winter dormancy [20].
The photochemical reflectance index (PRI), on the other hand, detects subtle changes in regulatory processes related to photosynthetic activity [21]. The PRI can detect pigment responses to environmental cues, primarily in evergreen species, that the NDVI can miss [13]. Over diurnal time-scales, PRI responses are driven by changes in the xanthophyll cycle, a facultative response, while responses over seasonal timescales reflect changes in pigment pool size (carotenoid/chlorophyll ratios), a constitutive response [22]. This index utilizes reflectance in the 531 nm waveband, compared to 570 nm as a reference waveband [23]. A variety of other wavebands have been used to calculate the PRI. Some sensors provide the PRI using the 532 nm instead of the 531 nm waveband; this formulation is functionally similar to the PRI calculated using the original 531 nm waveband, and detects both facultative and constitutive responses depending upon the sampling period [19]. On the other hand, a number of studies report other PRI formulas using different reference wavebands (e.g., Moderate Resolution Imaging Spectroradiometer PRI: MODIS PRI) [24,25], which primarily detect pigment pool size variation when applied over seasonal timescales or across canopies [19]. Thus, the proper interpretation of the PRI can depend upon the formula and sampling scale used.
The chlorophyll/carotenoid index (CCI) provides another indicator of photosynthetic activity, particularly in evergreens. Like the PRI, this index is sensitive to changes in pigment pools at both stand- and leaf-levels, and can accurately track seasonally changing chlorophyll/carotenoid levels indicating an important role of carotenoid pigments in winter downregulation [15]. The CCI can be applied over larger spatial scales using satellites, and can be derived from NASA’s satellite-based MODIS sensor using bands 1 (645 nm, a terrestrial band) and 11 (531 nm, an ocean band). Unlike the xanthophyll cycle, which affects a narrow waveband, pigment pool size changes detectable with the CCI have a broad spectral response [15]. While the CCI has been shown to be a potent index of seasonal photosynthetic activity at leaf- and canopy-scales for evergreens [15], similar studies on deciduous species have not yet been reported.
Chlorophyll fluorescence can also provide information on photosynthetic performance [26], and can reflect changing photosynthetic activity driven by both internal and external factors. Chlorophyll fluorescence has often been measured using the pulse-amplitude modulation (PAM) technique, which is restricted to the leaf-level due to the requirement of a saturating pulse [10]. With high-spectral resolution spectrometers that can resolve atmospheric absorption bands (Fraunhofer lines), fluorescence can now be passively detected from a distance as a small signal present in the “gaps” of the solar spectrum [27]). This solar-induced fluorescence (SIF) is closely linked to gross primary productivity (GPP) [28,29,30], however, the coarse spatial and temporal scales of many satellite-based SIF measurements cannot resolve detailed seasonal dynamics or explain underlying mechanisms driving changes in GPP. At leaf-scales, the PAM method can measure steady-state chlorophyll fluorescence (FS) without delivering a saturating pulse of light, which is an analogous measurement to SIF measured at large scales, as both can be measured under ambient illumination, allowing for more mechanistic studies of individual leaves and canopies.
Together, the NDVI and PRI can provide complementary information in estimating the two main terms in the light-use efficiency (LUE) model [31] (Figure 1). This model expresses GPP as a function of APAR, and the efficiency (ε) of converting absorbed radiation into fixed carbon [18,32]. APAR is the product of photosynthetically active radiation (PAR) or photosynthetic photon flux density (PPFD) and the fraction of PAR that is absorbed for photosynthesis (fPAR). The NDVI can be used to estimate light absorption as fPAR [32], whereas the PRI can be used to estimate ε [33]. The precise role of the CCI in the LUE model is still unclear, although it is similar to the PRI in that it is sensitive to changing pigment pool size [15]. Like SIF, the CCI may be sensitive to both APAR and ε, and is therefore a direct indicator of GPP [15,31].
Recent reviews [31,34] have proposed that different vegetation, or optical types, have contrasting structural and physiological controls influencing productivity and optical signatures, which leads to varying relationships between the NDVI, PRI and GPP across ecosystems; we describe this as the “complementarity hypothesis”. Accordingly, photosynthetic phenology of deciduous vegetation should relate to fPAR, and be strongly detectable by the NDVI, whereas the NDVI of evergreens, with little temporal variation in fPAR, should relate poorly to primary productivity. Conversely, deciduous vegetation should have little seasonal variation in ε detectable by the PRI, whereas changes in ε in evergreens should be largely driven by changing pigment pool sizes [13,14,19], leading to strong relationships between the PRI and primary productivity. As a newly defined index, the CCI has not previously been considered in the complementarity hypothesis [15]. We predict that, on seasonal timescales, the CCI will be similar to SIF, sensitive to both canopy structure-influencing absorbed radiation (APAR) and photosynthetic downregulation [10]. Both metrics should be indicators of GPP in both deciduous and evergreen vegetation (Figure 1).
Further understanding of the mechanisms underlying reflectance indices and fluorescence in different vegetation types and natural environments is essential to the proposed FLuorescence EXplorer (FLEX) mission, which will enable both reflectance indices and SIF to assess photosynthetic phenology from satellites [35]. This mission will provide insight into ecosystem phenology and productivity beyond that of satellite missions providing reflectance (MODIS) or SIF (e.g., Orbiting Carbon Observatory-2: OCO-2) by allowing concurrent measurements of reflectance indices and SIF at finer scales. In support of this mission, ground-based studies are needed to clarify the utility of both reflectance indices and fluorescence as indicators of photosynthesis for different vegetation types.
The goals of this study were to evaluate the efficacy of reflectance indices (NDVI, PRI, and CCI) and fluorescence (FS) in tracking photosynthetic phenology, by comparing the responses of these metrics in boreal trees that undergo large seasonal swings in photosynthetic activity. We also evaluated the complementarity hypothesis by considering the efficacy of these metrics in estimating photosynthetic activity in evergreen and deciduous species. We demonstrate that reflectance indices and fluorescence can be used to as indicators of photosynthetic phenology, showing parallel seasonal patterns to photosynthetic activity, but with noticeable differences across and within these functionally different vegetation types.
2. Materials and Methods
Six different tree species were grown on the rooftop of the Biological Sciences Building at the University of Alberta, Canada (53.528861, −113.525972), and were exposed to a seasonally changing boreal climate. The trees used for this study included three winter deciduous species—trembling aspen (Populus tremuloides) and balsam poplar (Populus balsamifera) as broad-leaf species, and tamarack (Larix laricina), a deciduous conifer—and three evergreen species: black spruce (Picea mariana), white spruce (Picea glauca), and jack pine (Pinus banksiana). Trees were potted in deep pots and arranged in monocultural plots in the spring of 2015.
The trees were potted in 2.83 L pots (TP414, Stuewe & Sons, Tangent, OR, USA) in the spring of 2015. One-year-old seedlings of each species, except white spruce seedlings, which were 2 years old, were planted in a mixture of 3:1 potting soil (Sunshine Mix 4, Sun Gro Horticulture, Agawam, MA, USA) and topsoil. The mix was supplemented with a slow-release fertilizer (Nutricote 14-14-14, Sun Gro Horticulture, Agawam, MA, USA), at ca. 150 g per 60 L of soil. To help the trees overwinter in the first year, plants were placed in 1.2 m × 1.2 m plywood frames. The trees were repotted into 6.23 L pots (TP616, Stuewe & Sons, Tangent, OR, USA) in April 2016, to allow for adequate moisture and nutrient availability, avoid potential root restriction, and provide greater spacing of the plants. To provide insulation during the winter, the tree-pots were surrounded by small pots of peat. During the 2015 growing season, the trees were watered daily and fertilized periodically with a 400 ppm mixture of 20-20-20 fertilizer. In June 2016, the plants were fertilized with a 200 ppm mixture of 20-20-20 fertilizer to provide additional nutrients for the growing season.
Data were collected from December 2015 to January 2017, covering a full yearly growth cycle. Measurements were taken approximately every 2 weeks (weather permitting) between 12:30 and 14:30 UTC-06 (within ~1 h of solar noon); to ensure maximal sunlight and reduce potential cloud-cover impacts, data were collected on mostly sunny days. When all data could not be collected on a single day, due to the small window for sampling around solar noon, sampling occurred on sequential days under near-identical conditions.
An automated weather station provided air temperature (S-THB-M002, Onset, Bourne, MA, USA) and PPFD (S-LIA-M003, Onset, Bourne, MA, USA) data, collected every minute on a data logger (U30-NRC, Onset, Bourne, MA, USA). Temperature and PPFD were aggregated into 15 min averages. PPFD was expressed as midday averages (13:00–14:00; UTC-06) and temperature was expressed as daily averages. Daily average temperature expressed as 30-year climate normals (1981–2010) by month were obtained from the Edmonton City Centre A Climate Normals Station (Climate ID 301228) [36].
Canopy-level reflectance measurements were collected using a dual-detector field spectrometer (UniSpec-DC; PP Systems, Amesbury, MA, USA) equipped with two fibre-optics. A downward-looking fibre (UNI684; PP Systems), fitted with a field-of-view restrictor (UNI688; PP Systems) to limit the field of view to ca. 15°, measured target reflectance, while an upward-facing fibre (UNI686; PP Systems), attached to a cosine receptor (UNI435; PP Systems), detected incoming irradiance. Five measurements were taken at different locations above each monoculture and mixed plot (center, NW, NE, SW, and SE) ca. 1 m above the top of the canopy.
Canopy reflectance was calculated by referencing the downward-looking target radiance (Rλ) spectrum to the upward-looking irradiance (Iλ) spectrum. This ratio was corrected to reflectance (ρλ), by means of a cross-calibration procedure using Iλ and Rλ measurements (Rpanelλ) from a standard reference panel (Spectralon, LabSphere, North Sutton, NH, USA) under the same conditions, immediately prior to and following sampling (Equation (1)) [37].
Optical indices were then calculated using the canopy reflectance (ρλ) from each measurement. Index values were calculated utilizing 630 and 800 nm for the NDVI (Equation (2)), 532 and 570 nm for the PRI (Equation (3)), and 532 and 630 nm for the CCI (Equation (4)). The CCI was originally calculated using reflectance in MODIS bands 1 (650 nm, a terrestrial band) and 11 (530 nm, an ocean band) [15]. For this experiment, the CCI was calculated using reflectance in the 532 and 630 nm wavebands (Equation (4)).
Photosynthetic rate, expressed as net CO2 assimilation, was measured using a portable gas exchange system (LI-6400; LI-COR, Lincoln, NE, USA). Leaves, or bundles of leaves in the case of conifers, were placed inside a gas exchange chamber. The chamber monitored CO2 assimilation rates under 1500 μmol photons m−2 s−1 to determine light-saturated photosynthetic rate (Ps; μmol CO2 m−2 s−1). The reference CO2 was set to 400 μmol mol−1 to match atmospheric concentrations. The chamber air flow was set to 400 μmol s−1, with temperature and humidity set to match ambient conditions. Following a 1–3 min acclimation period after the leaf-clip was set on a plant, five measurements were taken from the five plants of each species. The photosynthetic rate of each species was determined by averaging the 25 measurements from all individuals of a given species at a single sampling interval.
Chlorophyll fluorescence was measured using a portable fluorometer (Mini-PAM; Walz, Effeltrich, Germany) fitted with a fibre-optic and leaf-clip holder (2030-B; Walz, Effeltrich, Germany). Leaves sampled were kept as close to their original orientation as possible to maintain ambient illumination during sampling; needles were bundled together in a flat plane prior to clamping to maximize the sampling area. The fluorometer recorded Fs under ambient illumination, without a saturating pulse of light, which was used as an indicator of SIF. Eighteen samples, with three leaves, or bundles of needles, measured from six individuals were taken and averaged together for each species. Fluorescence was not sampled during winter months, when low PPFD values due to low solar elevation and building shade resulted in poor fluorescence signals.
Data collected for this experiment were compared over a year to examine the seasonal course of optical indices, fluorescence, and photosynthetic activity through seasonal transitions. Data were analyzed both as time series and through regression analyses. ANCOVA were used to test differences between the slopes of the relationships of the two functional groups.
3. Results
3.1. Seasonal Environmental Conditions
Daily temperature and midday PPFD showed strong seasonal changes typical of boreal regions (Figure 2). During the spring transition, temperatures ranged from ~0 °C in February and March, to >20 °C by April. Midday temperatures typically exceeded 20 °C in summer months, from May to August. It was an unusually warm year, and warm weather (>15 °C) persisted throughout September, with midday temperatures rarely below 0 °C until mid-November. Midday temperatures in winter months were typically around −8 °C, with extreme cold periods having midday temperatures of around −20 °C, as in early December. Summer midday PPFD values often exceeded 1500 μmol m−2 s−1, while the spring and fall experienced clear-day PPFD values of around 1000 μmol m−2 s−1 prior to, and following, the spring and fall equinoxes, respectively. The study site microclimate was warmer than the long-term average (Figure 2), in part because it was a warm year, but also due to the additional thermal mass of the building.
3.2. Seasonal Patterns of Photosynthesis and Remote Metrics
Photosynthetic activity, fluorescence, and reflectance indices often exhibited parallel responses to seasonally changing environmental conditions. However, indices showed subtle differences from each other that indicated variation in their ability to track photosynthetic phenology. Key differences in optical behavior emerged between evergreen and deciduous species, and further interspecific differences were also evident between some species within each group.
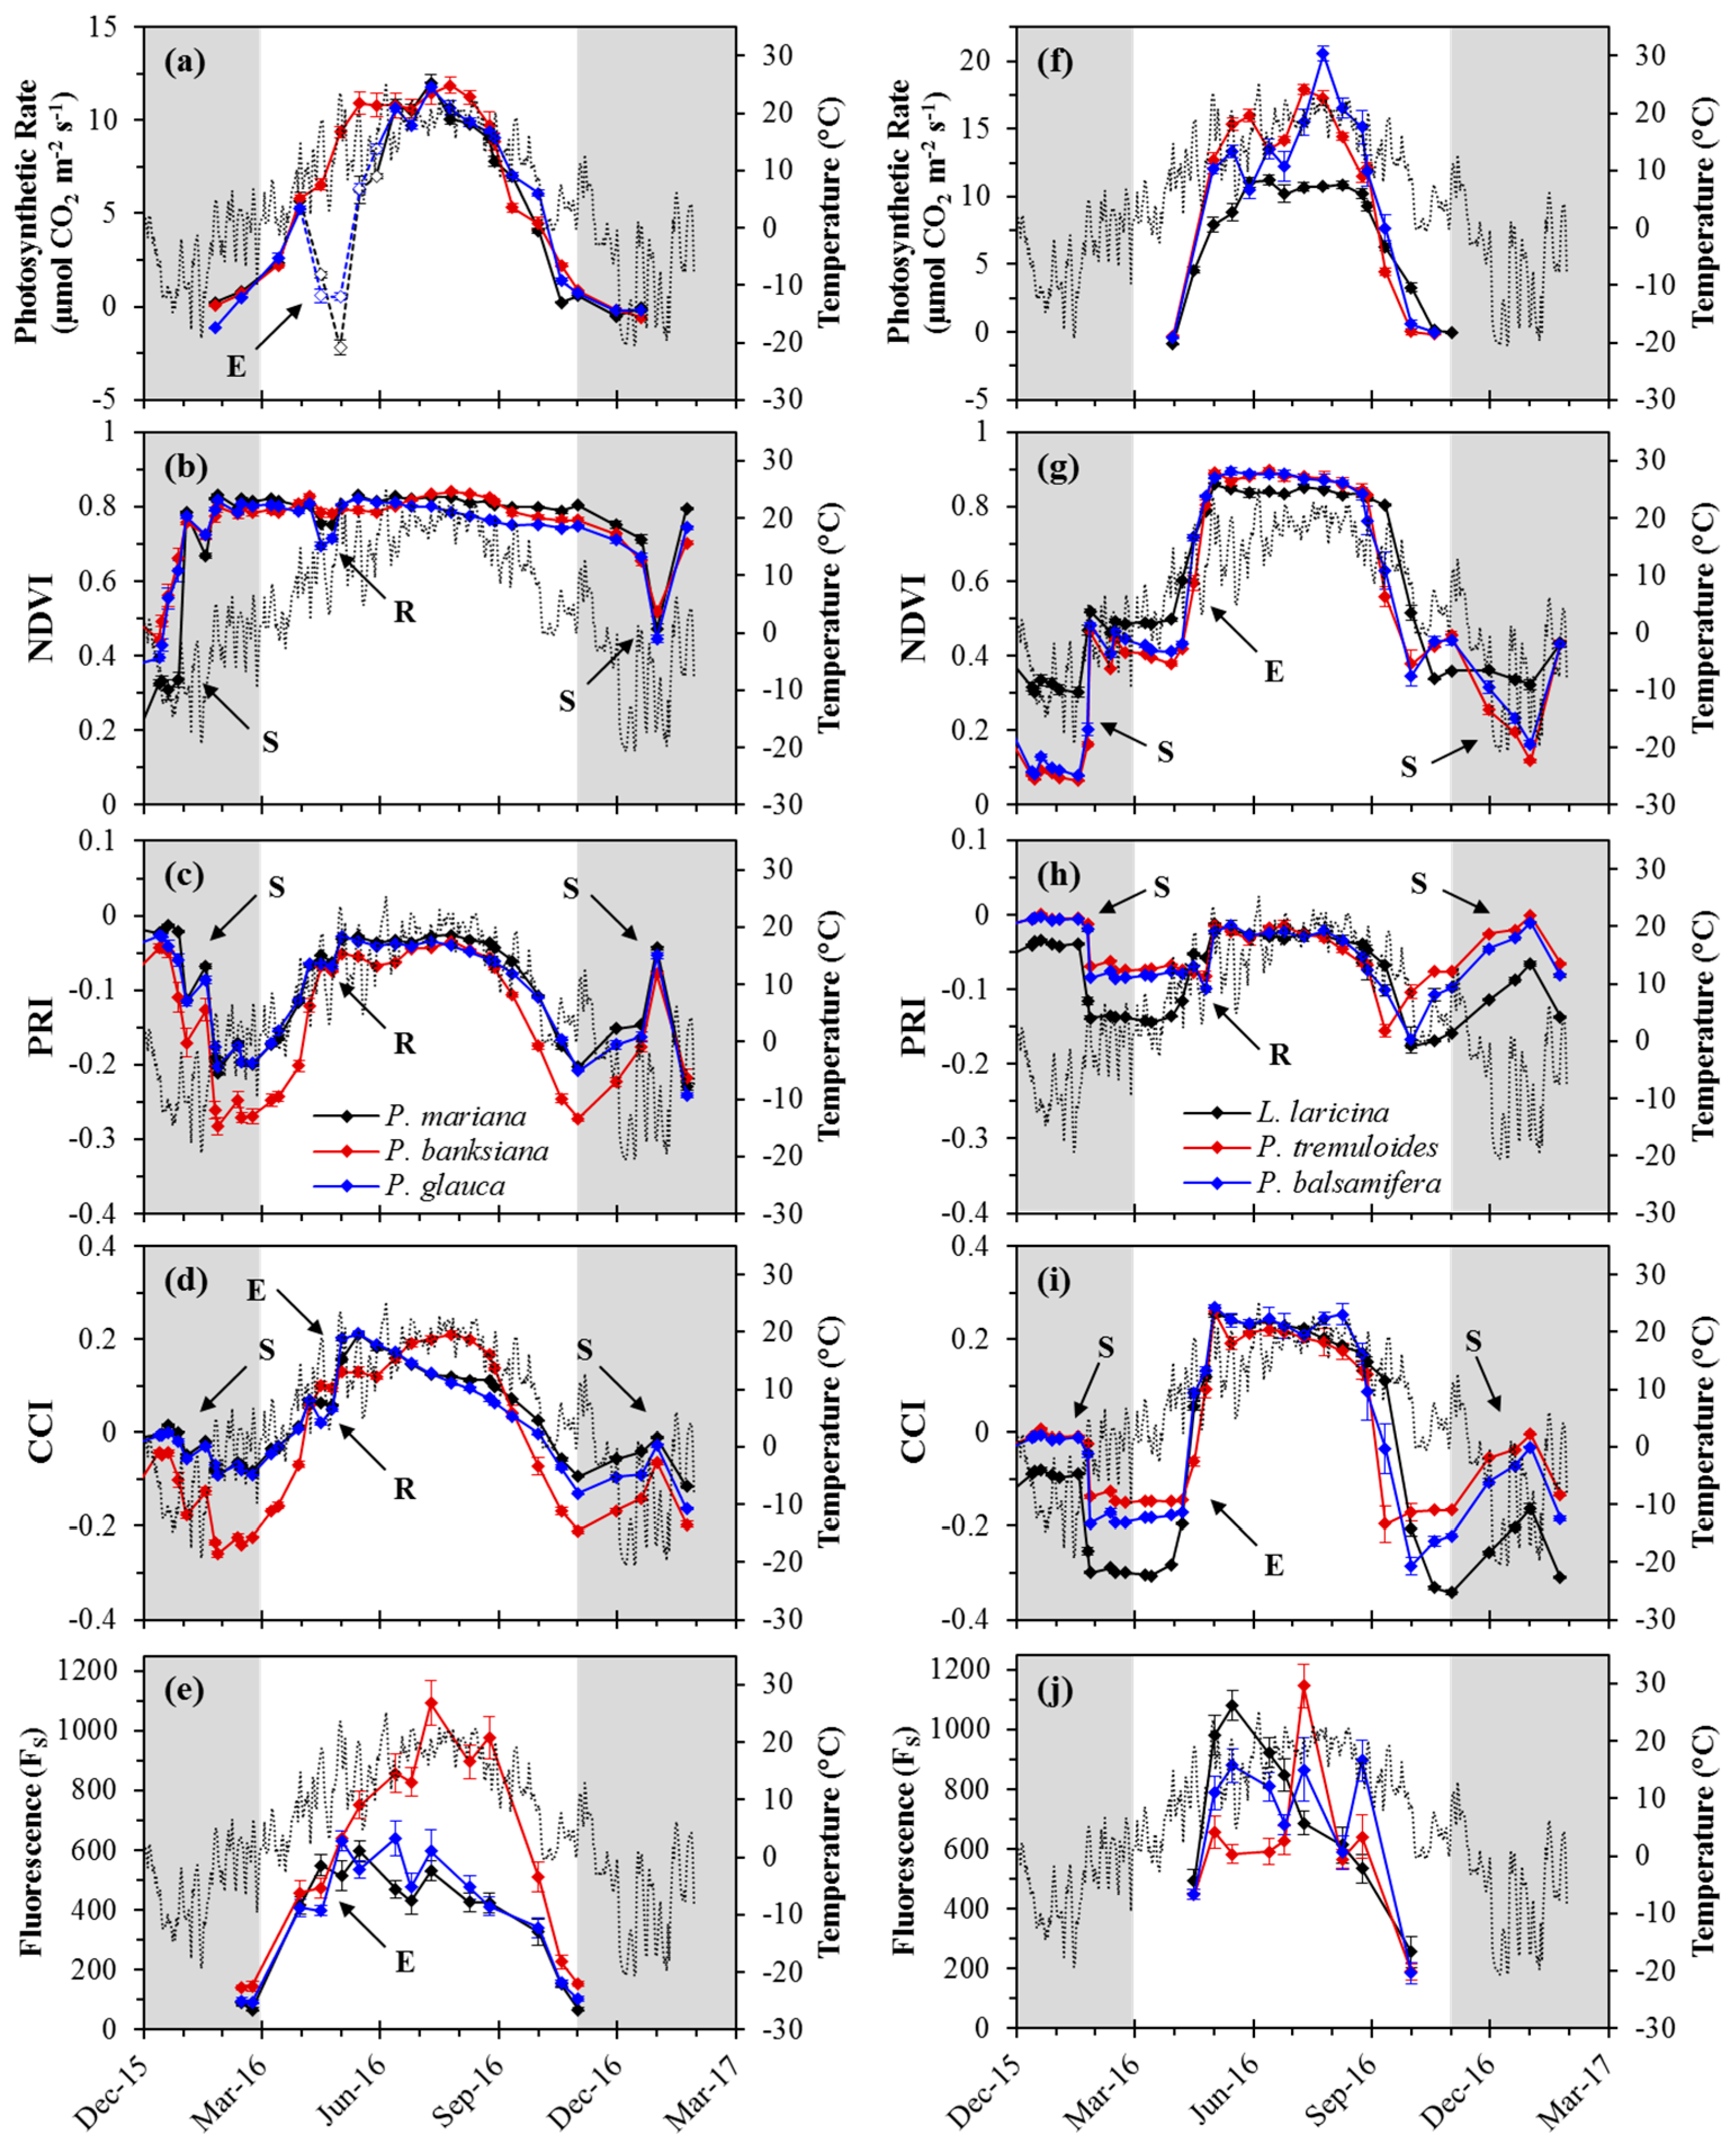
Photosynthetic rate and most optical metrics followed similar seasonal patterns as temperature for both evergreen (Figure 3a–e) and deciduous (Figure 3f–j) species. Rapid changes in canopy index values in the winter months for deciduous and evergreen species coincided with the presence of snow on the canopies. Deciduous species showed rapid changes in both photosynthesis and optical indices during transitions, while more gradual seasonal transitions were observed in evergreen species for both optical metrics and gas exchange. For deciduous species, leaf-level sampling methods were limited to periods when fully formed foliage was present, and canopy-level optical sampling was influenced by bare soil and remaining stems in the absence of foliage. Small dips in index values in April, during the spring transition, were related to the repotting and increased spacing of trees.
In evergreens, photosynthetic rate responded gradually to seasonally changing temperature (Figure 3a). Spring activation began in March, with photosynthetic rates increasing to summer maxima (ca. 10 μmol CO2 m−2 s−1) by mid-June. During the spring transition, a large drop in photosynthetic rate was observed for the spruce species (P. mariana and P. glauca) that coincided with the sampling of newly emerged branches following budburst (also indicated by open symbols; Figure 3a); this drop was not seen in P. banksiana as mature needles were sampled through the transition. Following the growing season, photosynthetic rate gradually decreased, reaching near-zero again by November.
Deciduous species displayed more rapid photosynthetic changes in spring and fall, during early leaf development and senescence, respectively, with winter periods lacking foliage for sampling (Figure 3f). For the broad-leaf deciduous species, the spring transition was very rapid, with sampling periods limited to before budburst and following early leaf expansion. L. laricina showed more gradual spring activation than the broad-leaf deciduous species. Maximum photosynthetic rates varied greatly during the growing season for broad-leaf species, but were regularly above 10 μmol CO2 m−2 s−1 until the start of the fall transition, while L. laricina had more consistent photosynthetic rates (ca. 10 μmol CO2 m−2 s−1) during the growing season. During the fall transition, photosynthetic rates for broad-leaf species decreased more quickly than for L. laricina, with near-zero rates by the end of September and mid-October, respectively.
For evergreens, except for declines during periods of snow, the NDVI was relatively constant through the year (ca. 0.8), but dropped slightly in spring during a brief period of decreased tree density following repotting (Figure 3b). For deciduous species, canopy-level NDVI values increased abruptly in spring and decreased abruptly in the fall (Figure 3g). Maximum values of the NDVI (ca. 0.85) were seen in the early summer, when trees were flush with foliage. Prior to the rapid spring transition, when trees lacked foliage and mostly bare soil was being sampled, NDVI values were approximately half (ca. 0.4) the summer maximum. Similar values were seen in late-fall following senescence, when canopies had no green foliage. Snow caused marked declines in the NDVI, and minimum values of the NDVI (ca. 0.1–0.2) occurred in the winter months when snow was present.
Seasonal patterns of the PRI varied for deciduous and evergreens species. For evergreens, seasonal PRI patterns closely followed temperature and increased gradually from winter minima (ca. −0.2: P. mariana and P. glauca; and ca. −0.27: P. banksiana) to near-growing season maxima (ca. −0.03 and ca. −0.06, respectively), following the spring transition (Figure 3c). The PRI for P. banksiana increased slightly (ca. −0.04) towards the end of the summer, prior to the fall transition. Through the fall, PRI values decreased gradually to winter minima (ca. −0.2: P. mariana and P. glauca; and ca. −0.27: P. banksiana). Over the winter period, spikes in the PRI corresponded with periods of snow.
PRI values for deciduous species had less overall variation than was seen with evergreens (Figure 3h), but still showed indications of seasonal changes associated with spring leaf development and fall senescence. Prior to the growing season, PRI values were slightly higher for the broad-leaf deciduous species (ca. −0.8) compared to L. laricina (ca. −0.14). Following the spring transition, PRI values increased sharply to maximum growing season values (ca. −0.03). The fall senescence period saw a gradual decrease in the PRI. During leaf senescence, when leaves visibly yellowed, values slightly dropped below those prior to the spring transition (ca. −0.16), then increased slightly after leaf-fall.
For evergreens, the CCI showed strong seasonal variation that roughly coincided with changes in temperature (Figure 3d). Winter values of the CCI were lower for P. banksiana (ca. −0.25) than the spruce species (ca. −0.1), and P. banksiana trees were visibly stressed during this period, showing a red-yellow needle coloring. During the spring transition, the CCI increased sharply for all evergreen species. The maximum CCI occurred in early summer for P. mariana and P. glauca (ca. 0.2), which coincided with the later stages of budburst, when new branches were nearly fully elongated and developed. The maximum CCI for P. banksiana (ca. 0.2) was seen later in the summer, during a period when needles were elongating following vertical shoot growth. The CCI gradually decreased during the fall transition for both spruce species. This decrease was more rapid for P. banksiana than for P. mariana and P. glauca. Abrupt increases in the CCI seen in the winter months coincided with periods of snow cover.
For deciduous species, the CCI also showed strong seasonal variation (Figure 3i), but spring and fall transitions were much more abrupt than in evergreens. Overwinter values of the CCI were higher for broad-leaf deciduous species (ca. −0.18) compared to L. laricina (ca. −0.3). The spring transition showed a sharp and rapid increase in the CCI from overwinter values to maximum growing season values (ca. 0.24) in early summer. This increase began earlier for L. laricina than for P. tremuloides and P. balsamifera due to the earlier budburst for L. laricina. CCI values gradually declined slightly during the middle of the growing season, which was followed by a rapid decrease during fall senescence. This decrease occurred later for L. laricina, coinciding with a later onset of senescence. Increases in the CCI during winter also coincided with the presence of snow.
In evergreens, seasonal patterns in FS roughly paralleled temperature changes (Figure 3e). FS values increased during the spring transition to maximum values during the growing season, before declining during the fall. Like the CCI, maximum values of FS for P. glauca and P. mariana were observed early in the growing season, corresponding to a period of new branch development following budburst. While P. banksiana had a similar spring transition period, FS values continued to increase until peaking near the end of the growing season, when new needles expanded following shoot elongation. Following the growing season maximum, FS values dropped rapidly as leaves senesced.
For deciduous species, FS roughly paralleled seasonal temperature changes (Figure 3j), but less closely than in evergreens. Patterns in FS varied across species during the growing season. However, similar patterns were seen across species immediately following budburst, when FS values all increased, and during the fall transition, when FS declined during a period of visible chlorophyll loss. FS for L. laricina was highest following budburst, and gradually decreased through the season until the end of senescence; this early season spike occurred when preformed needles were sampled from new buds during the spring transition. For P. tremuloides, FS was relatively constant during the growing season, apart from a spike in mid-July. FS signals for P. balsamifera were highly variable throughout the growing season.
3.3. Correlations
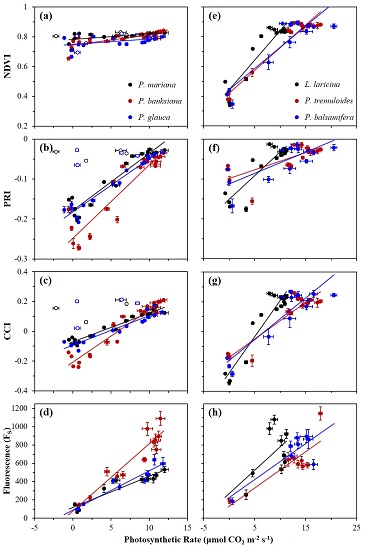
Correlations between photosynthetic activity and optical metrics, including FS and reflectance indices (NDVI, PRI, and CCI), are shown in Figure 4, and summarized in Table 1a for evergreen species, and Table 1b for deciduous species. For evergreens, P. mariana and P. glauca showed weak correlations between the NDVI and photosynthetic activity, while P. banksiana showing a moderate correlation (Figure 4a). Deciduous species showed strong correlations (Figure 4e). For evergreens, the PRI showed strong correlations with photosynthetic rate (Figure 4b), while in broad-leaf deciduous species, the PRI showed moderate correlations, and in L. laricina, a strong correlation was found (Figure 4f). Strong correlations emerged between the CCI and photosynthetic rate for all evergreen and deciduous species (Figure 4c,g). FS had strong correlations with photosynthetic rate for all evergreen species (Figure 4d), but moderate correlations were seen for broad-leaf deciduous species, and no significant correlation was seen for L. laricina (Figure 4h). The slopes of the regressions between both the NDVI and PRI and photosynthetic rate were significantly different for evergreen and deciduous species (p < 0.0001), indicating functionally distinct behavior of these indices in the two vegetation types. The regression slopes between both the CCI and FS and photosynthetic rate in evergreen and deciduous species were not significantly different (p > 0.05).
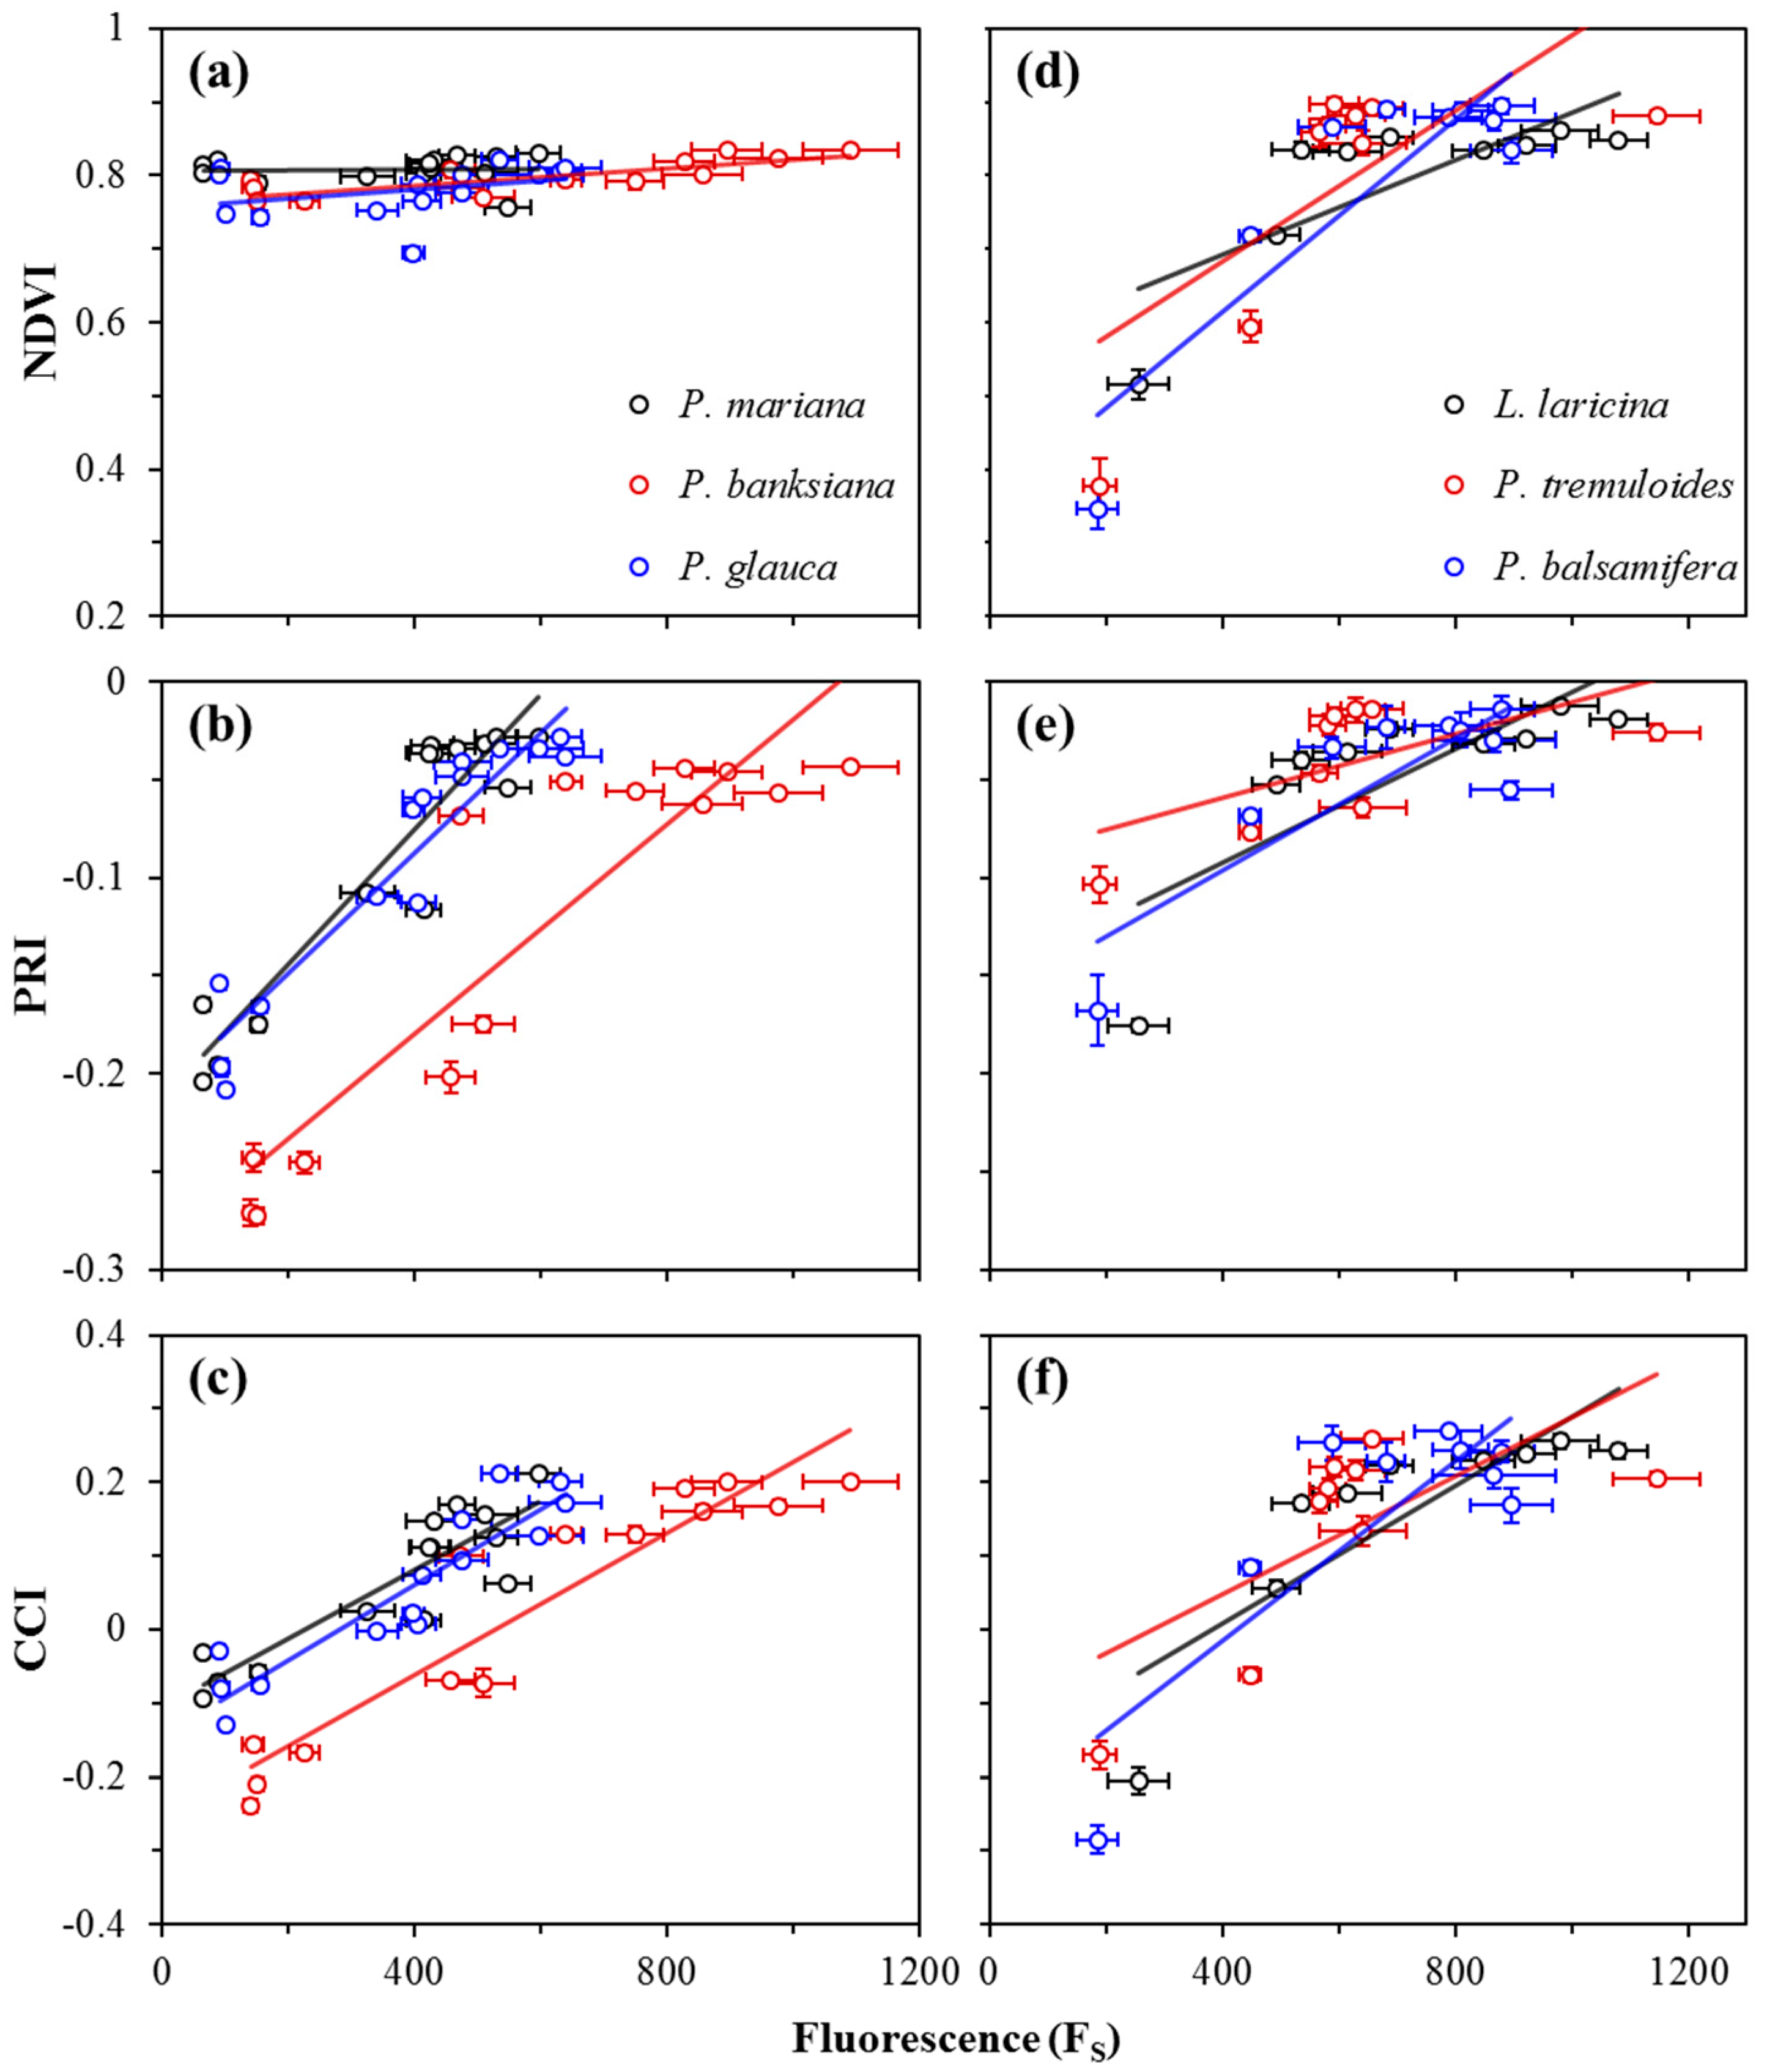
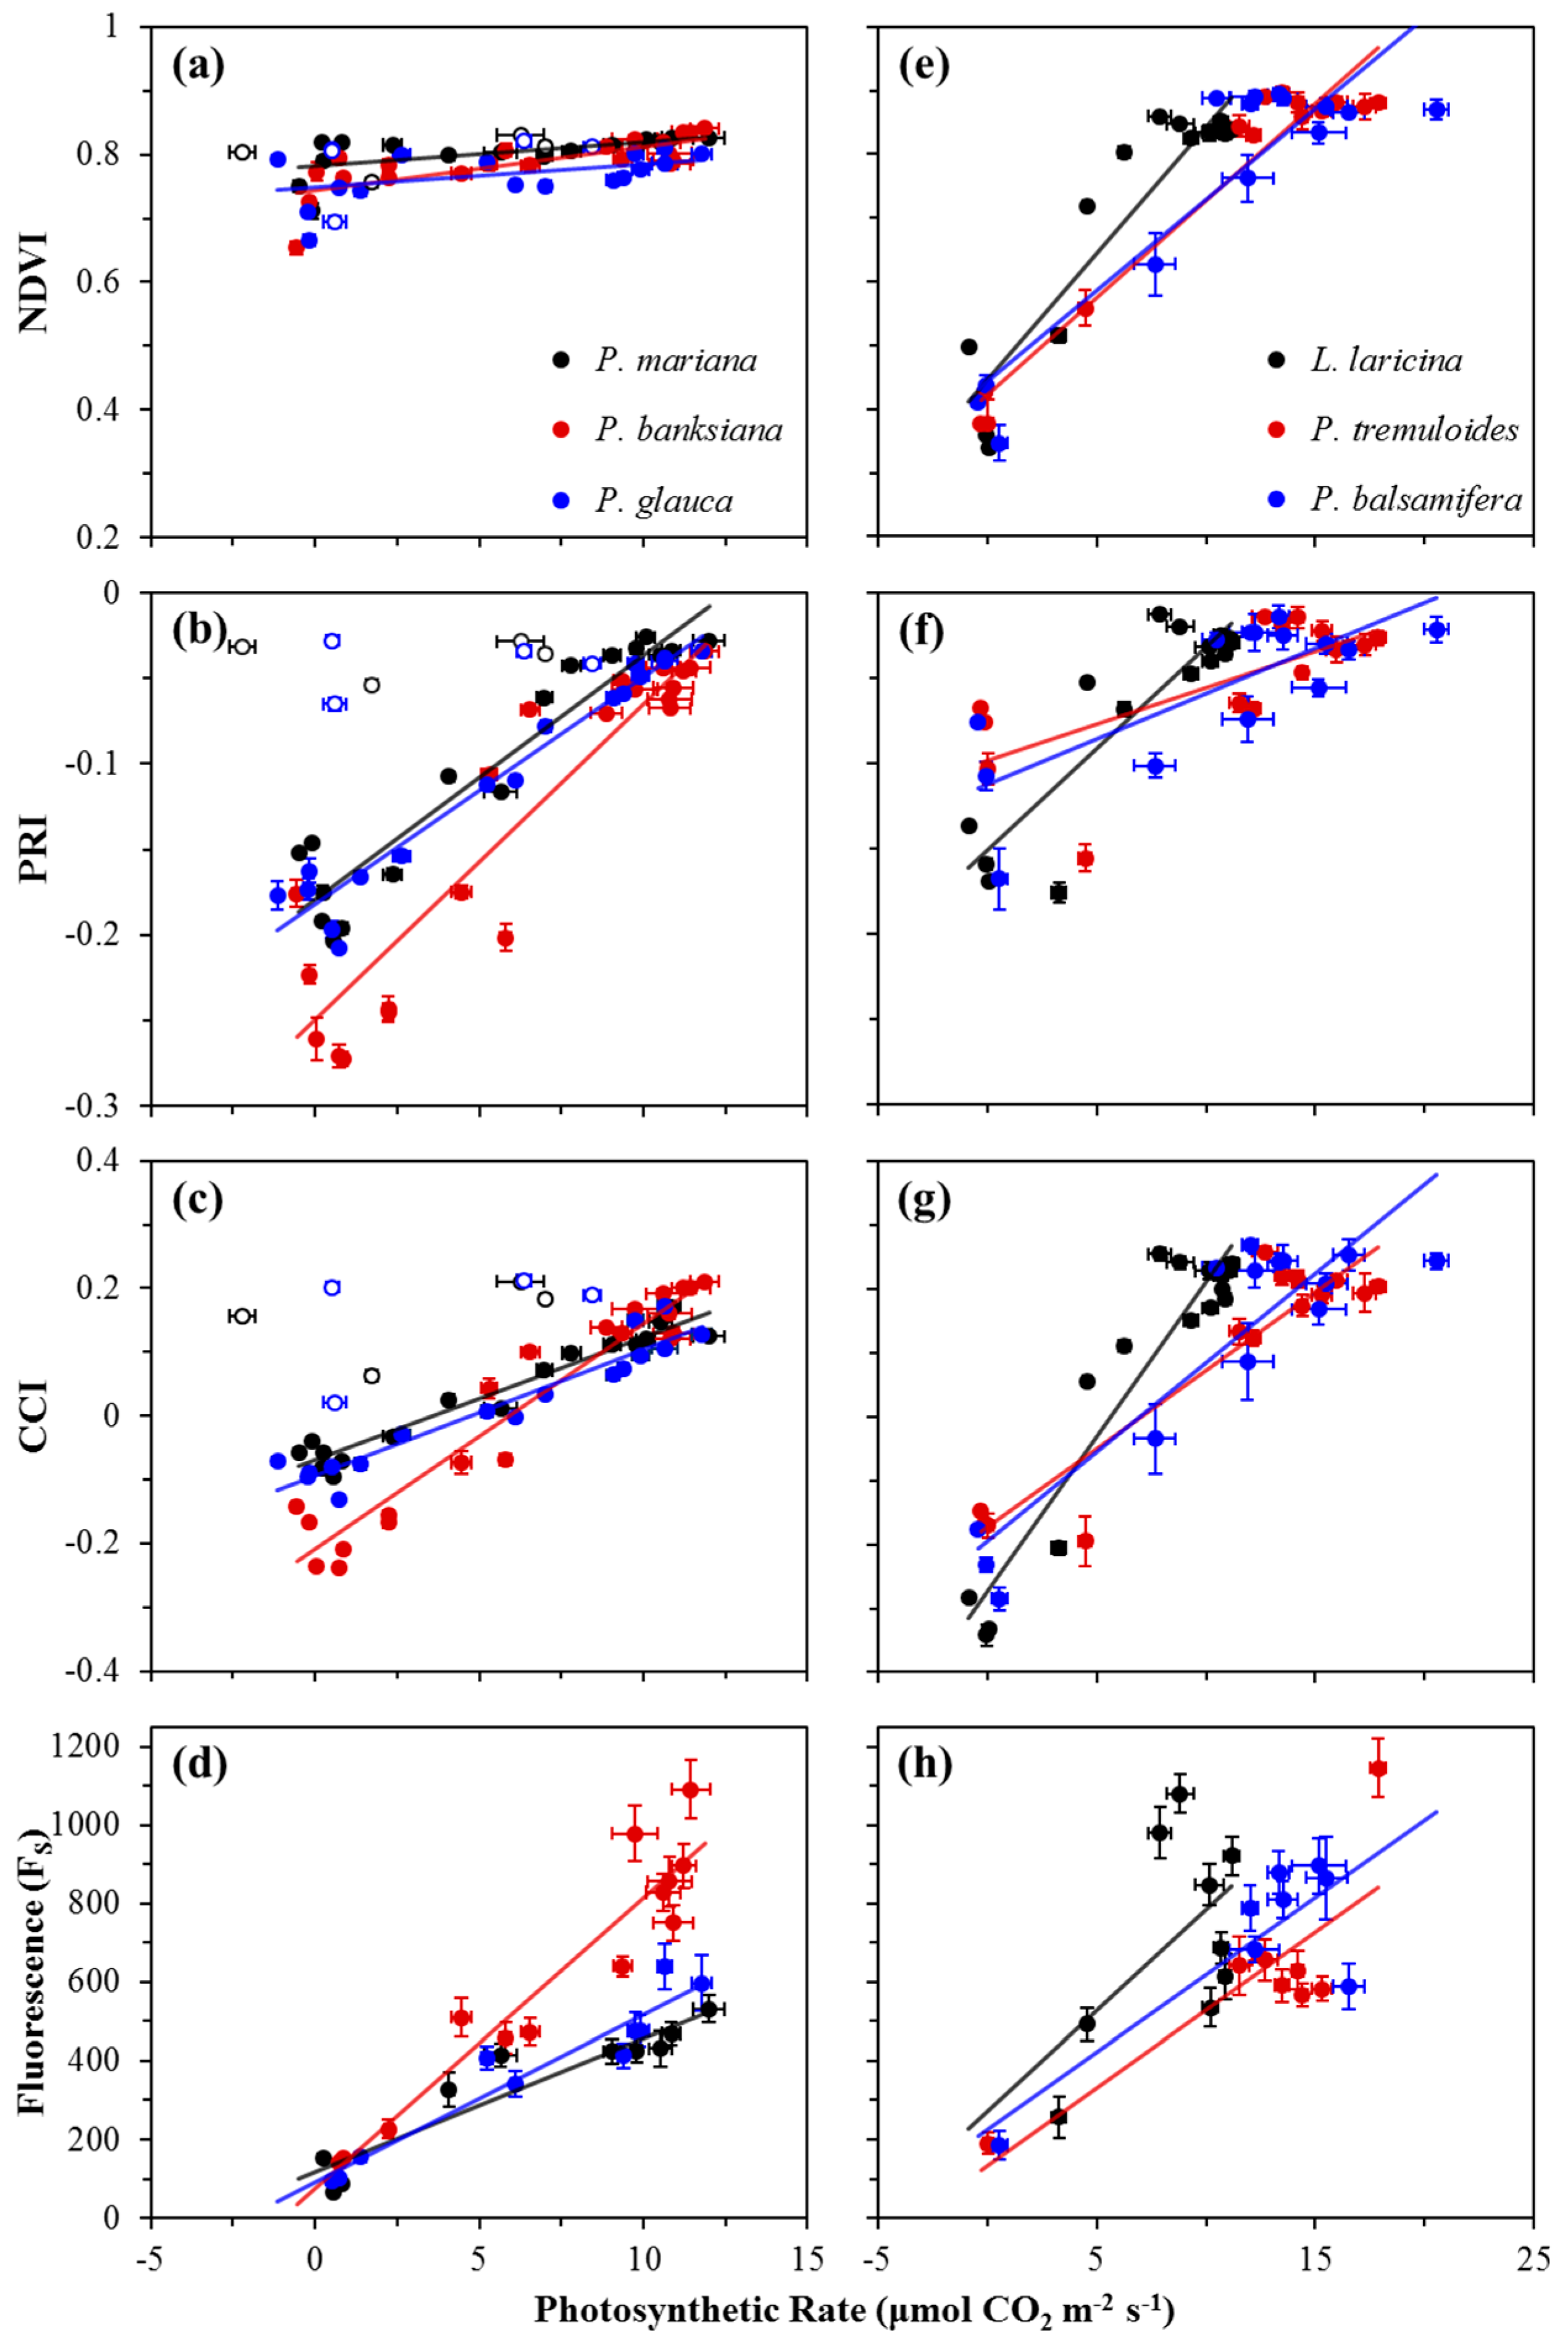
Annual correlations between FS and reflectance indices (NDVI, PRI, and CCI) are shown in Figure 5, and summarized in Table 2a for evergreen species, and Table 2b for deciduous species. For the NDVI, weak correlations with FS were seen in all evergreens (Figure 5a), except for P. banksiana, which yielded a good correlation, but with a very small range of NDVI values compared to deciduous species that had moderate correlations (Figure 5d). The PRI had strong correlations with FS for all evergreen species (Figure 5b), and moderate correlations for two deciduous species (Figure 5e). The CCI had strong correlations with FS for all evergreen species (Figure 5c), and moderate correlations for deciduous species (Figure 5f). The slopes of the regressions between both the NDVI and PRI and FS were significantly different in deciduous and evergreen species (p < 0.0001, and p < 0.05), again indicating functionally distinct behavior of the NDVI and PRI in the two vegetation types. The regression slopes between the CCI and FS in deciduous and evergreens were not significantly different (p > 0.05).
4. Discussion
4.1. Seasonal Kinetics
Photosynthetic activity, fluorescence, and reflectance indices often exhibited seasonal responses that paralleled changing environmental conditions. However, the indices showed subtle differences from each other that indicated variation in their ability to track photosynthetic phenology. In parallel to seasonally changing temperature, optical and photosynthetic metrics in evergreen species (with the exception of the NDVI) changed gradually with temperature, whereas metrics in deciduous species showed abrupt changes that were typically limited to the spring and fall transition periods, and did not track temperature as closely as in evergreens. In particular, we noted that seasonal CCI patterns exhibited a close correlation with temperature for evergreen and deciduous species (supplemental Figure S1). The strong relationship between the CCI and temperature suggested a strong temperature driver in the CCI signal.
Gradual seasonal changes in photosynthetic activity for evergreen species, compared to more abrupt spring activation and fall declines of photosynthesis for deciduous species, reflect a longer overall photosynthetic season than for deciduous species [38]. While evergreens in boreal forests do not photosynthesize year-round, they can typically begin photosynthesis earlier in the spring and persist later in the fall than deciduous species [39]. The abrupt drop in photosynthetic rate for P. mariana and P. glauca during the spring transition was likely an artefact of leaf-level sampling. Budburst near branch tips for spruce trees made accurate sampling of mature needles difficult, leaving only young leaves to be sampled, which are less productive than fully mature leaves [40].
The more abrupt transitions during spring and fall for deciduous species were expected as, unlike evergreens, deciduous species shed foliage during unfavorable seasons [38]. The higher overall photosynthetic capacity observed in deciduous species compared to evergreens during the growing season was consistent with deciduous species having a higher rate of photosynthesis per unit leaf mass than evergreens [38]. Deciduous species have thinner leaves with a greater surface area than evergreens, allowing them to be more productive during favorable conditions, whereas evergreens have thick leaves that avoid damage brought on by frost or drought during unfavorable seasons [41]. The conifer L. laricina, though deciduous, showed very similar photosynthetic rates to evergreen species, and typically has low summer rates of photosynthetic activity and growth [42].
When evaluating the efficacy of canopy reflectance indices in tracking photosynthetic phenology, we found that the NDVI was capable of tracking midday photosynthetic activity of deciduous species associated with the development and loss of green foliage across seasons, as previously reported [17]. The slight NDVI variation in evergreen species across seasons was expected, as evergreen canopy structure is relatively stable over seasons [17]. The small increase in the NDVI during the emergence of new foliage in P. banksiana indicated some sensitivity to the structural changes in evergreens associated with the flush of new leaves. However, the NDVI fails to capture subtler changes in physiology (e.g., photosynthetic downregulation) [19].
The PRI was capable of tracking photosynthetic phenology for all evergreen species, and showed strong seasonal variation. These patterns were similar to seasonal trends shown in other studies that demonstrated that the PRI responds to seasonally changing chlorophyll and carotenoid pigment pool sizes [13,14,19]. The PRI is sensitive to changes in the chlorophyll/carotenoid ratios that are driven by the increase in carotenoids and the decline of chlorophyll concentrations in the winter, and their reversal in the summer [13]. These pigment changes are related to the cold-hardening process in response to changing temperature and photoperiod, and subsequent readjustment during the de-hardening period in the spring [6,7,9].
In deciduous species, the PRI variation during the spring activation was likely a result of budburst and the increase in foliage and subsequent changes in pigment levels. The initial fall decrease in the PRI to values lower than the normal winter background may have been attributed to the breakdown of chlorophyll during senescence [43]; the more rapid breakdown of chlorophylls than carotenoids during senescence [44] alters chlorophyll/carotenoid ratios, to which the PRI is sensitive. The lower values of the PRI seen in L. laricina during winter periods compared to the broad-leaf deciduous species was likely due to the persistence of leaf litter on the top of the pots following senescence, causing lower values than was seen with bare soil.
The CCI showed strong seasonal variation in both evergreen and deciduous species, indicating that the CCI can effectively track photosynthetic phenology in both functional types, unlike the PRI and NDVI. The close parallels between the CCI and photosynthetic activity in evergreens were consistent with other findings indicating that changes in the CCI coincide with large pigment pool size shifts [15], which are known to closely track photosynthetic rates and GPP in evergreens [13,14,15]. Seasonal changes in the CCI for deciduous species were primarily driven by the presence and absence of canopy foliage. Similar to the PRI, the persistence of leaf litter on the top of pots was the likely cause of lower CCI values seen in L. laricina, compared to broad-leaf deciduous species, during winter periods. As with other reflectance indices, the CCI was also clearly affected by snow, which could have confounded the seasonal interpretation of this index. Consequently, more work may be needed to correct for these background effects.
The parallel seasonal patterns of the CCI and photosynthetic activity in deciduous species suggested that the CCI is sensitive to canopy structural changes, as well as the adjustment of pigments associated with leaf development in the spring, and senescence during the fall transition. The spikes in the CCI at the end of the spring transition for spruce species (P. mariana and P. glauca) and later in the summer for P. banksiana that coincided with needle expansion and shoot elongation indicated that the CCI is also sensitive to canopy structure in evergreens, which has not previously been reported. These results indicate that the CCI may be sensitive to a combination of canopy structural changes and pigment pool size adjustments for both functional types when tracking photosynthetic phenology. Consequently, the CCI appears well-suited to assess photosynthetic phenology consistently across evergreen, deciduous, and mixed forests, where the NDVI and PRI are likely to show different responses.
The increases in FS during the spring and decreases during the fall observed in our three evergreen species were similar to seasonal patterns reported for Pinus sylvestris [45]. Maximum FS values seen in the early spring for L. laricina, P. mariana, and P. glauca, and seen later in the season for P. banksiana, coincided with the emergence of new leaf tissues. As young leaves are less productive, with lower chlorophyll concentrations than mature leaves [40], they have more excess absorbed light to dissipate [46], and require greater photoprotection [47]. This excess light may result in greater dissipation through fluorescence. These leaf-level phenomena may not be representative of the whole canopy, and further studies at different spatial scales would be required to test this.
The seasonal changes observed in evergreens were likely related to changing NPQ with the adjustment of pigmentation (changing pigment pools and xanthophyll pigment activity) during the spring and fall transitions [7]. During the fall transition, pigmentation changes function to dissipate excess light energy through NPQ [7,9], which has been reported to be substantially greater in the winter months than summer months [45]; this increase in NPQ results in a quenching of the fluorescence signal [48]. The opposite is likely to have occurred during the growing season, with the increase in light availability reaching potentially saturating levels for photochemistry, combined with the reversal of cold-hardening pigment changes [7] and a reduction of NPQ with increasing temperature [45], all potentially resulting in increased dissipation of absorbed light through fluorescence during the spring transition. In deciduous species, the greater variability in FS seen during the summer for broad-leaf species (P. tremuloides and P. balsamifera) compared to L. laricina was possibly due to the differential irradiance of individual leaves associated with more dynamic orientation of the broad-leaf species during sampling [49], with fluorescence adjusting quickly with changing light [11]. Further studies are warranted to evaluate the variability in the leaf-level fluorescence signals in relation to photosynthetic phenology, and to compare FS to SIF in response to seasonally changing conditions. Here we used FS as an indicator of likely SIF signals, but key differences in instrumentation and measurement protocols exist between these two methods [10].
4.2. Complementarity Hypothesis
Overall, our comparison of the NDVI and PRI to photosynthetic phenology reveal the complementary nature of the NDVI and PRI when sampling deciduous and evergreen vegetation, consistent with the complementarity hypothesis [31,34]. By contrast, the strong relationships between the CCI and photosynthetic activity in both evergreen and deciduous species indicated that the CCI is sensitive to both seasonally changing pigment pools in evergreens, and canopy structural changes linked to photosynthetic activity in deciduous species, which has not previously been reported. If the CCI is sensitive to both canopy structural changes influencing absorbed light (APAR) and photosynthetic ε, then the CCI can be used as a direct indicator of photosynthetic activity in multiple vegetation types, as proposed in Figure 1. SIF may also have a similar capability to the CCI in providing a direct indicator of photosynthetic activity [31], which has been suggested in large-scale studies linking fluorescence to GPP in multiple biomes [29], as it is known to be sensitive to photosynthetic downregulation and absorbed light [10].
The CCI showed strong parallels with FS in evergreen species, and moderate parallels in deciduous species. The relatively poor relationships when comparing the CCI and FS in deciduous species could be a consequence of comparing leaf-level FS measurements to canopy-level reflectance indices, where the fewer FS samples for deciduous species resulted from the lack of foliage year-round for sampling, and limited the sample size and sampling period for FS to the growing season. Relative to the NDVI and PRI, stronger and more consistent correlations between the CCI and FS for both evergreen and deciduous species suggested that these metrics might yield similar information about photosynthetic phenology, and further work at large scales and across multiple vegetation types would be required to confirm this.
4.3. Differences Between Species within Functional Types
While our results show differences in photosynthetic and optical phenology between deciduous and evergreens, they also indicate differences between species within each functional group. These differences indicate that variation exists within each type (evergreen and deciduous), with closely related species (Picea spp. and Populus spp.) showing similar optical and physiological behavior, suggesting a phylogenetic contribution to these patterns. Variation in optical and physiological behavior between evergreen and deciduous species is likely due to contrasting structural and physiological controls on plant growth between species, or genera, that reflect different evolutionary responses to environmental conditions [31,34], affecting the timing of seasonal activation and downregulation, as well as growth habits. This variation between and within functional groups illustrates a need to better understand vegetation optical types: the classification by functionally different optical properties determined by a combination of leaf and canopy traits and phenology [50]. This optical behavior of vegetation needs to be better understood if is to be effectively applied over larger spatial and temporal scales (e.g., airborne or satellite data).
4.4. Other Causes of Variation in Stand-Level Sampling
While optical measurements can be used at both the leaf- and stand-levels as metrics of photosynthetic activity, there can be subtle differences in leaf- and canopy-level responses [14,15]. In our study, one likely cause of variation was the expansion of new branches and leaf tissues, which would have affected leaf- and canopy-level signals differently.
Presumably, background signals (including soil, leaf litter, bark, and snow) also impacted optical measurements at the canopy- and stand-levels. While the NDVI and PRI are known to be influenced by these background signals [51,52], the effects of background signals on the CCI, while not as well-understood, were clearly visible.
The presence of snowfall had noticeable impacts on all optical indices during winter months, which has been previously reported for the NDVI [53], but not for the PRI nor CCI. During transition periods, snowfall can obscure changes in vegetation [53], and observing patterns of spring activation and fall downregulation becomes more challenging, particularly for reflectance indices that are clearly influenced by the high albedo of snow. The impacts of different background signals on canopy-level optical indices, including snowfall in higher-latitude temperate forests, must be considered when sampling over large spatial and temporal scales.
The measurements of leaf-level FS using the PAM method had potential limitations that require further consideration [10]. Compared to other fluorescence parameters (e.g., Fm, Fv/Fm), FS tells little about underlying plant physiological processes on its own [54], and it changed rapidly according to light conditions. Unlike SIF, which is measured passively using spectrometers with very narrow bandwidth, PAM fluorescence is a broadband measurement isolated with a modulated light signal. However, unlike other PAM fluorescence parameters, but similar to SIF, FS is measured under ambient sunlight without the application of a saturating pulse. The passive nature of FS in ambient light makes it a more appropriate analogue to SIF than other PAM fluorescence metrics that require a saturating light pulse. In this study, FS was used in place of a spectral fluorescence metric due to the lack of high spectral resolution from the spectrometers utilized in this study. Future studies should investigate the seasonal responses of both Fs and SIF in response to seasonally changing conditions.
Some aspects of this study may not be reflective of natural environmental conditions due to the small-scale and synthetic nature of the design, limiting the ability to draw direct conclusions for natural forests. Our study took place on a rooftop, where the average temperature was often warmer than that of natural forests in the same region, potentially resulting in a slightly longer growing season than would normally be seen. Presumably, other aspects of surface energy balance were also different between rooftop conditions and natural forest environments. Our plants were well-watered with periodic nutrient applications to ensure proper growth. In natural environments, plants would be exposed to a wide range of water and nutrient conditions, and would experience drought and nutrient stress, which would impact plant physiology and optical properties. Accordingly, proper extension and application of these must be done in natural ecosystems at larger scales. To investigate the potential for upscaling, further studies are underway using satellite data and the flux tower network [15].
5. Conclusions
Our results show the varying efficacy of FS and reflectance indices (NDVI, PRI, and CCI) in tracking photosynthetic phenology for evergreen and deciduous species. As expected, the NDVI was primarily sensitive to canopy structural changes associated with leaf development and senescence, and detected changing photosynthetic activity in deciduous, but not in evergreen, species. The PRI was able to track photosynthetic activity driven by changes in pigment pool size, which can be observed in both functional groups, but was better seen in evergreens. The CCI was able to track photosynthetic phenology in both deciduous and evergreen species, reflecting seasonal changes in both pigment pool size and canopy structural changes. In many cases, FS showed similar responses to the CCI, but with weaker correlations with photosynthetic phenology, partly due to the limitations of smaller sample sizes.
Our findings support the complementary nature of the reflectance indices NDVI and PRI, with respect to the LUE model. As expected, the NDVI and PRI provided information relevant to the APAR and ε terms in the model, respectively. By contrast, the CCI and FS seem to have provided similar information regarding photosynthetic activity, and may have been sensitive to both APAR (via chlorophyll content and canopy structure) and ε (mediated via relative pigment concentrations and NPQ). We also showed that the CCI correlated well with actual rates of photosynthesis and could perhaps transcend the LUE model by providing a direct metric of productivity, as proposed for SIF. FS (a leaf-level analog for SIF) may have a similar potential, but further work at larger scales is needed to explore the cause of these differences apparent in our leaf (FS) and canopy (CCI) comparisons. The development of new instruments for canopy-level SIF measurements in conjunction with reflectance should further clarify these relationships and their mechanistic underpinnings.
Different functional groups (evergreen and deciduous) showed distinct optical and photosynthetic phenology, outlining the importance of considering optical types when sampling at the ecosystem-level. With similar responses in both types, the CCI is well suited for detecting changes representative of both functional groups, and can presumably be applied to mixed boreal stands, where deciduous and evergreen species both contribute to canopy optical properties and photosynthetic fluxes. When considering reflectance indices for evaluating photosynthetic phenology of different functional groups, the limitations of the NDVI and PRI, which responded differently for evergreen and deciduous species, are readily apparent.
The CCI and SIF both offer means of monitoring large-scale photosynthesis and productivity, and the tandem ability of these metrics to monitor photosynthetic phenology in both deciduous and evergreen vegetation will be a particularly valuable contribution to the planned FLEX mission and supporting studies. Relative to other metrics, the stronger ability of the CCI and SIF in tracking photosynthetic activity of different vegetation types, by detecting structural and physiological contributions to photosynthetic phenology, appear to offer a powerful means of estimating photosynthesis and primary productivity across ecosystems.
Supplementary Materials
The following are available online at www.mdpi.com/2072-4292/9/7/691/s1, Figure S1: Correlations between daily average temperature, photosynthetic rate (μmol CO2 m−2 s−1), NDVI, PRI, CCI, or fluorescence for evergreen (a–e) and deciduous (f–j) species.
Acknowledgments
This study was supported by iCORE/AITF (G224150012 & 200700172), NSERC (RGPIN-2015-05129), CFI (26793), and NASA ABoVE (NNX15AT78A) grants to John A. Gamon, and a China Scholarship Council fellowship to Ran Wang. The authors thank Steven Williams for assistance with plant care.
Author Contributions
K.R.S. and J.A.G. conceived and designed the experiments; K.R.S. and R.W. performed the experiments; K.R.S. and R.W. analyzed the data; and K.R.S. wrote the manuscript draft, with J.A.G. and R.W. providing revisions.
Conflicts of Interest
The authors declare no conflict of interest.
References
- Dixon, R.K.; Browne, S.; Houghton, R.A.; Soloman, A.M.; Trexler, M.C.; Wosniewski, J. Carbon pools and flux of global forest ecosystems. Science 1994, 263, 185–190. [Google Scholar] [CrossRef] [PubMed]
- Pan, Y.; Birdsey, R.A.; Fang, J.; Houghton, R.; Kauppi, P.E.; Kurz, W.A.; Phillips, O.L.; Shvidenko, A.; Lewis, S.L.; Canadell, J.G. A large and persistent carbon sink in the world’s forests. Science 2011, 333, 988–993. [Google Scholar] [CrossRef] [PubMed]
- Goodale, C.L.; Apps, M.J.; Birdsey, R.A.; Field, C.B.; Heath, L.S.; Houghton, R.A.; Jenkins, J.C.; Kohlmaier, G.H.; Kurz, W.; Liu, S.; et al. Forest carbon sinks in the Northern Hemisphere. Ecol. Appl. 2002, 12, 891–899. [Google Scholar] [CrossRef]
- MacDonald, G.M. Global warming and the Arctic: A new world beyond the reach of the Grinnellian niche? J. Exp. Biol. 2010, 213, 855–861. [Google Scholar] [CrossRef] [PubMed]
- Estiarte, M.; Peñuelas, J. Alteration of the phenology of leaf senescence and fall in winter deciduous species by climate change: Effects on nutrient proficiency. Glob. Chang. Biol. 2015, 21, 1005–1017. [Google Scholar] [CrossRef] [PubMed]
- Öquist, G.; Huner, N.P.A. Photosynthesis of overwintering plants. Annu. Rev. Plant Biol. 2003, 54, 329–355. [Google Scholar] [CrossRef] [PubMed]
- Ottander, C.; Campbell, D.; Öquist, G. Seasonal changes in photosystem II organisation and pigment composition in Pinus sylvestris. Planta 1995, 197, 176–183. [Google Scholar] [CrossRef]
- Maxwell, K.; Johnson, G.N. Chlorophyll fluorescence—A practical guide. J. Exp. Bot. 2000, 51, 659–668. [Google Scholar] [CrossRef] [PubMed]
- Demmig-Adams, B.; Adams, W.W. The role of xanthophyll cycle carotenoids in the protection of photosynthesis. Trends Plant Sci. 1996, 1, 21–26. [Google Scholar] [CrossRef]
- Porcar-Castell, A.; Tyystjärvi, E.; Atherton, J.; Van Der Tol, C.; Flexas, J.; Pfündel, E.E.; Moreno, J.; Frankenberg, C.; Berry, J.A. Linking chlorophyll a fluorescence to photosynthesis for remote sensing applications: Mechanisms and challenges. J. Exp. Bot. 2014, 65, 4065–4095. [Google Scholar] [CrossRef] [PubMed]
- Jones, H.G. Plants and Microclimate: A Quantitative Approach to Environmental Plant Physiology, 3rd ed.; Cambridge University Press: Cambridge, UK, 2014. [Google Scholar]
- Demmig, B.; Winter, K.; Krüger, A.; Czygan, F.C. Photoinhibition and zeaxanthin formation in intact leaves: A possible role of the xanthophyll cycle in the dissipation of excess light energy. Plant Physiol. 1987, 84, 218–224. [Google Scholar] [CrossRef] [PubMed]
- Wong, C.Y.S.; Gamon, J.A. Three causes of variation in the photochemical reflectance index (PRI) in evergreen conifers. New Phytol. 2015, 206, 187–195. [Google Scholar] [CrossRef] [PubMed]
- Wong, C.Y.S.; Gamon, J.A. The photochemical reflectance index provides an optical indicator of spring photosynthetic activation in evergreen conifers. New Phytol. 2015, 206, 196–208. [Google Scholar] [CrossRef] [PubMed]
- Gamon, J.A.; Huemmrich, K.F.; Wong, C.Y.S.; Ensminger, I.; Garrity, S.; Hollinger, D.Y.; Noormets, A.; Peñuelas, J. A remotely sensed pigment index reveals photosynthetic phenology in evergreen conifers. Proc. Natl. Acad. Sci. USA 2016, 113, 13087–13092. [Google Scholar] [CrossRef] [PubMed]
- Park, T.; Ganguly, S.; Tømmervik, H.; Euskirchen, E.S.; Høgda, K.; Karlsen, S.R.; Brovkin, V.; Nemani, R.R.; Myneni, R.B. Changes in growing season duration and productivity of northern vegetation inferred from long-term remote sensing data. Environ. Res. Lett. 2008, 11, 84001. [Google Scholar] [CrossRef]
- Gamon, J.A.; Field, C.B.; Goulden, M.L.; Griffin, K.L.; Hartley, A.E.; Joel, G.; Peñuelas, J.; Valentini, R. Relationships between NDVI, canopy structure, and photosynthesis in three Californian vegetation types. Ecol. Appl. 1995, 5, 28–41. [Google Scholar] [CrossRef]
- Running, S.W.; Nemani, R.R.; Heinsch, F.A.; Zhao, M.; Reeves, M.; Hashimoto, H. A continuous satellite-derived measure of global terrestrial primary production. Bioscience 2004, 54, 547. [Google Scholar] [CrossRef]
- Gamon, J.A.; Kovalchuck, O.; Wong, C.Y.S.; Harris, A.; Garrity, S.R. Monitoring seasonal and diurnal changes in photosynthetic pigments with automated PRI and NDVI sensors. Biogeosciences 2015, 12, 4149–4159. [Google Scholar] [CrossRef]
- Jönsson, A.M.; Eklundh, L.; Hellström, M.; Bärring, L.; Jönsson, P. Annual changes in MODIS vegetation indices of Swedish coniferous forests in relation to snow dynamics and tree phenology. Remote Sens. Environ. 2010, 114, 2719–2730. [Google Scholar] [CrossRef]
- Gamon, J.A.; Peñuelas, J.; Field, C.B. A Narrow-Waveband Spectral Index That Tracks Diurnal Changes in Photosynthetic Efficiency. Remote Sens. Environ. 1992, 44, 35–44. [Google Scholar] [CrossRef]
- Gamon, J.A.; Berry, J.A. Facultative and constitutive pigment effects on the Photochemical Reflectance Index (PRI) in sun and shade conifer needles. Isr. J. Plant Sci. 2012, 60, 85–95. [Google Scholar] [CrossRef]
- Gamon, J.A.; Serrano, L.; Surfus, J.S. The photochemical reflectance index: An optical indicator pf photosynthetic radiation use efficiency across species, functional types, and nutrient levels. Oecologia 1997, 112, 492–501. [Google Scholar] [CrossRef] [PubMed]
- Goerner, A.; Reichstein, M.; Rambal, S. Tracking seasonal drought effects on ecosystem light use efficiency with satellite-based PRI in a Mediterranean forest. Remote Sens. Environ. 2009, 113, 1101–1111. [Google Scholar] [CrossRef]
- Garbulsky, M.F.; Peñuelas, J.; Ogaya, R.; Filella, I. Leaf and stand-level carbon uptake of a Mediterranean forest estimated using the satellite-derived reflectance indices EVI and PRI. Int. J. Remote Sens. 2013, 34, 1282–1296. [Google Scholar] [CrossRef]
- Baker, N.R.; Rosenqvist, E. Applications of chlorophyll fluorescence can improve crop production strategies: An examination of future possibilities. J. Exp. Bot. 2004, 55, 1607–1621. [Google Scholar] [CrossRef] [PubMed]
- Meroni, M.; Rossini, M.; Guanter, L.; Alonso, L.; Rascher, U.; Colombo, R.; Moreno, J. Remote sensing of solar-induced chlorophyll fluorescence: Review of methods and applications. Remote Sens. Environ. 2009, 113, 2037–2051. [Google Scholar] [CrossRef]
- Frankenberg, C.; Fisher, J.B.; Worden, J.; Badgley, G.; Saatchi, S.S.; Lee, J.E.; Toon, G.C.; Butz, A.; Jung, M.; Kuze, A.; et al. New global observations of the terrestrial carbon cycle from GOSAT: Patterns of plant fluorescence with gross primary productivity. Geophys. Res. Lett. 2011, 38, 1–6. [Google Scholar] [CrossRef]
- Joiner, J.; Yoshida, Y.; Vasilkov, A.P.; Schaefer, K.; Jung, M.; Guanter, L.; Zhang, Y.; Garrity, S.; Middleton, E.M.; Huemmrich, K.F.; et al. The seasonal cycle of satellite chlorophyll fluorescence observations and its relationship to vegetation phenology and ecosystem atmosphere carbon exchange. Remote Sens. Environ. 2014, 152, 375–391. [Google Scholar] [CrossRef]
- Walther, S.; Voigt, M.; Thum, T.; Gonsamo, A.; Zhang, Y.; Köhler, P.; Jung, M.; Varlagin, A.; Guanter, L. Satellite chlorophyll fluorescence measurements reveal large-scale decoupling of photosynthesis and greenness dynamics in boreal evergreen forests. Glob. Chang. Biol. 2016, 22, 2979–2996. [Google Scholar] [CrossRef] [PubMed]
- Gamon, J.A. Reviews and syntheses: Optical sampling of the flux tower footprint. Biogeosciences 2015, 12, 4509–4523. [Google Scholar] [CrossRef]
- Gamon, J.A.; Qiu, H.-L. Ecological applications of remote sensing at multiple scales. In Handbook of Functional Plant Ecology; Pugnaire, F.I., Valladares, F., Eds.; Marcel Dekker, Inc.: New York, NY, USA, 1999; pp. 805–846. [Google Scholar]
- Gamon, J.A.; Field, C.B.; Fredeen, A.L.; Thayer, S. Assessing photosynthetic downregulation in sunflower stands with an optically-based model. Photosynth. Res. 2001, 67, 113–125. [Google Scholar] [CrossRef] [PubMed]
- Garbulsky, M.F.; Peñuelas, J.; Gamon, J.; Inoue, Y.; Filella, I. The photochemical reflectance index (PRI) and the remote sensing of leaf, canopy and ecosystem radiation use efficiencies. A review and meta-analysis. Remote Sens. Environ. 2011, 115, 281–297. [Google Scholar] [CrossRef]
- Kraft, S.; Bézy, J.-L.; Del Bello, U.; Berlich, R.; Drusch, M.; Franco, R.; Gabriele, A.; Harnisch, B.; Meynart, R.; Silvestrin, P. FLORIS: Phase A status of the fluorescence imaging spectrometer of the Earth Explorer mission candidate FLEX. Proc. SPIE 2013, 8889, 1–12. [Google Scholar]
- Canadian Climate Normals. Available online: http://climate.weather.gc.ca/climate_normals/index_e.html (accessed on 23 March 2017).
- Gamon, J.A.; Cheng, Y.; Claudio, H.; MacKinney, L.; Sims, D.A. A mobile tram system for systematic sampling of ecosystem optical properties. Remote Sens. Environ. 2006, 103, 246–254. [Google Scholar] [CrossRef]
- Givnish, T.J. Adaptive significance of evergreen vs. deciduous leaves: Solving the triple paradox. Silva Fenn. 2002, 36, 703–743. [Google Scholar] [CrossRef]
- Gower, S.T.; Richards, J.H. Larches: Deciduous conifers in an evergreen world carbon gain similar to evergreens. Bioscience 1990, 40, 818–826. [Google Scholar] [CrossRef]
- Krause, G.H.; Virgo, A.; Winter, K. High susceptibility to photoinhibition of young leaves of tropical forest trees. Planta 1995, 197, 583–591. [Google Scholar] [CrossRef]
- Chabot, B.F.; Hicks, D.J. The ecology of leaf life spans. Annu. Rev. Ecol. Syst. 1982, 13, 229–259. [Google Scholar] [CrossRef]
- Schulze, E.-D.; Schulze, W.; Kelliher, F.M.; Vygodskaya, N.N.; Ziegler, W.; Kobak, K.I.; Koch, H.; Arneth, A.; Kusnetsova, W.A.; Sogatchev, A.; et al. Aboveground biomass and nitrogen nutrition in a chronosequence of pristine Dahurian Larix stands in eastern Siberia. Can. J. For. Res. 1995, 25, 943–960. [Google Scholar] [CrossRef]
- Hörtensteiner, S.; Kräutler, B. Chlorophyll breakdown in higher plants. Biochim. Biophys. Acta 2011, 1807, 977–988. [Google Scholar] [CrossRef] [PubMed]
- Nakaji, T.; Oguma, H.; Fujinuma, Y. Seasonal changes in the relationship between photochemical reflectance index and photosynthetic light use efficiency of Japanese larch needles. Int. J. Remote Sens. 2006, 27, 493–509. [Google Scholar] [CrossRef]
- Porcar-Castell, A. A high-resolution portrait of the annual dynamics of photochemical and non-photochemical quenching in needles of Pinus sylvestris. Physiol. Plant. 2011, 143, 139–153. [Google Scholar] [CrossRef] [PubMed]
- Jiang, C.D.; Gao, H.Y.; Zou, Q.; Jiang, G.M.; Li, L.H. Leaf orientation, photorespiration and xanthophyll cycle protect young soybean leaves against high irradiance in field. Environ. Exp. Bot. 2006, 55, 87–96. [Google Scholar] [CrossRef]
- Zhu, H.; Zhang, T.J.; Zhang, P.; Peng, C.L. Pigment patterns and photoprotection of anthocyanins in the young leaves of four dominant subtropical forest tree species in two successional stages under contrasting light conditions. Tree Physiol. 2016, 36, 1092–1104. [Google Scholar] [CrossRef] [PubMed]
- Müller, P.; Li, X.P.; Niyogi, K.K. Non-photochemical quenching. A response to excess light energy. Plant Physiol. 2001, 125, 1558–1566. [Google Scholar] [CrossRef] [PubMed]
- Roden, J.S.; Pearcy, R.W. The effect of leaf flutter on the flux of CO2 in poplar leaves. Funct. Ecol. 1993, 7, 669–675. [Google Scholar] [CrossRef]
- Ustin, S.L.; Gamon, J.A. Remote sensing of plant functional types. New Phytol. 2010, 186, 795–816. [Google Scholar] [CrossRef] [PubMed]
- Hall, F.G.; Huemmrich, K.F.; Goetz, S.J.; Sellers, P.J.; Nickeson, J.E. Satellite remote sensing of surface energy balance—Success, failures, and unresolved issues in FIFE. J. Geophys. Res. 1992, 97, 19061–19089. [Google Scholar] [CrossRef]
- Barton, C.V.M.; North, P.R.J. Remote sensing of canopy light use efficiency using the photochemical reflectance index model and sensitivity analysis. Remote Sens. Environ. 2001, 78, 264–273. [Google Scholar] [CrossRef]
- Eklundh, L.; Jin, H.; Schubert, P.; Guzinski, R.; Heliasz, M. An optical sensor network for vegetation phenology monitoring and satellite data calibration. Sensors 2011, 11, 7678–7709. [Google Scholar] [CrossRef] [PubMed]
- Baker, N.R. Chlorophyll fluorescence: A probe of photosynthesis in vivo. Annu. Rev. Plant Biol. 2008, 59, 89–113. [Google Scholar] [CrossRef] [PubMed]
Figure 1.
Representation of the light-use efficiency (LUE) model in black, stating that gross primary productivity (GPP) is a function of absorbed photosynthetically active radiation (APAR: fPAR × PAR) and efficiency (ε). Red text shows optical measurements useful for model parameterization and validation, including solar-induced fluorescence (SIF), the chlorophyll/carotenoid index (CCI), the normalized difference vegetation index (NDVI), and the photochemical reflectance index (PRI) (modified from Gamon 2015) [31].
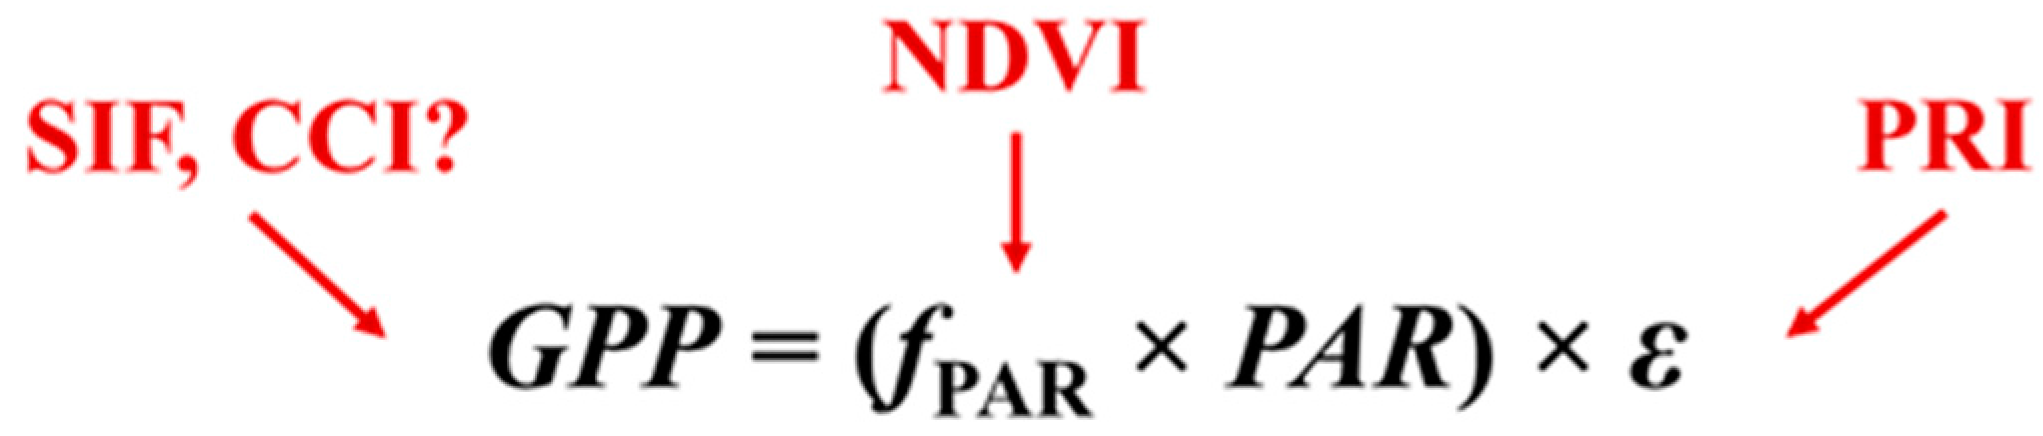
Figure 2.
Seasonal dynamics of photosynthetic photon flux density (PPFD; μmol photons m−2 s−1) and temperature (°C) from December 2015 to January 2016. PPFD is expressed as a midday average, taken as the period between 13:00 and 14:00 (UTC-06), and temperature is expressed as daily averages. Long-term normal (1981–2010) daily average temperature by month is also shown. Error bars denote ±SD of the mean. Between 20 November and 20 January, the sun did not clear buildings to the south due to low solar elevation, causing anomalously low PPFD values during this period.
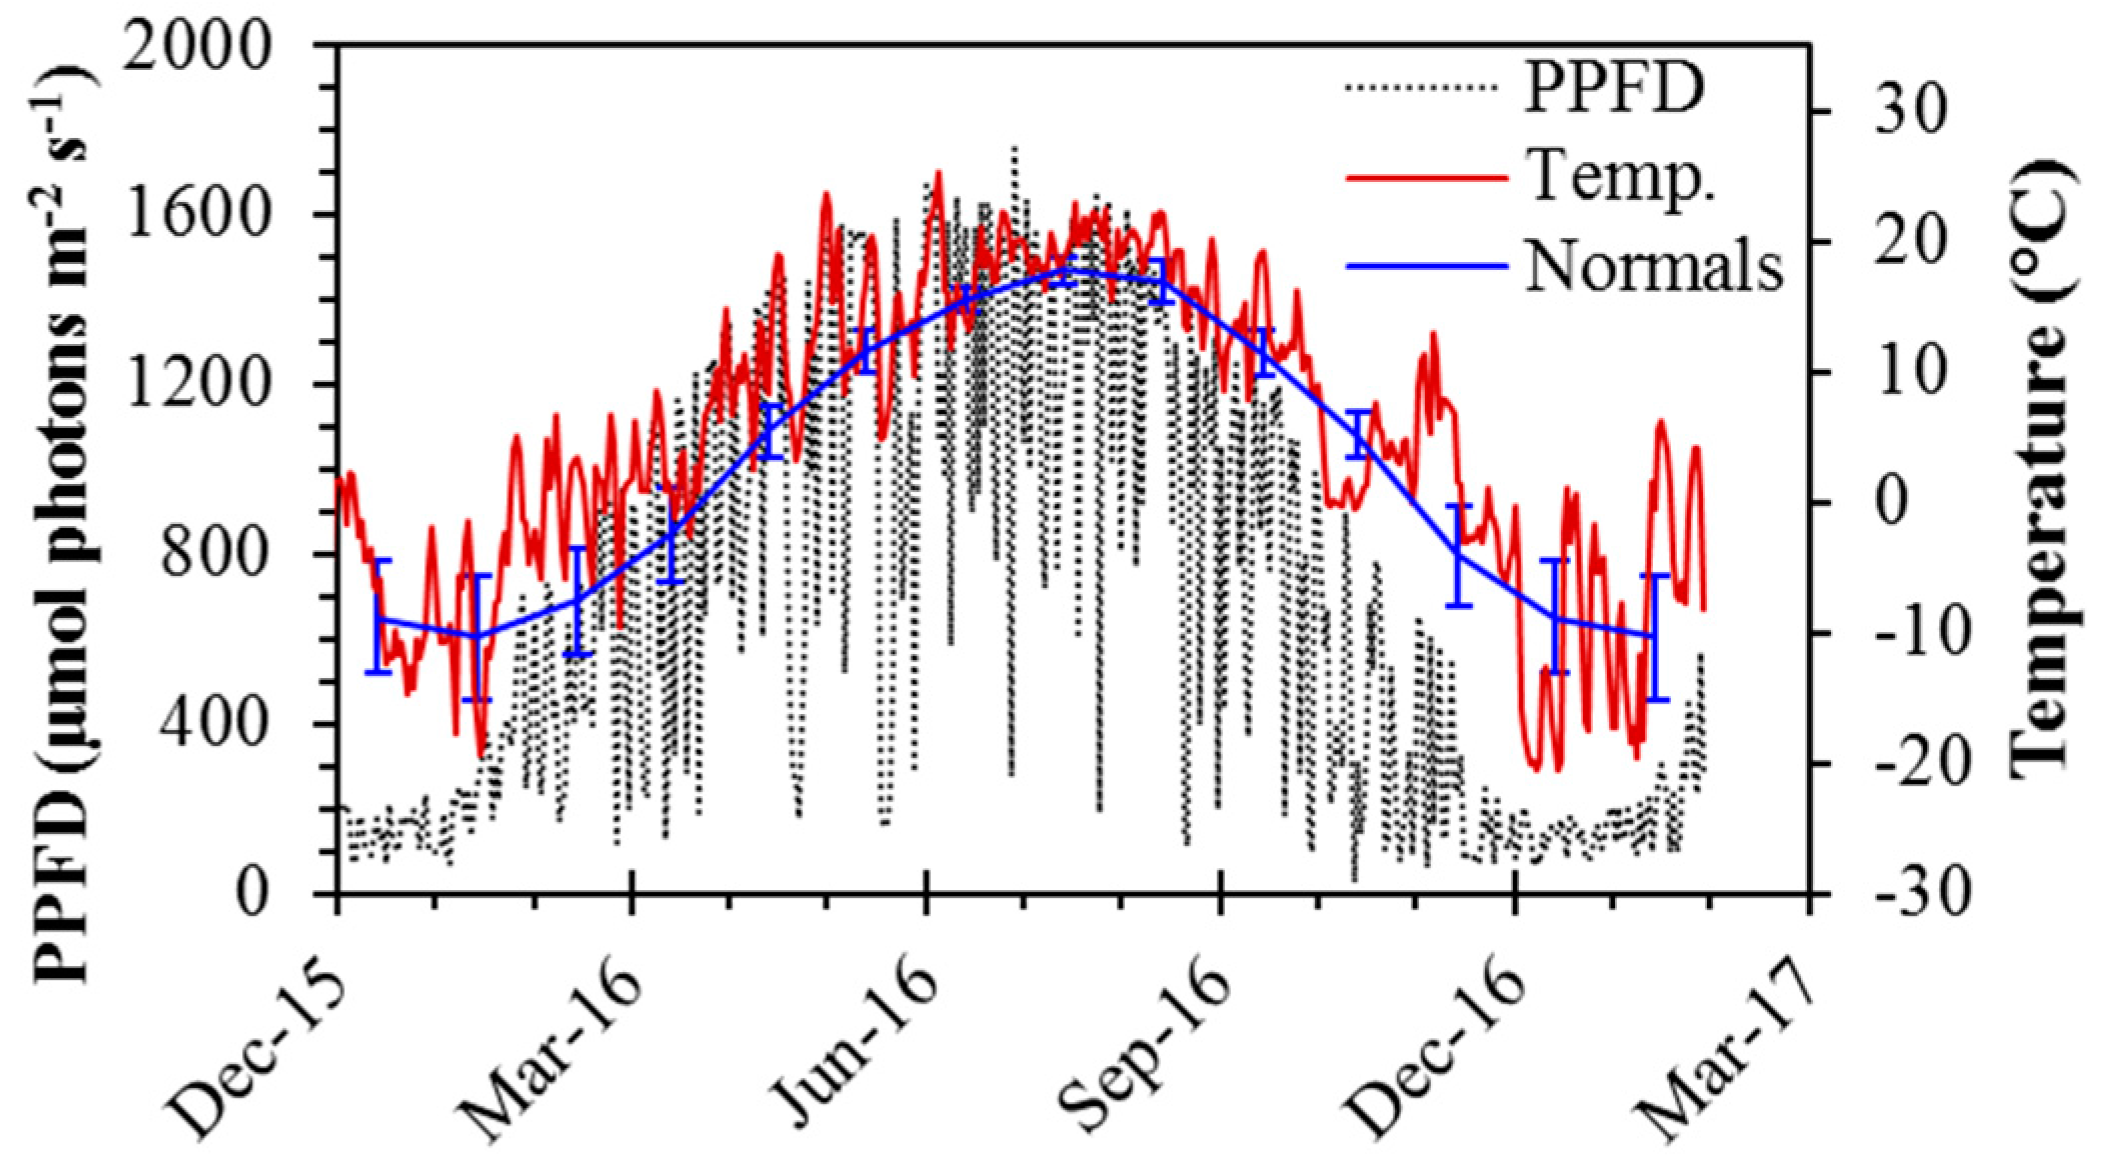
Figure 3.
Annual patterns of midday average temperature (grey line), optical indices and photosynthetic metrics for evergreen and deciduous species. Evergreen species (a−e) included P. mariana (black), P. banksiana (red), and P. glauca (blue). Deciduous species (f−j) included L. laricina (black), P. tremuloides (red), and P. balsamifera (blue). Optical indices (b−d,g−i) were calculated from reflectance measurements at the canopy-level. Fluorescence (FS) was measured at the leaf-level. Data points shown were obtained near solar noon from December 2015 to January 2017. Open points (a) denote dates during the spring transition, where new branches were sampled for P. mariana and P. glauca. The winter period is indicated by the grey regions (November–March). Annotations on figures indicate the effects of snow (S), repotting (R), and new-leaf expansion (E). For deciduous trees, data were restricted to periods with fully formed leaves during the growing season. Error bars denote ±SE of the mean.

Figure 4.
Correlations between photosynthetic rate (μmol CO2 m−2 s−1) and the NDVI, PRI, CCI, or Fs for evergreen (a−d) and deciduous (e−h) species. Data points were obtained near solar noon from January 2016 to December 2016. Error bars denote ±SE of the mean. Open points (a−c) denote dates when new branches were sampled for P. mariana and P. glauca; these points were excluded from analyses.

Figure 5.
Correlations between FS and canopy-level optical indices NDVI, PRI, and CCI for evergreen (a−c) and deciduous (d−f) species. Data points were obtained near solar noon from January 2016 to December 2016. Error bars denote ±SE of the mean.
Figure 5.
Correlations between FS and canopy-level optical indices NDVI, PRI, and CCI for evergreen (a−c) and deciduous (d−f) species. Data points were obtained near solar noon from January 2016 to December 2016. Error bars denote ±SE of the mean.

Table 1.
Linear correlation coefficients (r2) between canopy-level optical indices (normalized difference vegetation index (NDVI), photochemical reflectance index (PRI), chlorophyll/carotenoid index (CCI), and steady-state fluorescence (Fs)) and photosynthetic rate for evergreen (a) and deciduous (b) species. Data points from the spring transition in 2016 for P. glauca and P. mariana were excluded from analyses. The sample size for FS was smaller than for reflectance indices, and is indicated in parentheses.
| Species | n | NDVI | PRI | CCI | FS | ||
|---|---|---|---|---|---|---|---|
| a) | P. mariana | 17 | (10) | 0.318 * | 0.905 **** | 0.945 **** | 0.891 **** |
| P. banksiana | 21 | (13) | 0.556 *** | 0.853 **** | 0.928 **** | 0.908 **** | |
| P. glauca | 17 | (10) | 0.199 | 0.950 **** | 0.914 **** | 0.922 **** | |
| b) | L. laricina | 16 | (9) | 0.861 **** | 0.796 **** | 0.896 **** | 0.307 |
| P. tremuloides | 14 | (8) | 0.937 **** | 0.505 ** | 0.881 **** | 0.674 * | |
| P. balsamifera | 14 | (8) | 0.828 **** | 0.595 ** | 0.824 **** | 0.692 * | |
* p < 0.05; ** p < 0.01; *** p < 0.001; **** p < 0.0001.
Table 2.
Linear correlation coefficients (r2) between canopy-level optical indices NDVI, PRI, CCI and Fs for evergreen (a) and deciduous (b) species. Data points from the spring transition in 2016 for P. glauca and P. mariana were excluded from analyses.
Table 2.
Linear correlation coefficients (r2) between canopy-level optical indices NDVI, PRI, CCI and Fs for evergreen (a) and deciduous (b) species. Data points from the spring transition in 2016 for P. glauca and P. mariana were excluded from analyses.
| Species | n | NDVI | PRI | CCI | |
|---|---|---|---|---|---|
| b) | P. mariana | 14 | 0.001 | 0.873 **** | 0.799 **** |
| P. banksiana | 14 | 0.642 *** | 0.827 **** | 0.885 **** | |
| P. glauca | 14 | 0.104 | 0.900 **** | 0.854 **** | |
| a) | L. laricina | 9 | 0.590 * | 0.601 * | 0.707 ** |
| P. tremuloides | 9 | 0.501 * | 0.393 | 0.471 * | |
| P. balsamifera | 9 | 0.763 ** | 0.710 ** | 0.696 ** |
* p < 0.05; ** p < 0.01; *** p < 0.001; **** p < 0.0001.
© 2017 by the authors. Licensee MDPI, Basel, Switzerland. This article is an open access article distributed under the terms and conditions of the Creative Commons Attribution (CC BY) license (http://creativecommons.org/licenses/by/4.0/).
Share and Cite
MDPI and ACS Style
Springer, K.R.; Wang, R.; Gamon, J.A. Parallel Seasonal Patterns of Photosynthesis, Fluorescence, and Reflectance Indices in Boreal Trees. Remote Sens. 2017, 9, 691. https://doi.org/10.3390/rs9070691
AMA Style
Springer KR, Wang R, Gamon JA. Parallel Seasonal Patterns of Photosynthesis, Fluorescence, and Reflectance Indices in Boreal Trees. Remote Sensing. 2017; 9(7):691. https://doi.org/10.3390/rs9070691
Chicago/Turabian StyleSpringer, Kyle R., Ran Wang, and John A. Gamon. 2017. "Parallel Seasonal Patterns of Photosynthesis, Fluorescence, and Reflectance Indices in Boreal Trees" Remote Sensing 9, no. 7: 691. https://doi.org/10.3390/rs9070691
Note that from the first issue of 2016, this journal uses article numbers instead of page numbers. See further details here.