Assessment and Improvement of MISR Angstrom Exponent and Single-Scattering Albedo Products Using AERONET Data in China


1
State Key Laboratory of Remote Sensing Science, Institute of Remote Sensing and Digital Earth, Chinese Academy of Sciences, Beijing 100101, China
2
University of the Chinese Academy of Sciences, Beijing 100049, China
3
School of Computer and Information Engineering, Henan University, Kaifeng 475004, China
*
Authors to whom correspondence should be addressed.
Remote Sens. 2017, 9(7), 693; https://doi.org/10.3390/rs9070693
Submission received: 25 April 2017
/
Revised: 22 June 2017
/
Accepted: 3 July 2017
/
Published: 5 July 2017
(This article belongs to the Section Atmospheric Remote Sensing)
Abstract
:Mapping the components, size, and absorbing/scattering properties of particle pollution is of great interest in the environmental and public health fields. Although the Multi-angle Imaging SpectroRadiometer (MISR) can detect a greater number of aerosol microphysical properties than most other spaceborne sensors, the Angstrom exponent (AE) and single-scattering albedo (SSA) products are not widely utilized or as robust as the aerosol optical depth (AOD) product. This study focused on validating MISR AE and SSA data using AErosol RObotic NETwork (AERONET) data for China from 2004 to 2014. The national mean value of the MISR data (1.08) was 0.095 lower than that of the AERONET data. However, the MISR SSA average (0.99) was significantly higher than that of AERONET (0.89). In this study, we developed a method to improve the AE and SSA by narrowing the selection of MISR mixtures via the introduction of the following group thresholds obtained from an 11-year AERONET dataset: minimum and maximum values (for the method of MISR_Imp_All) and the top 10% and bottom 10% of the averaged values (for MISR_Imp_10%). Overall, our improved AE values were closer to the AERONET AE values, and additional samples (MISR_Imp_All: 28.04% and 64.72%, MISR_Imp_10%: 34.11% and 73.13%) had absolute differences of less than 0.1 and 0.3 (defined by the expected error tests, e.g., EE_0.1) compared with the original MISR product (18.46% and 50.23%). For the SSA product, our method also improved the mean, EE_0.05, and EE_0.1 from 0.99, 16.13%, and 56.45% (MISR original product) to 0.96, 40.32%, and 70.97% (MISR_Imp_All), and 0.94, 54.84%, and 90.32% (MISR_Imp_10%), respectively.
1. Introduction
In China, rapid development and urbanization has led to severe haze pollution. However, the haze formation mechanism is still unclear because of the variety of precursor pollutants from natural and anthropogenic sources. Yang et al. concluded that the fine particulate matter (PM2.5) present in most Chinese megacities is dominated by secondary aerosols, including sulfates, nitrates, and ammonium originating from local formation/production and regional transport [1]. Li et al. demonstrated that the summer haze in northern China is usually caused by abundant organic matter and black carbon emitted by agricultural biomass burning [2]. Wang et al. found that increases in spring dust in Beijing are derived from soils and caused by construction [3]. To date, numerous epidemiological studies have associated China’s high levels of PM2.5 with cardiovascular diseases [4], ischemic heart diseases, lung cancer [5], and obstructive pulmonary disease [6]. Studies have focused on the adverse health effects caused by the total particle mass concentration, and the different toxicities related to the components, sizes, and absorbing properties of particle pollution have also been well investigated [7]. For example, by comparing two highly exposed groups of healthy adults in Beijing, the elemental components of PM2.5, including Si, Al, Ca, and Ti, were shown to have effects on lung function that had not been previously observed in analyses of particle levels alone [8]. Compared with PM2.5, an increase in the concentration of ultrafine particles (with diameters of 0.25~0.50 μm) shows a greater correlation with total and cardiovascular mortality [9].
The particles within the haze usually range in diameter from 0.001 μm to 10 μm and present different absorbing/scattering characteristics. Therefore, mapping the quantitative distribution of aerosol optical properties represents an effective strategy for apportioning the source of PM2.5 and evaluating the corresponding health effects. The aerosol optical depth (AOD) represents the integral of the extinction coefficient along the vertical path from the surface to outer space [10]. The Angstrom exponent (AE) and single-scattering albedo (SSA) are two useful parameters for assessing the particle size and absorbing/scattering properties of atmospheric aerosols [11], as well as the aerosol composition [12,13]. For example, aerosol mixtures dominated by dust absorption have monotonically increasing SSA with wavelength, whereas those dominated by black carbon absorption have monotonically decreasing SSA spectra, providing additional information on the composition of these aerosol mixtures [14]. The absorption Angstrom exponent (AAE) values are near 1 for AERONET-measured aerosol columns dominated by urban-industrial aerosol, are larger for biomass burning aerosols, and are the largest for Sahara dust aerosols [15]. Although the ground-based AErosol RObotic NETwork (AERONET) can measure the total-column AOD, AE, and SSA, the spatial coverage is very coarse. Satellite remote sensing is capable of filling in the gaps of ground-based observations; for example, the Moderate Resolution Imaging SpectroRadiometer (MODIS) on board the Terra and Aqua satellites has provided consistent and high-quality aerosol data for more than one decade, and the retrieved AOD is within an error range of ±0.05 ± 0.15 [16]. However, many sensors similar to MODIS cannot capture the variability within the ground-truth particle size and absorbing/scattering properties [17,18]. MODIS usually misidentifies the aerosol dominated by coarse particles during dust events. As the successor to MODIS, the Visible Infrared Imaging Radiometer Suite (VIIRS) AE has been preliminary validated and demonstrates a limited ability to retrieve size parameters over land [19]. In addition, MODIS and VIIRS cannot provide a quantitative estimate of the SSA with their standard aerosol products.
Since its launch in 1999, the Multi-angle Imaging SpectroRadiometer (MISR) sensor has proven to be as powerful as MODIS for the study of long-term spatial and temporal trends of aerosol optical properties and compositions [20,21]. MISR observes the atmosphere through effective path lengths ranging from one to three and through scattering angles of approximately 60° to 160° in the mid-latitudes. The unique multi-angle design of the MISR allows it to provide additional aerosol microphysical properties, such as the AE, SSA, and aerosol components, compared with other spaceborne sensors. This information has been shown to be highly effective in strengthening the association between the AOD and ground level PM2.5 and its component concentrations [22,23]. Previous research has shown that AOD values obtained by the MISR and the powerful empirical orthogonal function (EOF) retrieval algorithm are consistent with ground observations and present a retrieval error of or [24].
However, the MISR aerosol model also has limitations [25], and the 74 aerosol mixtures cannot provide a description of global conditions. For example, the climatology of MISR Version 22 lacks spherical absorbing particles, as well as mixtures containing both spherical absorbing smoke analogs and non-spherical dust [24]. Moreover, compared with the MODIS Dense Dark Vegetation (DDV) algorithm, which defines the prior aerosol optical properties using statistics from AERONET observations, MISR selects mixtures based on a set of chi-squared statistical tests, but does not correct them using prior knowledge. If many conflicting mixtures successfully pass the retrieval criteria, aerosol-type information retrieval is usually much poorer despite the robust AOD [26]. Liu et al. reported an approximately 20% uncertainty in MISR-retrieved aerosol microphysical properties when distinguishing light-absorbing and non-light-absorbing aerosols [27]. Li et al. found that MISR Version 22 data could not effectively distinguish between dust and water-soluble particles in the Chinese Taklimakan Desert and can lead to a low proportion of dust AOD [26].
The MISR aerosol parameters AE and SSA have not been as widely investigated as the AOD. To the best of our knowledge, previous studies have not specifically focused on comparing and improving long-term MISR AE and SSA data with AERONET in China. Our current analysis aims to assess and improve the quality of MISR AE and SSA data for China over a long time frame. The remainder of this paper is organized as follows. Section 2 describes the ground-based and satellite data products that are involved in this analysis, as well as the constraining methods. Section 3 validates both the standard MISR product and our results using 11 years of AERONET observations. Finally, Section 4 summarizes the major findings and potential future improvements of the current analysis.
2. Materials and Methods
2.1. MISR Aerosol Product
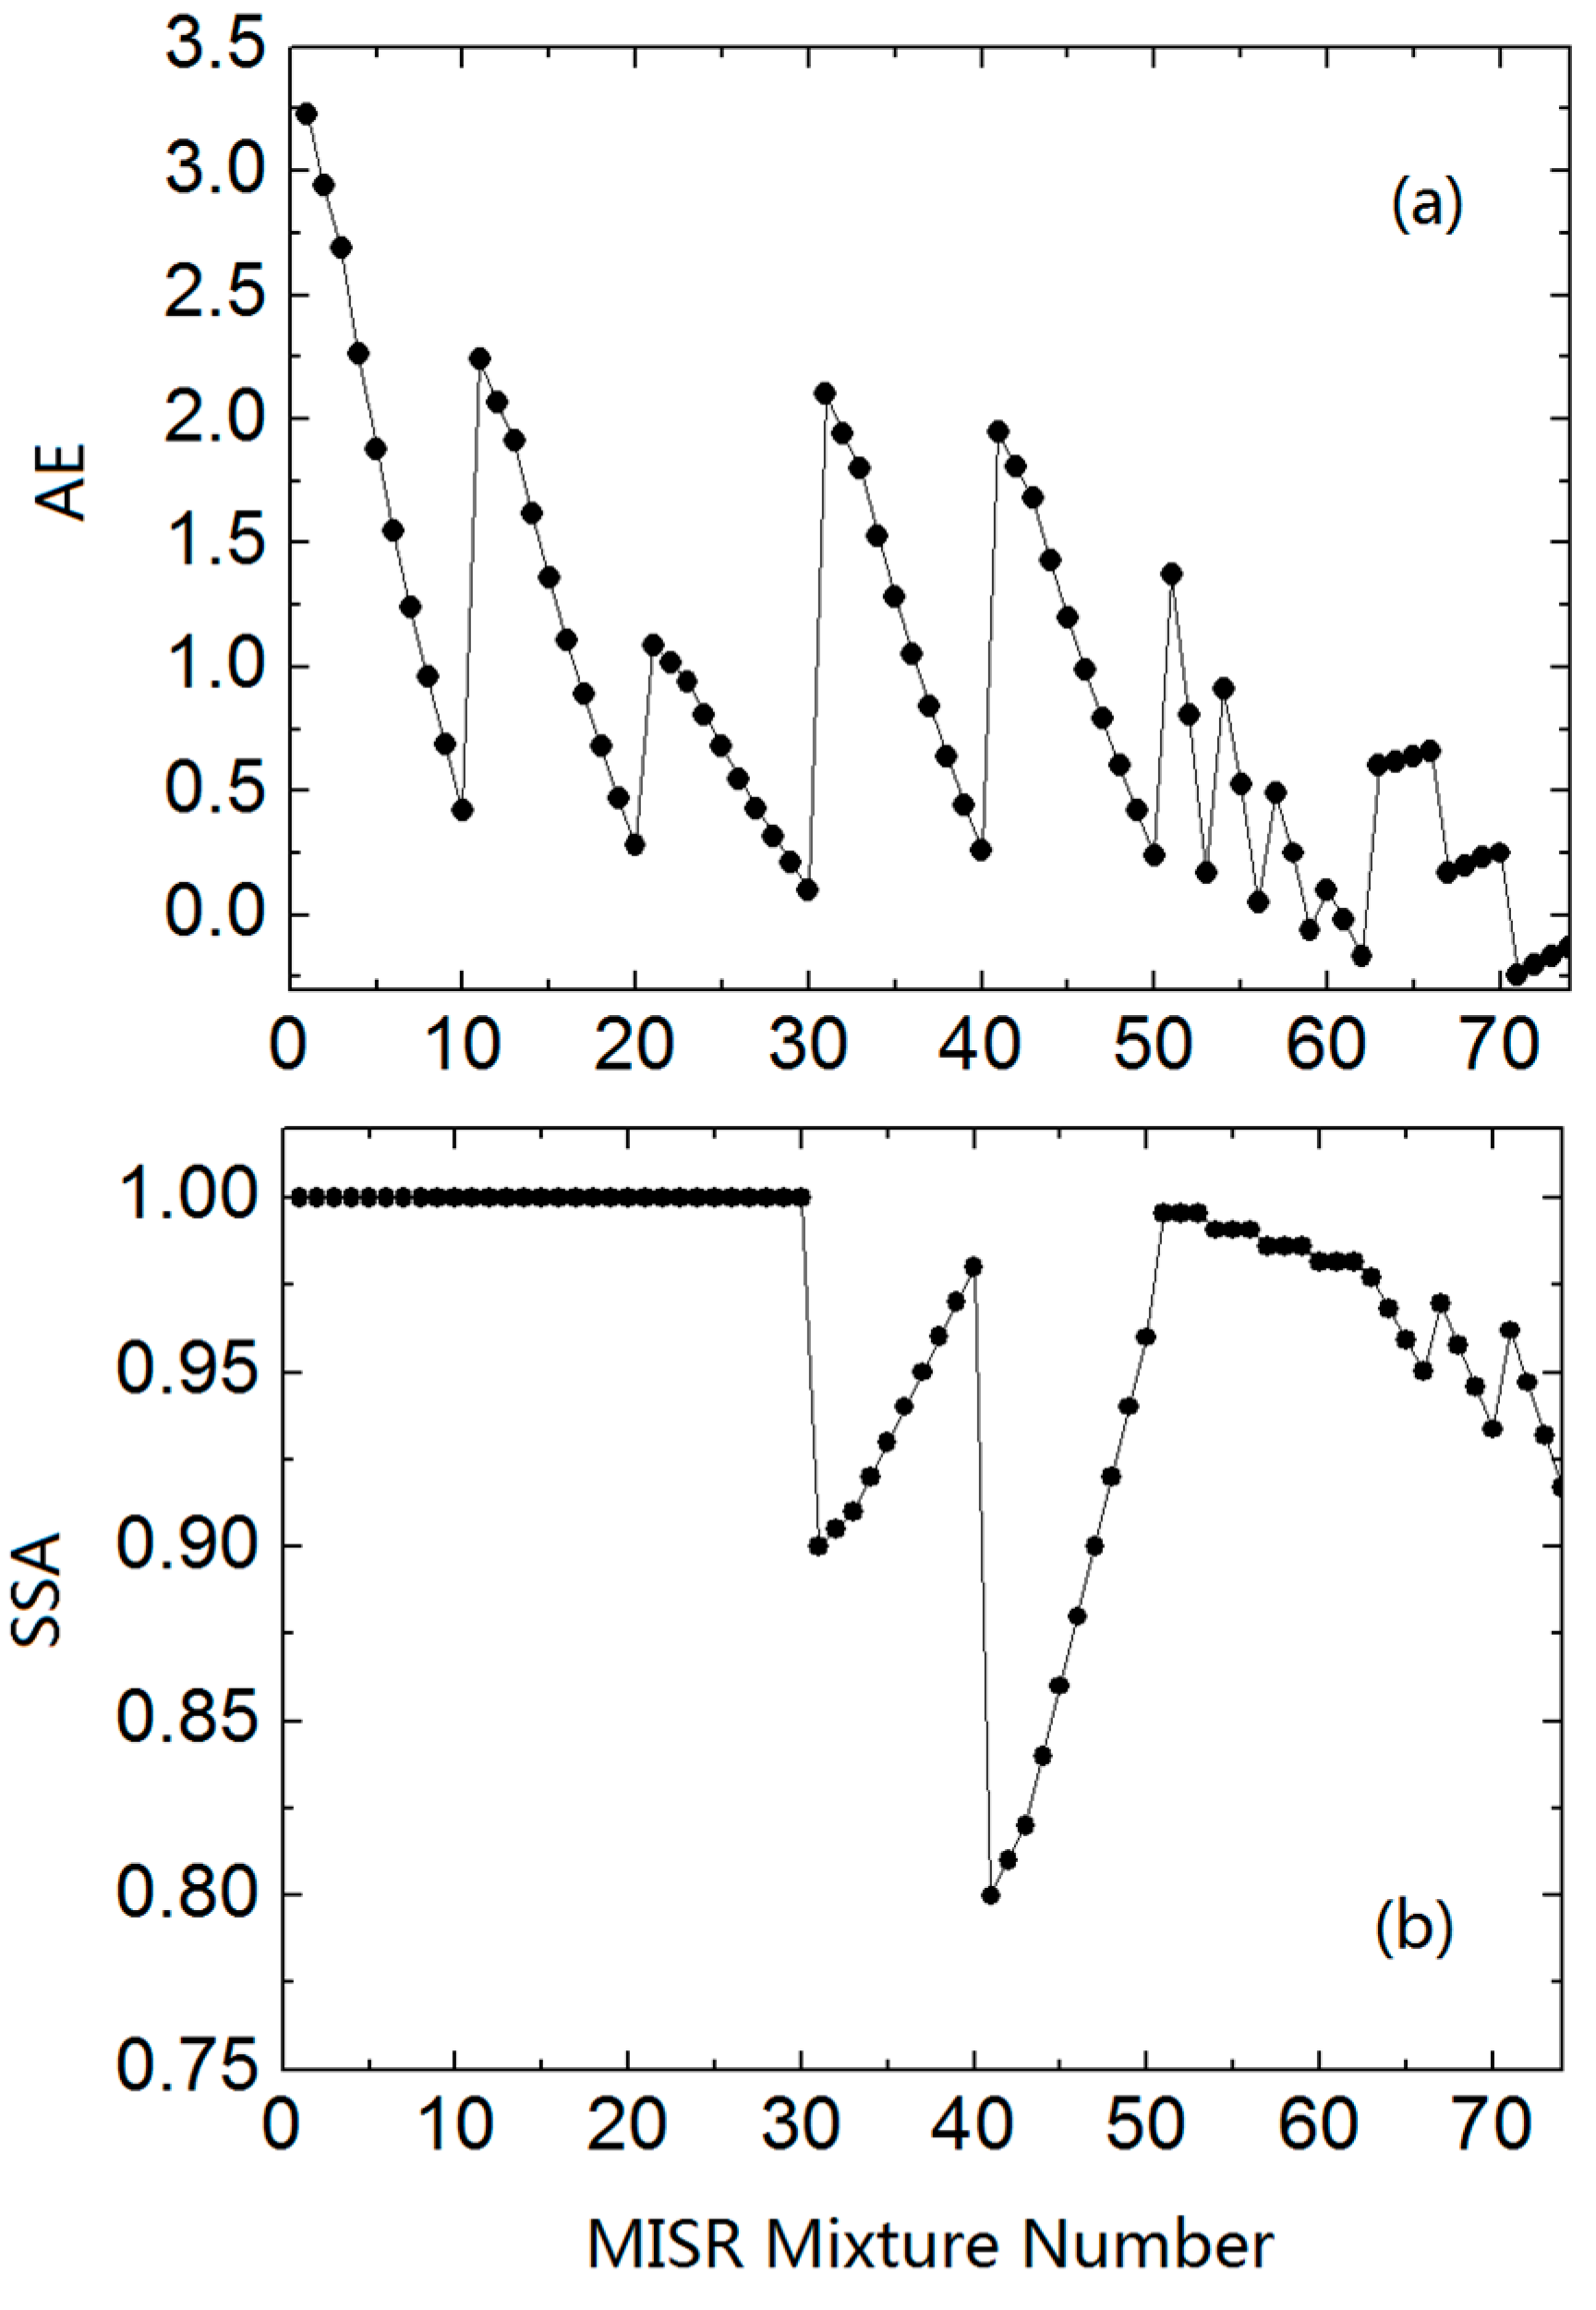
The MISR EOF algorithm uses 74 aerosol mixtures to represent the global aerosol model. Each mixture is composed of two or three out of eight pure components that constitute a different combination of the particle radius, shape, brightness, etc. [24]. The particle sizes are differentiated into broad groups of small, medium, and large particles, and the particle shape is differentiated into spherical vs. non-spherical groupings, both of which are correlated with the AE. The brightness is expressed in terms of the SSA. The AE and SSA values of each of the 74 aerosol mixtures are listed in a “mixture data” table delineated by the “Angstrom exponent” and “Mixture spectral single-scattering albedo” parameters. As shown in Figure 1, the values of the MISR AE range from −0.24 to 3.23, whereas those of the MISR SSA range from 0.8 to 1. The MISR EOF algorithm also sets chi-squared values to determine whether a mixture fits the tests. The successfully passed mixtures and the corresponding AOD values at 558 nm are reported as the “AerRetrSuccFlagPerMixture” and “OptDepthPerMixture” parameters, respectively.
In this approach, the most recent MISR Version 22 Level 2 aerosol data for China from 2004 to 2014 were downloaded from the MISR Data Center (http://eosweb.larc.nasa.gov). The MISR aerosol product has a spatial resolution of 17.6 km and a repeat coverage of approximately two to nine days in China. The MISR provides two groups of values for aerosol properties (i.e., AOD and ANG) with the prefixes of “RegBestEstimate” and “RegLowestResid”, and these values are calculated from all mixtures that pass the goodness-of-fit tests and mixtures with the smallest chi-square values, respectively [28]. Previous validation studies in the United States have suggested that the MISR “RegBestEstimate” and “RegLowestResid” parameters demonstrate similar performances for the AOD, AE, and absorbing AOD (calculated using the AOD and SSA) [26,29]. For the purpose of this approach, the MISR parameters “RegBestEstimateAngstromExponent” and “RegBestEstimateSSA” were used to derive the AE and SSA values. Particle properties should only be used when the “RegBestEstimate” AOD is above a configurable threshold, which is set to 0.15.
2.2. AERONET Observations
The AERONET is a global network of sun and sky-scanning radiometers that are designed to measure aerosol and radiative properties over long time periods, thereby providing ground validation for satellite sensors [30]. AERONET Level 2.0 data for China were downloaded from the program website (http://aeronet.gsfc.nasa.gov/). Compared with the AERONET AE, which can be calculated from direct (collimated) solar radiation, the SSA is retrieved from almucantar scans of radiance. More precisely, SSA retrievals require that the solar zenith angle is larger than 50° and the AOD at 440 nm is greater than 0.4. Perturbations of the inversion of aerosol optical properties resulting from random errors, instrumental offsets, and known uncertainties in the atmospheric radiation model were analyzed by Dubovik et al. [31]. During the period from 2004 to 2014, 27 AERONET sites were operational in China with AE Level 2.0 data (evaluated between 440 and 870 nm), although only 20 sites retrieved SSA data. AERONET AE and SSA data within three-hour windows relative to the MISR time steps (10:30 a.m., UTC time) were averaged and matched to a 50 km grid for the MISR validation.
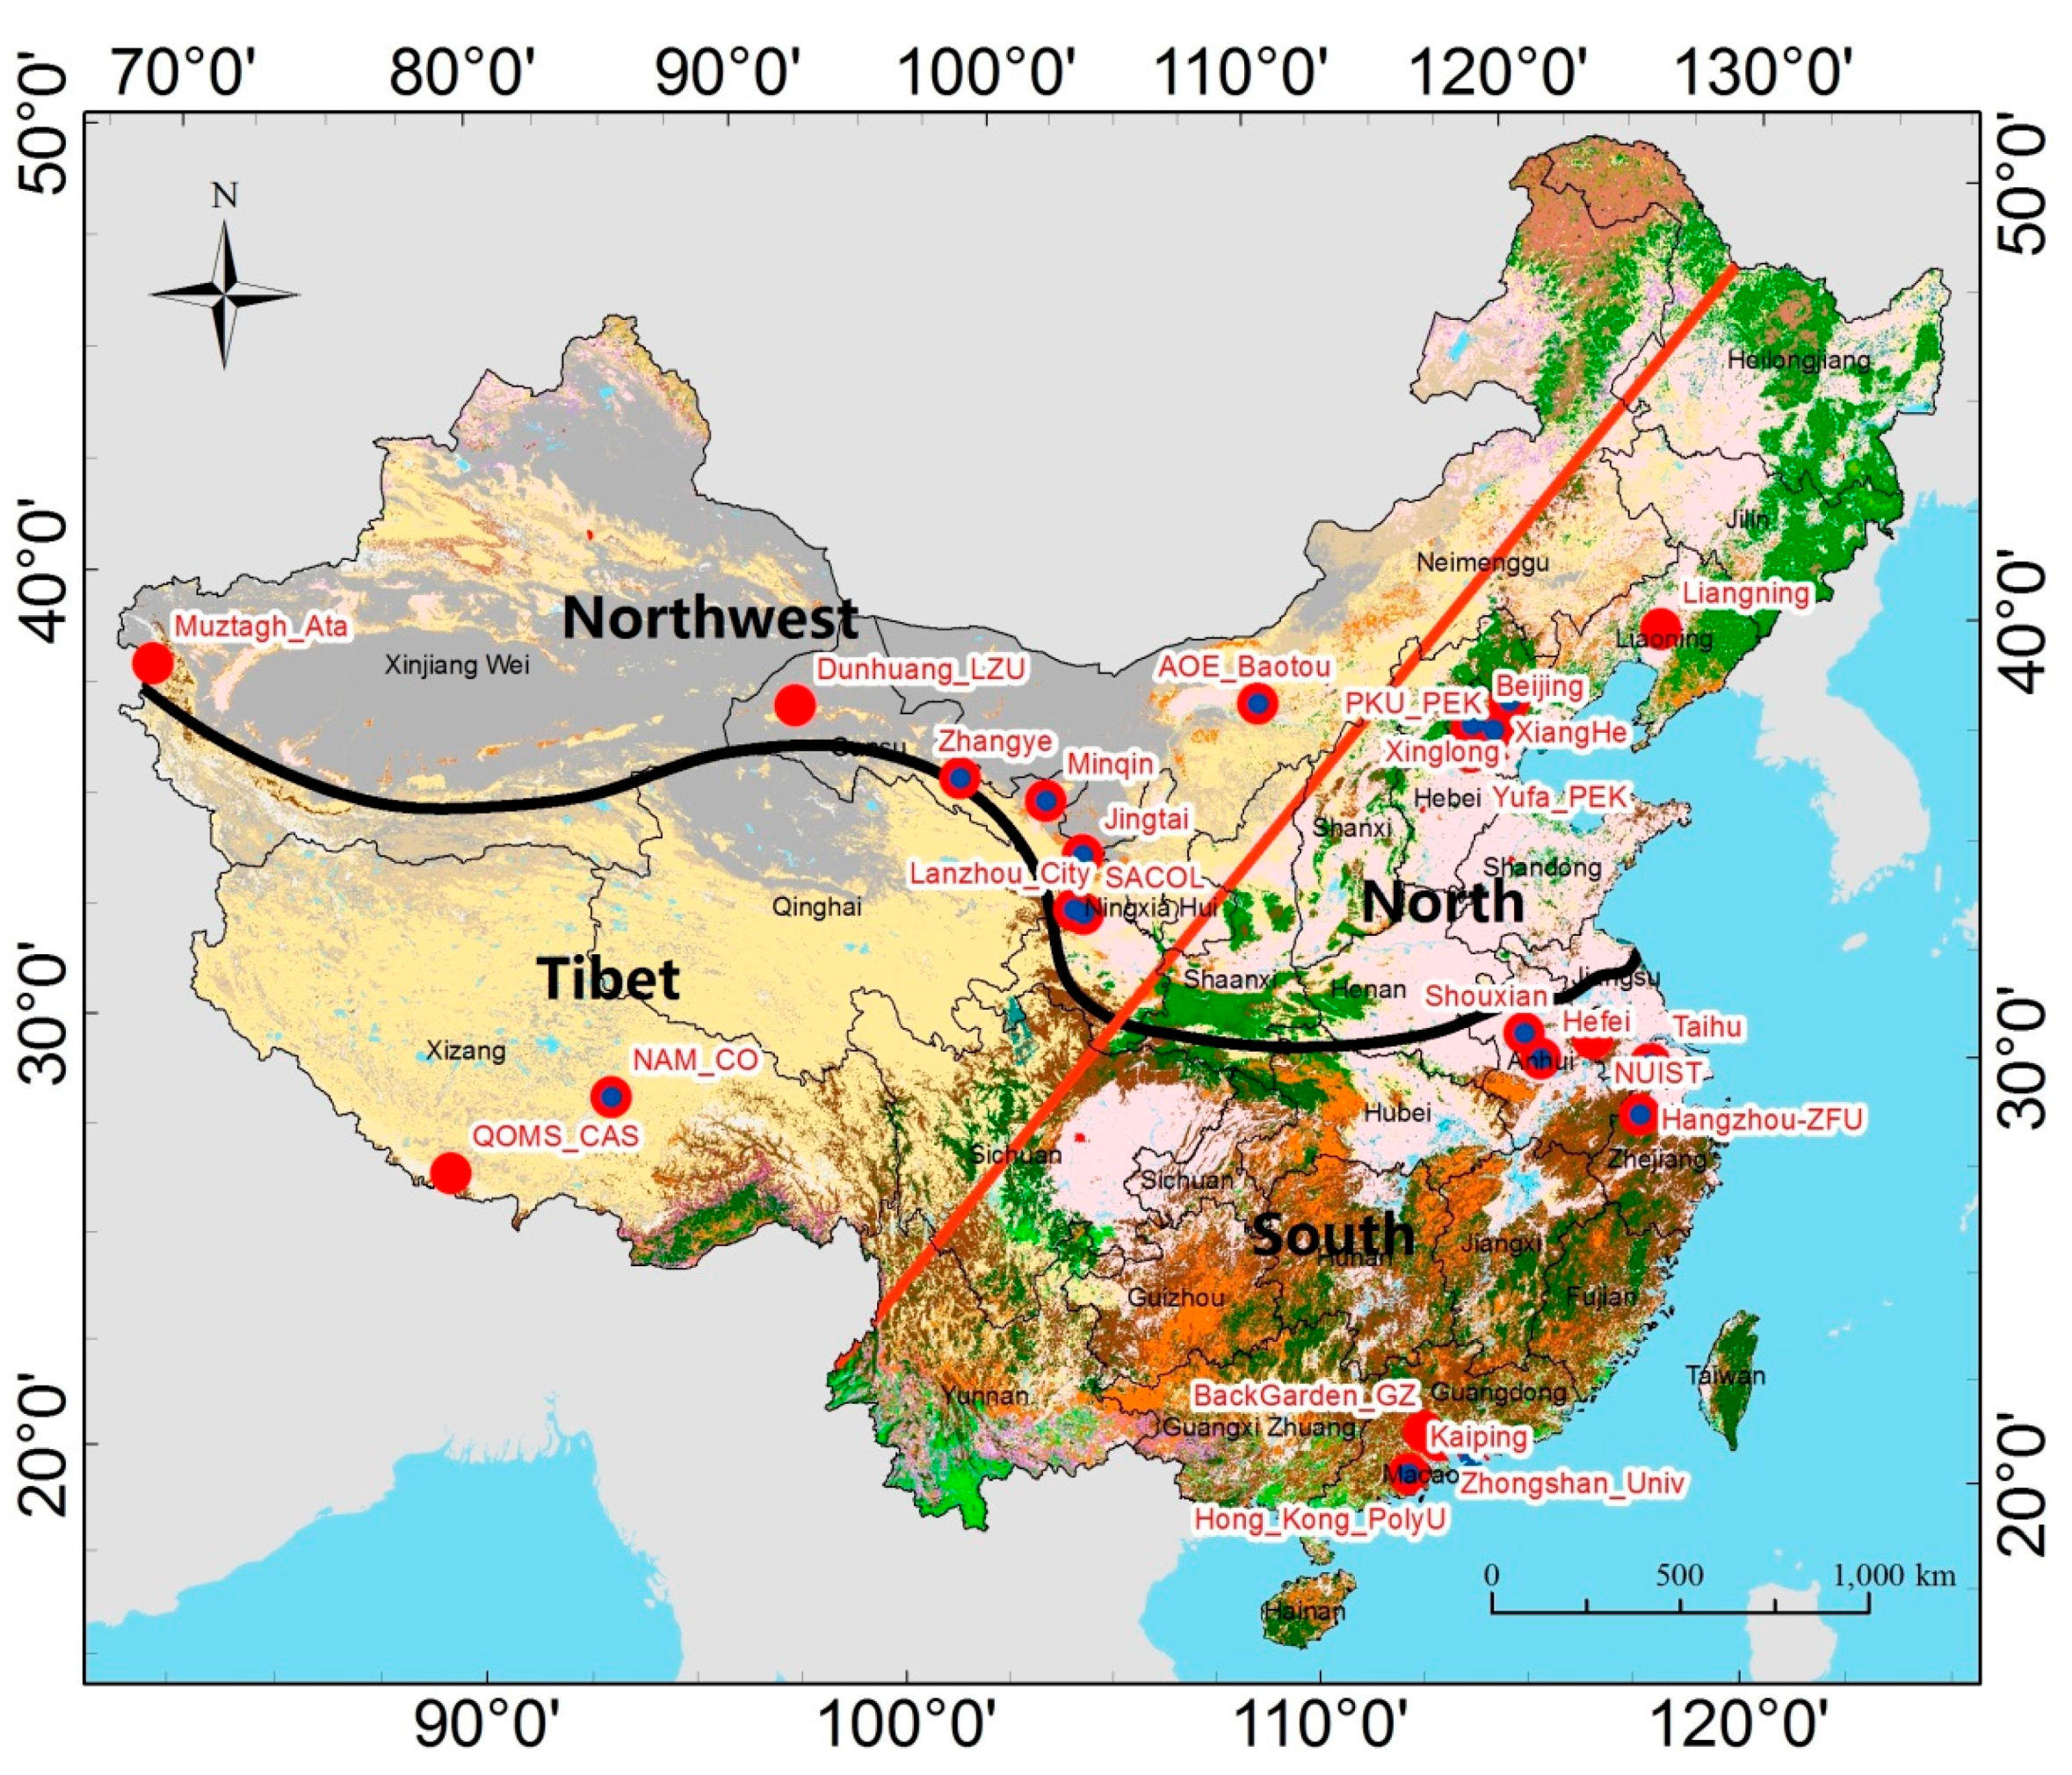
To extract the statistics of the aerosol optical properties from the geographical patterns, this study employed the classic Heihe-Tengchong Line (roughly corresponding to the red line in Figure 2) and the Kunlun/Qinling Mountain-Huaihe River line (black line in Figure 1) to divide China into four main regions: North, South, Northwest, and the Qinghai-Tibetan Plateau (Tibet hereafter). As shown in Figure 2, the spatial distribution of AERONET sites in the four regions exhibits a geographical inhomogeneity; taking AE as an example, most AERONET sites are concentrated in developed/polluted regions such as Beijing and its surrounding areas (six sites, belonging to the North), the Yangtze River Delta (five sites, belonging to the South), and the Pearl River Delta region (six sites, belonging to the South). Only two sites are located within the sparsely populated Tibet region.
2.3. Constraining MISR Mixtures with the AERONET Data
As previously mentioned, the MISR lacks sufficient mixtures under specific conditions. To resolve this problem, new aerosol models must be imported and the EOF code must be followed. The MISR scientific algorithm includes 256 mixtures, and each contains additional aerosol information (up to four individual aerosol components) [32]. Moreover, because the MISR does not employ any a priori spatial or temporal aerosol optical properties upon data retrieval, it shows large uncertainties when too many of the mixtures satisfy the retrieval criteria. In this approach, we propose exploring the feasibility of using AERONET-measured aerosol optical properties as a priori information for the MISR’s aerosol mixture selection process in China. This process does not require the reconstruction of the MISR look-up table. Instead, we use ground-observed “AE” and “SSA” data to constrain the MISR mixture selection process as reported in the V22 operational information.
In practice, we narrow the MISR’s aerosol mixture selections using the following two functions:
where and represent the minimum and maximum values for the AERONET AE, respectively, and and are the corresponding boundary values for the AERONET SSA. The new MISR AE and SSA values can be recalculated from these mixtures upon passing both goodness-of-fit tests and our boundary thresholds. The errors of our method are primarily introduced because of the selection of AERONET minimum and maximum values for AE and SSA data, which will be discussed in later sections.
3. Results and Discussion
3.1. Validation of MISR AE
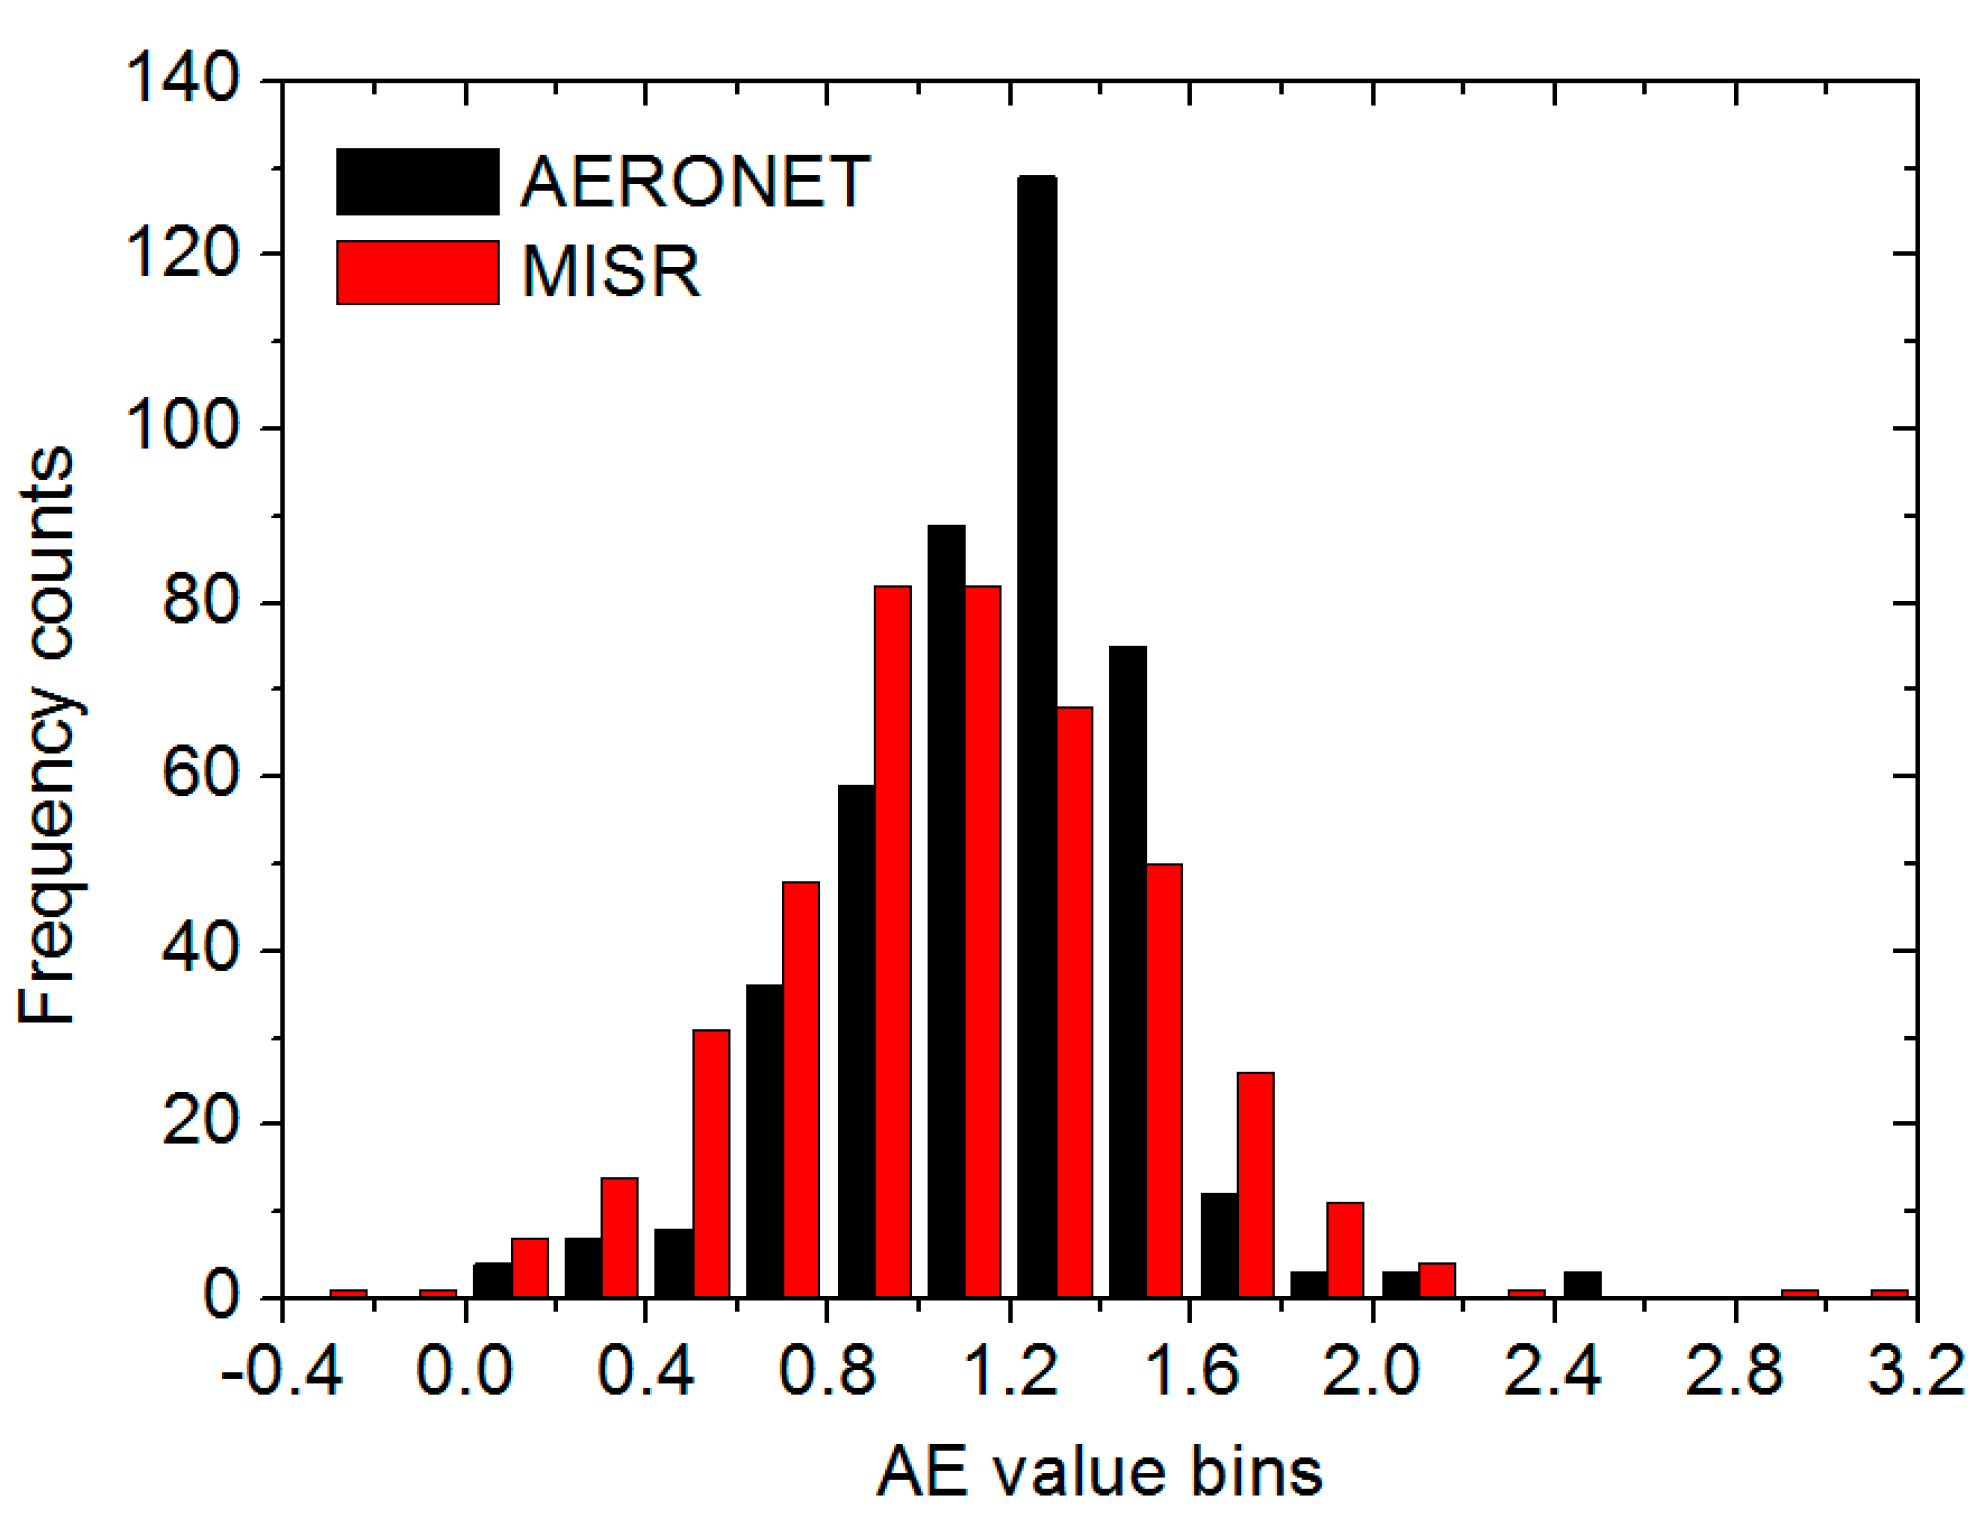
Histograms showed that AERONET and MISR AE values exhibited similarly normal distributions (Figure 3). However, the MISR AE data range (Min: −0.24; Max: 3.03) was wider than that of AERONET (Min: 0.017; Max: 2.58). The MISR AE values (Mean: 1.08; SD: 0.43) were 0.09 0.43 lower than the AERONET AE values (Mean: 1.17; SD: 0.34). Empirical findings have established that AE values greater than two indicate small particles associated with combustion byproducts and values less than one indicate large particles, such as sea salt and dust [33]. In this analysis, we utilized expected error (EE) tests to calculate the percentage of MISR records located between the absolute differences (|MISR-AERONET|) of the total samples. Overall, 18.46% and 50.23% of the MISR AE values were within the absolute differences of 0~0.1 (EE_0.1 hereafter) and 0~0.3 (EE_0.3 hereafter), respectively, in China for the period from 2004 to 2014. A national seasonality analysis (Table 1) shows that the mean AE observed by AERONET is lowest in the spring (1.04) and highest in the fall (1.31). The same seasonal characteristics were also reported by Kang et al., although their study domain was the urban-industrial megacity of Nanjing [34], and the similarities may be related to the springtime dust that occurs in both the Northwest and North. In the fall, the air in most regions of China is relatively clean and less affected by dust transport compared with other seasons. The MISR captured the coarse particles (AE: 0.98) and thus exhibited the best performance in spring with the smallest difference (−0.054). The EE test shows that 25.2% and 60.63% of MISR AE samples were located within the absolute difference of 0~0.1 and 0~0.3 for spring, respectively. From summer to winter, the variation trend of the MISR mean AE values (summer: 1.12; fall: 1.1; winter: 1.14) was gentler than the trend for the AERONET mean AE values (summer: 1.21; fall: 1.31; winter: 1.18). The MISR AE significantly underestimated the AERONET AE in the fall; thus, only 13.89% of the MISR samples were within the absolute difference of 0~0.1. Geographically, 289 MISR-AERONET matched records were available for the North and accounted for 67.52% of the total samples (N: 428). However, AERONET observations in the Northwest (N: 10) and Tibet (N: 33) were scarce. The lowest AERONET AE values were observed in the Northwest (1), followed by the North (1.14), the South (1.23), and the Tibet (1.34) regions, all of which were strongly correlated with the levels of coarse dust particles. Che et al. analyzed the relationship between AE/AOD at Lin’an, Shangdianzi, and Longfengshan from January 2006 to December 2007, and the AE values for Shangdianzi (0.8~1.15) and Longfengshan (0.8~1.3) were comparable to our AE values for the North [35]. The AE mean value from September 2007 to August 2008 at AERONET-observed stations in Nanjing (), which is a representative of the South, was also consistent with our results [34]. The minimum MISR-AERONET difference (−0.023) occurred in the South, and 22.92% and 61.46% of the MISR samples were located within the absolute differences of 0~0.1 and 0~0.3, respectively. The MISR AE average (0.48) was lower than the AERONET AE average (1.34) by a factor of three in Tibet, and the EE tests for this region (EE_0.1: 6.06%; EE_0.3: 15.15%) had the poorest results, which may have been related to the AOD in Tibet, which is the lowest in the entire country, resulting in poor AE retrievals because of less particle property information in the MISR radiances [36].
3.2. Validation of MISR SSA
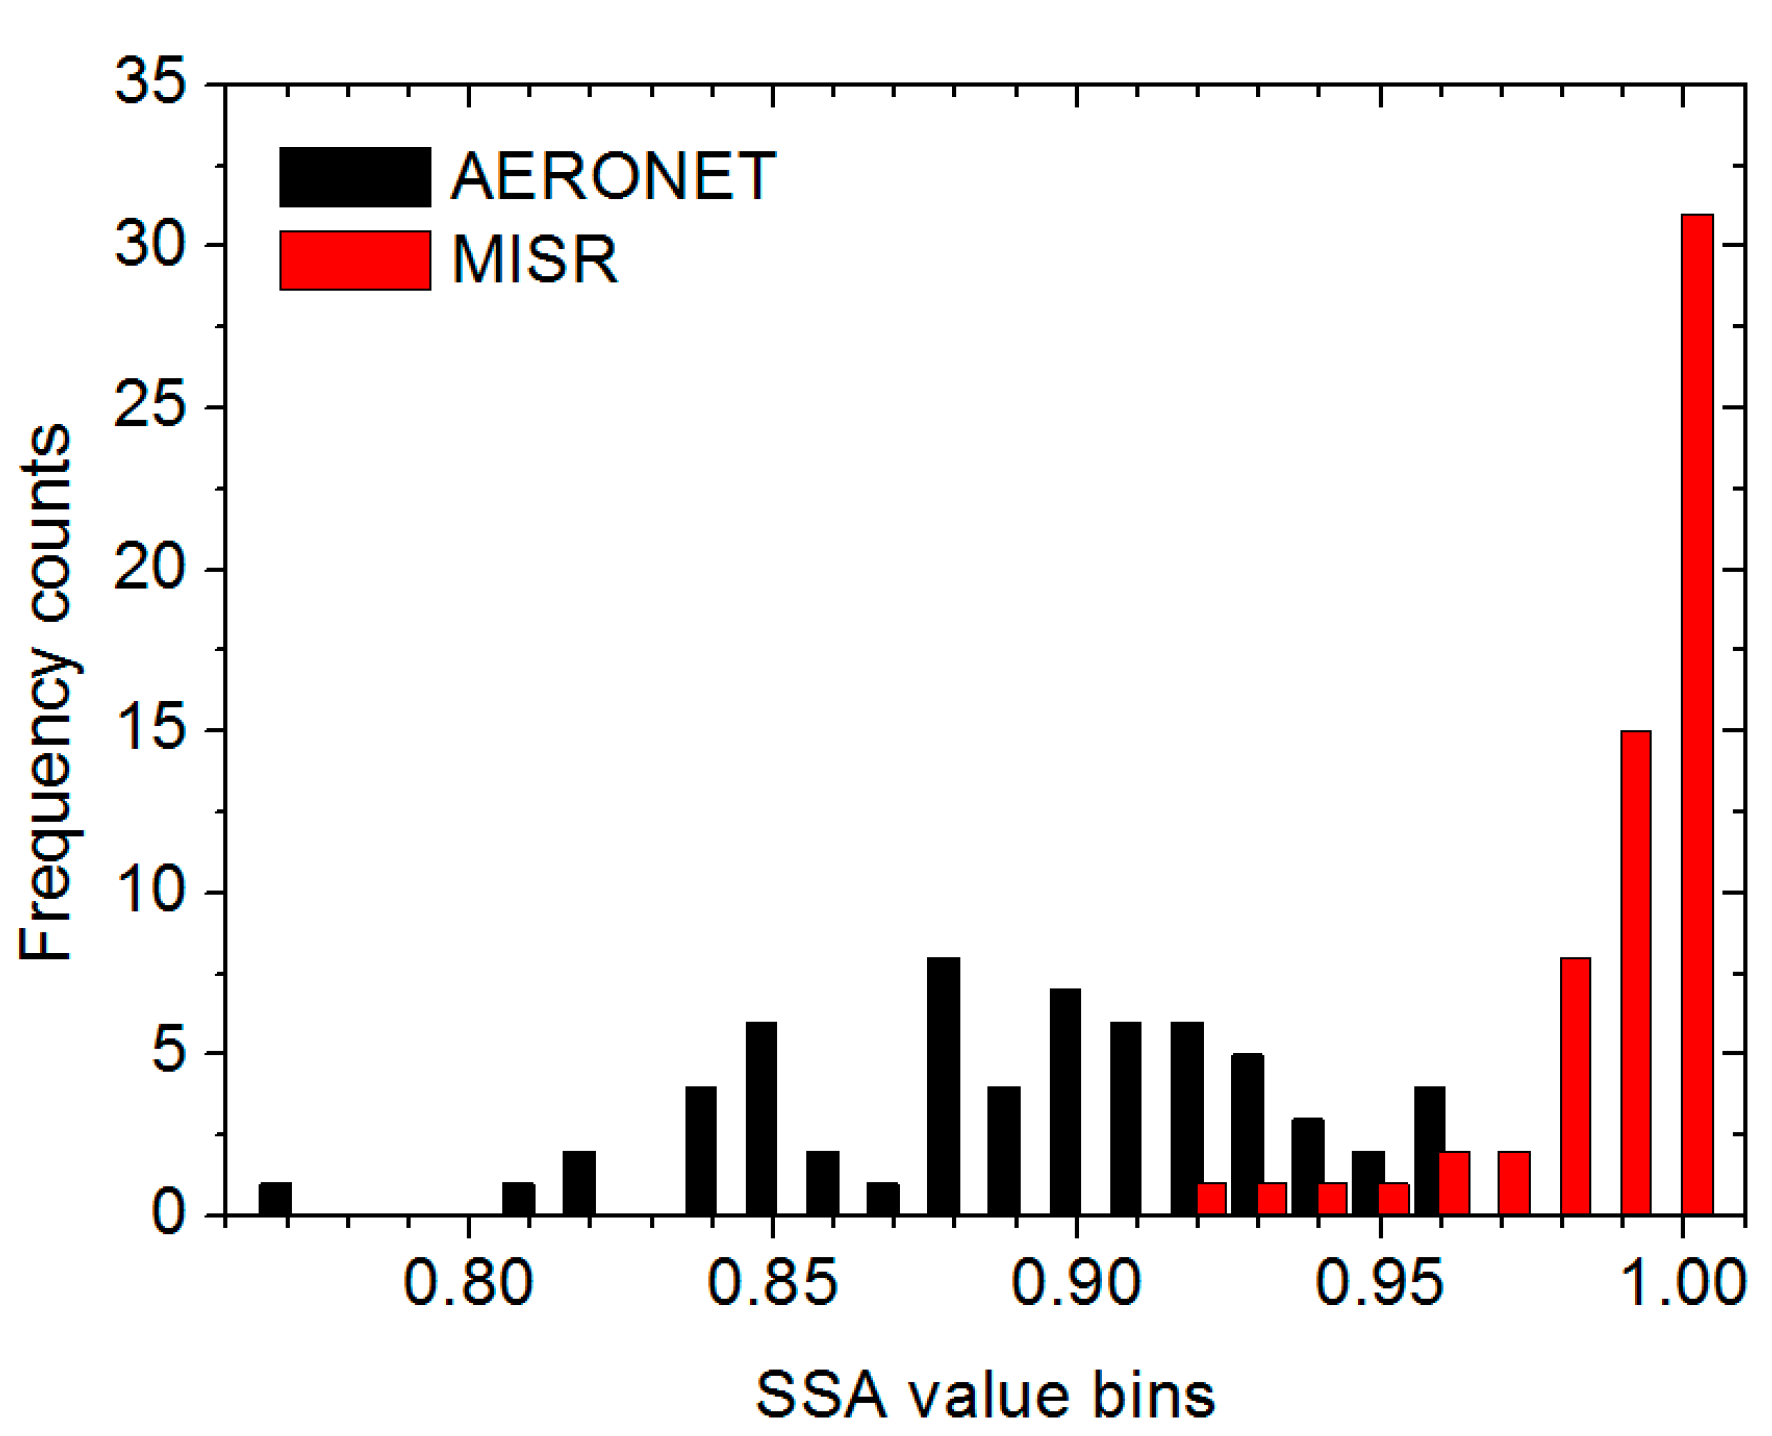
Histograms showed that the MISR and AERONET SSA values exhibited completely different distributions (Figure 4). The AERONET SSA displayed a normal distribution with a range of 0.77 to 0.96, whereas the MISR SSA presented an approximate exponential distribution, with many values close to 1.0. Because of the threshold of the operational revised SSA, only 62 MISR-AERONET SSA records were matched, one-half of the MISR samples (31) were equal to 1.0, and only four MISR samples were lower than 0.96 (the maximum for the AERONET SSA data), as shown in Table 2. These findings suggest that more than 93.55% (58/62) of the MISR SSA values had a positive bias. As a result, the MISR mean SSA (0.99) was significantly larger than the AERONET mean SSA (0.89), and the difference reached 0.096 (standard error: 0.018). The EE test also showed that only 16.13% and 56.45% of the records were located in the absolute differences of 0~0.05 and 0~0.1 envelopes, respectively. Seasonally, the AERONET SSA values were ordered (from smallest to largest) as follows: winter (0.87), fall (0.89), and spring (0.93). The emission of absorbing aerosols, such as BC and OC caused by fuel and coal burning, was likely the strongest in winter due to increases in the heating demand. For the MISR SSA, seasonal variations were not observed and all mean values were equal to 0.99. Although the minimum MISR SSA value (0.92) in Figure 4 corresponds to winter, the MISR cannot capture the absorbing aerosol (a low SSA value); thus, the largest difference of 0.11 and the lowest EE_0.1 (40.74%) values for the entire year were observed. Geographically, nearly two-thirds of the total records (41/62) were collected from the North, whereas almost no matched MISR-AERONET samples were found in western China (Northwest: 2; Tibet: 0). AERONET-observed SSA values over the Northwest and North/South were 0.93 and 0.89, respectively, and these values are consistent with the results of Bergstrom et al., who showed that the spectra of SSA in the ACE-Asia areas that were affected by pollutants sourced from dust and high degrees of urbanization varied [37]. The difference (0.098) and EE_0.05 (16.28%) in the North were slightly higher than those for the South (difference: 0.09; EE_0.05: 10.53%). The quality of the MISR SSA in certain seasons and regions (e.g., no data in summer and in Tibet) remains unclear and is under investigation because of the limited sample size. To the best of our knowledge, widely deployed ground-measure radiometers, namely, the Cimel Sun-photometer (CSPHOT) employed by AERONET and the multifilter rotating shadowband radiometer (MFRSR) [38], have been utilized to infer SSA values, and the results indicated that the SSA is sensitive to numerous assumptions, inversion algorithm input parameters, calibration uncertainties, asymmetry factor overestimations, and instrumental errors. We will conduct further investigations provided that additional ground-based sun-photometer observations are available.
3.3. Improvement of the MISR AE
As previously mentioned, the errors in our method are mainly caused by the AERONET values selected to constrain the MISR mixtures. Because the AERONET optical properties vary both temporally and spatially, the measured maximum and minimum values are different for separate seasons and regions. The use of thresholds derived from fine spatial and temporal scales (e.g., local/daily) can substantially improve our method compared with thresholds derived at a coarse scale (e.g., national/annual). However, fine-scale ground-based data are not conducive to describing the temporal and spatial characteristics of aerosol optical properties, and they are difficult to use with our method. Therefore, in this study, we constructed seasonal statistics for the four study regions. Table 3 lists the minimum and maximum AE values based on all AERONET data (AERONET_All hereafter) during the period from 2004 to 2014. Extrema obviously occurred within the 11-year dataset. For example, the minimum in the North for fall was −0.36, whereas the maximum in Tibet in winter reached 4.8. To reduce the outliers, we sorted the AERONET AE and SSA data from small to large values for a particular region and season and then averaged the values within the top 10% and the bottom 10% (AERONET_10% hereafter) to represent the maximum and minimum values, respectively (Table 3).
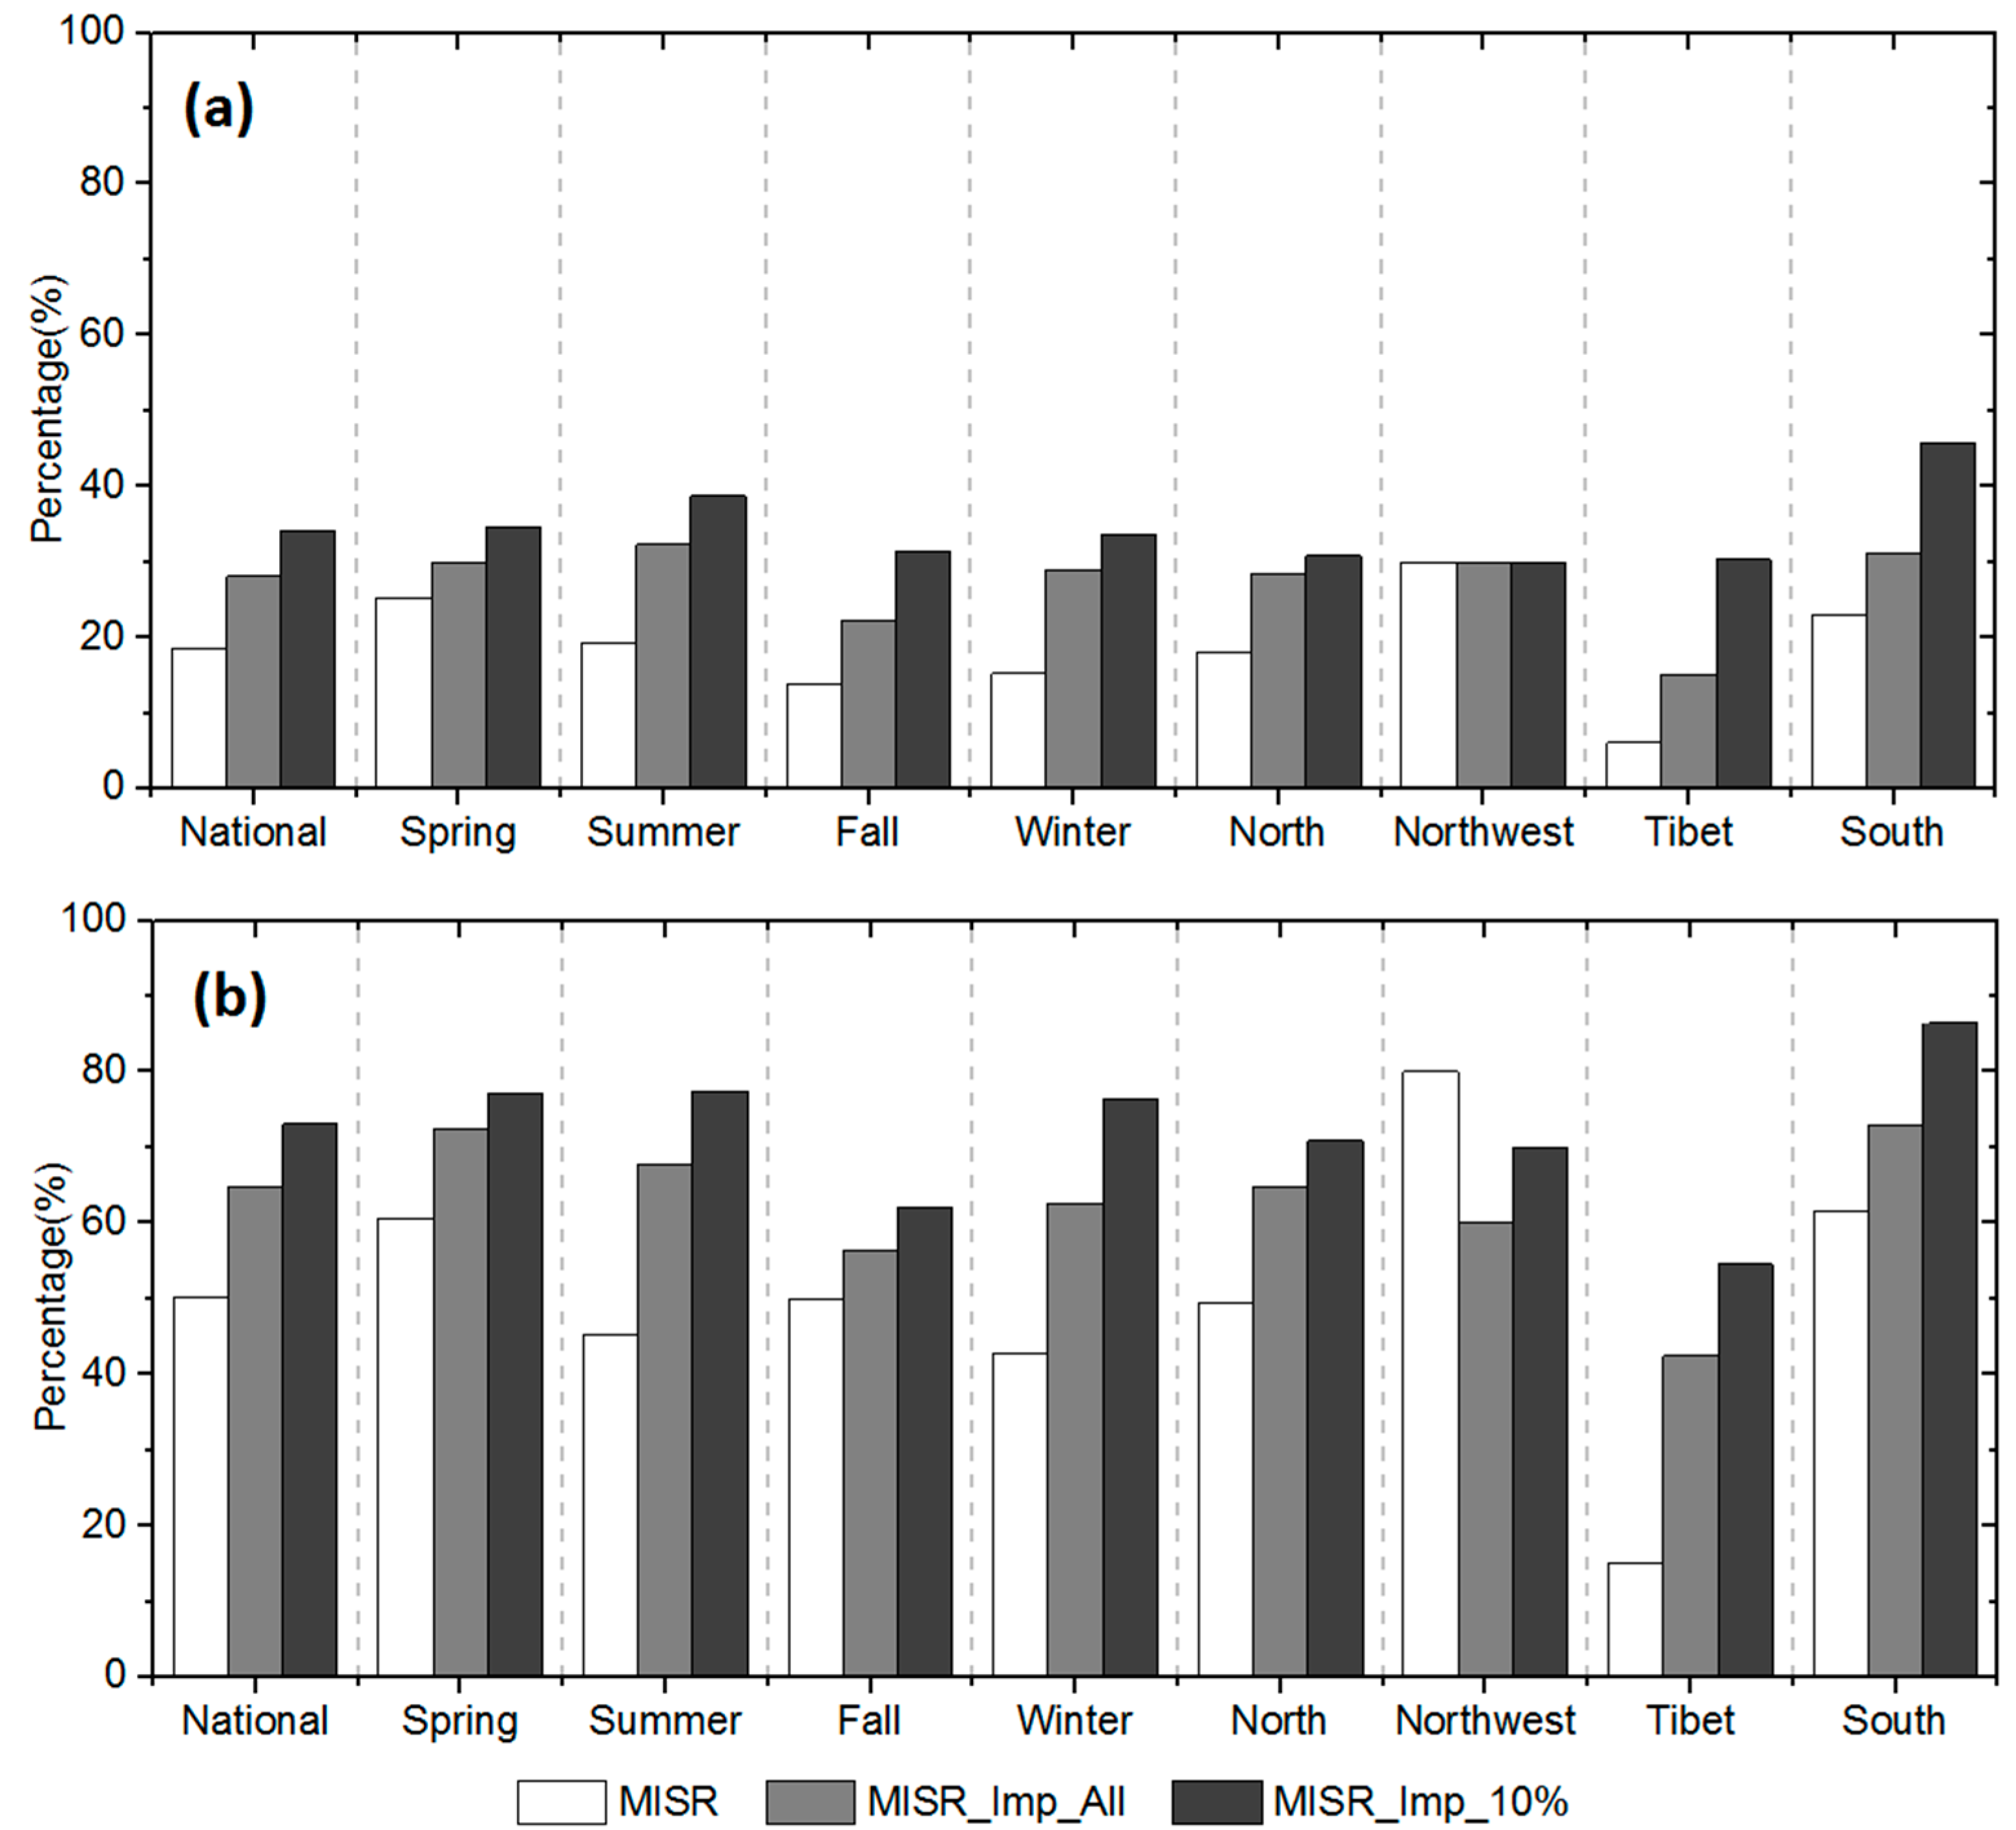
These two groups of thresholds were used as the boundary values for Equation (1), and the MISR mixtures for each pixel were then constrained and new AE values based on the passed mixtures were calculated. Similar to Table 1, Table 4 represents the statistics for our improved AE values (MISR_Imp hereafter), as well as the differences between MISR_Imp and AERONET from 2004 to 2014 for China. In Table 4, MISR_Imp_All and MISR_Imp_10% represent the improved AE constrained by the extrema (AERONET_All) and the top/bottom 10% averaged AERONET values (AERONET_10%) from Table 3, respectively. (1) For MISR_Imp_All: the national mean AE (1.13) was closer to the AERONET AE (1.17) than the original MISR product (1.08), as shown in Table 2, and the difference was low at −0.044. The EE_0.1 and EE_0.3 tests between our AE and the AERONET AE observations were improved from 18.46% and 50.23% (MISR) to 28.04% and 64.72%, respectively, as shown in Figure 5. Seasonally, the difference between our summertime results and the AERONET observations was the smallest (−0.017). Correspondingly, the EE_0.1 and EE_0.3 tests in summer were the most significantly improved among all four seasons and increased from 19.35% and 45.16% to 32.26% and 67.74%, respectively. Our analysis indicated that the minimum values presented in Table 3 prevented certain MISR mixtures with AE values below zero from being introduced to the retrieval algorithm. Consequently, the final AE is highly biased. Geographically, the MISR_Imp_All averages in the North (1.14) and South (1.23) were equal to the ground-based truths demonstrated in Table 1. For Tibet, we also increased the values of the mean, EE_0.1, and EE_0.3 from 0.48, 6.06%, and 15.15% to 0.85, 15.15%, and 42.42%, respectively. However, our method also possesses limitations. For example, the mean value (1.26) in the Northwest was worse than that of the MISR original product (1.12) when compared with the AERONET AE (1.0). These findings may have been related to the lower quantity of samples (N: 10) in the fall and the elimination of the particles with AE < 0 by our method. (2) For MISR_Imp_10%: although the differences for MISR_Imp_10% on the national scale were slightly worse than that for MISR_Imp_All, the samples located in the envelopes of EE_0.1 and EE_0.3 (34.11% and 73.13%, respectively) were higher than those in MISR_Imp_All (28.04% and 64.72%). Geographically and seasonally, the average values of MISR_Imp_10% were less than or equal to those of MISR_Imp_All (except for Tibet), which occurred within a small range of 0~0.06. In contrast, the EE_0.1 and EE_0.3 tests for MISR_Imp_10% were improved by approximately 10% compared with MISR_Imp_All. The top/bottom 10% of the averaged AERONET values likely generated a relatively small threshold range. For example, in Table 3, during spring in the North, the minimum of −0.12 increased to 0.25 and the maximum of 1.98 decreased to 1.57. On the one hand, these strict constraints can filter out few reasonable mixtures, such as fine particles from anthropogenic emissions (with high AE) or coarse particulate dust (with low AE); on the other hand, they can also ensure that most MISR mixtures are consistent with ground-based observations.
3.4. Improvement of MISR SSA
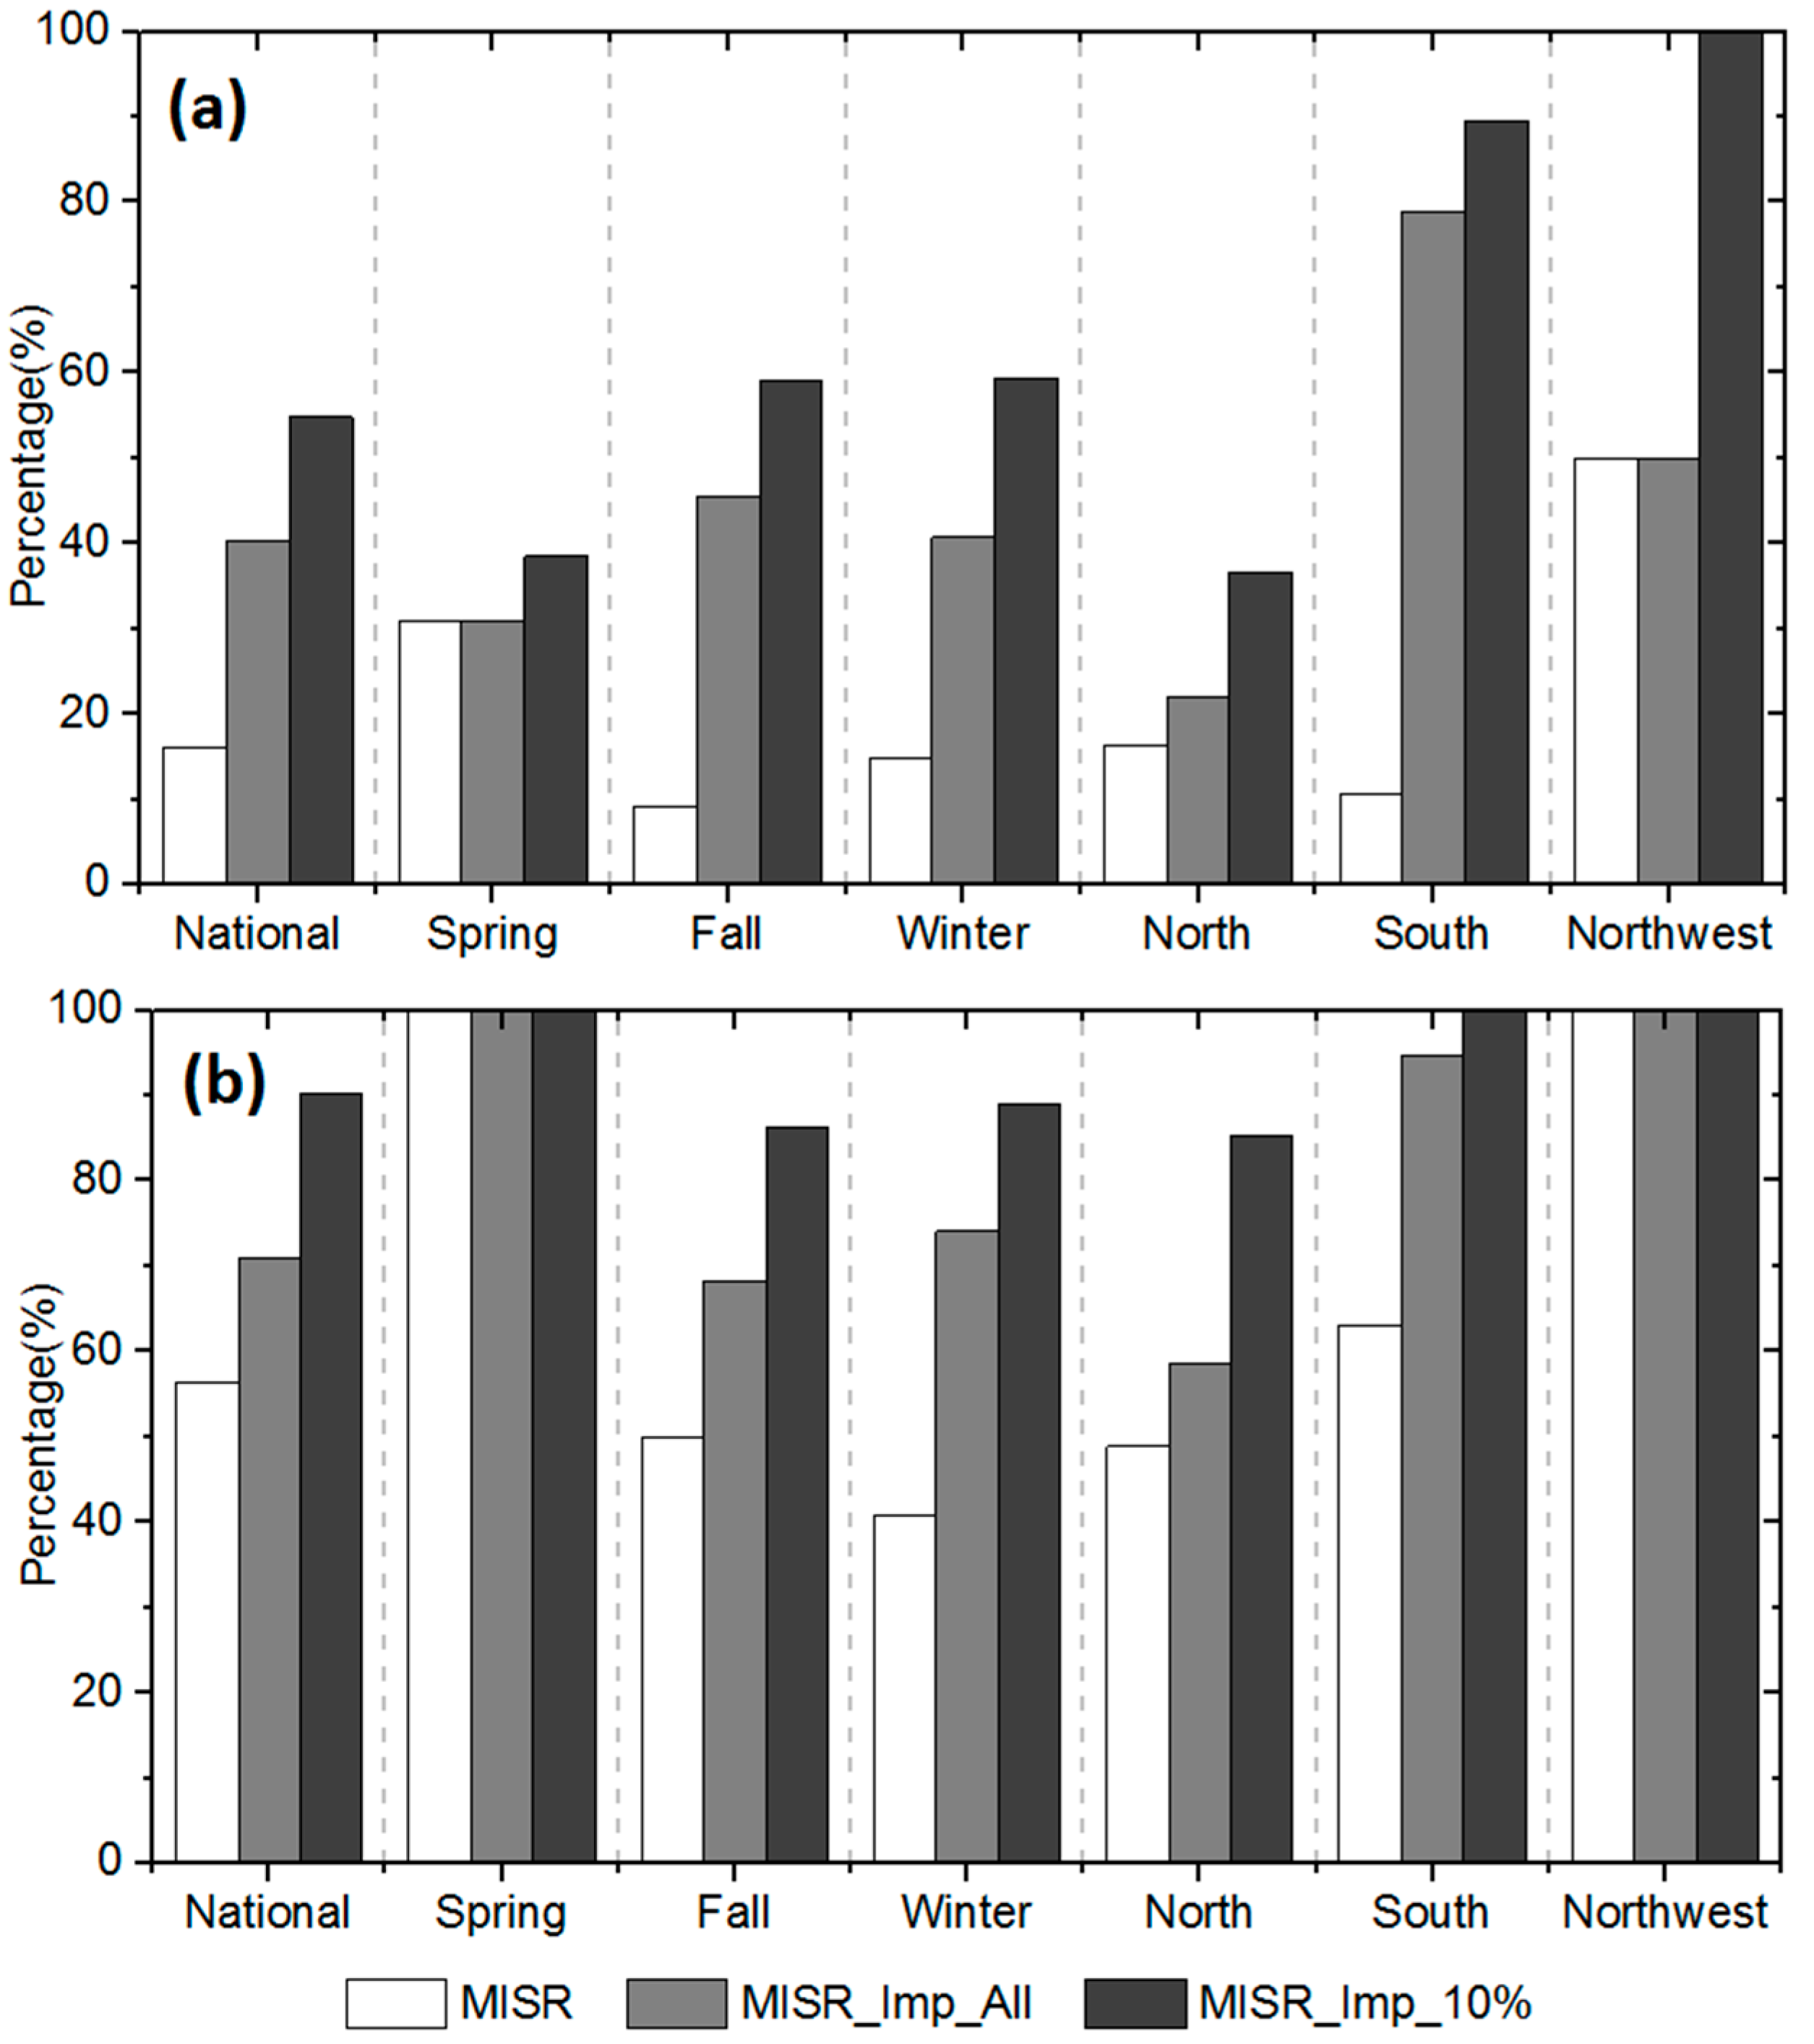
Table 5 and Table 6 are identical to Table 3 and Table 4, respectively, but for SSA. As shown in Table 5, the maximum SSA in the North/fall and South/winter reached a value of one, whereas in Tibet/spring, the maximum value dropped as low as 0.91. Therefore, many MISR mixtures with substantially strong scattering properties (MISR mixtures NO. 1 through 30 with SSA = 1 in Figure 2) may overestimate the real SSA in China. Most of the minimum SSA values were lower than 0.8, for example, this value was only 0.71 in the South during the fall. However, the lowest SSA among all of the MISR mixtures was 0.8 (MISR mixture NO. 41 in Figure 2), which indicates that the current MISR EOF algorithm ignores many highly absorbing particles. Our findings here are consistent with that of a previous study [24] that revealed a lack of absorbing particles in the MISR V22 climatology. When the top 10% and the bottom 10% of the AERONET SSA values were averaged, all of the maximum values (Table 5) were lower than 0.98 and the minimum values were generally higher than 0.8 (except for the South in fall). (1) For MISR_Imp_All: the average and difference values of MISR_Imp_All decreased to 0.96 (SD: 0.027) and 0.068, respectively, whereas the mean value for the MISR original product was 0.99 (SD: 0.018). Correspondingly, the EE_0.05 and EE_0.1 tests between our SSA and the original AERONET observations improved from 16.13% and 56.45% (original MISR product) to 40.32% and 70.97%, respectively, as shown in Figure 6. Seasonally, our improved mean values were approximately 0.96. The percentage of our SSA in fall and winter located in the EE_0.05 and EE_0.1 envelopes increased by 20~30% compared with the MISR original product. Geographically, our method achieved the best performance in the South. The average dropped to 0.95, and the EE_0.05 and EE_0.1 tests improved to 78.95% and 94.74%, respectively. In the North, a nearly 10% improvement was observed. However, changes were not observed in the Northwest because only two samples were available. (2) For MISR_Imp_10%: our method further reduced the mean values to 0.94 (SD: 0.026), which means that our SSA is closer to the AERONET observations despite a 0.043 difference value. This finding was primarily related to the narrow boundary value range of AERONET_10%, which further limited the MISR mixtures with high SSA values used during the retrieval. Therefore, the MISR_Imp_10% samples located in the EE_0.05 and EE_0.1 envelopes (54.84% and 90.32%, respectively) were higher than those of MISR_Imp_All (40.32% and 70.97%, respectively). Geographically and seasonally, the mean value decreased overall by approximately 0.3 compared with MISR_Imp_All, and the EE_0.1 and EE_0.3 tests also showed certain improvements in the different regions and seasons. The EE_0.1 test improved significantly in the North and increased from 58.54% to 85.37%. This finding may have been caused by the greater decrease in the AERONET_10% maximum value (Table 5) compared with the AERONET_All value (e.g., reduced by 0.04 in fall and winter), which tends to include the mixtures with low SSA and improve the final SSA by our method.
3.5. Additional Validation of AOD, AE and SSA
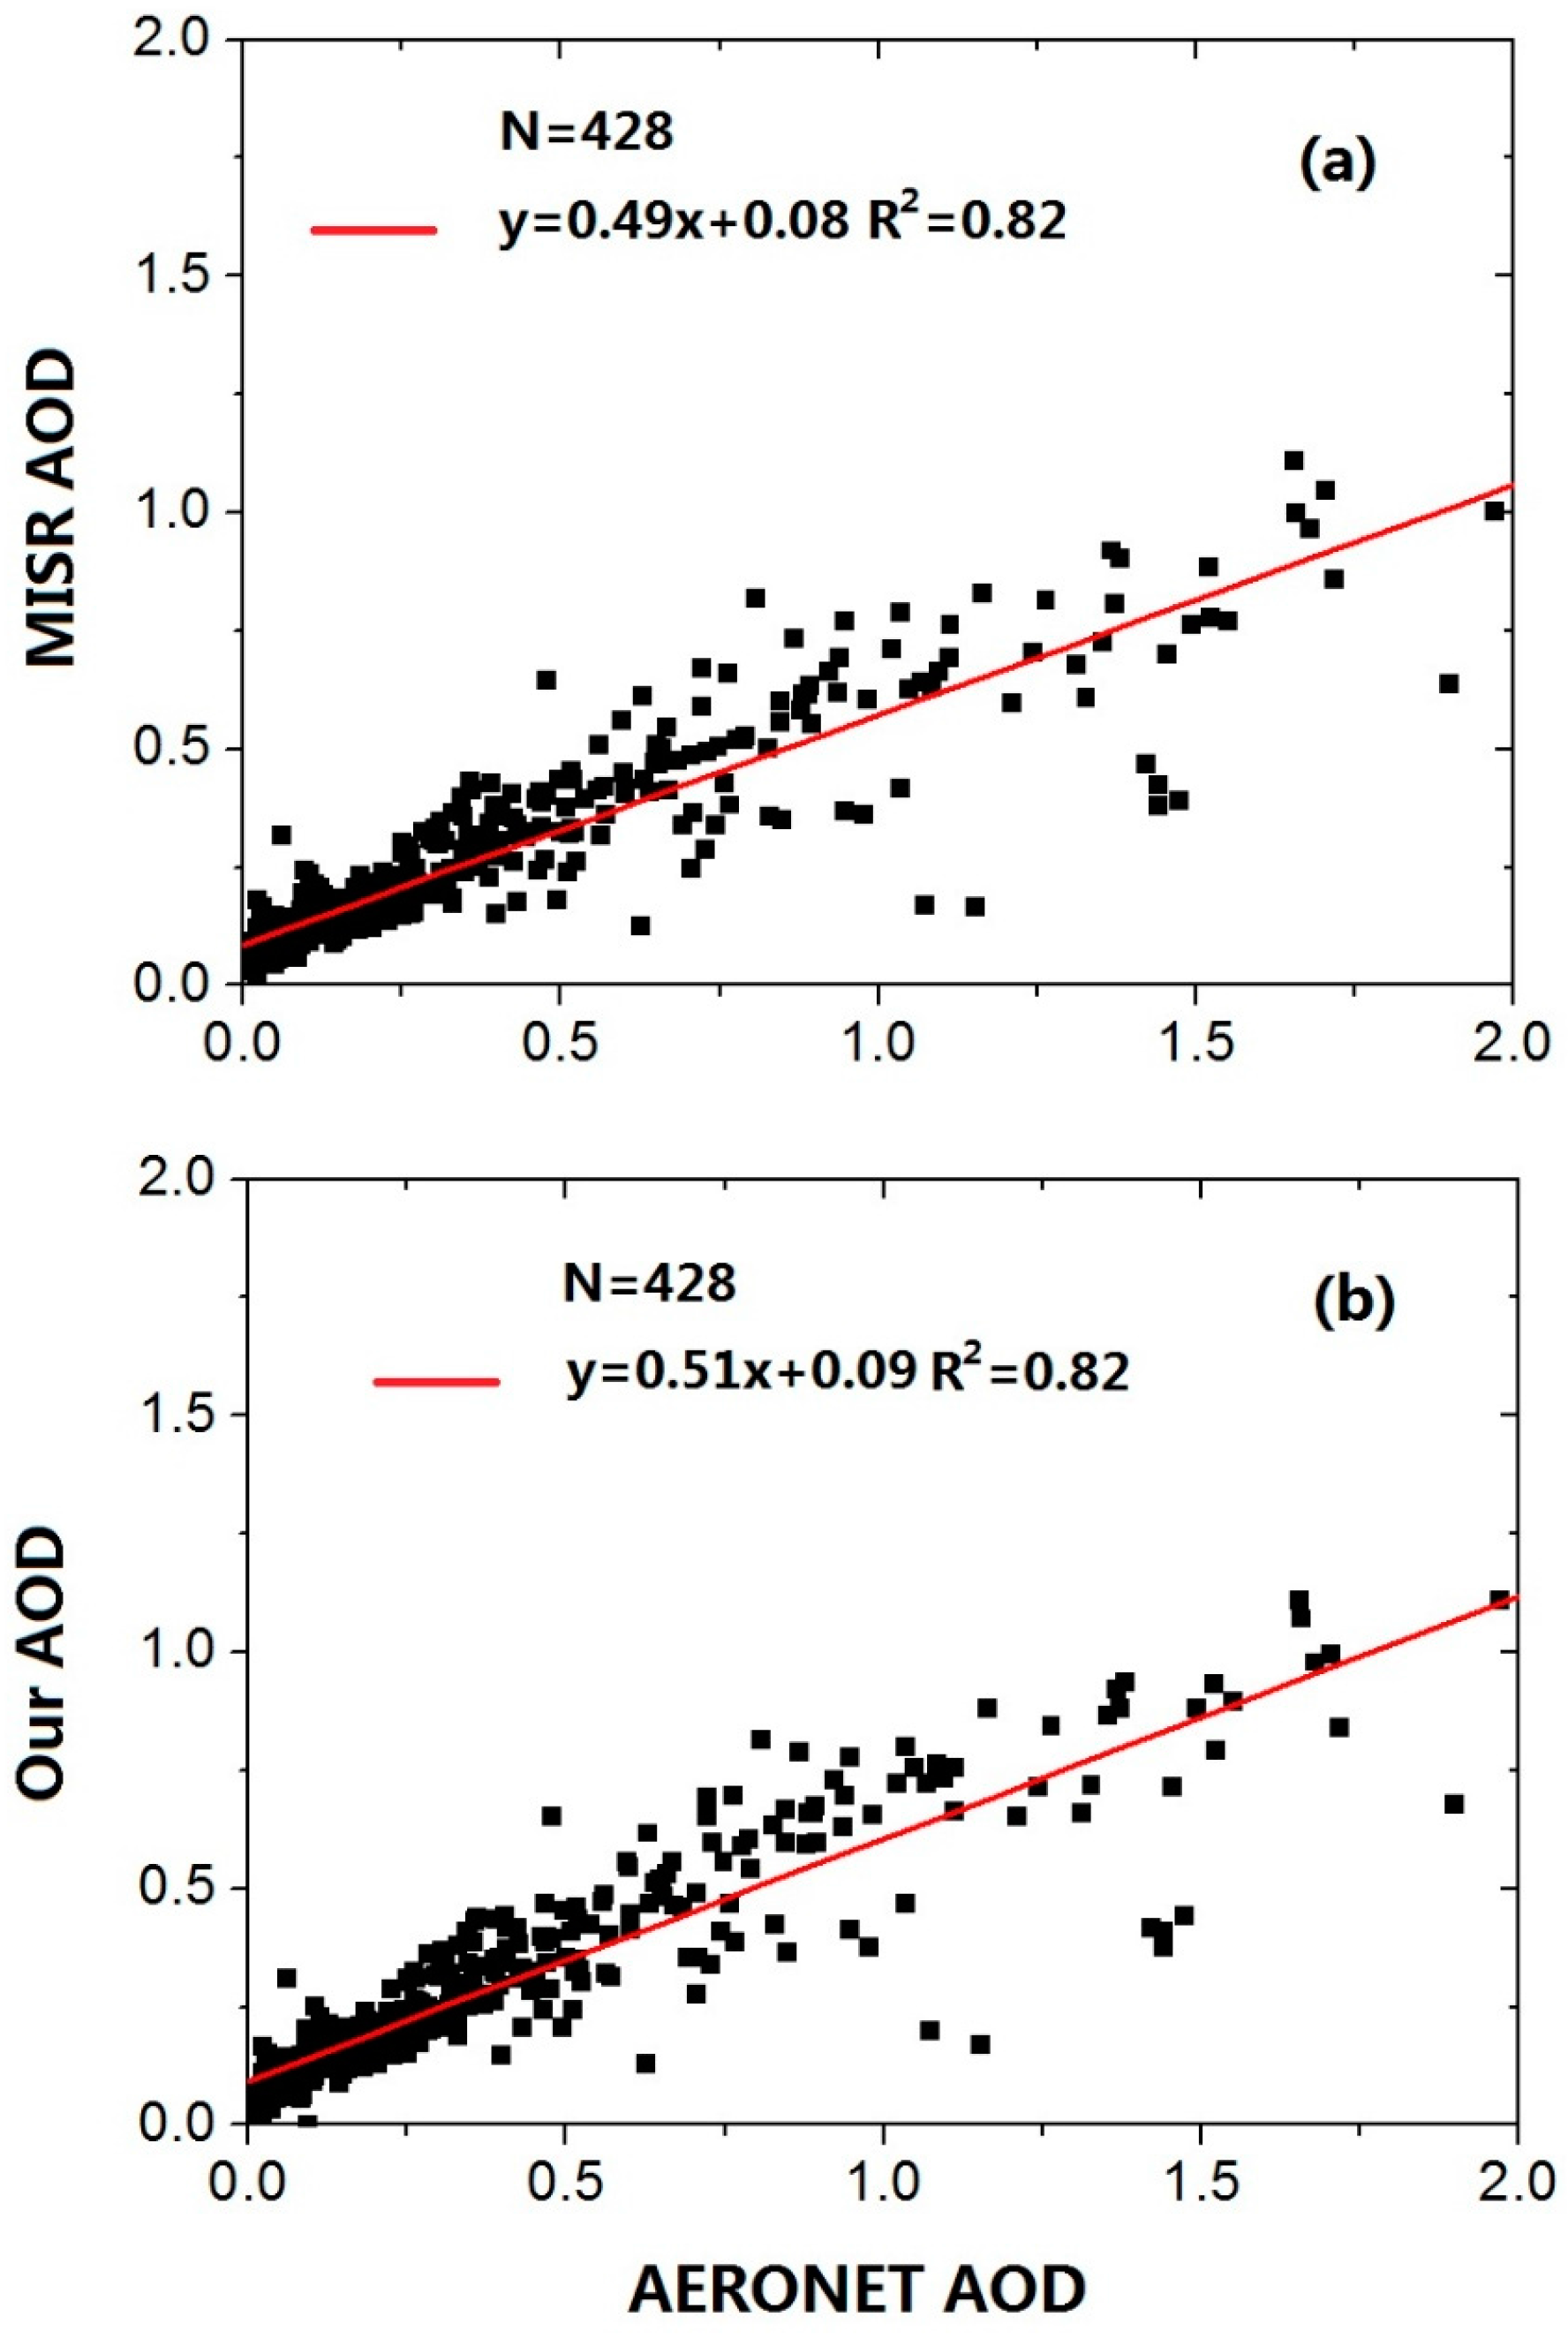
The validation of the MISR standard AOD product using AERONET data is presented in Figure 7. During the period from 2004 to 2014, the MISR had a strong correlation to AERONET Level 2.0 AOD in China (R2 = 0.82), as shown in Figure 7a. However, the MISR produced a significant underestimation (y = 0.49x + 0.08), especially for AODs larger than one. We also examined the new AOD calculated using our method. Our results in Figure 5b are very similar to the MISR standard AOD, with a high correlation coefficient of 0.82 and a low slope of 0.51. Overall, our findings are consistent with previous validation studies in China [39] and sensitivity analyses in the U.S. [26]. The MISR usually shows high bias when the AOD is very high, with almost stable AOD values in different mixtures.
Additional analysis related to seasonal differences by region is presented in Table 7 (AE) and Table 8 (SSA). Compared to the improvement in every region (as shown in Table 4 and Table 6), the regional seasonality patterns presented more details. Specifically, in the North, the seasonal improvements of AE in spring, autumn, and winter showed non-monotonous variations, and only in summer did they exhibit the two groups of MISR_Imp better than the regional mean in Table 4 (EE_0.1: 28.37%; EE_0.3: 64.71%), with EE_tests of 36.96%/69.57% for MISR_Imp_All and EE_tests of 34.78%/73.91% for MISR_Imp_10%; the SSA in the North showed similar patterns as AE, but performed best in autumn. The same AE patterns also appeared in the Northwest, but behaved best in spring. AE values in the Tibet and South regions during different seasons reflected that using stricter constraints (MISR_Imp_10%) led to a better performance than MISR_Imp_All, which was adaptive to SSA except in winter, providing many possibilities for using a dynamic threshold method based on different regional seasonalities. Previous studies showed that MISR AOD lacked coverage in part of the Tibet, making it difficult to retrieve AE and SSA and resulting in no matched records for SSA and incomplete coverage in autumn and winter over Tibet. Compared with the national seasonality patterns and regional characteristics in Table 6, because of the sample points of SSA, regional seasonalities do not provide more valuable information for improving our follow-up method.
4. Conclusions
In this study, the MISR AE and SSA values in China from 2004 to 2014 were validated for the first time using AERONET observations. The MISR showed a similar normal distribution, but demonstrated a lower mean of 0.09 0.43 compared with the AERONET AE. Our EE tests indicated that 18.46% and 50.23% of the MISR AE values were within the 0~0.1 and 0~0.3 envelopes of the MISR-AERONET absolute differences, respectively, on the national scale. In this study, a seasonal/regional scale was used to extract the minimum and maximum values, as well as the top 10% and the bottom 10% averaged values from the AERONET dataset, which included 11 years of AERONET data. Then, we developed a method that employs these two group thresholds as the constraining boundary conditions and calculated new AE values from the passed MISR mixtures. Overall, our national mean AE values from MISR_Imp_All and MISR_Imp_10% were closer to the AERONET AE than the original MISR product, even for different seasons and regions. In addition, the EE_0.1 and EE_0.3 tests between our AE and AERONET observations were improved from 18.46% and 50.23% (original MISR) to 28.04% and 64.72% (MISR_Imp_All) and 34.11% and 73.13% (MISR_Imp_10%), respectively. Our analysis showed that the strict constraints imposed by MISR_Imp_10% can ensure that most MISR mixtures are consistent with ground-based observations, although they could also filter out extra-fine and relatively coarse particles.
With regard to SSA values, the MISR exhibited an exponential-like distribution and showed many values close to 1.0, whereas AERONET displayed a normal distribution that ranged from 0.77 and 0.96. Our statistics showed that the MISR national mean SSA value (0.99) was significantly larger than the AERONET value (0.89), and seasonal or geographical variations were not observed in the MISR SSA distribution because of the high mean value. As a result, only 16.13% and 56.45% of the records were located in the EE_0.05 and EE_0.1 envelopes, respectively. Similar to the method used for the AE, our results for the 11 years of AERONET SSA data revealed that the MISR not only overestimates the real SSA, but also ignores highly absorbing particles in China. Overall, the mean values from our MISR_Imp_All and MISR_Imp_10% decreased to 0.96 and 0.94, respectively, whereas the MISR original product had a value of 0.99. Moreover, the EE_0.05 and EE_0.1 tests between our SSA and the AERONET observations were improved from 16.13% and 56.45% (MISR original product) to 40.32% and 70.97% (MISR_Imp_All) and 54.84% and 90.32% (MISR_Imp_10%), respectively. The analysis revealed that the strict constraint imposed by MISR_Imp_10% tends to include mixtures with low SSA values and further skews the final SSA closer to the AERONET values.
This study follows our previous works in the U.S., in which we improved the MISR AE and absorbing AOD values by employing the GOCART aerosol model simulations [26]. The post-processing technique proposed in this analysis is directed at narrowing the selection of mixtures by introducing real AERONET observations. This approach does not require a validation of the GOCART model data. However, our method also has limitations. First, applying fine-scale aerosol optical properties from AERONET data is difficult; for example, it is difficult to use daily/grid aerosol simulations, such as those in the GOCART model, to constrain MISR mixtures. Second, because many regions of China lack coverage, as shown in Figure 1, our current statistics may not represent the real aerosol properties over regions far from AERONET stations. Third, our approach is used for the improvement of AE and SSA and does not consider their intersection when selecting MISR mixtures. Nevertheless, the MISR retrieves a richer set of aerosol microphysical properties, which will allow us to develop more sophisticated techniques for selecting spatio-temporal constraints and aerosol types using ground-based measurement results.
Acknowledgments
This work was supported by the National Natural Science Foundation of China (Grant No. 91543128 and 41571417) and the National Science and Technology Ministry (Grant No. 2014BAC21B03). We thank the AERONET principal investigators (PI) and their staff for establishing and maintaining the AERONET sites used in this investigation and the NASA Langley Research Center’s Atmospheric Sciences Data Center for producing the MISR data sets (available from http://eosweb.larc.nasa.gov).
Author Contributions
Y.S. and S.L. conceived and designed the experiments; Y.S. and H.S. performed the experiments; Y.S. and L.W. analyzed the data; L.C. and H.L. contributed analysis tools; Y.S., S.L. and H.S. wrote the paper.
Conflicts of Interest
The authors declare no conflict of interest.
References
- Yang, F.; Tan, J.; Zhao, Q.; Du, Z.; He, K.; Ma, Y.; Duan, F.; Chen, G. Characteristics of PM2.5 speciation in representative megacities and across China. Atmos. Chem. Phys. 2011, 11, 5207–5219. [Google Scholar] [CrossRef]
- Li, W.J.; Shao, L.Y.; Buseck, P.R. Haze types in Beijing and the influence of agricultural biomass burning. Atmos. Chem. Phys. 2010, 10, 8119–8130. [Google Scholar] [CrossRef]
- Wang, Y.; Zhuang, G.S.; Sun, Y.L.; An, Z.S. The variation of characteristics and formation mechanisms of aerosols in dust, haze, and clear days in Beijing. Atmos. Environ. 2006, 40, 6579–6591. [Google Scholar] [CrossRef]
- Kan, H.D.; London, S.J.; Chen, G.H.; Zhang, Y.H.; Song, G.X.; Zhao, N.Q.; Jiang, L.L.; Chen, B.H. Differentiating the effects of fine and coarse particles on daily mortality in Shanghai, China. Environ. Int. 2007, 33, 376–384. [Google Scholar] [CrossRef] [PubMed]
- Tie, X.X.; Wu, D.; Brasseur, G. Lung cancer mortality and exposure to atmospheric aerosol particles in Guangzhou, China. Atmos. Environ. 2009, 43, 2375–2377. [Google Scholar] [CrossRef]
- Wang, Z.X.; Liu, Y.; Hu, M.; Pan, X.C.; Shi, J.; Chen, F.; He, K.B.; Koutrakis, P.; Christiani, D.C. Acute health impacts of airborne particles estimated from satellite remote sensing. Environ. Int. 2013, 51, 150–159. [Google Scholar] [CrossRef] [PubMed]
- Qiao, L.P.; Cai, J.; Wang, H.L.; Wang, W.B.; Zhou, M.; Lou, S.R.; Chen, R.J.; Dai, H.X.; Chen, C.H.; Kan, H.D. PM2.5 constituents and hospital emergency-room visits in Shanghai, China. Environ. Sci. Technol. 2014, 48, 10406–10414. [Google Scholar] [CrossRef] [PubMed]
- Baccarelli, A.A.; Zheng, Y.N.; Zhang, X.; Chang, D.; Liu, L.; Wolf, K.R.; Zhang, Z.; McCracken, J.P.; Diaz, A.; Bertazzi, P.A.; et al. Air pollution exposure and lung function in highly exposed subjects in Beijing, China: A repeated-measure study. Part. Fibre Toxicol. 2014, 11, 51. [Google Scholar] [CrossRef] [PubMed]
- Meng, X.; Ma, Y.J.; Chen, R.J.; Zhou, Z.J.; Chen, B.H.; Kan, H.D. Size-fractionated particle number concentrations and daily mortality in a Chinese city. Environ. Health Perspect. 2013, 121, 1174–1178. [Google Scholar] [CrossRef] [PubMed]
- Li, S.S.; Chen, L.F.; Xiong, X.Z.; Tao, J.H.; Su, L.; Han, D.; Liu, Y. Retrieval of the haze optical thickness in north China plain using modis data. IEEE Trans. Geosci. Remote Sens. 2013, 51, 2528–2540. [Google Scholar] [CrossRef]
- Dubovik, O.; Holben, B.; Eck, T.F.; Smirnov, A.; Kaufman, Y.J.; King, M.D.; Tanre, D.; Slutsker, I. Variability of absorption and optical properties of key aerosol types observed in worldwide locations. J. Atmos. Sci. 2002, 59, 590–608. [Google Scholar] [CrossRef]
- Lack, D.A.; Langridge, J.M. On the attribution of black and brown carbon light absorption using the angstrom exponent. Atmos. Chem. Phys. 2013, 13, 10535–10543. [Google Scholar] [CrossRef]
- Koo, J.H.; Kim, J.; Lee, J.; Eck, T.F.; Lee, Y.G.; Park, S.S.; Kim, M.; Jung, U.; Yoon, J.; Mok, J.; et al. Wavelength dependence of angstrom exponent and single scattering albedo observed by skyradiometer in Seoul, Korea. Atmos. Res. 2016, 181, 12–19. [Google Scholar] [CrossRef]
- Li, J.; Carlson, B.E.; Lacis, A.A. Using single-scattering albedo spectral curvature to characterize east asian aerosol mixtures. J. Geophys. Res. Atmos. 2015, 120, 2037–2052. [Google Scholar] [CrossRef]
- Russell, P.B.; Bergstrom, R.W.; Shinozuka, Y.; Clarke, A.D.; DeCarlo, P.F.; Jimenez, J.L.; Livingston, J.M.; Redemann, J.; Dubovik, O.; Strawa, A. Absorption angstrom exponent in aeronet and related data as an indicator of aerosol composition. Atmos. Chem. Phys. 2010, 10, 1155–1169. [Google Scholar] [CrossRef]
- Levy, R.C.; Mattoo, S.; Munchak, L.A.; Remer, L.A.; Sayer, A.M.; Patadia, F.; Hsu, N.C. The collection 6 modis aerosol products over land and ocean. Atmos. Meas. Tech. 2013, 6, 2989–3034. [Google Scholar] [CrossRef]
- Liu, Y.; Franklin, M.; Kahn, R.; Koutrakis, P. Using aerosol optical thickness to predict ground-level PM2.5 concentrations in the St. Louis area: A comparison between misr and modis. Remote Sens. Environ. 2007, 107, 33–44. [Google Scholar] [CrossRef]
- Popp, T.; de Leeuw, G.; Bingen, C.; Bruhl, C.; Capelle, V.; Chedin, A.; Clarisse, L.; Dubovik, O.; Grainger, R.; Griesfeller, J.; et al. Development, production and evaluation of aerosol climate data records from European satellite observations (aerosol_cci). Remote Sens. 2016, 8, 421. [Google Scholar] [CrossRef]
- Liu, H.Q.; Remer, L.A.; Huang, J.F.; Huang, H.C.; Kondragunta, S.; Laszlo, I.; Oo, M.; Jackson, J.M. Preliminary evaluation of s-npp viirs aerosol optical thickness. J. Geophys. Res. Atmos. 2014, 119, 3942–3962. [Google Scholar] [CrossRef]
- Li, S.S.; Yu, C.; Chen, L.F.; Tao, J.H.; Letu, H.; Ge, W.; Si, Y.D.; Liu, Y. Inter-comparison of model-simulated and satellite-retrieved componential aerosol optical depths in China. Atmos. Environ. 2016, 141, 320–332. [Google Scholar] [CrossRef]
- Ma, Z.W.; Hu, X.F.; Sayer, A.M.; Levy, R.; Zhang, Q.; Xue, Y.G.; Tong, S.L.; Bi, J.; Huang, L.; Liu, Y. Satellite-based spatiotemporal trends in PM2.5 concentrations: China, 2004–2013. Environ. Health Perspect. 2016, 124, 184–192. [Google Scholar] [CrossRef] [PubMed]
- Liu, Y.; Schichtel, B.A.; Koutrakis, P. Estimating particle sulfate concentrations using misr retrieved aerosol properties. IEEE J. Sel. Top. Appl. Earth Obs. Remote Sens. 2009, 2, 176–184. [Google Scholar] [CrossRef]
- Van Donkelaar, A.; Martin, R.V.; Brauer, M.; Kahn, R.; Levy, R.; Verduzco, C.; Villeneuve, P.J. Global estimates of ambient fine particulate matter concentrations from satellite-based aerosol optical depth: Development and application. Environ. Health Perspect. 2010, 118, 847–855. [Google Scholar] [CrossRef] [PubMed]
- Kahn, R.; Gaitley, B.J.; Garay, M.J.; Diner, D.J.; Eck, T.F.; Smirnov, A.; Holben, B.N. Multiangle imaging spectroradiometer global aerosol product assessment by comparison with the aerosol robotic network. J. Geophys. Res. Atmos. 2010, 115. [Google Scholar] [CrossRef]
- Kahn, R.A.; Gaitley, B.J. An analysis of global aerosol type as retrieved by misr. J. Geophys. Res. Atmos. 2015, 120, 4248–4281. [Google Scholar] [CrossRef]
- Li, S.; Kahn, R.; Chin, M.; Garay, M.J.; Liu, Y. Improving satellite-retrieved aerosol microphysical properties using gocart data. Atmos. Meas. Tech. 2015, 8, 1157–1171. [Google Scholar] [CrossRef]
- Liu, Y.; Koutrakis, P.; Kahn, R. Estimating fine particulate matter component concentrations and size distributions using satellite-retrieved fractional aerosol optical depth: Part 1—Method development. J. Air Waste Manag. Assoc. 2007, 57, 1351–1359. [Google Scholar] [PubMed]
- Martonchik, J.V.; Diner, D.J.; Kahn, R.A.; Ackerman, T.P.; Verstraete, M.E.; Pinty, B.; Gordon, H.R. Techniques for the retrieval of aerosol properties over land and ocean using multiangle imaging. IEEE Trans. Geosci. Remote Sens. 1998, 36, 1212–1227. [Google Scholar] [CrossRef]
- Liu, Y.; Sarnat, J.A.; Coull, B.A.; Koutrakis, P.; Jacob, D.J. Validation of multiangle imaging spectroradiometer (misr) aerosol optical thickness measurements using aerosol robotic network (aeronet) observations over the contiguous united states. J. Geophys. Res. Atmos. 2004, 109. [Google Scholar] [CrossRef]
- Xu, X.; Wang, J.; Zeng, J.; Spurr, R.; Liu, X.; Dubovik, O.; Li, L.; Li, Z.; Mishchenko, M.I.; Siniuk, A.; et al. Retrieval of aerosol microphysical properties from aeronet photopolarimetric measurements: 2. A new research algorithm and case demonstration. J. Geophys. Res. Atmos. 2015, 120, 7079–7098. [Google Scholar] [CrossRef]
- Dubovik, O.; Smirnov, A.; Holben, B.N.; King, M.D.; Kaufman, Y.J.; Eck, T.F.; Slutsker, I. Accuracy assessments of aerosol optical properties retrieved from aerosol robotic network (aeronet) sun and sky radiance measurements. J. Geophys. Res. Atmos. 2000, 105, 9791–9806. [Google Scholar] [CrossRef]
- Kahn, R.; Banerjee, P.; McDonald, D. Sensitivity of multiangle imaging to natural mixtures of aerosols over ocean. J. Geophys. Res. Atmos. 2001, 106, 18219–18238. [Google Scholar] [CrossRef]
- Schuster, G.L.; Dubovik, O.; Holben, B.N. Angstrom exponent and bimodal aerosol size distributions. J. Geophys. Res. Atmos. 2006, 111, 14. [Google Scholar] [CrossRef]
- Kang, N.; Kumar, K.R.; Yu, X.N.; Yin, Y. Column-integrated aerosol optical properties and direct radiative forcing over the urban-industrial megacity nanjing in the Yangtze river delta, China. Environ. Sci. Pollut. Res. 2016, 23, 17532–17552. [Google Scholar] [CrossRef] [PubMed]
- Che, H.Z.; Yang, Z.F.; Zhang, X.Y.; Zhu, C.Z.; Ma, Q.L.; Zhou, H.G.; Wang, P. Study on the aerosol optical properties and their relationship with aerosol chemical compositions over three regional background stations in China. Atmos. Environ. 2009, 43, 1093–1099. [Google Scholar] [CrossRef]
- Kahn, R.; Nelson, D.; Garay, M.; Levy, R.; Bull, M.; Diner, D.; Martonchik, J.V.; Paradise, S.R.; Hansen, E.G.; Remer, L.A. Misr aerosol product attributes and statistical comparisons with modis. IEEE Trans. Geosci. Remote Sens. 2009, 47, 4095–4114. [Google Scholar] [CrossRef]
- Bergstrom, R.W.; Pilewskie, P.; Russell, P.B.; Redemann, J.; Bond, T.C.; Quinn, P.K.; Sierau, B. Spectral absorption properties of atmospheric aerosols. Atmos. Chem. Phys. 2007, 7, 5937–5943. [Google Scholar] [CrossRef]
- Yin, B.S.; Min, Q.L.; Joseph, E. Retrievals and uncertainty analysis of aerosol single scattering albedo from mfrsr measurements. J. Quant. Spectrosc. Radiat. Transf. 2015, 150, 95–106. [Google Scholar] [CrossRef]
- Cheng, T.; Chen, H.; Gu, X.; Yu, T.; Guo, J.; Guo, H. The inter-comparison of modis, misr and gocart aerosol products against aeronet data over China. J. Quant. Spectrosc. Radiat. Transf. 2012, 113, 2135–2145. [Google Scholar] [CrossRef]
Figure 1.
Distributions of MISR (a) AE and (b) SSA values for MISR Mixture No. 1 through No. 74.

Figure 2.
Spatial distribution of AERONET sites containing Level 2.0 AE (27 red cycles) and SSA (20 blue cycles) data from 2004 to 2014 in China. The black line roughly corresponds to the Kunlun/Qinling Mountain-Huaihe River Line that divides China into northern and southern regions. The red line roughly corresponds to the Heihe-Tengchong Line that divides China into the developed/polluted eastern region and the sparsely populated western region. The land classification data are provided by the Multi-resolution Land Characteristics Consortium (http://www.mrlc.gov/nlcd06_data.php).

Figure 3.
Distributions of MISR and AERONET AE values (N = 428).

Figure 4.
Distributions of MISR and AERONET SSA values (N = 62).

Figure 5.
(a) EE_0.1 and (b) EE_0.3 test for MISR operational (white columns), MISR_Imp_All (gray columns) and MISR_Imp_10% (black columns) AE in the different regions and seasons.
Figure 5.
(a) EE_0.1 and (b) EE_0.3 test for MISR operational (white columns), MISR_Imp_All (gray columns) and MISR_Imp_10% (black columns) AE in the different regions and seasons.

Figure 6.
The same (a) EE_0.05 and (b) EE_0.1 test as Figure 6, but this one is for SSA.
Figure 6.
The same (a) EE_0.05 and (b) EE_0.1 test as Figure 6, but this one is for SSA.

Figure 7.
Validation of (a) MISR AOD and (b) our AOD using AERONET observations from 2004 to 2014 in China.
Figure 7.
Validation of (a) MISR AOD and (b) our AOD using AERONET observations from 2004 to 2014 in China.

Table 1.
Statistics for MISR and AERONET AE values and their differences from 2004 to 2014 in China.
Table 1.
Statistics for MISR and AERONET AE values and their differences from 2004 to 2014 in China.
| AE | Dataset | N | Mean | SD 2 | Difference 3 (Standard Error) | EE_0.1 4 (%) | EE_0.3 4 (%) |
|---|---|---|---|---|---|---|---|
| National | AERONET | 428 | 1.17 | 0.34 | −0.095 (0.43) | 18.46 | 50.23 |
| MISR | 1.08 | 0.43 | |||||
| Spring 1 | AERONET | 127 | 1.04 | 0.33 | −0.054 (0.39) | 25.20 | 60.63 |
| MISR | 0.98 | 0.42 | |||||
| Summer | AERONET | 62 | 1.21 | 0.30 | −0.084 (0.40) | 19.35 | 45.16 |
| MISR | 1.12 | 0.40 | |||||
| Fall | AERONET | 108 | 1.31 | 0.29 | −0.21 (0.40) | 13.89 | 50 |
| MISR | 1.10 | 0.41 | |||||
| Winter | AERONET | 131 | 1.18 | 0.36 | −0.047 (0.47) | 15.27 | 42.75 |
| MISR | 1.14 | 0.47 | |||||
| North | AERONET | 289 | 1.14 | 0.33 | −0.039 (0.40) | 17.99 | 49.48 |
| MISR | 1.10 | 0.41 | |||||
| Northwest | AERONET | 10 | 1.00 | 0.51 | 0.13 (0.29) | 30 | 80 |
| MISR | 1.12 | 0.39 | |||||
| Tibet | AERONET | 33 | 1.34 | 0.53 | −0.86 (0.27) | 6.06 | 15.15 |
| MISR | 0.48 | 0.28 | |||||
| South | AERONET | 96 | 1.23 | 0.23 | −0.023 (0.34) | 22.92 | 61.46 |
| MISR | 1.21 | 0.37 |
1 Spring is March through May, Summer is June through August, Fall is September through November, and Winter is December through February. 2 SD refers to the arithmetic standard deviation. 3 Differences are calculated between MISR and AERONET. 4 EE_0.1 (or 0.3) is the percentage of MISR samples located in the absolute differences (|MISR-AERONET|) of 0.1 (or 0.3).
Table 2.
Same as Table 1 but for SSA.
Table 2.
Same as Table 1 but for SSA.
| SSA | Dataset | N | Mean | SD | Difference (Standard Error) | EE_0.05 (%) | EE_0.10 (%) |
|---|---|---|---|---|---|---|---|
| National | AERONET | 62 | 0.89 | 0.041 | 0.096 (0.018) | 16.13 | 56.45 |
| MISR | 0.99 | 0.018 | |||||
| Spring | AERONET | 13 | 0.93 | 0.020 | 0.062 (0.005) | 30.77 | 100 |
| MISR | 0.99 | 0.0050 | |||||
| Fall | AERONET | 22 | 0.89 | 0.031 | 0.097 (0.012) | 9.09 | 50 |
| MISR | 0.99 | 0.012 | |||||
| Winter | AERONET | 27 | 0.87 | 0.045 | 0.11 (0.024) | 14.81 | 40.74 |
| MISR | 0.99 | 0.024 | |||||
| North | AERONET | 41 | 0.89 | 0.045 | 0.098 (0.012) | 16.28 | 48.84 |
| MISR | 0.99 | 0.012 | |||||
| South | AERONET | 19 | 0.89 | 0.033 | 0.090 (0.025) | 10.53 | 63.16 |
| MISR | 0.98 | 0.025 | |||||
| Northwest | AERONET | 2 | 0.93 | 0.038 | 0.039 (-) | 50 | 100 |
| MISR | 0.97 | 0.042 |
Table 3.
Statistics for the minimum and maximum AERONET AE values from 2004 to 2014 in China.
| Region | Season | AERONET_All | AERONET_10% | ||
|---|---|---|---|---|---|
| Min | Max | Min | Max | ||
| North | Spring | −0.12 | 1.98 | 0.25 | 1.57 |
| Summer | 0.11 | 2.05 | 0.62 | 1.63 | |
| Fall | −0.36 | 1.98 | 0.56 | 1.61 | |
| Winter | 0.03 | 1.93 | 0.40 | 1.50 | |
| Northwest | Spring | 0.01 | 1.40 | 0.08 | 1.10 |
| Summer | 0.09 | 1.61 | 0.28 | 1.47 | |
| Fall | 0.07 | 1.95 | 0.47 | 1.48 | |
| Winter | 0.08 | 2.70 | 0.31 | 1.36 | |
| South | Spring | 0.07 | 3.93 | 0.52 | 1.65 |
| Summer | 0.18 | 3.46 | 0.52 | 1.81 | |
| Fall | 0.38 | 1.92 | 0.91 | 1.65 | |
| Winter | 0.21 | 1.74 | 0.81 | 1.57 | |
| Tibet | Spring | −0.21 | 2.01 | 0.08 | 1.66 |
| Summer | −0.04 | 2.12 | 0.10 | 1.59 | |
| Fall | 0.12 | 3.81 | 0.27 | 2.60 | |
| Winter | −0.01 | 4.80 | 0.30 | 3.52 | |
Table 4.
Statistics for MISR_Imp_All and MISR_Imp_10% AE and the differences between MISR_Imp and AERONET from 2004 to 2014 in China.
Table 4.
Statistics for MISR_Imp_All and MISR_Imp_10% AE and the differences between MISR_Imp and AERONET from 2004 to 2014 in China.
| AE | Dataset | N | Mean | SD | Difference (Standard Error) | EE_0.1 (%) | EE_0.3 (%) |
|---|---|---|---|---|---|---|---|
| National | MISR_Imp_All | 428 | 1.13 | 0.28 | −0.044 (0.36) | 28.04 | 64.72 |
| MISR_Imp_10% | 1.11 | 0.23 | −0.062 (0.30) | 34.11 | 73.13 | ||
| Spring | MISR_Imp_All | 127 | 1.09 | 0.30 | 0.050 (0.29) | 29.92 | 72.44 |
| MISR_Imp_10% | 1.04 | 0.23 | 0.002 (0.23) | 34.65 | 77.17 | ||
| Summer | MISR_Imp_All | 62 | 1.19 | 0.27 | −0.017 (0.32) | 32.26 | 67.74 |
| MISR_Imp_10% | 1.15 | 0.18 | −0.057 (0.27) | 38.71 | 77.42 | ||
| Fall | MISR_Imp_All | 108 | 1.18 | 0.27 | −0.13 (0.40) | 22.22 | 56.48 |
| MISR_Imp_10% | 1.18 | 0.22 | −0.13 (0.36) | 31.48 | 62.04 | ||
| Winter | MISR_Imp_All | 131 | 1.14 | 0.28 | −0.043 (0.40) | 29.01 | 62.60 |
| MISR_Imp_10% | 1.11 | 0.23 | −0.071 (0.32) | 33.59 | 76.34 | ||
| North | MISR_Imp_All | 289 | 1.14 | 0.27 | −0.004 (0.32) | 28.37 | 64.71 |
| MISR_Imp_10% | 1.09 | 0.22 | −0.049 (0.27) | 30.80 | 70.93 | ||
| Northwest | MISR_Imp_All | 10 | 1.26 | 0.40 | 0.26 (0.38) | 30 | 60 |
| MISR_Imp_10% | 1.20 | 0.44 | 0.21 (0.32) | 30 | 70 | ||
| Tibet | MISR_Imp_All | 33 | 0.75 | 0.18 | −0.58 (0.75) | 15.15 | 42.42 |
| MISR_Imp_10% | 1 | 0.15 | −0.34 (0.61) | 30.30 | 54.55 | ||
| South | MISR_Imp_All | 96 | 1.23 | 0.28 | 0 (0.27) | 31.25 | 72.92 |
| MISR_Imp_10% | 1.20 | 0.20 | −0.032 (0.19) | 45.83 | 86.46 |
Table 5.
Same as Table 3 but for SSA.
Table 5.
Same as Table 3 but for SSA.
| Region | Season | AERONET_All | AERONET_10% | ||
|---|---|---|---|---|---|
| Min | Max | Min | Max | ||
| North | Spring | 0.77 | 0.98 | 0.83 | 0.96 |
| Summer | - | - | - | - | |
| Fall | 0.78 | 1.00 | 0.83 | 0.96 | |
| Winter | 0.77 | 0.99 | 0.81 | 0.95 | |
| Northwest | Spring | 0.75 | 0.99 | 0.82 | 0.97 |
| Summer | 0.86 | 0.99 | 0.87 | 0.98 | |
| Fall | 0.70 | 0.98 | 0.83 | 0.97 | |
| Winter | 0.79 | 0.99 | 0.84 | 0.97 | |
| South | Spring | 0.80 | 0.94 | 0.84 | 0.93 |
| Summer | - | - | - | - | |
| Fall | 0.71 | 0.98 | 0.78 | 0.96 | |
| Winter | 0.76 | 1.00 | 0.82 | 0.95 | |
| Tibet | Spring | 0.85 | 0.91 | 0.85 | 0.91 |
| Summer | - | - | - | - | |
| Fall | - | - | - | - | |
| Winter | - | - | - | - | |
Table 6.
Same as Table 4 but for SSA.
Table 6.
Same as Table 4 but for SSA.
| SSA | Dataset | N | Mean | SD | Difference (Standard Error) | EE_0.05 (%) | EE_0.1 (%) |
|---|---|---|---|---|---|---|---|
| National | MISR_Imp_All | 62 | 0.96 | 0.027 | 0.068 (0.082) | 40.32 | 70.97 |
| MISR_Imp_10% | 0.94 | 0.026 | 0.043 (0.062) | 54.84 | 90.32 | ||
| Spring | MISR_Imp_All | 13 | 0.97 | 0.025 | 0.069 (0.08) | 30.77 | 100.00 |
| MISR_Imp_10% | 0.93 | 0.024 | 0.038 (0.059) | 38.46 | 100.00 | ||
| Fall | MISR_Imp_All | 22 | 0.96 | 0.029 | 0.064 (0.082) | 45.46 | 68.18 |
| MISR_Imp_10% | 0.94 | 0.027 | 0.046 (0.065) | 59.09 | 86.36 | ||
| Winter | MISR_Imp_All | 27 | 0.96 | 0.027 | 0.07 (0.082) | 40.74 | 74.07 |
| MISR_Imp_10% | 0.93 | 0.027 | 0.042 (0.061) | 59.26 | 88.89 | ||
| North | MISR_Imp_All | 41 | 0.97 | 0.027 | 0.085 (0.095) | 21.95 | 58.54 |
| MISR_Imp_10% | 0.94 | 0.029 | 0.063 (0.073) | 36.59 | 85.37 | ||
| South | MISR_Imp_All | 19 | 0.95 | 0.022 | 0.032 (0.045) | 78.95 | 94.74 |
| MISR_Imp_10% | 0.92 | 0.006 | 0.006 (0.028) | 89.47 | 100.00 | ||
| Northwest | MISR_Imp_All | 2 | 0.98 | 0.006 | 0.045 (0.055) | 50.00 | 100.00 |
| MISR_Imp_10% | 0.91 | 0 | −0.022 (0.036) | 100.00 | 100.00 |
Table 7.
Statistics for the seasonal MISR_Imp_All and MISR_Imp_10% AE values and their EE tests by region.
Table 7.
Statistics for the seasonal MISR_Imp_All and MISR_Imp_10% AE values and their EE tests by region.
| AE | Seasons | Dataset | N | Mean | SD | EE_0.1 (%) | EE_0.3 (%) |
|---|---|---|---|---|---|---|---|
| North | Spring | MISR_Imp_All | 80 | 1.06 | 0.31 | 33.75 | 72.50 |
| MISR_Imp_10% | 1.00 | 0.25 | 27.5 | 71.25 | |||
| Summer | MISR_Imp_All | 46 | 1.14 | 0.22 | 36.96 | 69.57 | |
| MISR_Imp_10% | 1.15 | 0.17 | 34.78 | 73.91 | |||
| Autumn | MISR_Imp_All | 75 | 1.16 | 0.25 | 18.67 | 56 | |
| MISR_Imp_10% | 1.14 | 0.20 | 30.67 | 60 | |||
| Winter | MISR_Imp_All | 88 | 1.19 | 0.26 | 27.27 | 62.50 | |
| MISR_Imp_10% | 1.11 | 0.22 | 31.82 | 78.41 | |||
| Northwest | Spring | MISR_Imp_All | 2 | 0.94 | 0.08 | 50 | 100 |
| MISR_Imp_10% | 0.86 | 0.08 | 50 | 100 | |||
| Autumn | MISR_Imp_All | 4 | 1.50 | 0.26 | 25 | 50 | |
| MISR_Imp_10% | 1.50 | 0.26 | 25 | 50 | |||
| Winter | MISR_Imp_All | 4 | 1.17 | 0.52 | 25 | 50 | |
| MISR_Imp_10% | 1.07 | 0.54 | 25 | 75 | |||
| Tibet | Spring | MISR_Imp_All | 13 | 0.98 | 0.05 | 15.38 | 61.54 |
| MISR_Imp_10% | 1.11 | 0.13 | 46.15 | 84.62 | |||
| Summer | MISR_Imp_All | 4 | 0.99 | 0.10 | 50 | 100 | |
| MISR_Imp_10% | 0.95 | 0.06 | 50 | 100 | |||
| Autumn | MISR_Imp_All | 6 | 0.77 | 0.18 | 0 | 0 | |
| MISR_Imp_10% | 0.97 | 0.16 | 0 | 0 | |||
| Winter | MISR_Imp_All | 10 | 0.68 | 0.13 | 10 | 20 | |
| MISR_Imp_10% | 0.89 | 0.10 | 20 | 30 | |||
| South | Spring | MISR_Imp_All | 32 | 1.20 | 0.30 | 25 | 75 |
| MISR_Imp_10% | 1.11 | 0.22 | 56.25 | 87.50 | |||
| Summer | MISR_Imp_All | 12 | 1.46 | 0.32 | 8.33 | 50 | |
| MISR_Imp_10% | 1.22 | 0.20 | 33.33 | 58.33 | |||
| Autumn | MISR_Imp_All | 23 | 1.28 | 0.22 | 39.13 | 73.91 | |
| MISR_Imp_10% | 1.31 | 0.15 | 60.87 | 100 | |||
| Winter | MISR_Imp_All | 29 | 1.13 | 0.23 | 41.38 | 79.31 | |
| MISR_Imp_10% | 1.20 | 0.16 | 58.62 | 96.55 |
Table 8.
Same as Table 7 but for SSA.
Table 8.
Same as Table 7 but for SSA.
| SSA | Seasons | Dataset | N | Mean | SD | EE_0.05 (%) | EE_0.1 (%) |
|---|---|---|---|---|---|---|---|
| North | Spring | MISR_Imp_All | 9 | 0.97 | 0.025 | 0 | 55.56 |
| MISR_Imp_10% | 0.94 | 0.026 | 0 | 100 | |||
| Autumn | MISR_Imp_All | 18 | 0.96 | 0.029 | 33.33 | 61.11 | |
| MISR_Imp_10% | 0.94 | 0.029 | 50 | 83.33 | |||
| Winter | MISR_Imp_All | 14 | 0.97 | 0.026 | 21.43 | 57.14 | |
| MISR_Imp_10% | 0.94 | 0.032 | 35.71 | 78.57 | |||
| Northwest | Spring | MISR_Imp_All | 1 | 0.97 | 0.009 | 0 | 0 |
| MISR_Imp_10% | 0.91 | 0.035 | 100 | 100 | |||
| Winter | MISR_Imp_All | 1 | 0.98 | 0.054 | 0 | 100 | |
| MISR_Imp_10% | 0.91 | 0.004 | 100 | 100 | |||
| South | Spring | MISR_Imp_All | 3 | 0.95 | 0.024 | 100 | 100 |
| MISR_Imp_10% | 0.92 | 0.001 | 100 | 100 | |||
| Autumn | MISR_Imp_All | 4 | 0.95 | 0.023 | 100 | 100 | |
| MISR_Imp_10% | 0.92 | 0.001 | 100 | 100 | |||
| Winter | MISR_Imp_All | 12 | 0.95 | 0.023 | 66.67 | 91.67 | |
| MISR_Imp_10% | 0.92 | 0.007 | 83.33 | 100 |
© 2017 by the authors. Licensee MDPI, Basel, Switzerland. This article is an open access article distributed under the terms and conditions of the Creative Commons Attribution (CC BY) license (http://creativecommons.org/licenses/by/4.0/).
Share and Cite
MDPI and ACS Style
Si, Y.; Li, S.; Chen, L.; Shang, H.; Wang, L.; Letu, H. Assessment and Improvement of MISR Angstrom Exponent and Single-Scattering Albedo Products Using AERONET Data in China. Remote Sens. 2017, 9, 693. https://doi.org/10.3390/rs9070693
AMA Style
Si Y, Li S, Chen L, Shang H, Wang L, Letu H. Assessment and Improvement of MISR Angstrom Exponent and Single-Scattering Albedo Products Using AERONET Data in China. Remote Sensing. 2017; 9(7):693. https://doi.org/10.3390/rs9070693
Chicago/Turabian StyleSi, Yidan, Shenshen Li, Liangfu Chen, Huazhe Shang, Lei Wang, and Husi Letu. 2017. "Assessment and Improvement of MISR Angstrom Exponent and Single-Scattering Albedo Products Using AERONET Data in China" Remote Sensing 9, no. 7: 693. https://doi.org/10.3390/rs9070693
Note that from the first issue of 2016, this journal uses article numbers instead of page numbers. See further details here.