Estimating Mangrove Canopy Height and Above-Ground Biomass in the Everglades National Park with Airborne LiDAR and TanDEM-X Data


Abstract
:1. Introduction
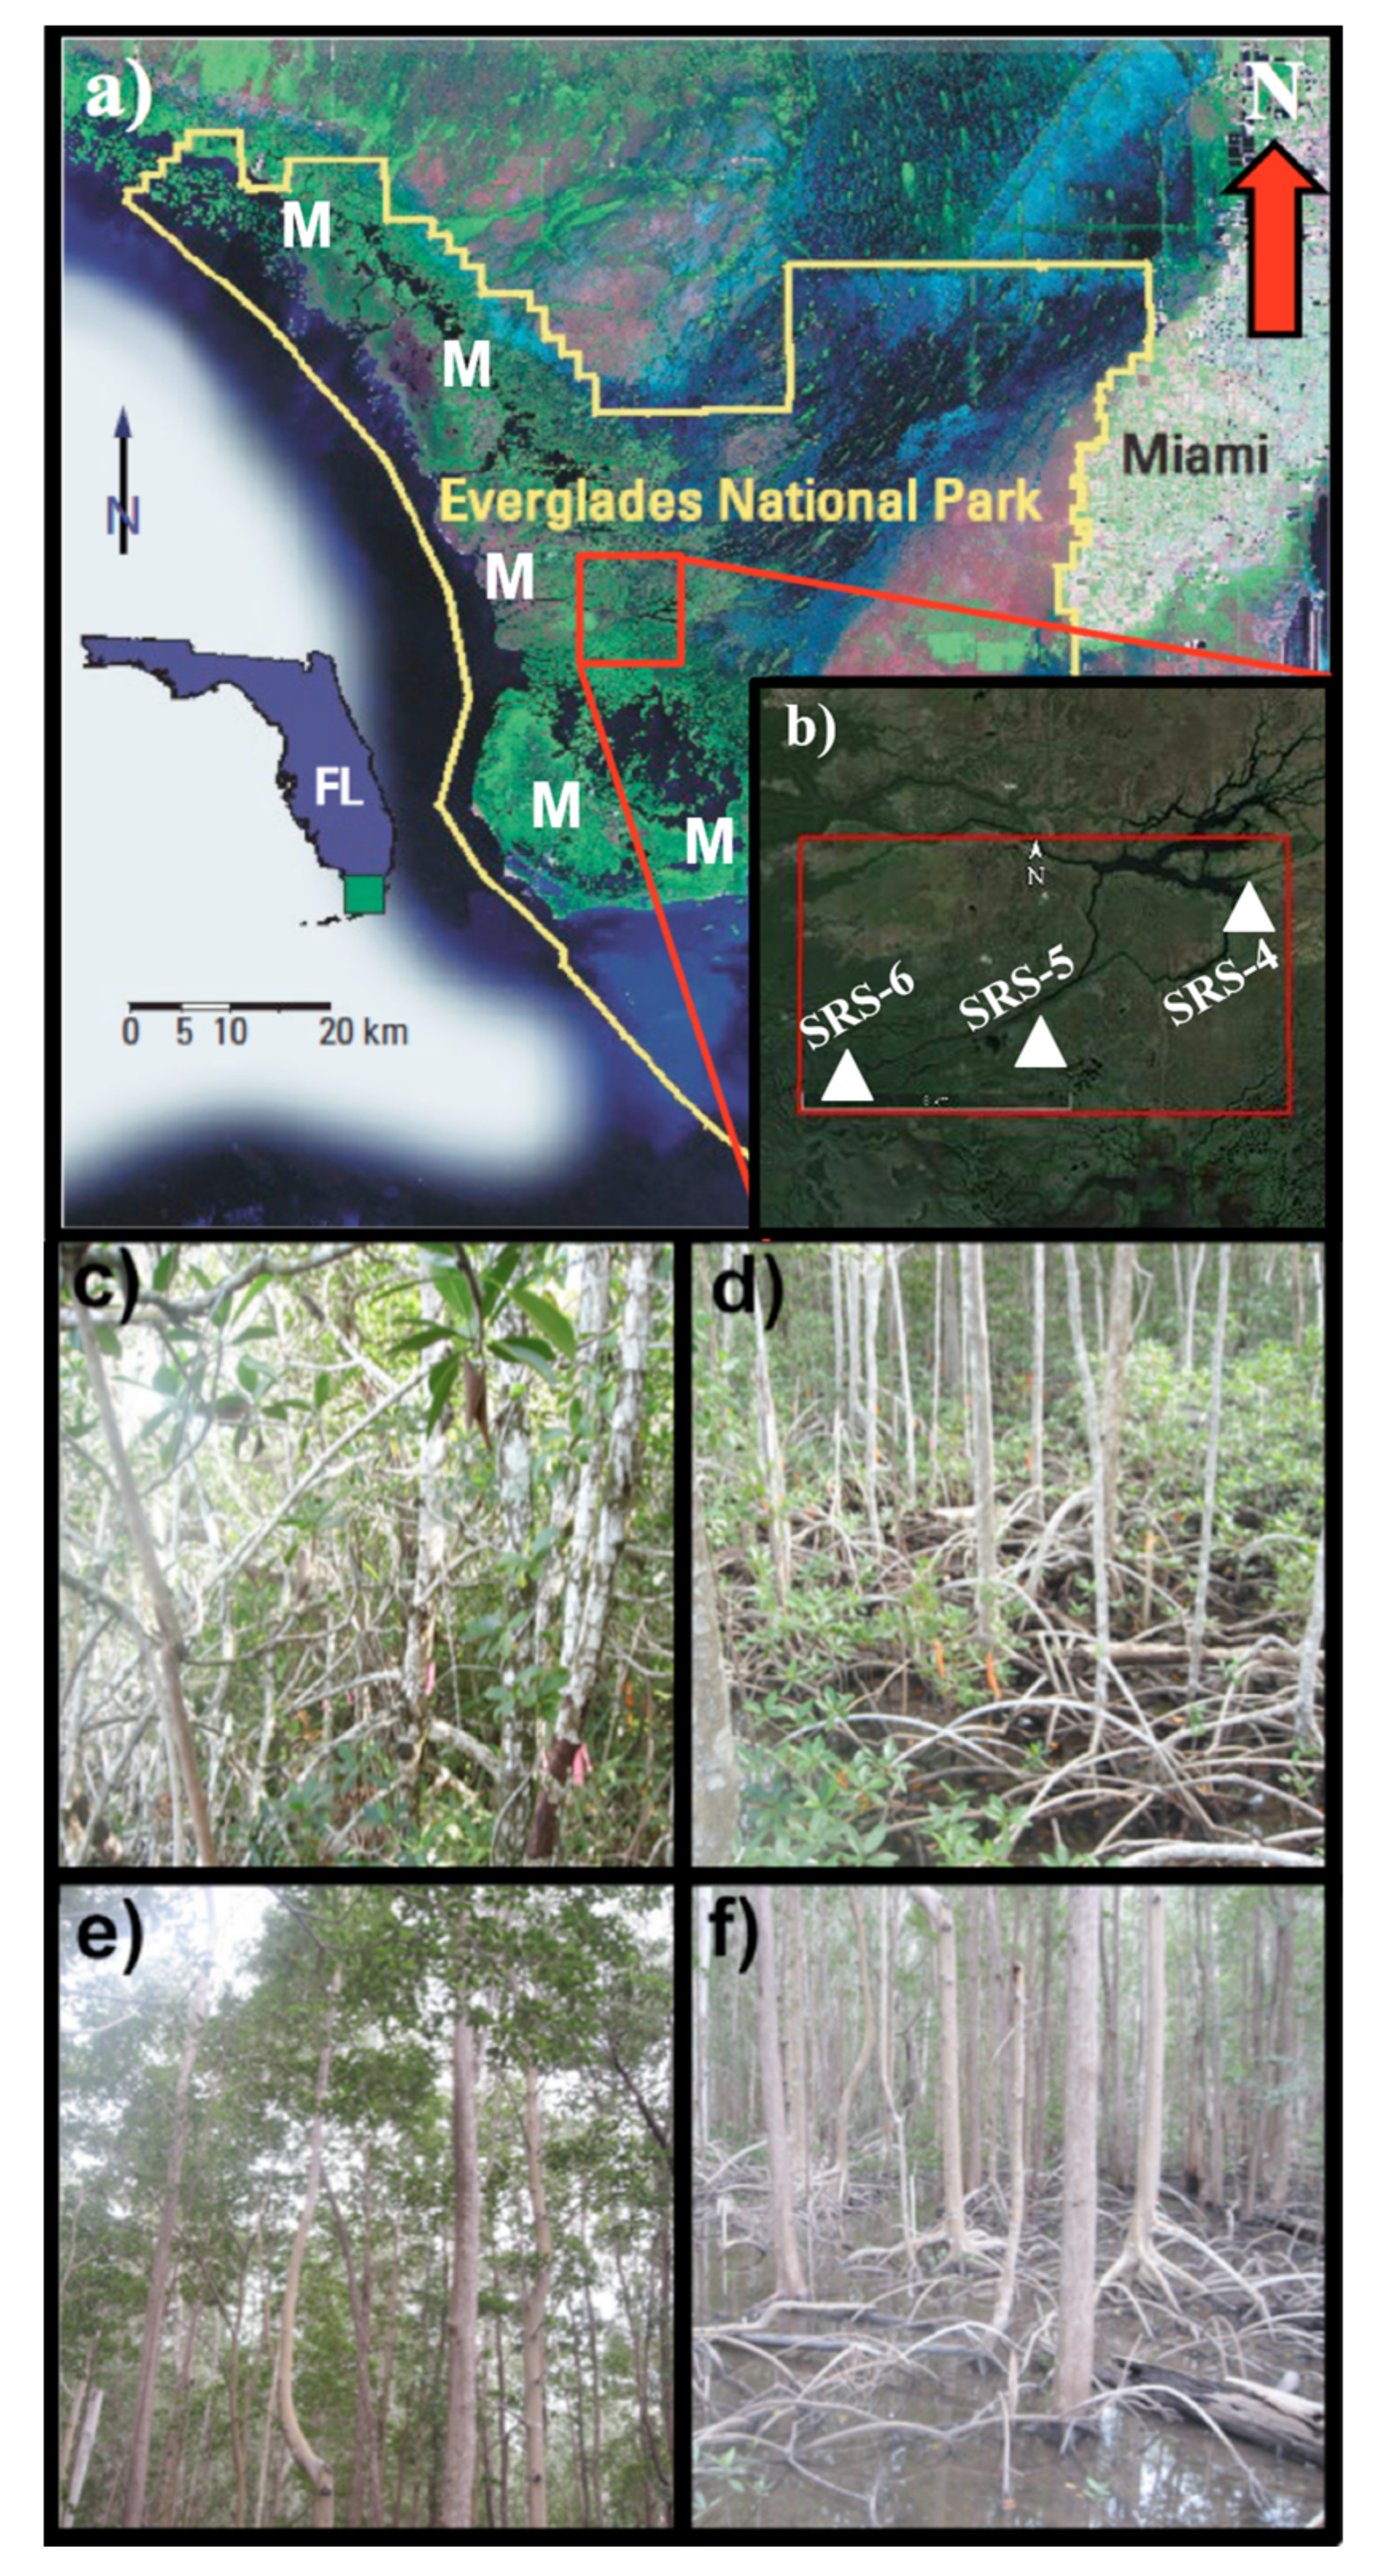
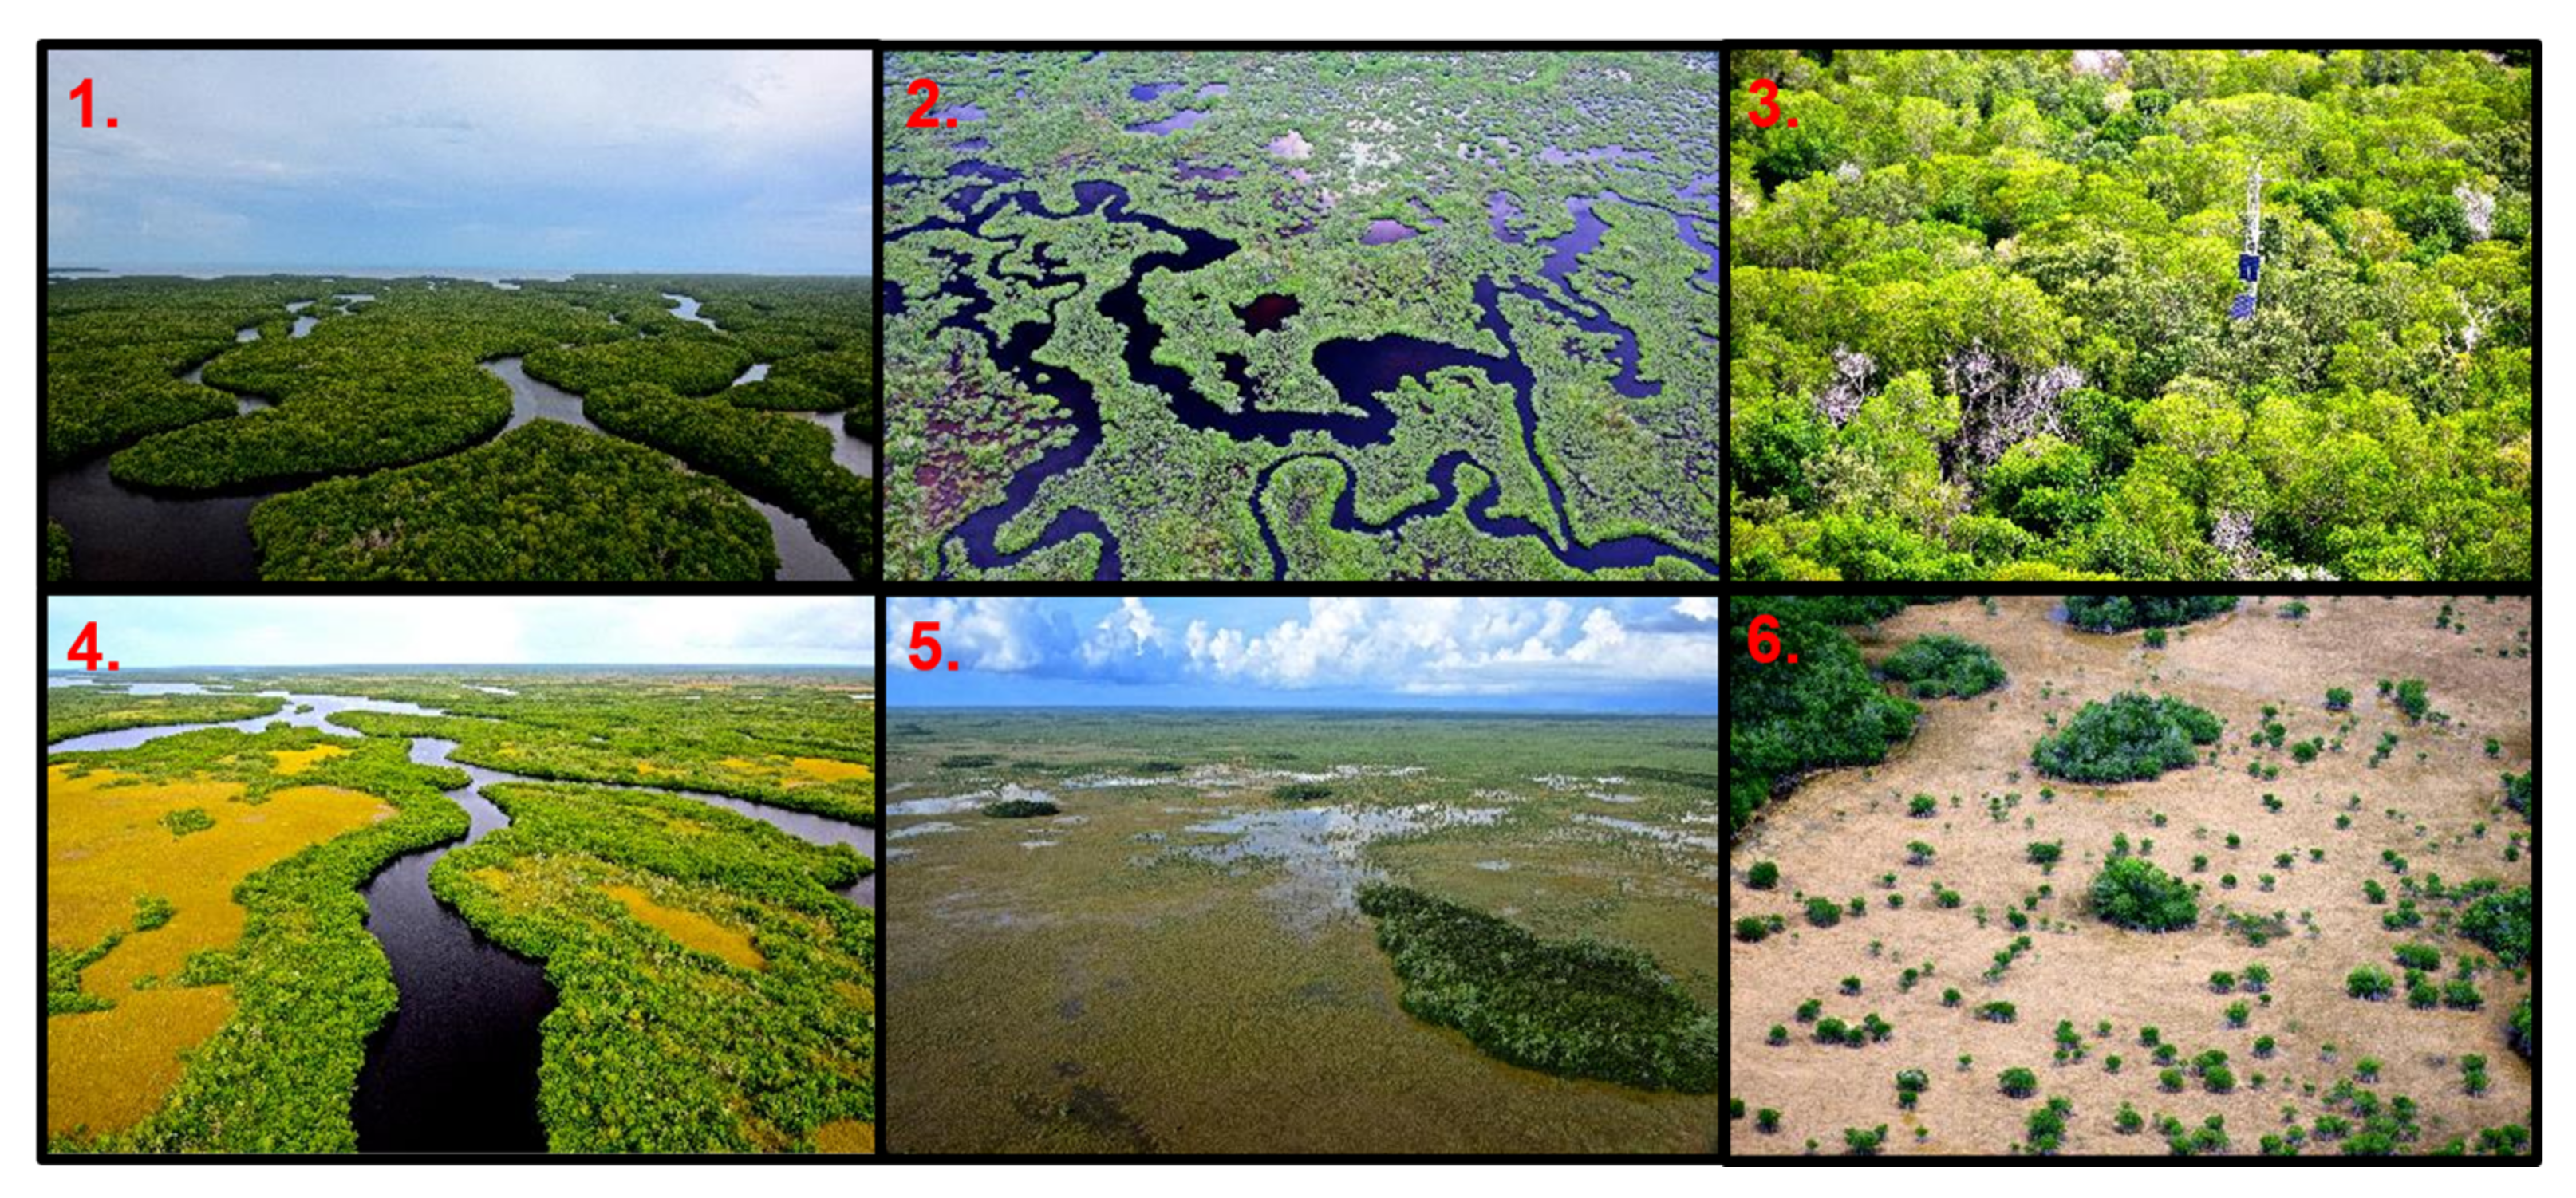
2. Study Area
3. Datasets and Methods
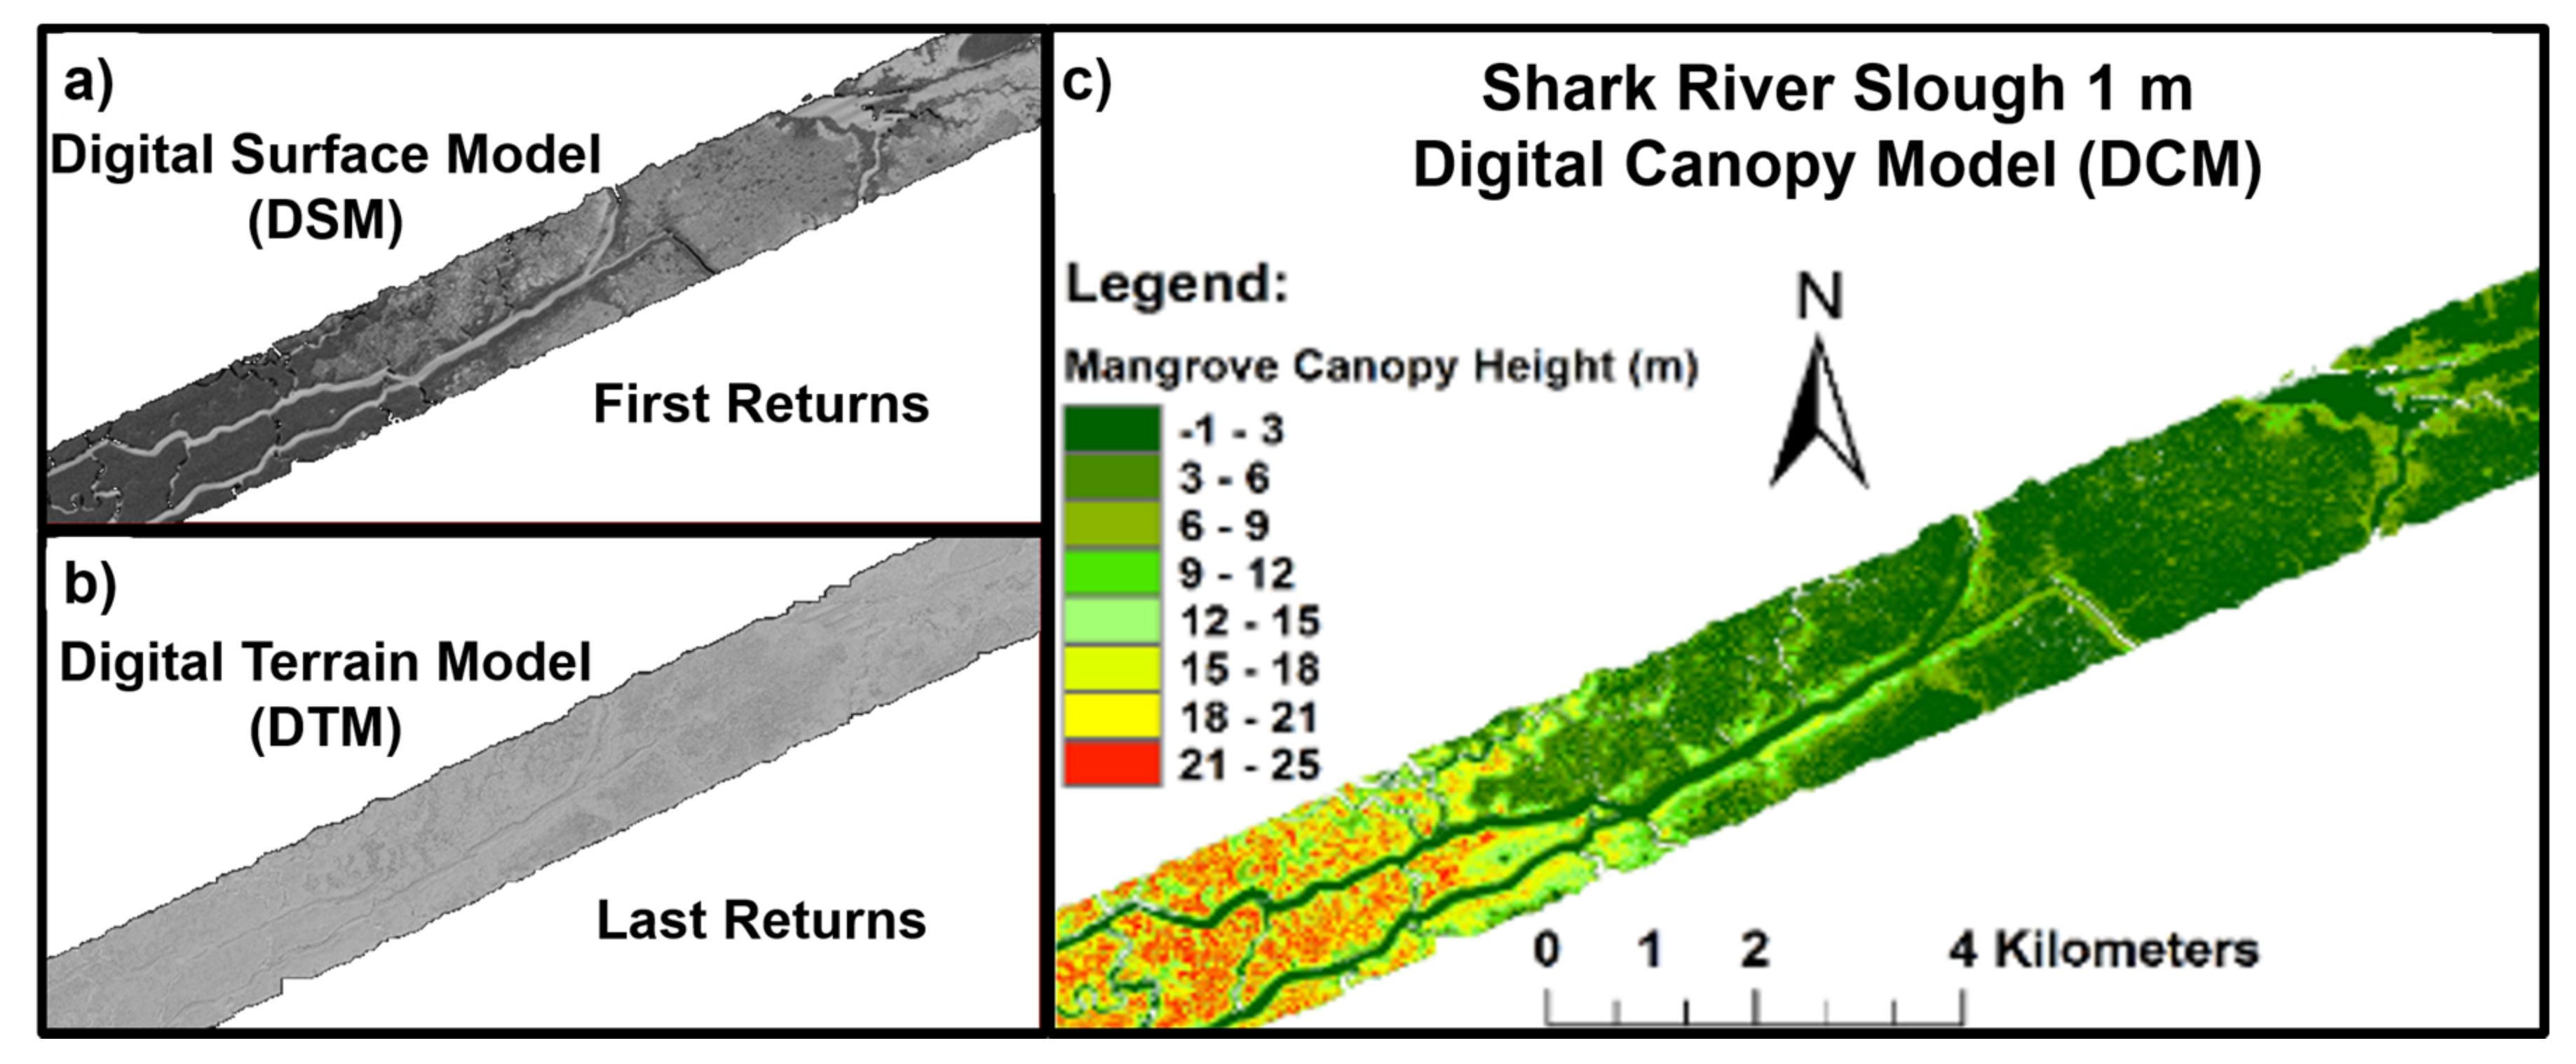
3.1. Airborne Measurements
3.2. Space-Based Measurements
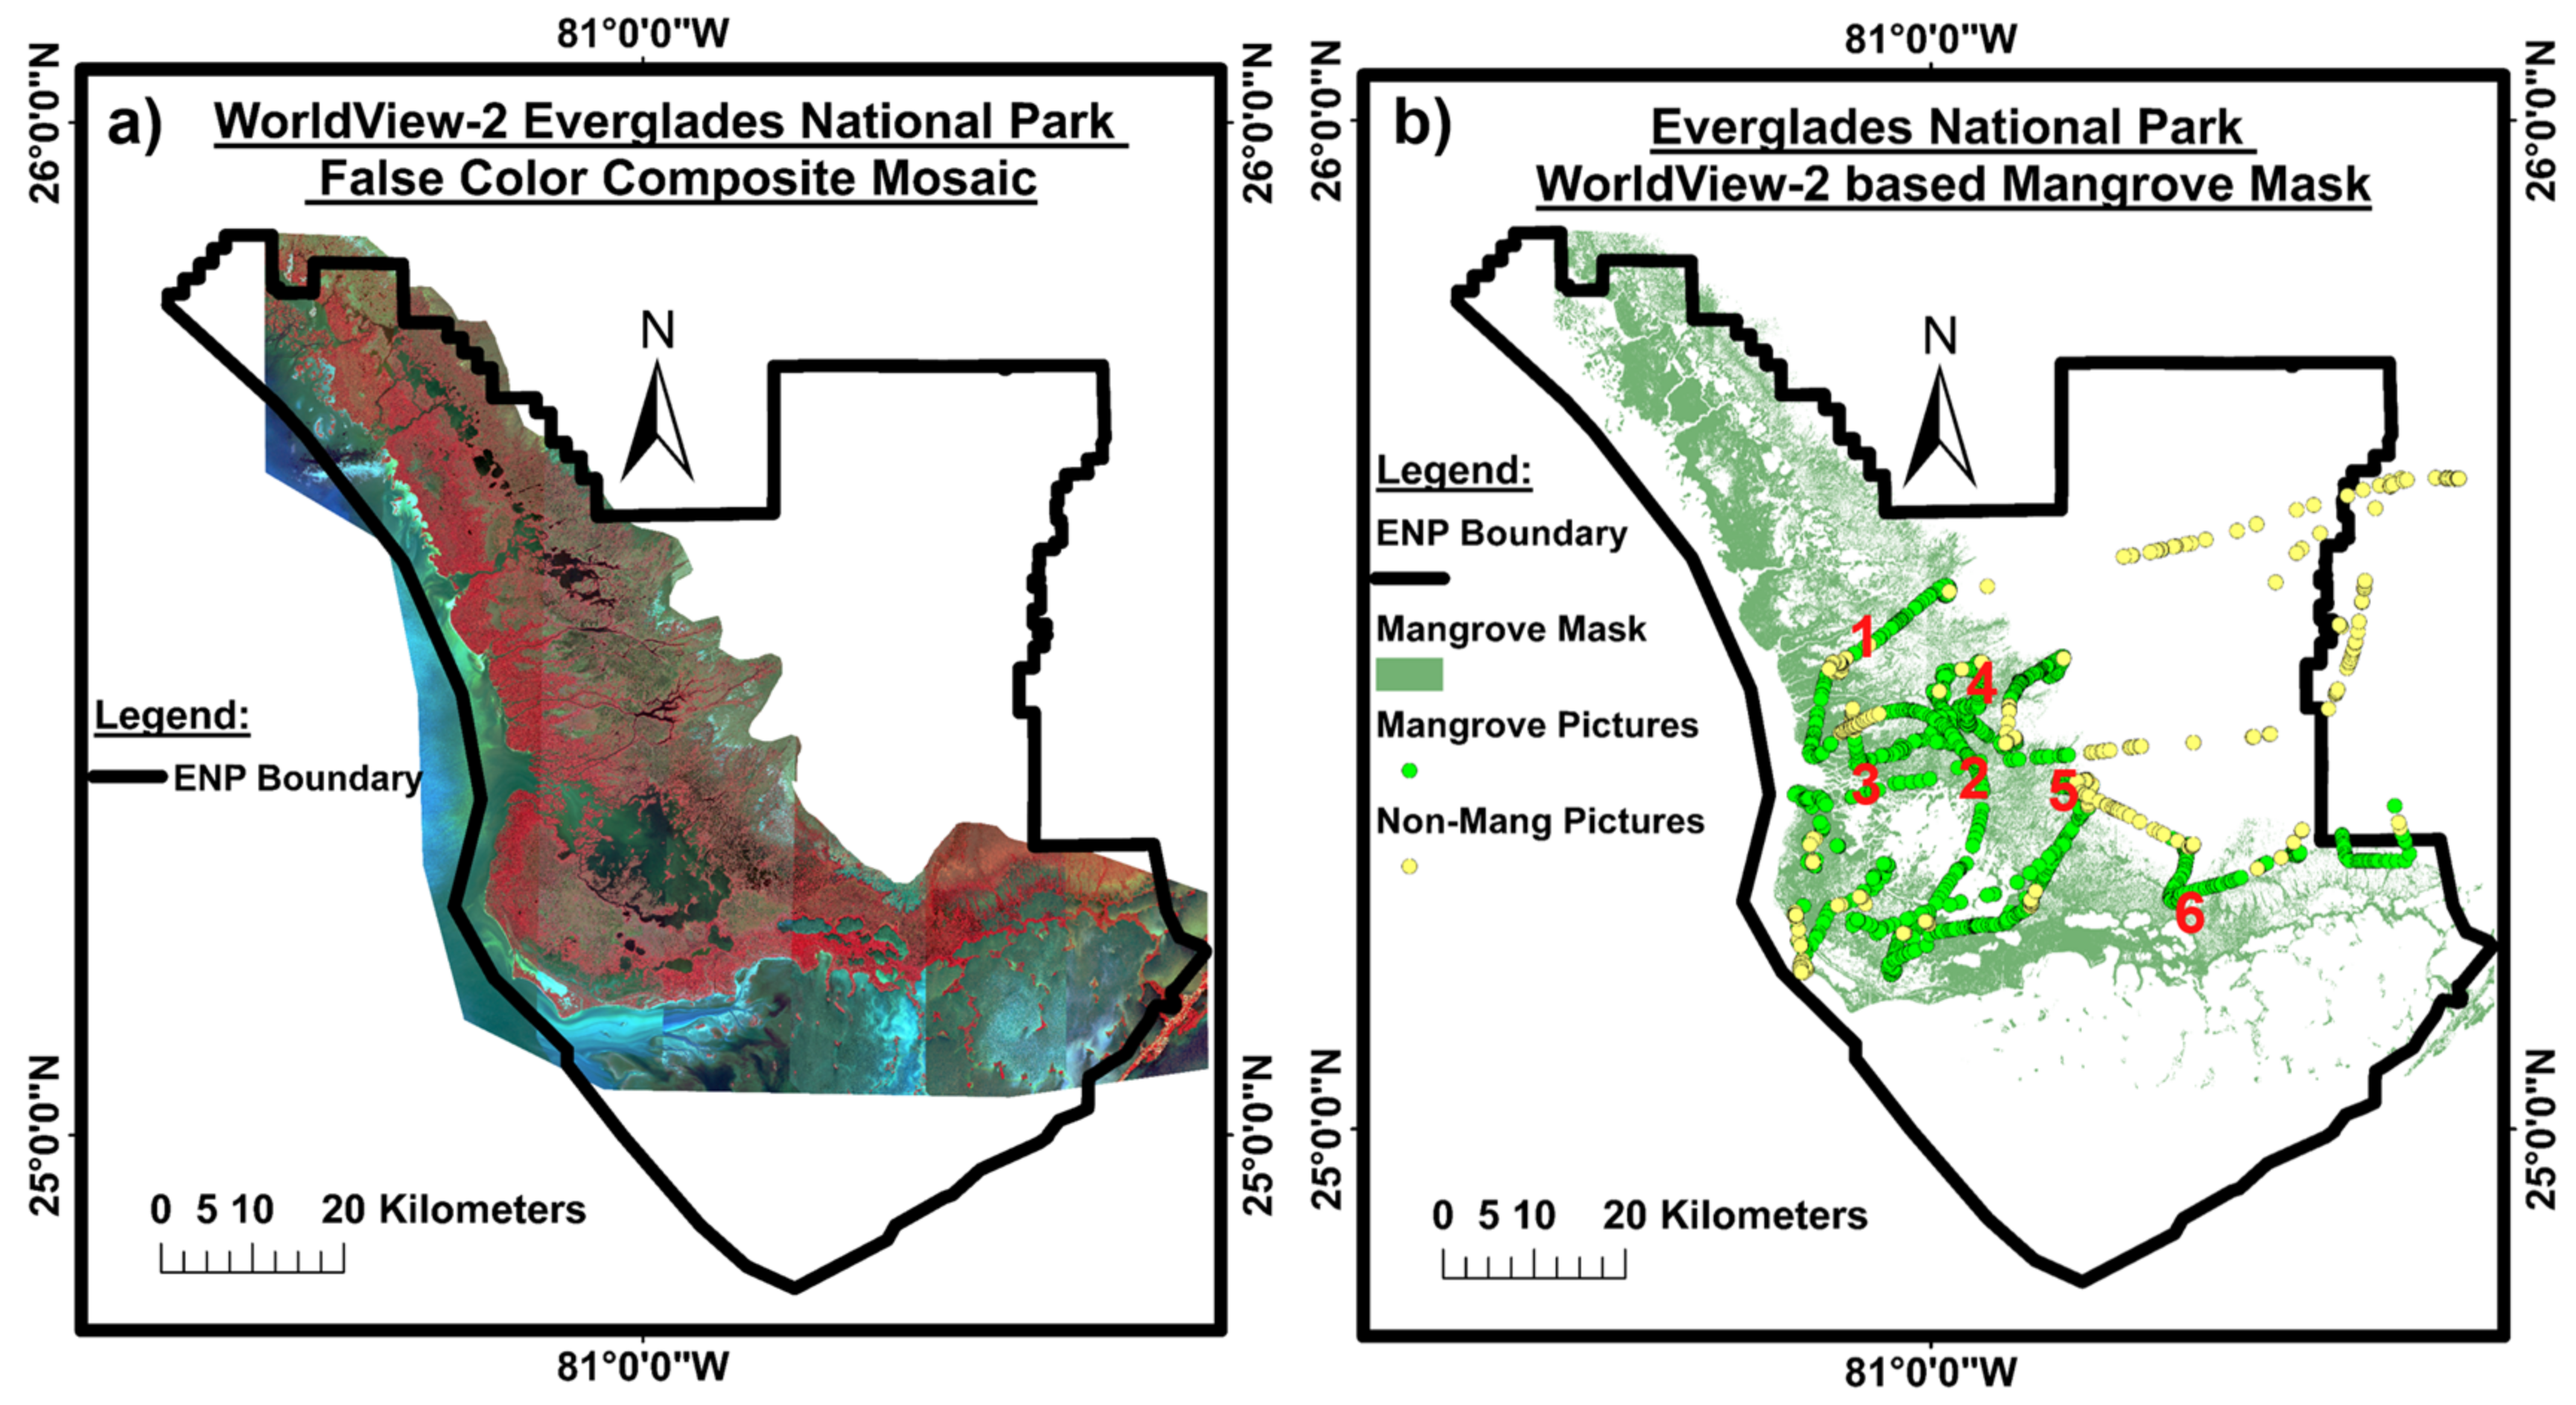
3.2.1. WorldView-2 Mangrove Cover Map
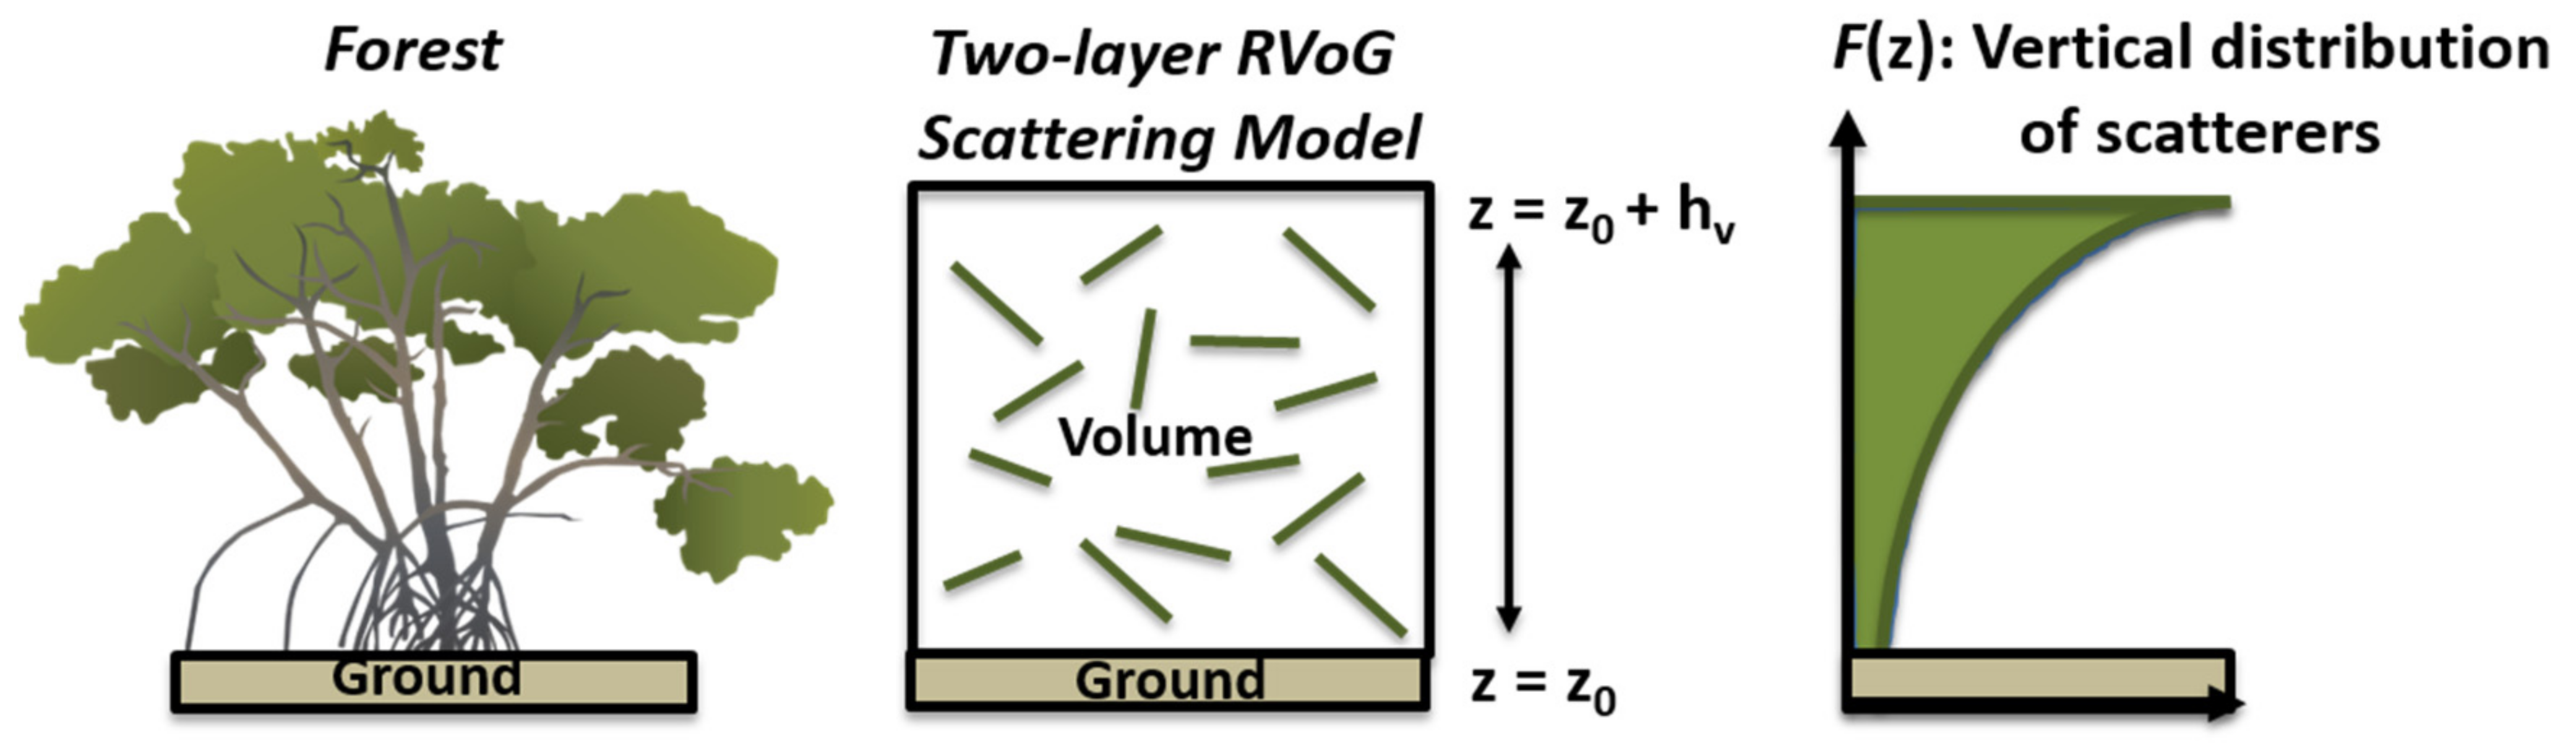
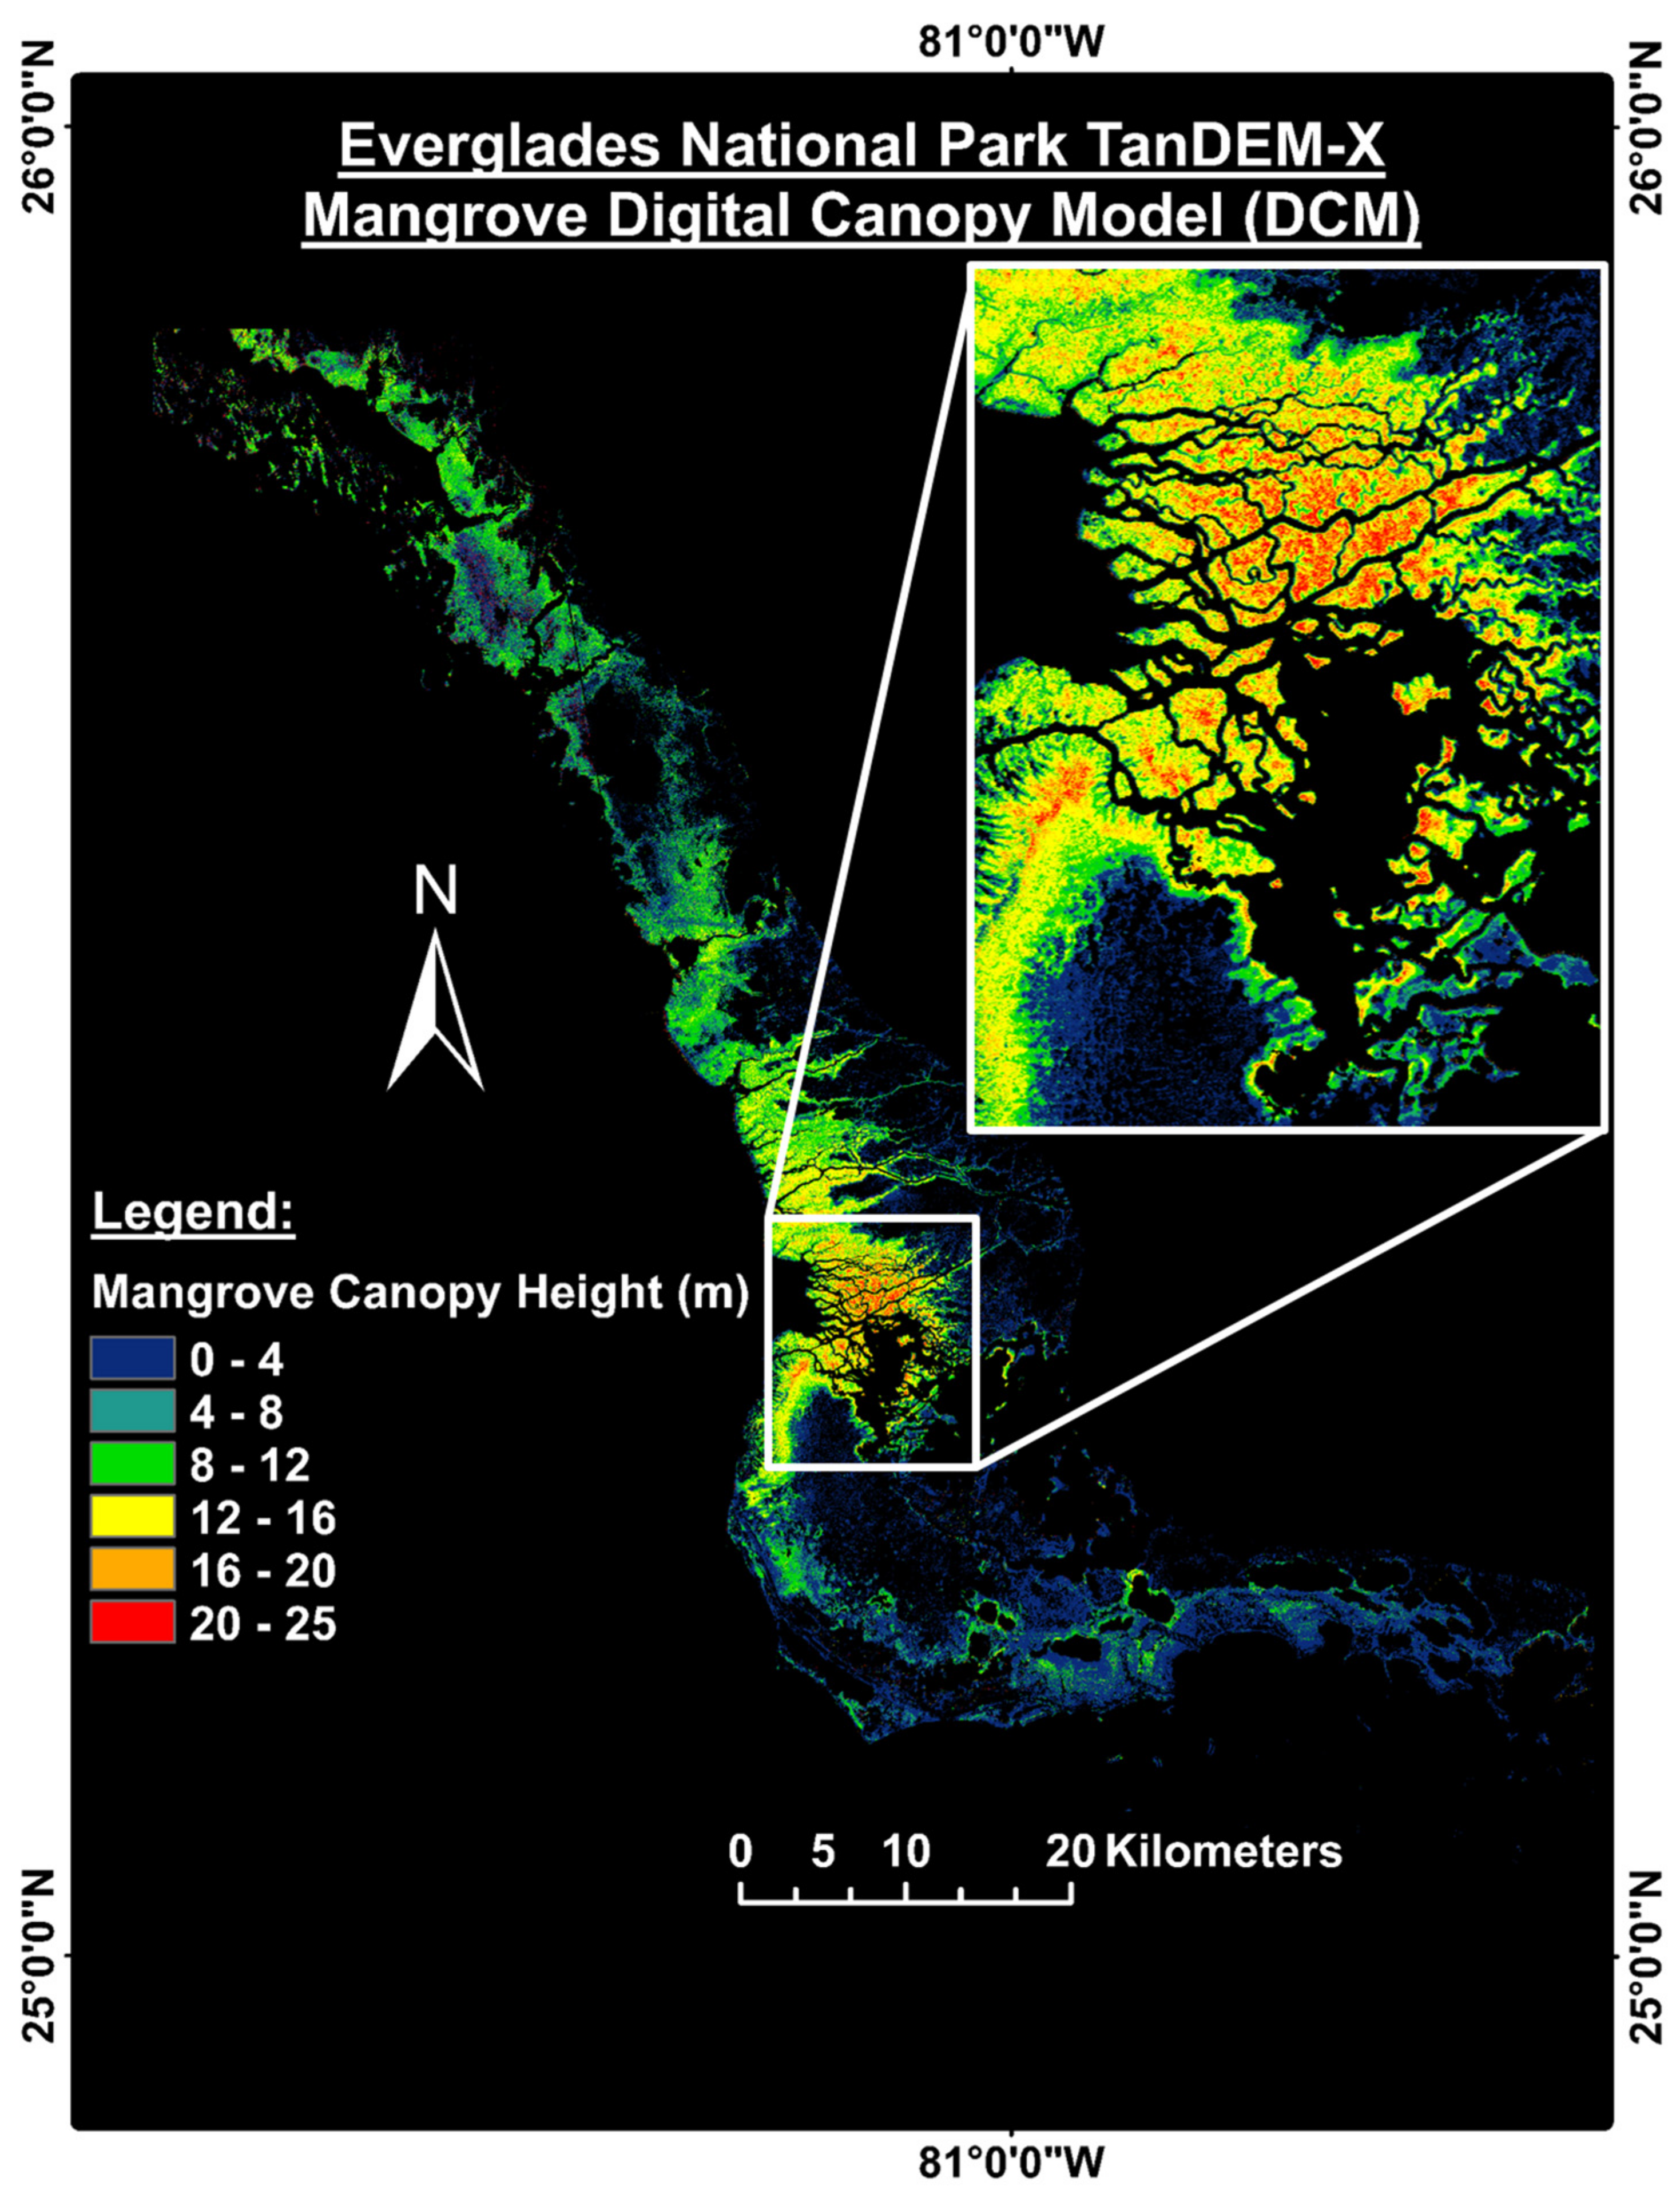
3.2.2. TanDEM-X Data
4. Results
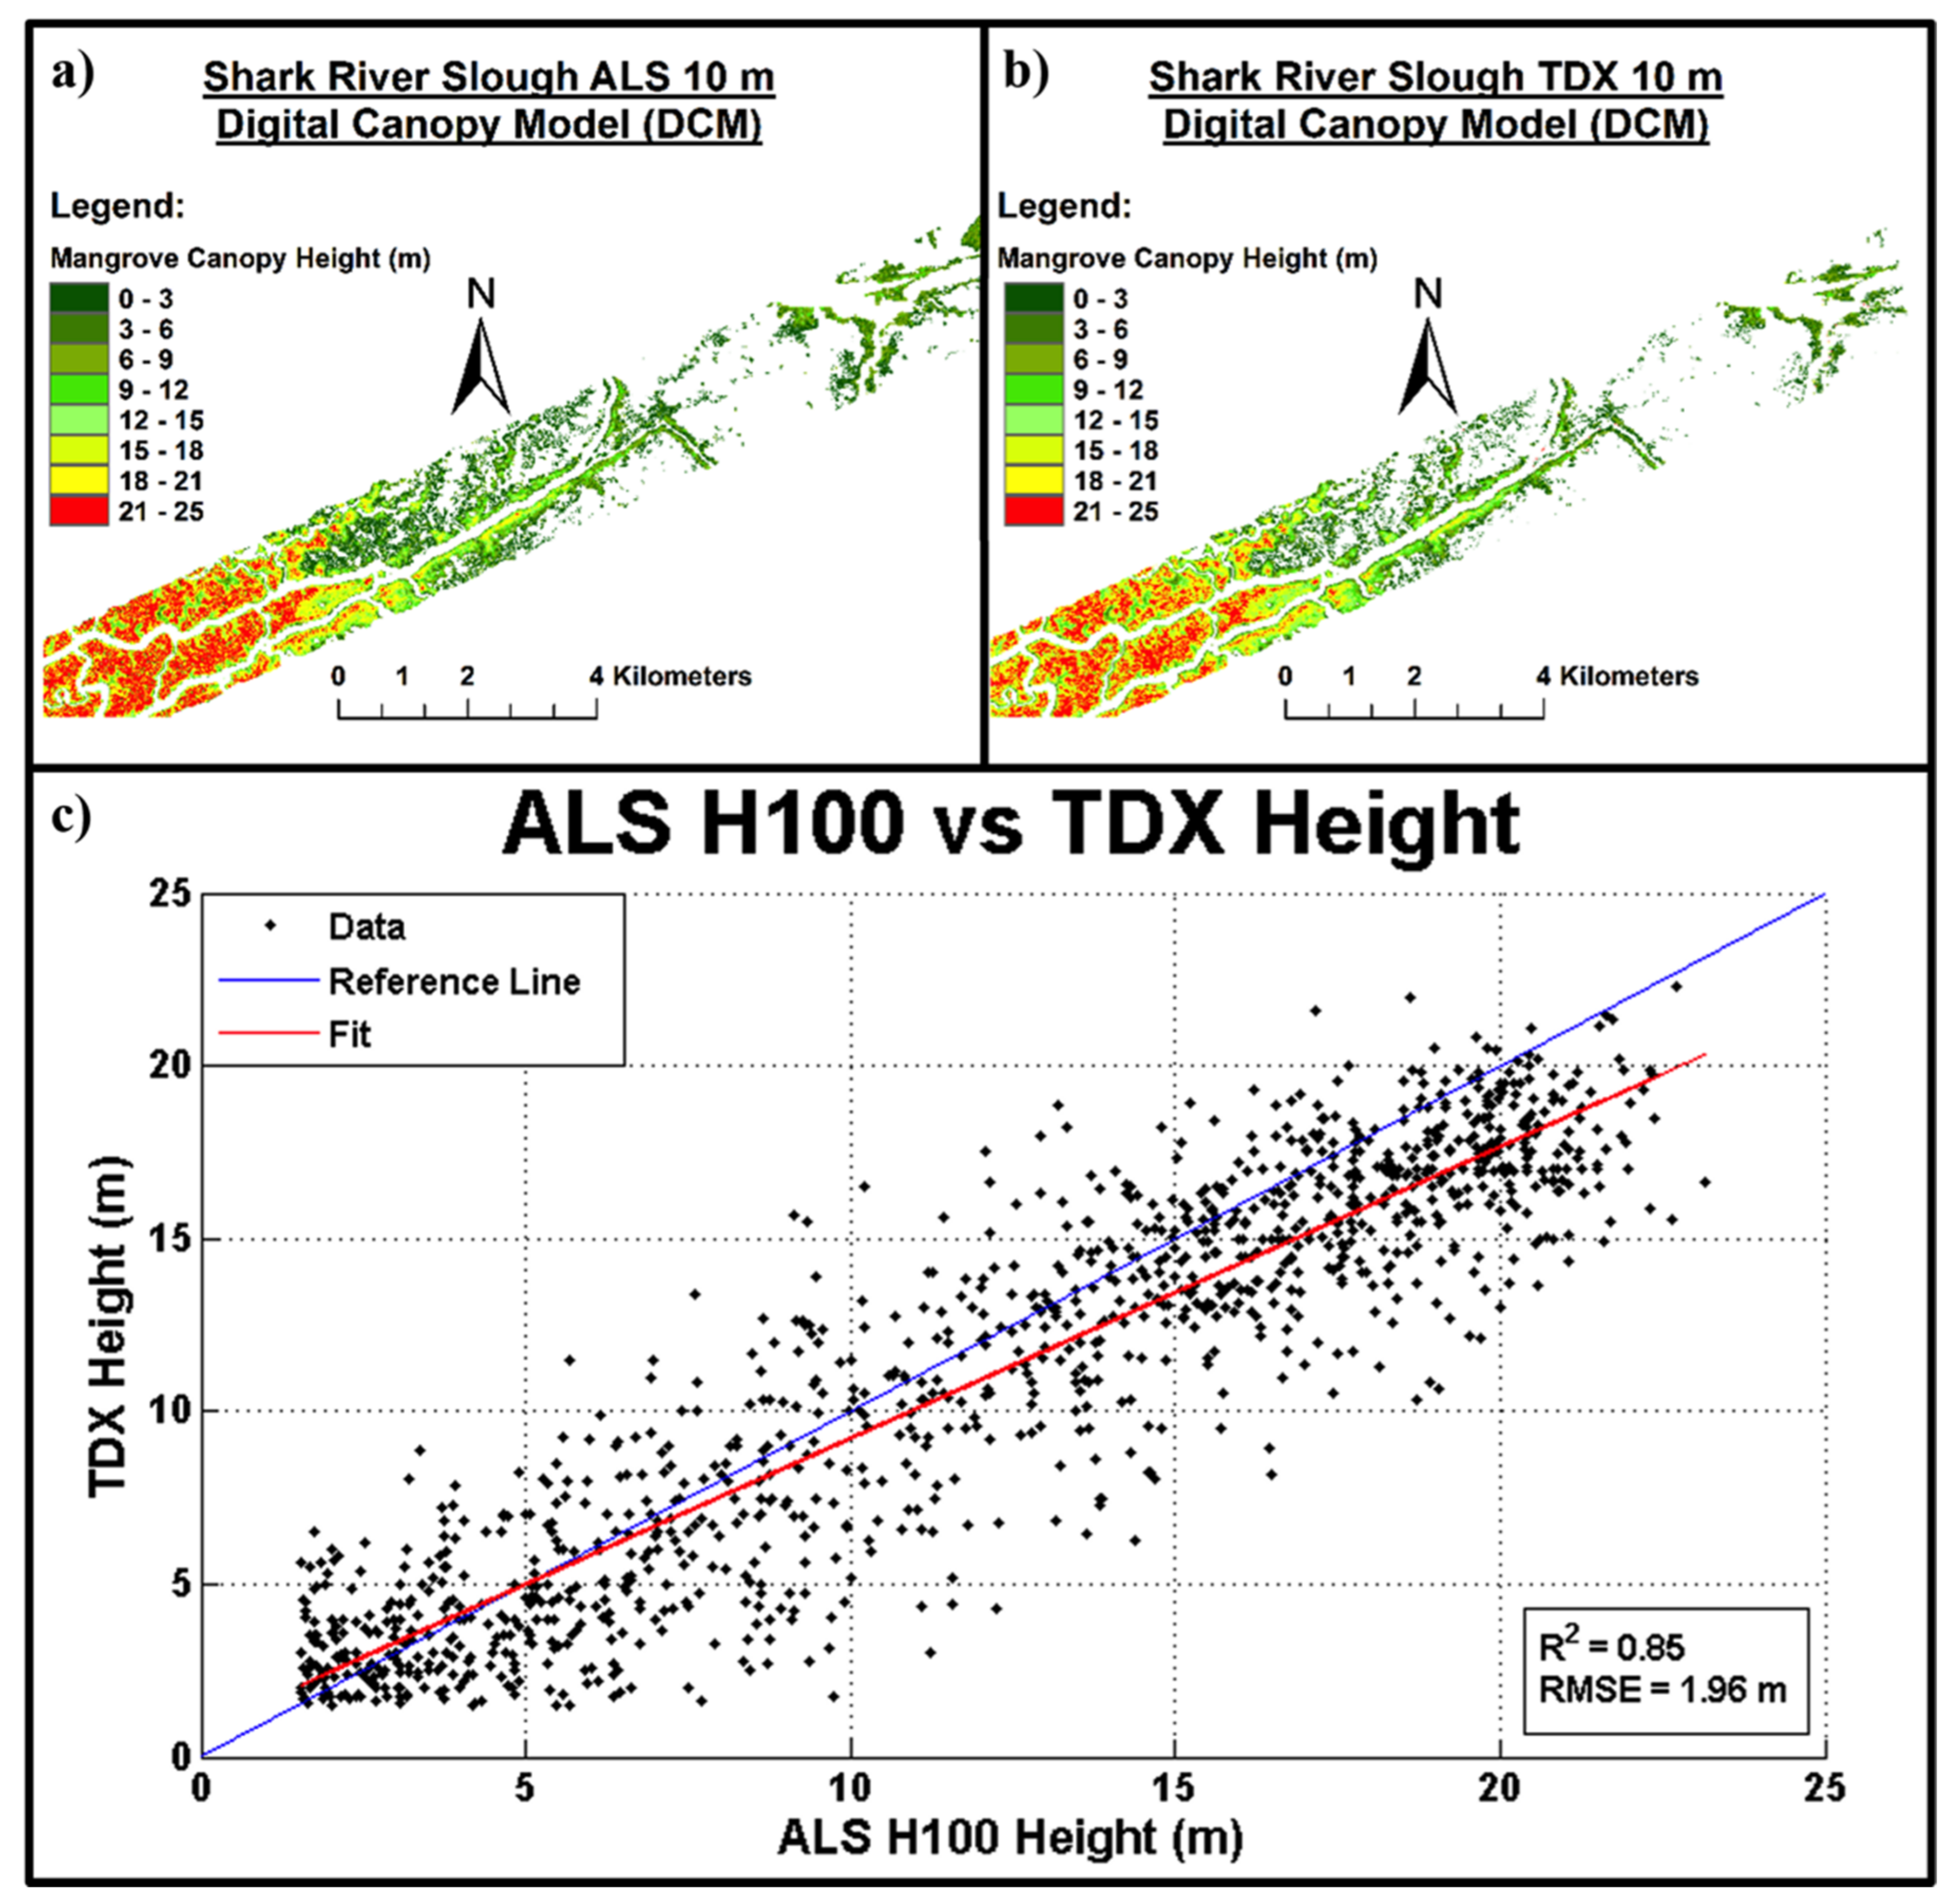
4.1. Quality Assessment of the TanDEM-X Results
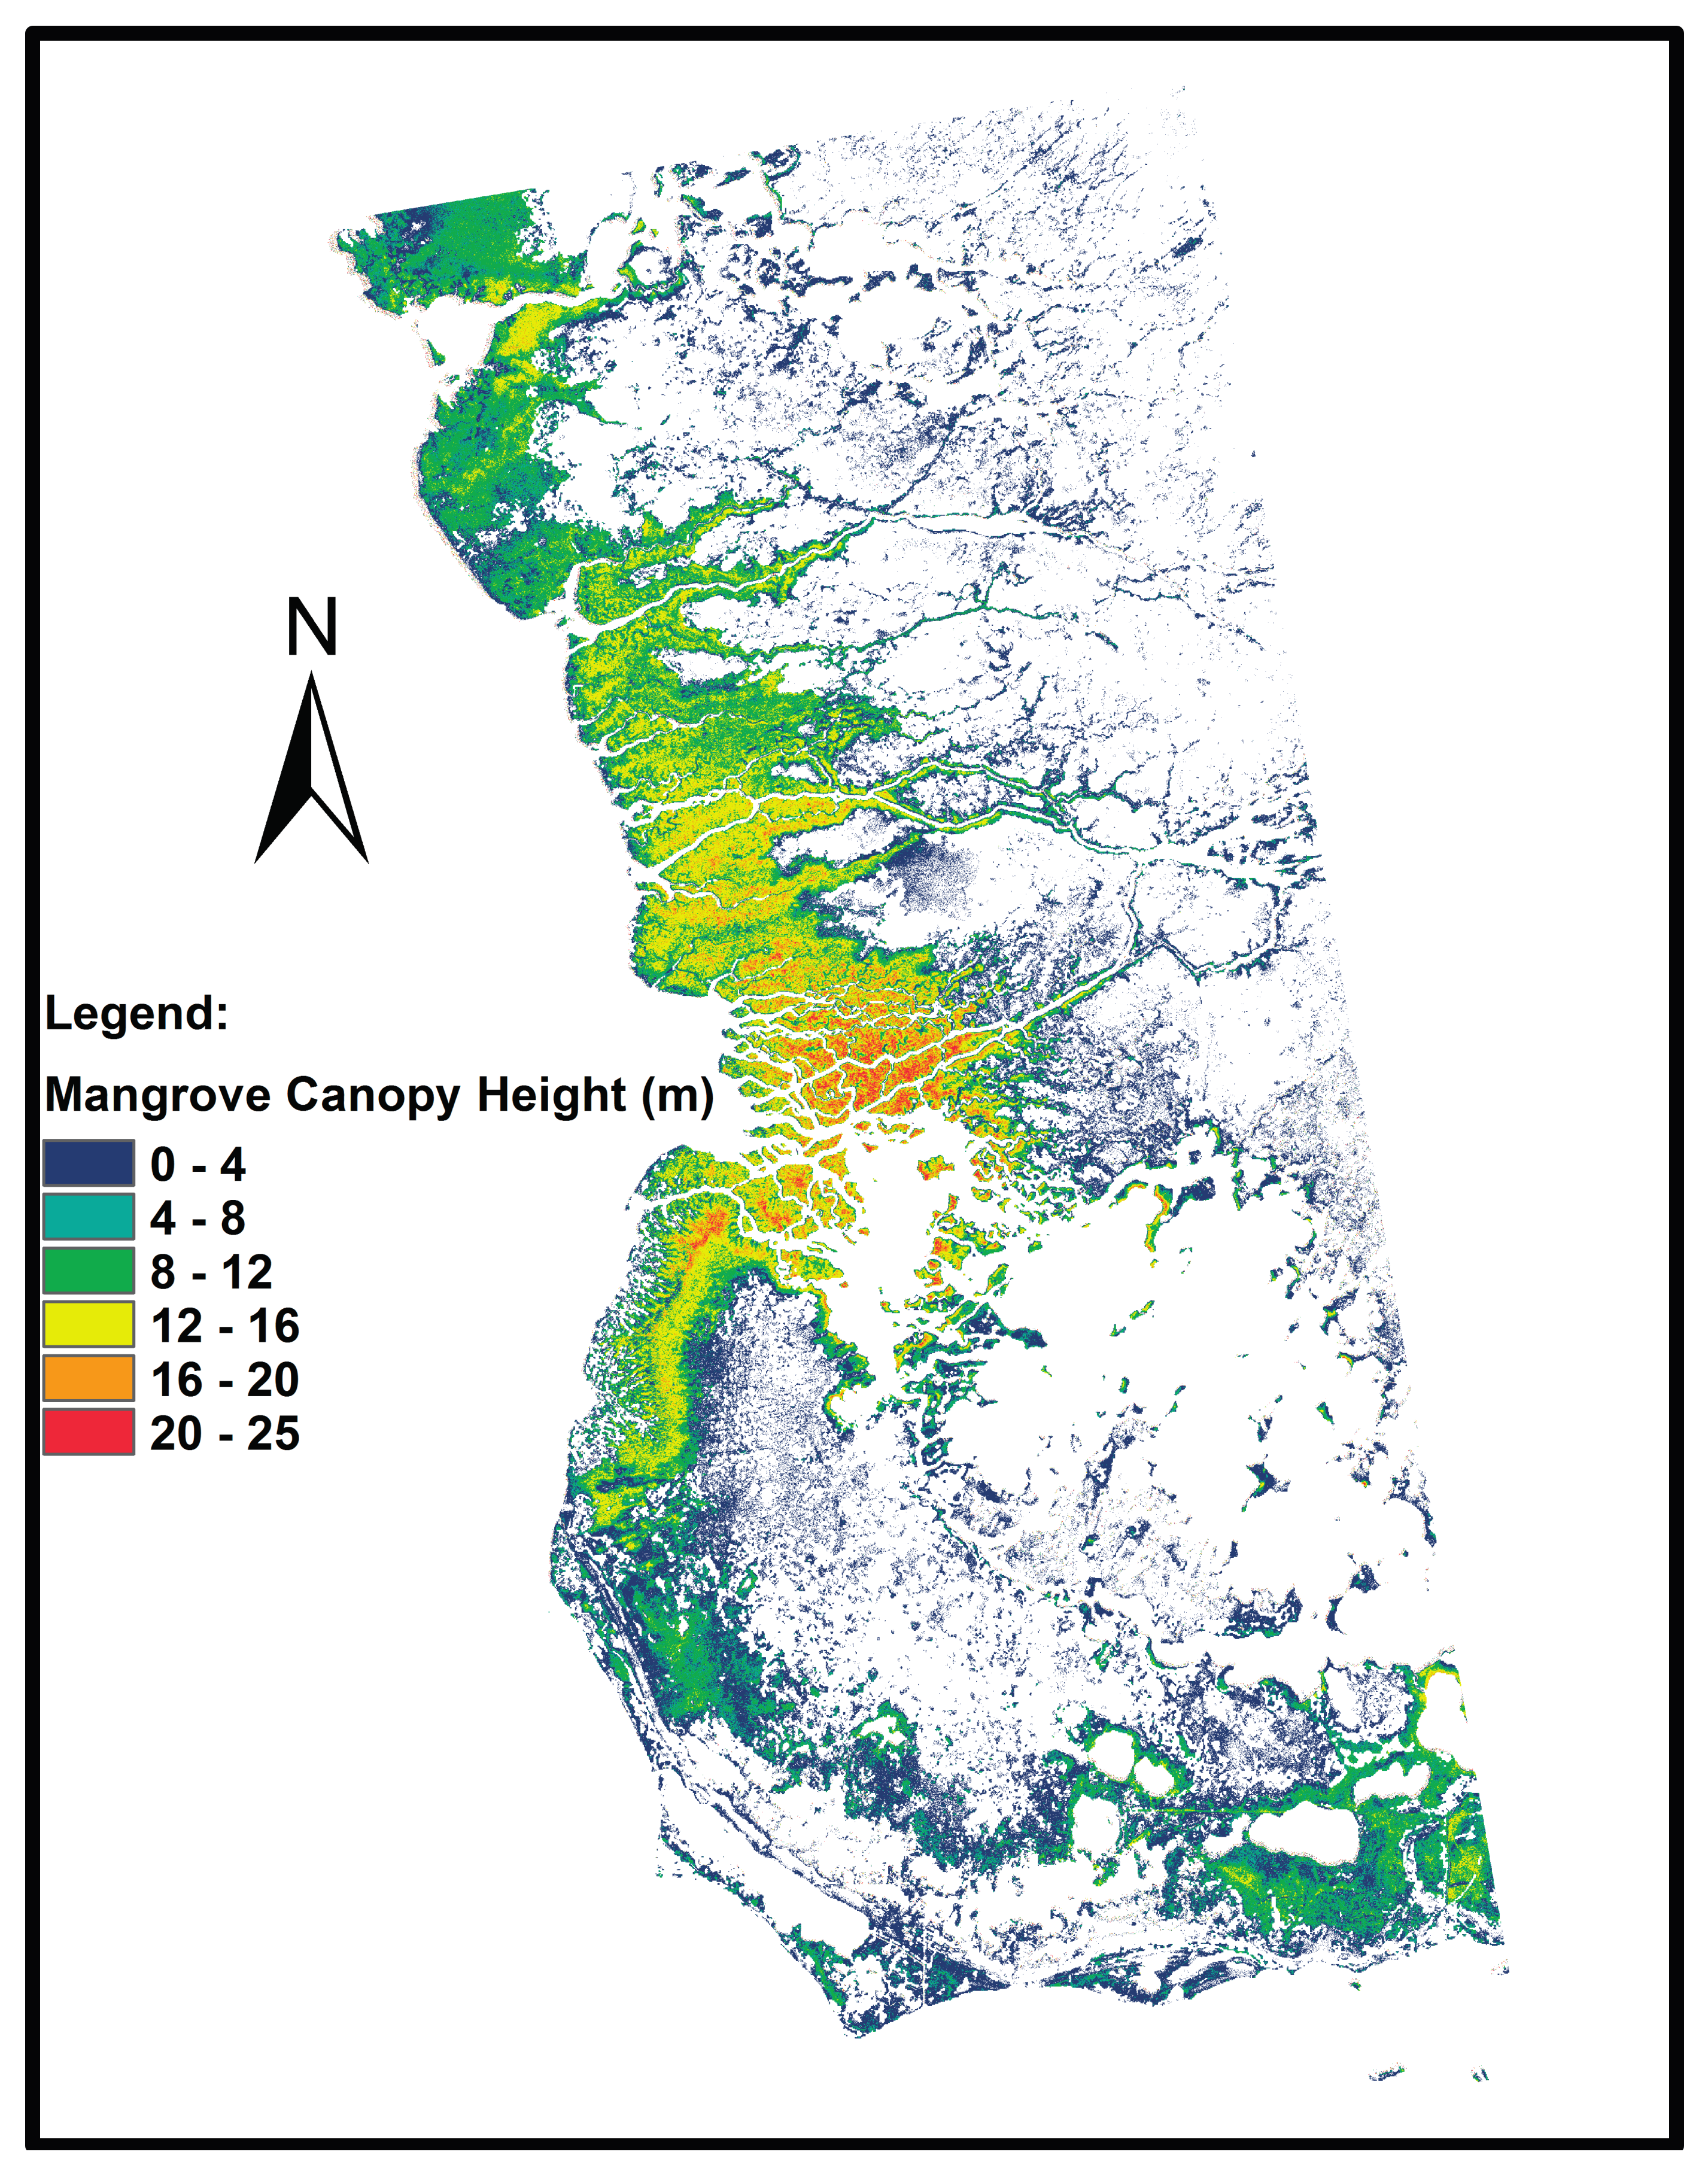
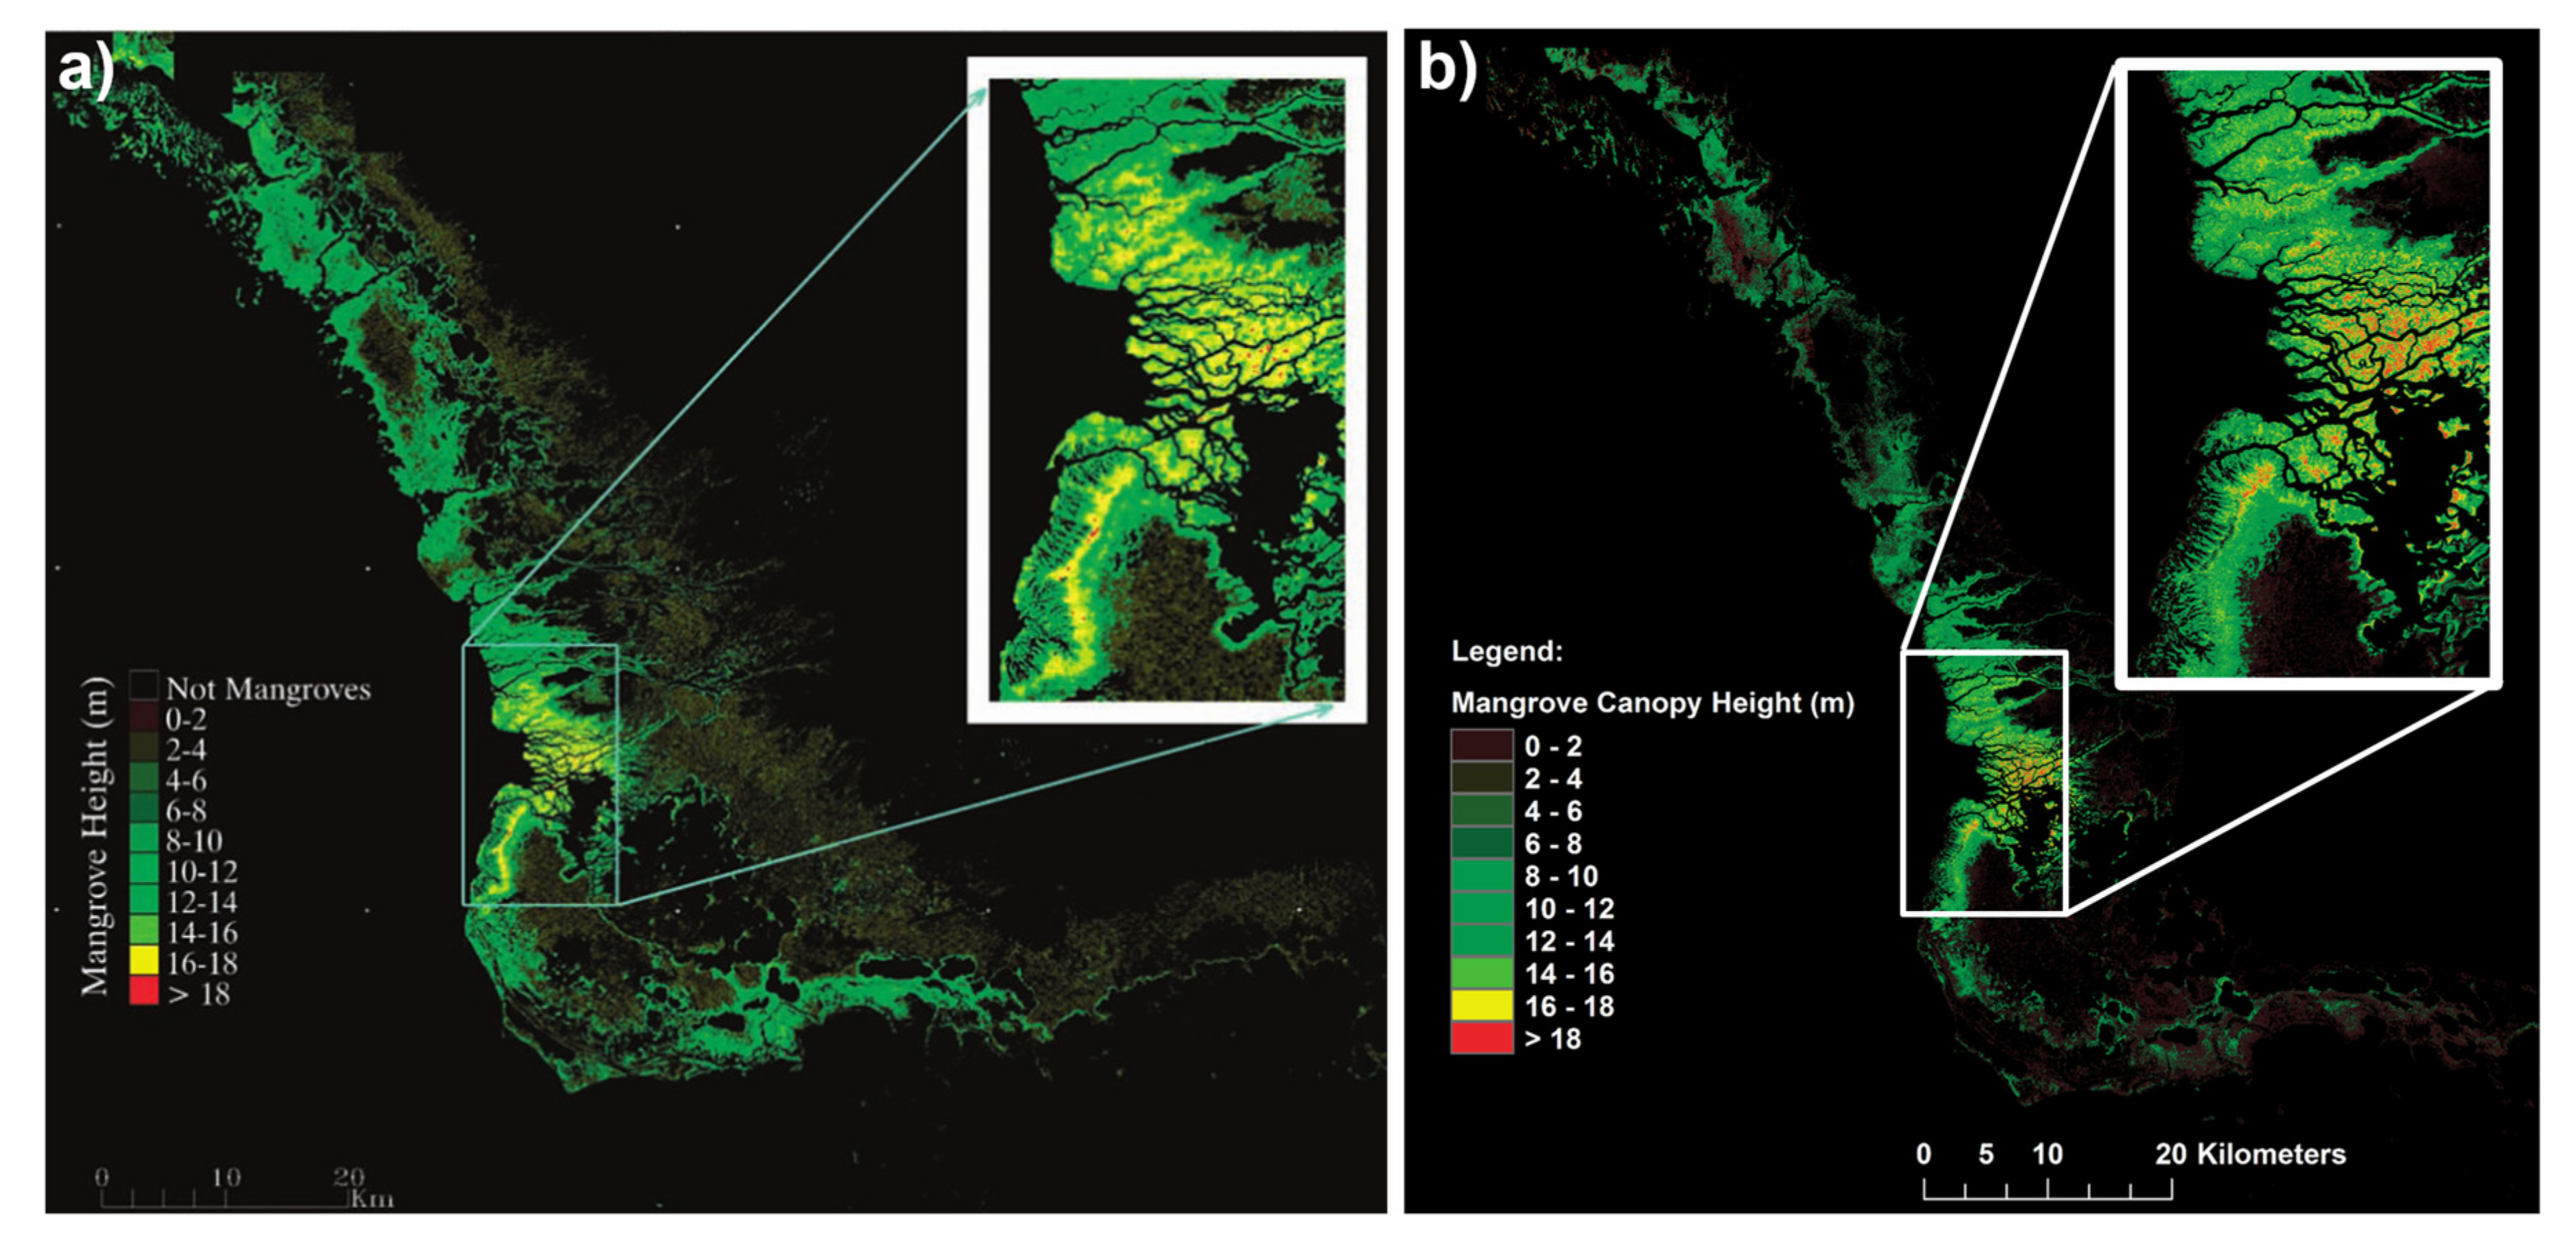
4.2. Everglades National Park Mangrove Digital Canopy Model
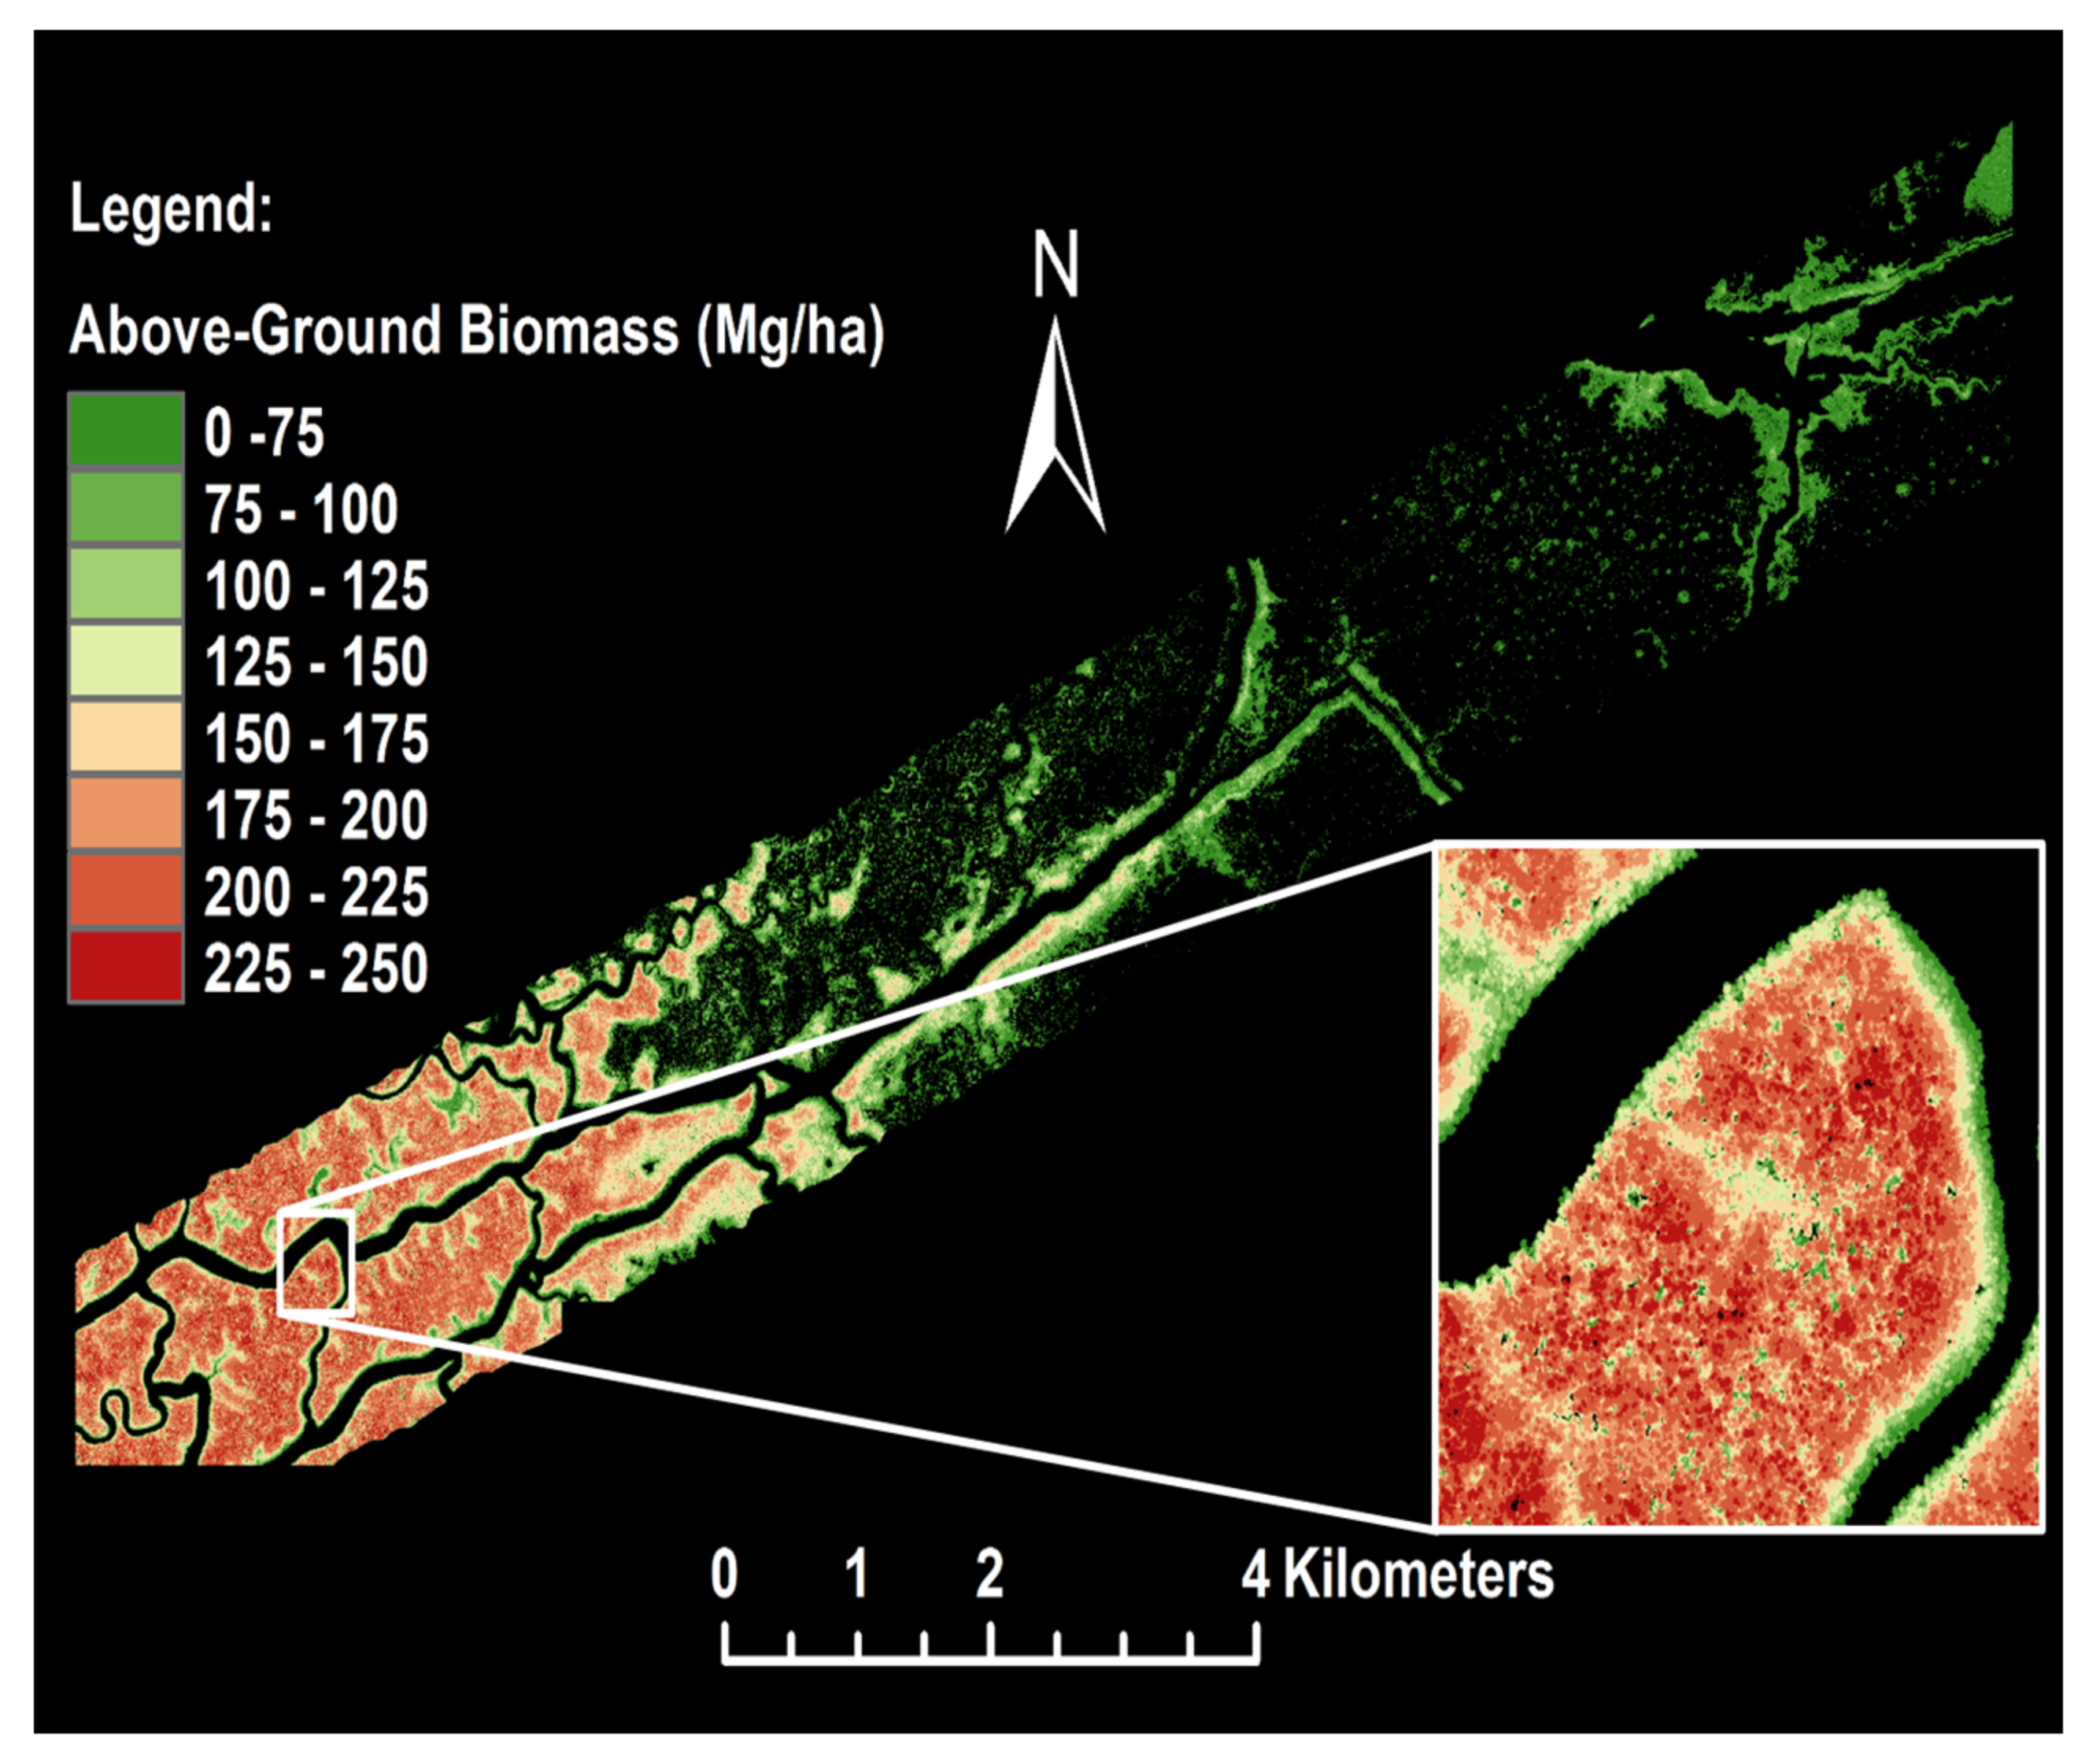
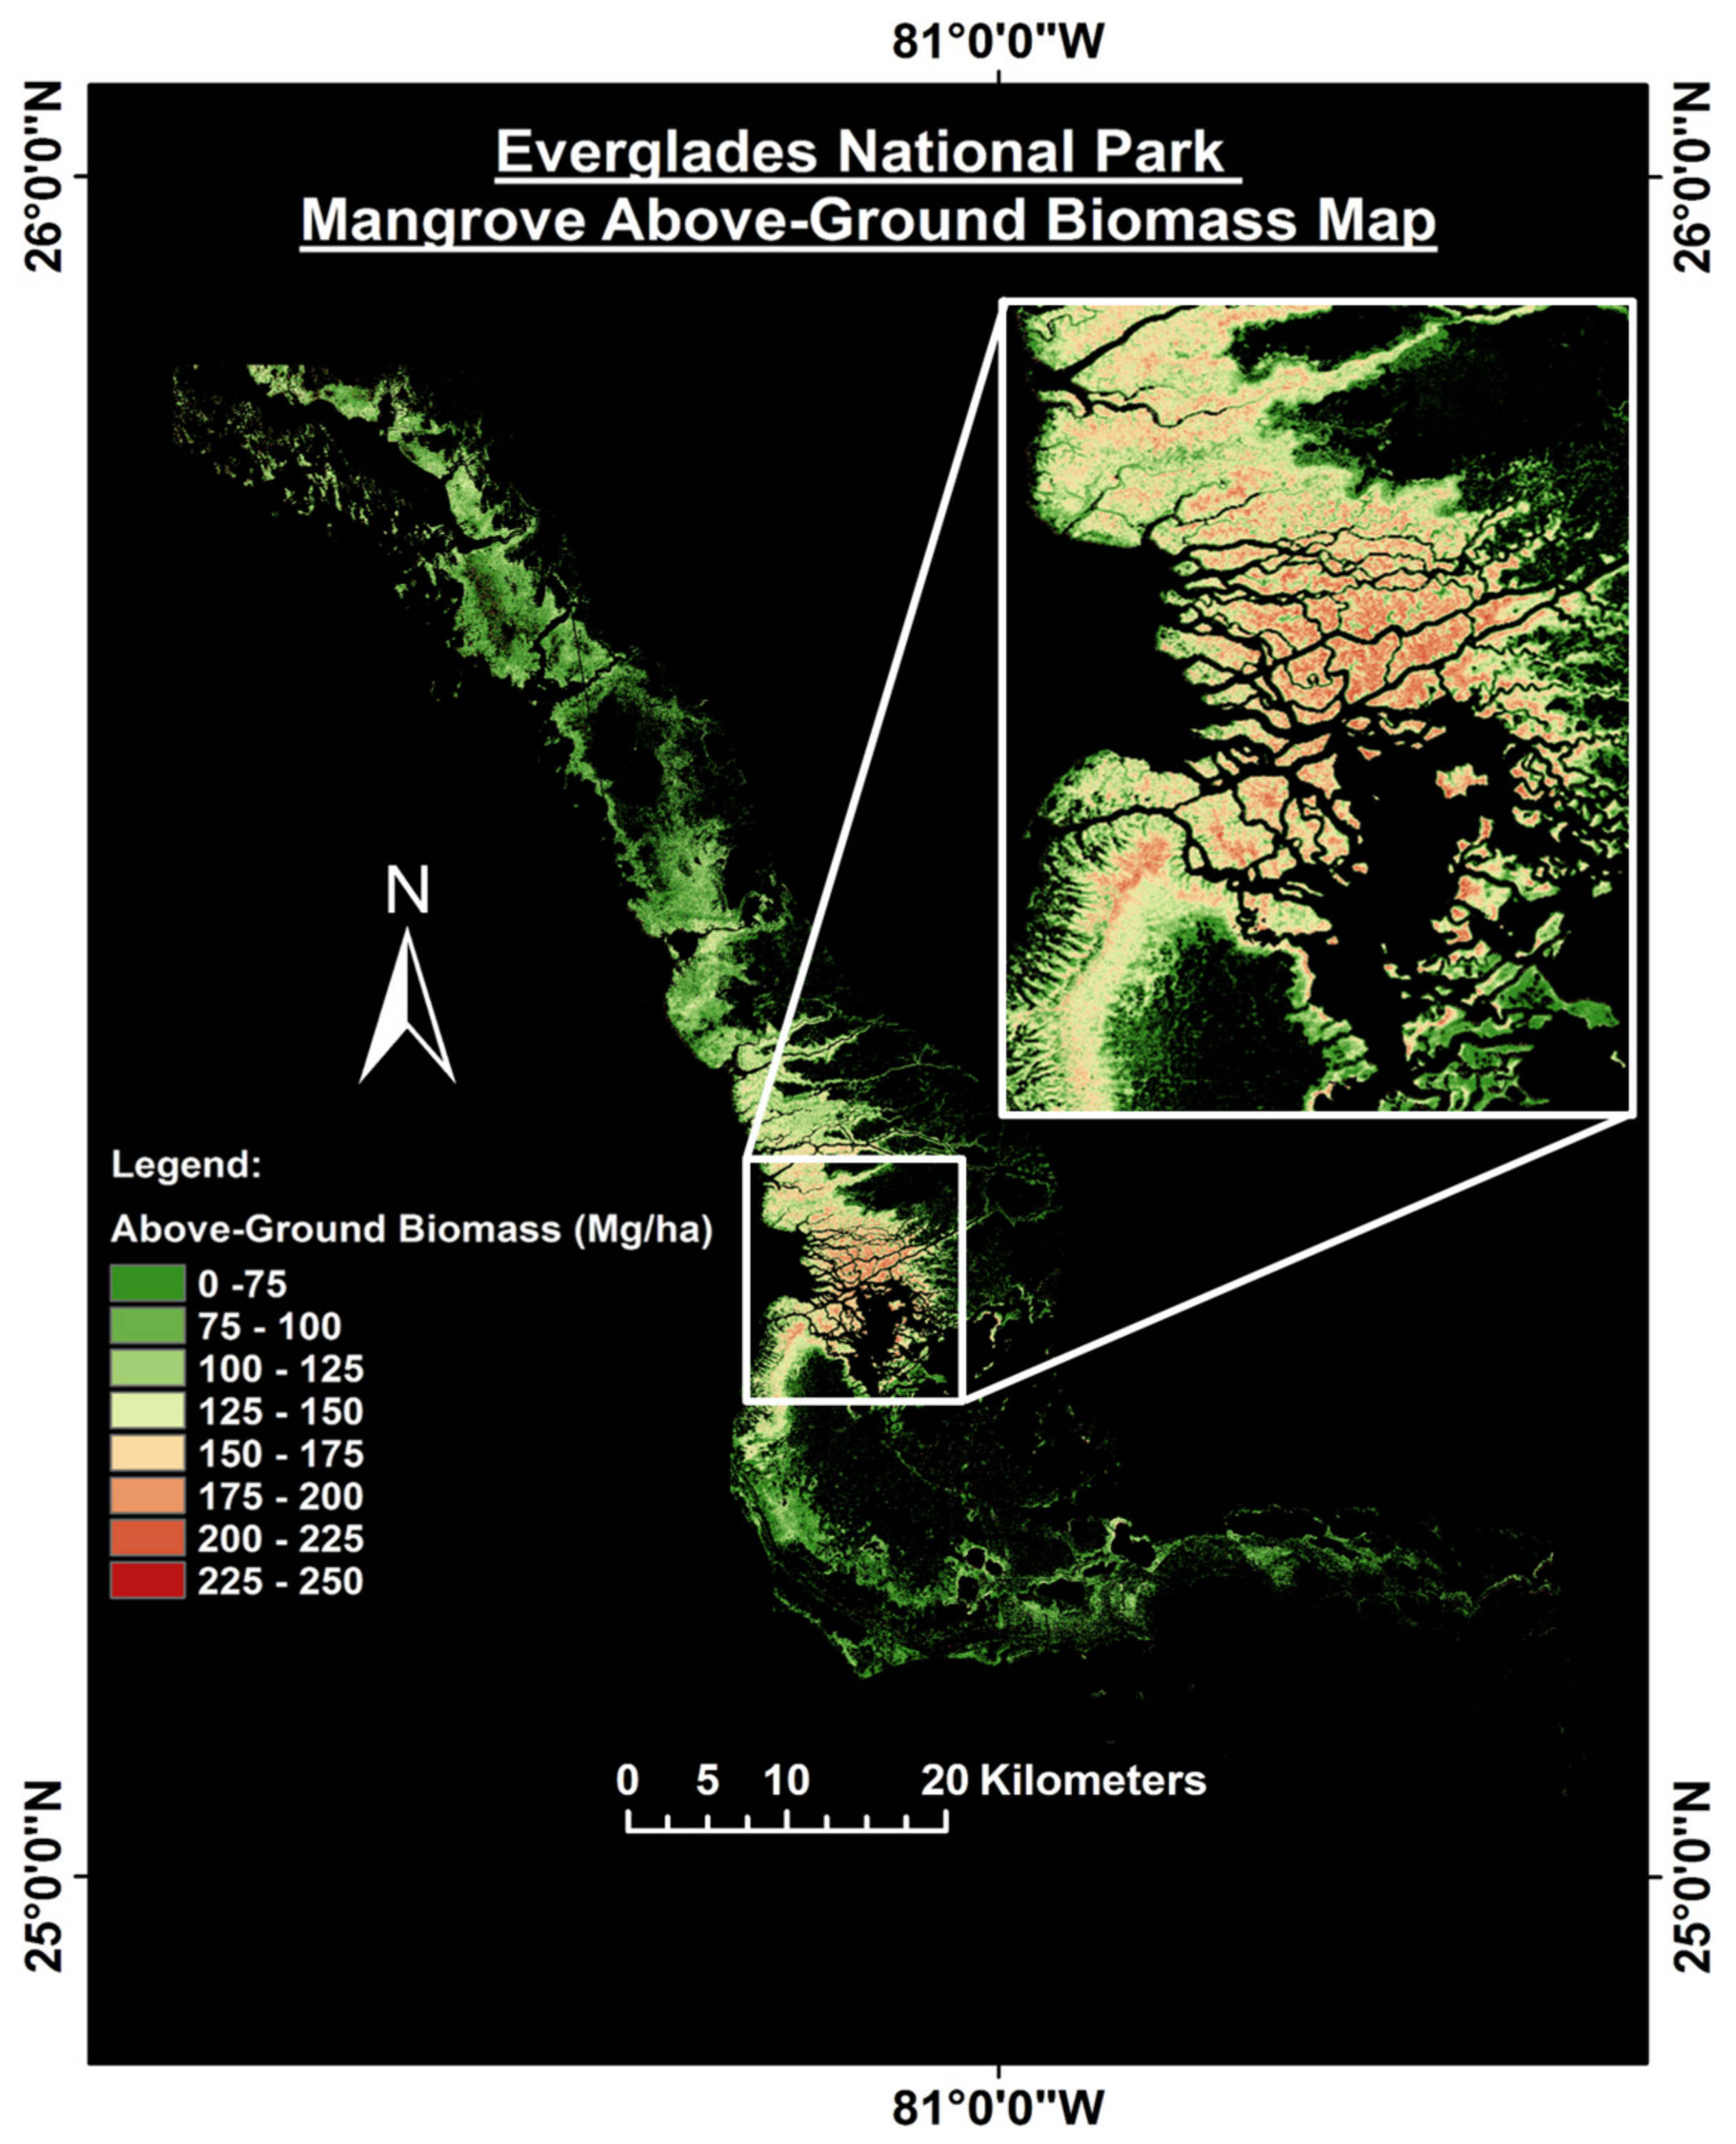
4.3. Above-Ground Biomass Estimation
5. Discussion
5.1. Extent of the ENP Mangrove Forest
5.2. Mangrove Canopy Height
5.3. Mangrove Above-Ground Biomass
6. Conclusions
Acknowledgments
Author Contributions
Conflicts of Interest
References
- Donato, D.C.; Kauffman, J.B.; Murdiyarso, D.; Kurnianto, S.; Stidham, M.; Kanninen, M. Mangroves among the most carbon-rich forests in the tropics. Nat. Geosci. 2011, 4, 293–297. [Google Scholar] [CrossRef]
- Lovelock, C.E.; McAllister, R.R. ‘Blue carbon’ projects for the collective good. Carbon Manag. 2013, 4, 477–479. [Google Scholar] [CrossRef]
- Simard, M.; Zhang, K.; Rivera-Monroy, V.H.; Ross, M.S.; Ruiz, P.L.; Castañeda-Moya, E.; Twilley, R.R.; Rodriguez, E. Mapping height and biomass of mangrove forests in Everglades National Park with SRTM elevation data. Photogramm. Eng. Remote Sens. 2006, 72, 299–311. [Google Scholar] [CrossRef]
- Hyyppä, J.; Hyyppä, H.; Litkey, P.; Yu, X.; Haggrén, H.; Rönnholm, P.; Pyysalo, U.; Pitkänen, J.; Maltamo, M. Algorithms and methods of airborne laser scanning for forest measurements. Int. Arch. Photogramm. Remote Sens. Spat. Inf. Sci. 2004, 36, 82–89. [Google Scholar]
- Simard, M.; Pinto, N.; Fisher, J.B.; Baccini, A. Mapping forest canopy height globally with spaceborne lidar. J. Geophys. Res. Biogeosci. 2011, 116. [Google Scholar] [CrossRef]
- Lagomasino, D.; Fatoyinbo, T.; Lee, S.; Feliciano, E.; Trettin, C.; Simard, M. A Comparison of Mangrove Canopy Height Using Multiple Independent Measurements from Land, Air, and Space. Remote Sens. 2016, 8, 327. [Google Scholar] [CrossRef]
- Fatoyinbo, T.E.; Simard, M.; Washington-Allen, R.A.; Shugart, H.H. Landscape-scale extent, height, biomass, and carbon estimation of Mozambique’s mangrove forests with Landsat ETM+ and Shuttle Radar Topography Mission elevation data. J. Geophys. Res. Biogeosci. 2008, 113. [Google Scholar] [CrossRef]
- Lee, S.-K.; Fatoyinbo, T.E. TanDEM-X Pol-InSAR Inversion for Mangrove Canopy Height Estimation. IEEE J. Sel. Top. Appl. Earth Obs. Remote Sens. 2015, 8, 3608–3618. [Google Scholar] [CrossRef]
- Hajnsek, I.; Kugler, F.; Lee, S.-K.; Papathanassiou, K.P. Tropical-forest-parameter estimation by means of Pol-InSAR: The INDREX-II campaign. IEEE Trans. Geosci. Remote Sens. 2009, 47, 481–493. [Google Scholar] [CrossRef]
- Sadeghi, Y.; St-Onge, B.; Leblon, B.; Simard, M.; Papathanassiou, K. Mapping Forest Canopy Height Using TanDEM-X DSM and Airborne LiDAR DTM. In Proceedings of the 2014 IEEE International Geoscience and Remote Sensing Symposium (IGARSS), Quebec City, QC, Canada, 13–18 July 2014. [Google Scholar]
- Krieger, G.; Moreira, A.; Fiedler, H.; Hajnsek, I.; Werner, M.; Younis, M.; Zink, M. TanDEM-X: A satellite formation for high-resolution SAR interferometry. IEEE Trans. Geosci. Remote Sens. 2007, 45, 3317–3341. [Google Scholar] [CrossRef]
- Smith, T.J.; Anderson, G.H.; Balentine, K.; Tiling, G.; Ward, G.A.; Whelan, K.R. Cumulative impacts of hurricanes on Florida mangrove ecosystems: Sediment deposition, storm surges and vegetation. Wetlands 2009, 29, 24–34. [Google Scholar] [CrossRef]
- Aulinger, T.; Mette, T.; Papathanassion, K.; Hajnsek, I.; Heurich, M.; Krzystek, P. Validation of Heights from Interferometric SAR and LIDAR over the Temperate Forest Site “Nationalpark Bayerischer Wald”. In Proceedings of the 2nd International Workshop POLINSAR 2005, Frascati, Italy, 17–21 January 2005. [Google Scholar]
- Treuhaft, R.N.; Madsen, S.N.; Moghaddam, M.; Zyl, J.J. Vegetation characteristics and underlying topography from interferometric radar. Radio Sci. 1996, 31, 1449–1485. [Google Scholar] [CrossRef]
- Cloude, S.; Papathanassiou, K. Three-stage inversion process for polarimetric SAR interferometry. IEEE Proc. Radar Sonar Navig. 2003, 150, 125–134. [Google Scholar] [CrossRef]
- Welch, R.; Madden, M.; Doren, R.F. Mapping the Everglades. Photogramm. Eng. Remote Sens. 1999, 65, 163–170. [Google Scholar]
- Kugler, F.; Schulze, D.; Hajnsek, I.; Pretzsch, H.; Papathanassiou, K.P. TanDEM-X Pol-InSAR performance for forest height estimation. IEEE Trans. Geosci. Remote Sens. 2014, 52, 6404–6422. [Google Scholar] [CrossRef]
- Lee, S.-K.; Kugler, F.; Papathanassiou, K.P.; Hajnsek, I. Quantification of temporal decorrelation effects at L-band for polarimetric SAR interferometry applications. IEEE J. Sel. Top. Appl. Earth Obs. Remote Sens. 2013, 6, 1351–1367. [Google Scholar] [CrossRef]
- Sexton, J.O.; Bax, T.; Siqueira, P.; Swenson, J.J.; Hensley, S. A comparison of lidar, radar, and field measurements of canopy height in pine and hardwood forests of southeastern North America. For. Ecol. Manag. 2009, 257, 1136–1147. [Google Scholar] [CrossRef]
- Ross, M.; Ruiz, P.; Telesnicki, G.; Meeder, J. Estimating above-ground biomass and production in mangrove communities of Biscayne National Park, Florida (USA). Wetl. Ecol. Manag. 2001, 9, 27–37. [Google Scholar] [CrossRef]
- Fromard, F.; Puig, H.; Mougin, E.; Marty, G.; Betoulle, J.L.; Cadamuro, L. Structure, above-ground biomass and dynamics of mangrove ecosystems: New data from French Guiana. Oecologia 1998, 115, 39–53. [Google Scholar] [CrossRef] [PubMed]
- Feliciano, E.; Wdowinski, S.; Potts, M. Assessing Mangrove Above-Ground Biomass and Structure using Terrestrial Laser Scanning: A Case Study in the Everglades National Park. Wetlands 2014, 34. [Google Scholar] [CrossRef]


| Optech Gemini ALTM Specifications | |
|---|---|
| Flight Altitude | 600 m |
| Flight Speed | 60 m/s |
| Swath Width | 360 m |
| Swath Overlap | 50% |
| Point Density | 6.4 p/m2 |
| Laser Pulse Rate Frequency | 125 kHz |
| Beam Divergence | 0.25 mrad |
| Scan Frequency | 45 Hz |
| Scan Angle | ±21° |
| Acquisition Date | UTC Time (hh:mm:ss) | Polarization | Incidence Angle (°) | Height of Ambiguity | Bandwidth (MHz) | Effective Baseline (m) |
|---|---|---|---|---|---|---|
| 6 March 2011 | 23:30:39 | HH | 46.27 | 39.54 | 100 | 203 |
| 9 November 2011 | 23:22:03 | HH | 33.85 | −48.73 | 100 | 109 |
| 17 May 2013 | 23:30:45 | HH | 48.08 | −60.86 | 100 | 140 |
| 17 May 2013 | 23:30:52 | HH | 48.08 | −60.68 | 100 | 141 |
© 2017 by the authors. Licensee MDPI, Basel, Switzerland. This article is an open access article distributed under the terms and conditions of the Creative Commons Attribution (CC BY) license (http://creativecommons.org/licenses/by/4.0/).
Share and Cite
Feliciano, E.A.; Wdowinski, S.; Potts, M.D.; Lee, S.-K.; Fatoyinbo, T.E. Estimating Mangrove Canopy Height and Above-Ground Biomass in the Everglades National Park with Airborne LiDAR and TanDEM-X Data. Remote Sens. 2017, 9, 702. https://doi.org/10.3390/rs9070702
Feliciano EA, Wdowinski S, Potts MD, Lee S-K, Fatoyinbo TE. Estimating Mangrove Canopy Height and Above-Ground Biomass in the Everglades National Park with Airborne LiDAR and TanDEM-X Data. Remote Sensing. 2017; 9(7):702. https://doi.org/10.3390/rs9070702
Chicago/Turabian StyleFeliciano, Emanuelle A., Shimon Wdowinski, Matthew D. Potts, Seung-Kuk Lee, and Temilola E. Fatoyinbo. 2017. "Estimating Mangrove Canopy Height and Above-Ground Biomass in the Everglades National Park with Airborne LiDAR and TanDEM-X Data" Remote Sensing 9, no. 7: 702. https://doi.org/10.3390/rs9070702