1. Introduction
Plants must deal with light in extreme ways. Both the quantity of solar radiation, varying over several orders of magnitude, as well as the temporal fluctuations, ranging from seconds to seasons, demand a high flexibility of plants to keep the light supply in balance with the demand for healthy metabolic growth. To do so, plants evolved with the remarkable capacity of dissipating absorbed solar energy in ways being profitable (harvesting light for growth) or protective (activating different mechanisms to avoid light damage). Absorbed photosynthetically active radiation (APAR) brings chlorophyll-
a molecules to an excited and energetic singlet-state, ready to go back to its ground state through a combination of different mechanisms: photosynthesis (or Photochemical Quenching, PQ), non-photochemical quenching (NPQ), and fluorescence (F) emission. While fluorescence emission is an unregulated process, non-photochemical fluorescence quenching (NPQ) involves controlled heat dissipation and becomes activated at a certain light excess [
1,
2].
During the early morning hours (or low illumination conditions in general) photoprotection is not activated, because the absorbed energy can still be efficiently trapped for photochemical use, driving the light and carbon reactions. Like this, absorbed solar energy can be harvested with an efficiency up to 90% [
1]. Hence, typically during the first morning hours and towards sunset, the changes in the quantum yield of fluorescence are linearly controlled by PQ [
3,
4]. When light intensity further increases, the light and carbon reactions gradually become light saturated and the relative amount of energy emitted as F per energy unit absorbed energy, or F yield, increases. However, Chl F emission does not protect the plant from photodamage, so when incoming radiation increases even further, NPQ mechanisms are activated [
1,
2]. When the APAR becomes saturating for the safe and efficient use of the photosynthetic machinery, is hard to be defined on an absolute energy scale. This will depend on the physiological state of the plant, as well as on environmental parameters such as temperature [
5].
Three major NPQ mechanisms are typically identified, i.e., the energy-dependent NPQ (
qE), the photoinhibitory NPQ (
qI), and the state-transitions NPQ (
qT) [
1]. The most important is the energy-dependent NPQ, which has as main function the protection of Photosystem II (PSII) from photoinhibition [
6]. Once the NPQ protective mechanisms are activated, the changes in the quantum yield of photochemistry are controlled by the dynamics of NPQ [
3]. The European Space Agency (ESA) selected FLuorescence EXplorer (FLEX) mission as 8th Earth Explorer, which is specifically designed to measure SIF, and will have an expected optimal overpass time during the phase in which photochemical and fluorescence yield are positively correlated, but dominated by NPQ [
7]. Hence, knowledge on NPQ is necessary for establishing the unambiguous link between SIF and the quantum yield of photochemistry.
From all three previously mentioned NPQ mechanisms, the energy-dependent NPQ or
qE, regulated by lumen pH and the xanthophyll cycle pigments, represents the main component of NPQ [
8], which is able to change within minutes after a light intensity change [
1]. This reversible xanthophyll cycle can be detected by a small spectral change around 531 nm, translated to the widely used Photochemical Reflectance Index or PRI [
9]. Furthermore, because xanthophyll cycle pigments adjust the energy distribution at the photosynthetic reaction centres, PRI has been used as a measure of photosynthetic light-use efficiency (LUE) and indicator of stress [
10]. Moreover, PRI was found to track fluorometer-measured NPQ in several studies (for an overview, see [
11]). In this meta-analysis [
11], a non-significant PRI-NPQ relationship was reported at the short daily time scale for leaf level, while at the seasonal scale PRI could explain 77% of the variation in NPQ for herbaceous leaves. Several studies have reported good correlations between PRI and NPQ during different short-term light phases [
12,
13,
14], however, also acknowledge some discrepancies due to other interacting NPQ mechanisms besides the xanthophyll cycle, such as photoinhibitory NPQ (
qI), and the state-transitions NPQ (
qT). Furthermore, these, and other relationships with PRI become weak over the whole growth cycle [
13]. Upon stress events or seasonal development, when changes in the pigment pool (other than xanthophyll) and leaf structure occur, changing reflectance will affect the PRI. Under these circumstances, the relationship between PRI and the xanthophyll cycle gets modified.
While PRI is an index related to the generally most important light-induced non-photochemical heat dissipation mechanism
qE, Chl F is an actual energy emission that is physically linked to the photosynthesis process. Hence, both tell us something on the plants’ dissipation energy upon light absorption and can be passively measured by remote sensing. The FLEX mission will focus on the combined information of both parameters by carrying very high spectral resolution imaging sensors [
7,
15]. Therefore, understanding the dynamic diurnal relationships between Chl F, NPQ and PRI is a crucial point for establishing a better, solid knowledge on photosynthesis parameters as further mission products.
In this study, we present a proximal sensing experiment at leaf level in which the diurnal behaviour of NPQ, APAR, PRI and F are investigated during long lasting physiological stress. With this, our aim is to study the optical diurnal dynamics and relationships between both actively and passively derived optical parameters, measurements which are currently lacking. Additionally, we want to explore the prediction of actively derived NPQ based solely on passively derived PRI and APAR.
2. Materials and Methods
A tobacco plant (
Nicotiana tabacum L.) was grown in low light conditions (100 µmol m
−2 s
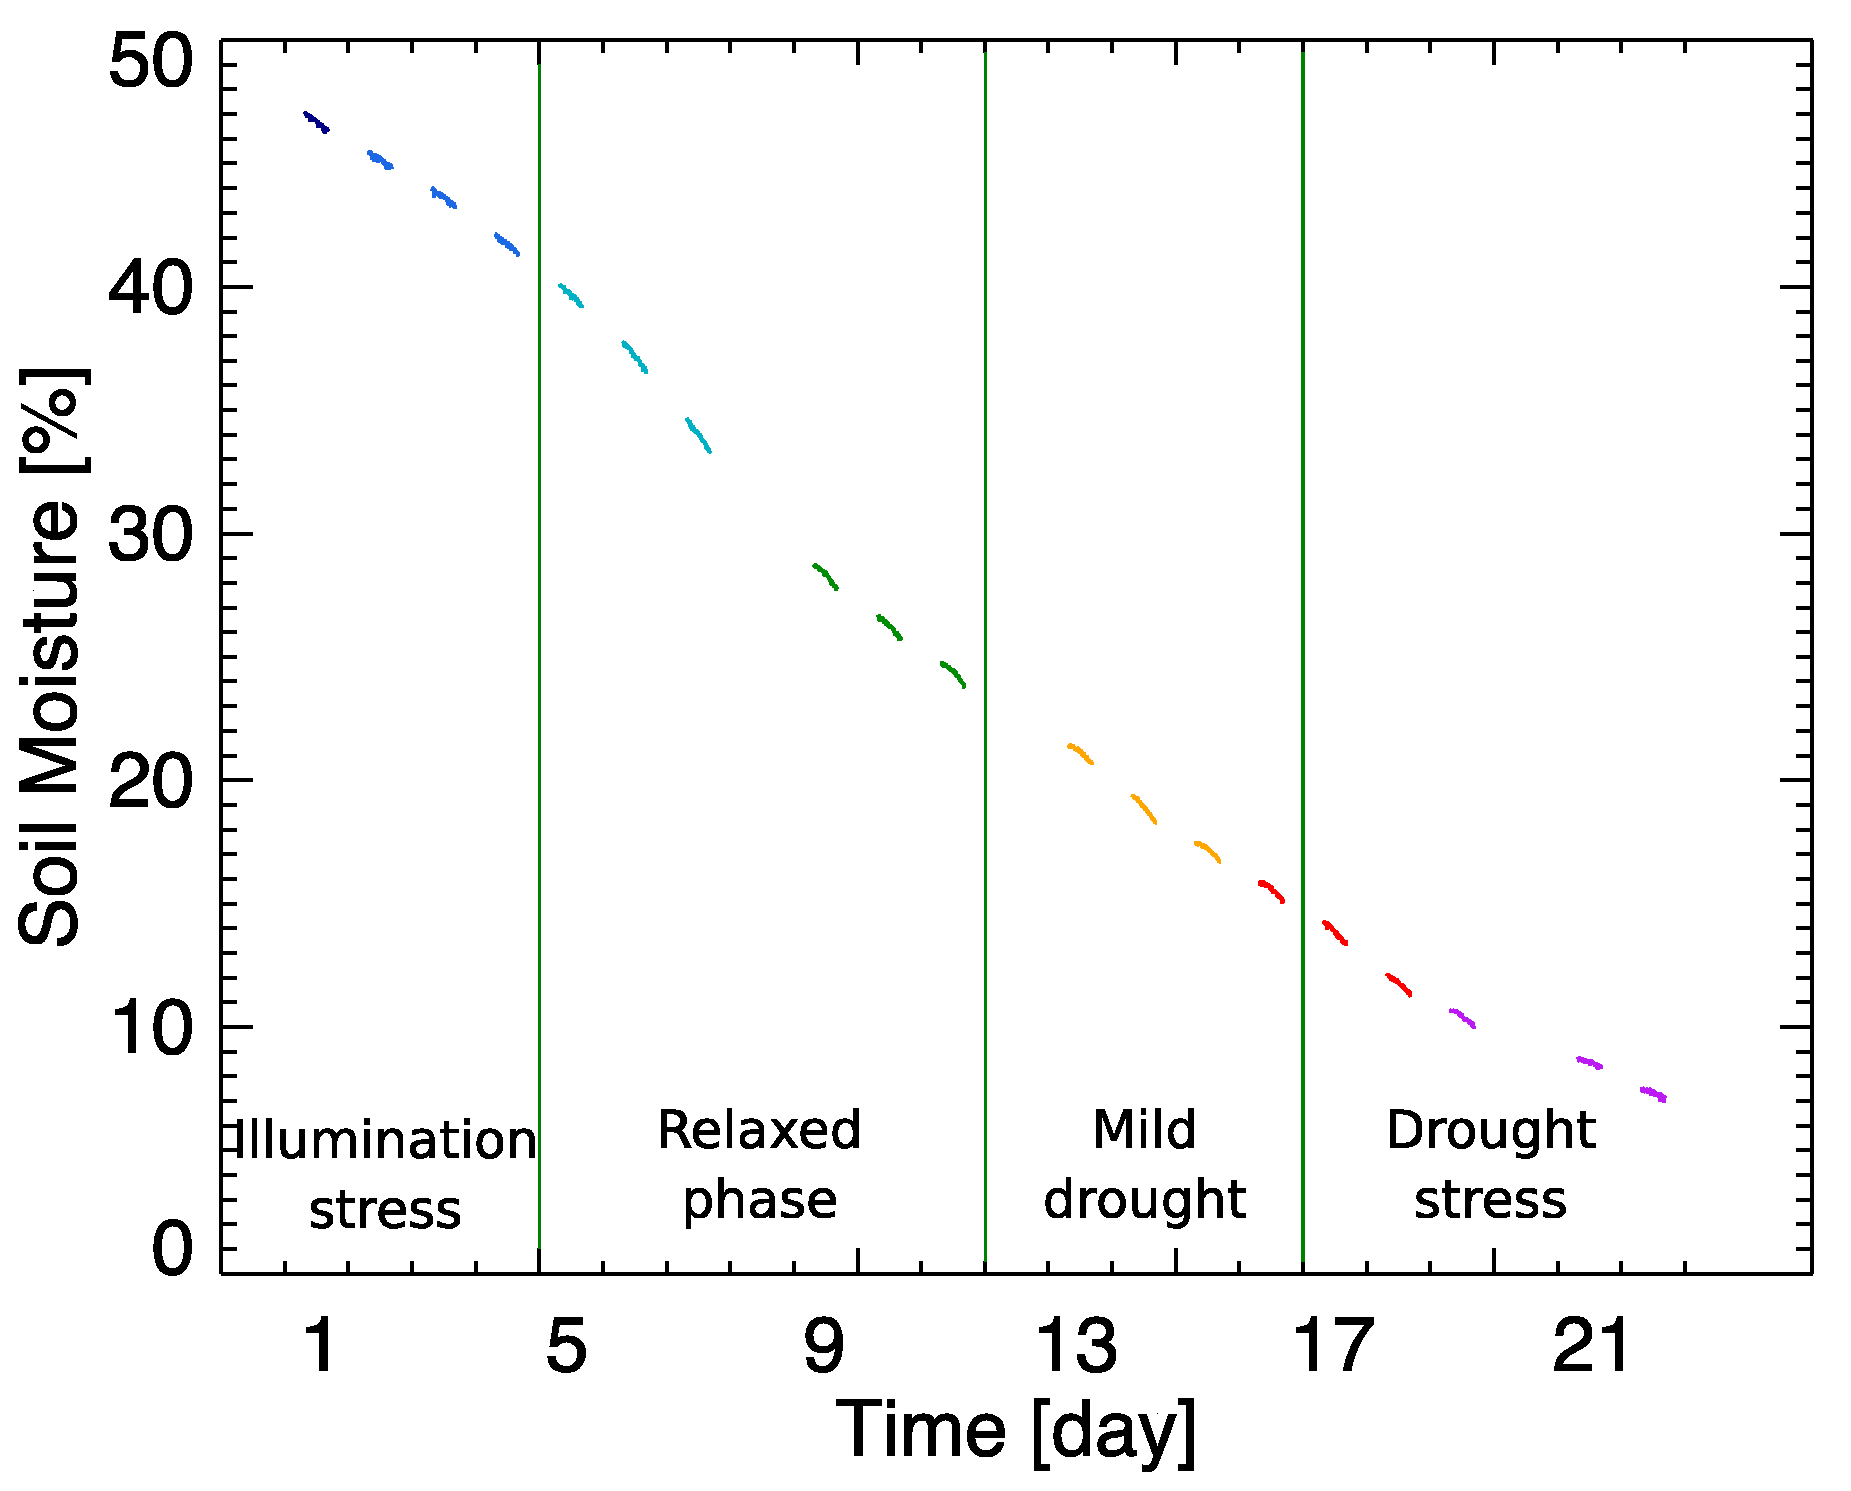
−1), while being well-watered and supplied with fertilized soil. Our aim was to subject a leaf of the plant, mounted in a leaf clip holder, to two environmental stresses in a controlled way during a 22-day experiment. First, by bringing the plant under high light intensity diurnal illumination, light stress was imposed. Additionally, we stopped watering the plant and the room temperature was kept constant at 25 ± 2 °C, inducing a progressive drought stress. To properly evaluate the leaf’s strain, additional sensors were placed to control the air temperature, the relative humidity (Senserion’s SHT75), and the soil moisture (Rika’s RK510). This set-up allowed us monitoring the increasing soil drought that was generated during the 22-day experiment (
Figure 1). Due to unexpected interruption of the automatic measuring system, three days of the experiment data are missing (D8, D12 and D20).
This experiment was conducted in 2006 and partly presented in an earlier work that investigated the comparability of the active and passive Chl F measurements and formulated the best satellite overpass time for the remote sensing of Chl F [
16,
17,
18]. Here, we present new results on the diurnal interaction between the different energy dissipation mechanisms that can be measured through active and passive techniques.
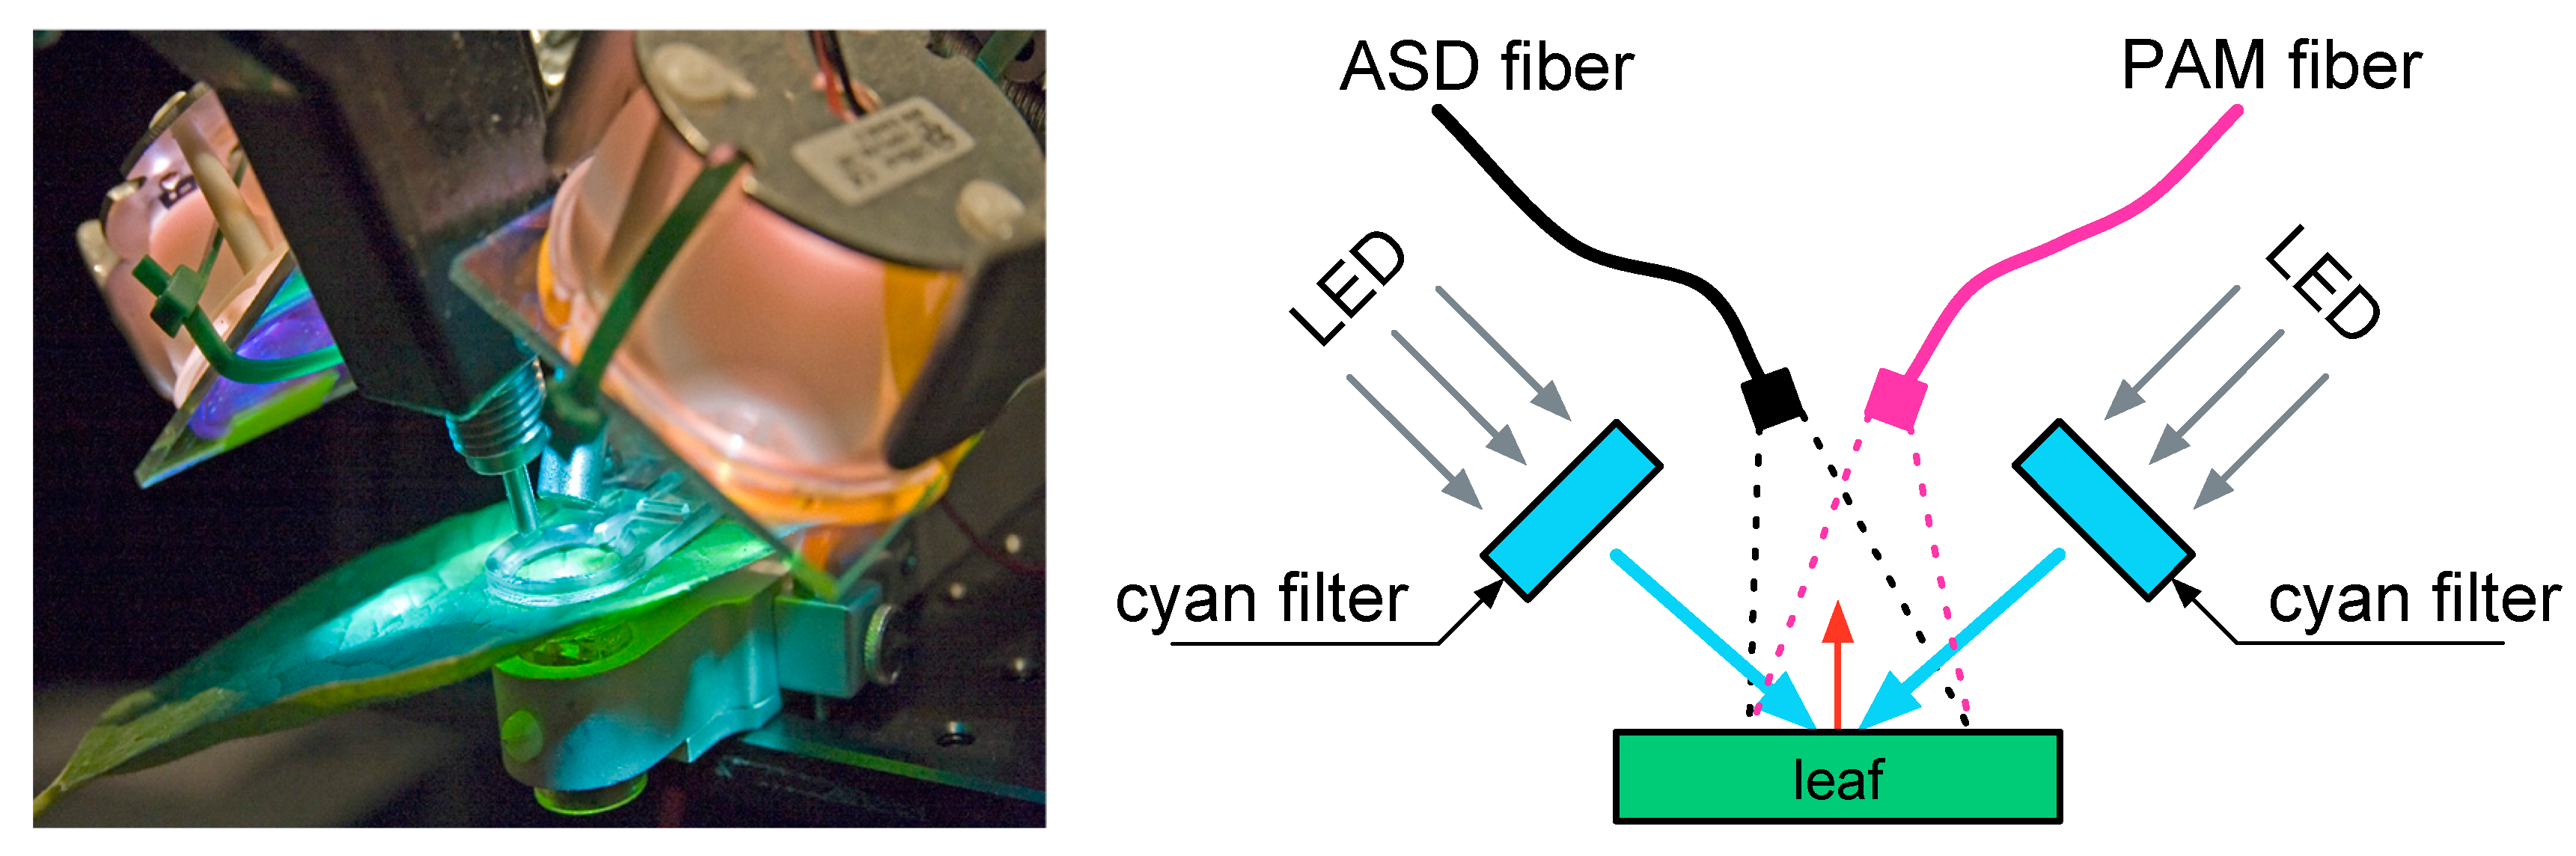
Diurnal light cycles were generated by two high power white LED modules (Optospot OSP/LF6/L3, LC Relco S.p.A., Milano, Italy) driven by a computer controlled LED current driver (Relco PTDCCD/15/350/S10). Each LED module, pointing to the leaf surface, had a cyan filter (K39-912, Edmund Optics, York, UK) mounted in front with a sharp cut-off at 600 nm to remove the incident light in the Chl F emission region. This illumination set-up, as illustrated in
Figure 2, allowed simulating a controlled predefined diurnal Photosynthetic Active Radiation (PAR) light pattern, ranging from 0 to 1000 µmol m
−2 s
−1, updated every minute. This light pattern was controlled through the feedback of a micro-quantum sensor on the PAM-2000 leaf clip holder which at the same time measured leaf temperature every 2 min with a contact thermocouple. One diurnal cycle of measurements lasted 11 h from which the first 80 min and last 40 min were dark. Hence, the time from artificial sunrise to artificial sunset took 9 h. Net leaf temperature change (∆T) was calculated as the difference between the actual leaf temperature and the average leaf temperature during the dark period right before the start of the diurnal light cycle.
The leaf’s diurnal fluorescence emission was simultaneously recorded by a pulse amplitude meter PAM-2000 (Waltz GmbH, Effeltrich, Germany) and a FieldSpec FR spectroradiometer (ASD Inc., Boulder, CO, USA). The fiber optic of the ASD spectroradiometer was aligned to point to the same leaf spot where the PAM-2000’s measurements took place. Both fibers (with a similar FOV of 25°) were adjusted to the same relative inclination (30° from the leaf normal angle).
Every 2 min the ASD FieldSpec FR spectroradiometer collected both the reflected radiance in the blue-green part of the visible (400–600 nm) and the full upward Chl F emission spectrum (650–850 nm) with a spectral resolution of 3 nm and a sampling interval of 1 nm. Prior to the start of the experiment, the irradiance at different intensities of the LED modules was acquired using a Spectralon white reference to calculate the reflectance of the leaf in the blue-green part of the visible (400–600 nm). From the diurnal leaf reflectance (R) data PRI was calculated as:
One should note that this corresponds to the original formulation [
9]. Nowadays it is becoming more common to find the PRI equation with the sign reversed so that an increase in photoprotective mechanism is reflected as an increase of the index; however, since the reverse formulation is still identified as PRI it might lead to confusion when compared to the original definition.
Likewise, the PAM fluorometer measures, every 2 min, relative fluorescence values in the far-red (Ft) by constant modulated light pulses. Since red light is used for the pulses and the detector is protected by a long-pass filter (λ > 700 nm), the PAM only provides fluorescence as a single broad band from 710 to 850 nm of the added F signal excited by a modulated pulse. Because the F measurement is the relative increase due to given pulse light, the PAM Ft measurement is a relative value to some extent related to Chl F yield.
The comparability between simultaneously measured active red-band (PAM) and passive spectral (ASD) fluorescence was checked for all 2-min interval diurnal data of the 22-day experiment. The PAM F
t measurements with arbitrary units were compared to both the simultaneous measured red fluorescence (RF, 650–705 nm) yield and far-red fluorescence (FRF, 705–790 nm) yield. As shown in previous research [
19], the passively and actively retrieved FY was found comparable. The coefficient of determination between the RF Yield and F
t (R
2 = 0.841) was expectedly lower compared to one of the FRF Yield and F
t (R
2 = 0.913) relationship. Spectral passive fluorescence yield (FY) was calculated as:
considering that the filter on the lamps completely blocks any light above 650 nm; and the transmittance has been approximated by the reflectance after subtracting the contribution of the light reflected by the epidermis before any absorption takes place (estimated as the minimum reflectance in the far blue wavelengths).
At the beginning of every diurnal cycle, the dark-adapted leaf receives the first saturating pulse to determine the minimum and absolute maximum fluorescence (F
0 and F
m respectively). Subsequently, the light source turns on and reproduces the diurnal cycle; meanwhile regular saturation pulses of 7000 µmol m
−2 s
−1 are given every 20 min, which induce maximum fluorescence (F
m′), permitting the measurement of the non-photochemical fluorescence quenching (NPQ) as:
with F
m′ the maximum F at each saturation pulse [
20]. By applying a saturation pulse only every 20 min during the 9 h diurnal cycle, the leaf spot has sufficient recovery time in between the flashes to relax rapid-responding NPQ mechanisms. Moreover, the 20 min separation between saturating pulses avoided the photoinhibitory quenching [
21,
22] that might appear with the use of flashes in short intervals. Hence, the photochemical quenching or the amount of open PSII centres at every consecutive pulse (34 pulses per diurnal cycle) remains only influenced by the adaptation to the available light intensity and environmental conditions. Besides, two additional saturating pulses were given in darkness, after completing the diurnal light cycle. This technique allows approximating the relaxation kinetics of the NPQ mechanisms, disentangling the energy-dependent quenching (qE), state-transition quenching (qT) and, photoinhibitory quenching (qI) based on their relaxation kinetics [
6,
23,
24].
With and respectively the maximal F during the saturating pulses after 20 and 40 min in darkness at the end of the day.
The Chl F acquisition by the spectrometer on the one hand and the fluorometer on the other hand were automatic and controlled from a desktop computer running a program in Matlab. The 2-min interval Chl F measurements of both instruments were synchronized with less than 5 s between passive and active measurements. The outcome of both passive and active measurements was evaluated for all 2- or 20-min intervals, and more specifically the morning measurements at 10:30, in order to interpret the corresponding physiology at the moment of planned FLEX satellite overpass over northern mid-latitudes.
3. Results
In this section, we present the results from several aspects of the experiments. First, we address the diurnal evolution of NPQ and leaf temperature along the experiment through the different phases of stress and adaptation of the plant to the environmental conditions. Second, we describe the passively measured PRI and Chl F, and their response. Then, we show the different relationships between the passive parameters and NPQ, according to findings in the literature, found to be insufficient to represent and explain the totality of this experiment. Last, we propose a linear regression to a plane defined by experimental data of PRI, APAR and NPQ, that will allow estimating NPQ from passive measurements.
3.1. Diurnal Non-Photochemical Quenching (NPQ)
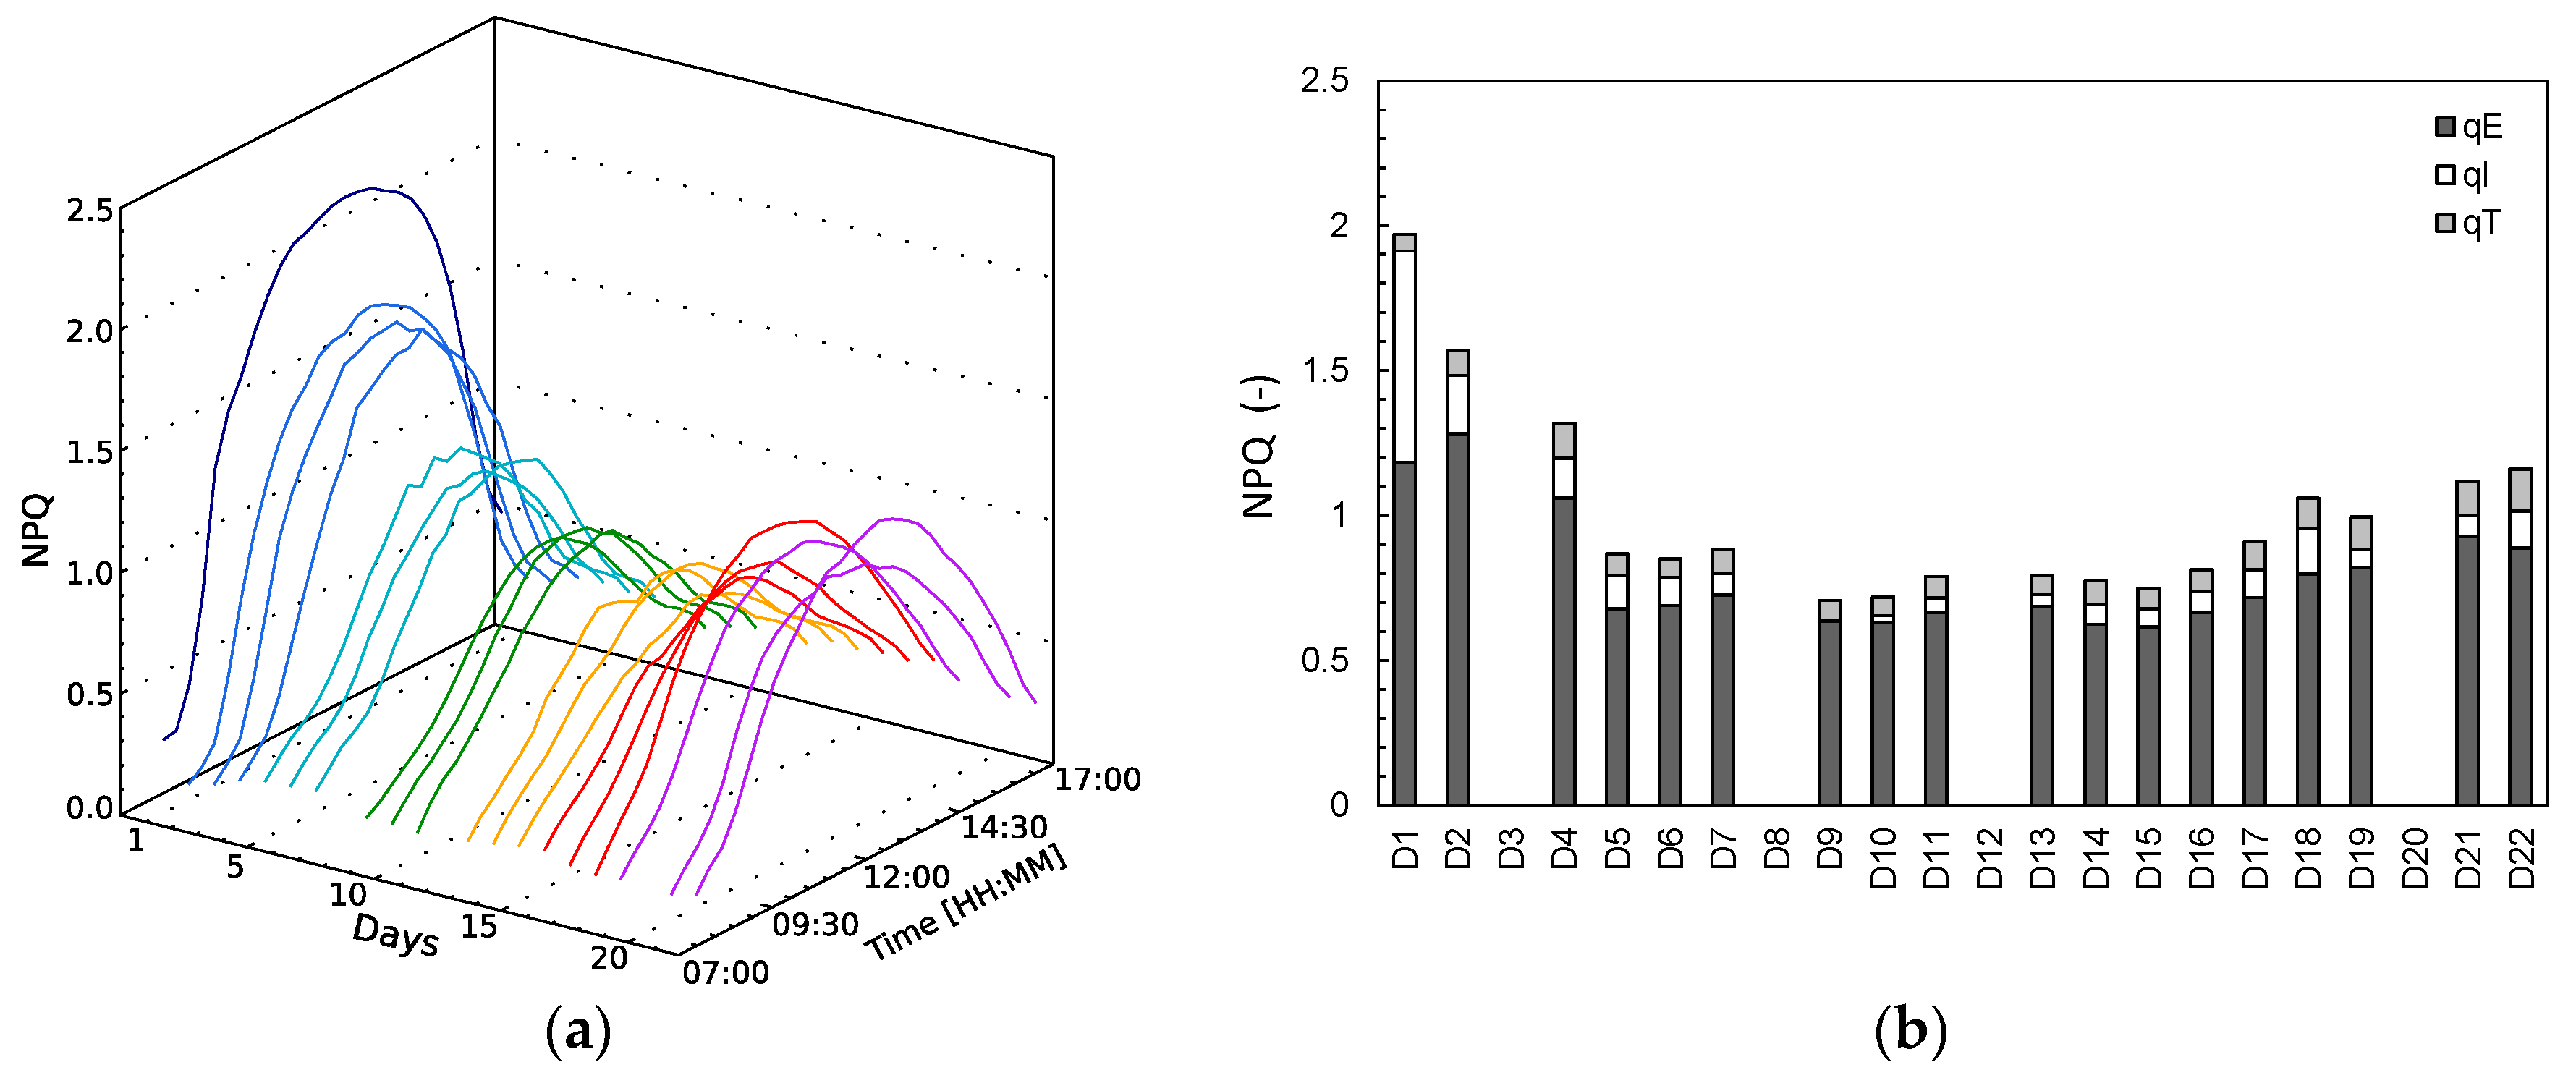
NPQ mechanisms are activated when excessive absorbed light needs to be dissipated, showing high values at high illumination hours (
Figure 3a). On the first day (D1), NPQ gets quickly activated rising to high values due to light stress, provided that the plant was subjected to a higher illumination than it was grown at. After a few days of light stress, NPQ slowly declines and remains stable until D15, after which a slow steady increase is observed until the end of the experiment. Based on the NPQ relaxation partitioning technique [
6,
23], the NPQ parameters qE (energy-dependent), qI (photoinhibitory quenching) and qT (state-transitions) were derived for the 10:30 measurement (
Figure 3b, Formulas (5)–(7)). We should stress out here that the behaviour of the different NPQ kinetics is not stationary, but variable in the day. The energy-dependent NPQ, qE, has overall the largest share in the NPQ dissipation throughout the experiment. On D1, however, the photoinhibitory quenching, qI, is important as well, before it starts declining the following days. The energy-dependent NPQ qE declines as well after D2, but remains the most important NPQ mechanism. During the relaxed phase (D6–D11,
Figure 3b), the 10:30 a.m. NPQ measurement reaches the lowest values in the experiment and qE becomes determinant for 84–90% of NPQ at this time of the day. NPQ stays similarly low between D5 and D16. In the drought stress phase (D17–D22) total NPQ starts increasing again, due to the increase of all three NPQ components.
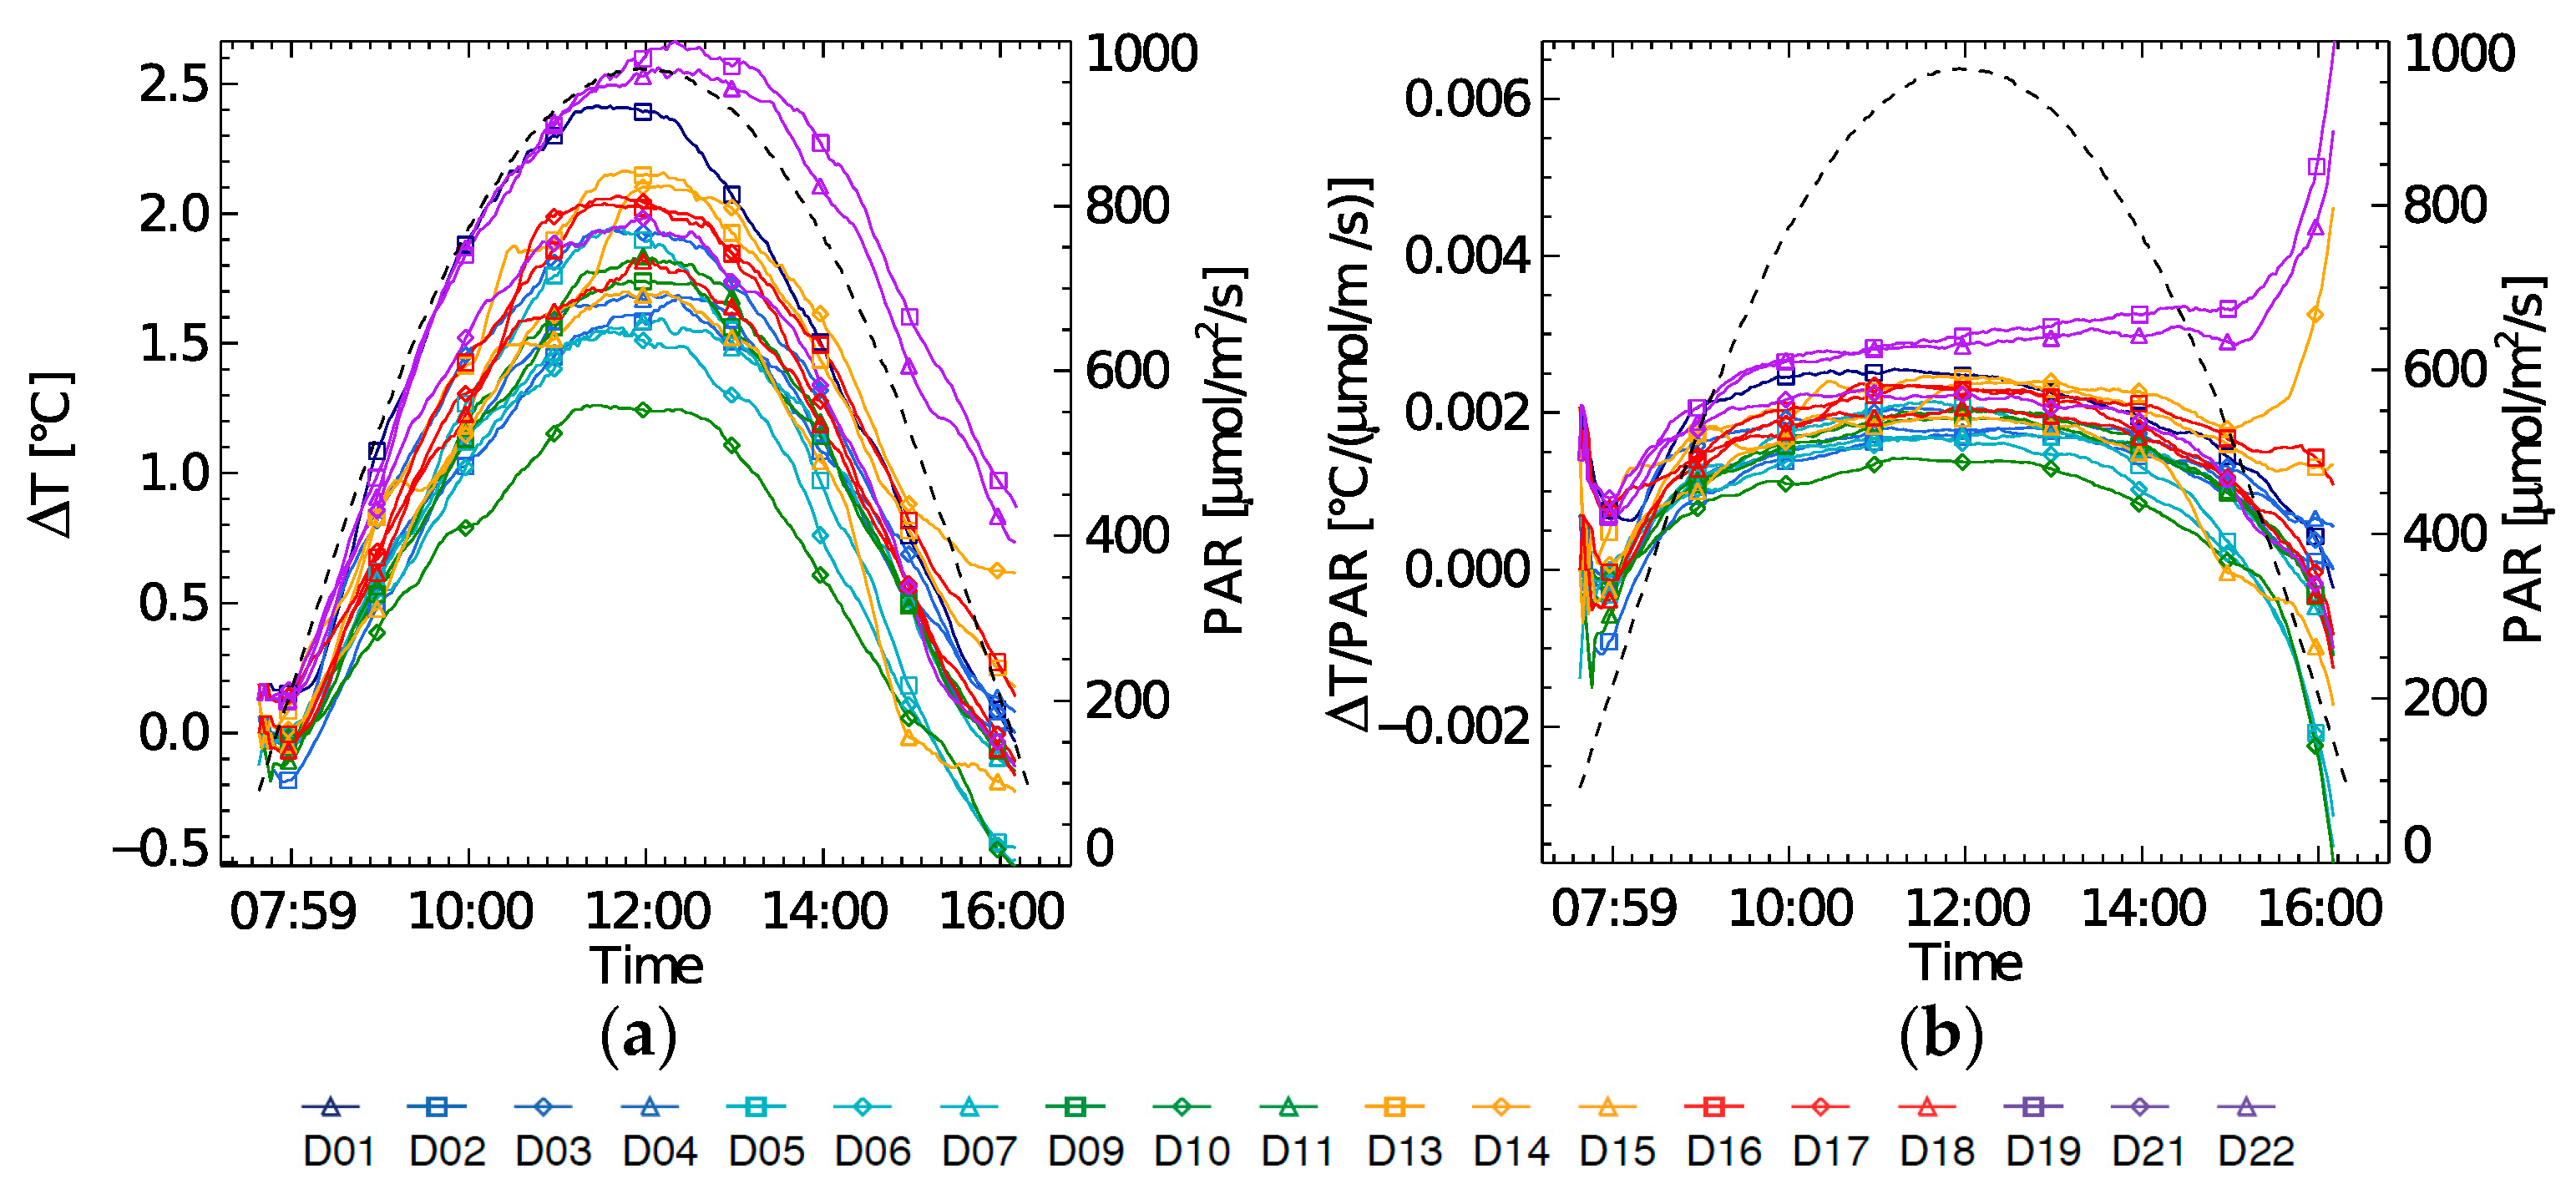
3.2. Leaf Temperature Change and Energy Dissipation
Highest diurnal temperature changes (∆T) were found at the beginning of the experiment on (D1) and at the end of the experiment (D21–D22) (
Figure 4a). During D21 and D22 a ∆T increase of 2.5 °C was recorded as the highest increase during the experiment. Leaf temperature is typically light driven. However, on these high ∆T days, a steep increase in the morning is observed, which does not correspond to the diurnal illumination shape. Also, the afternoon leaf cooling effect on D21–D22 went much slower, resulting in a higher leaf temperature at the end of the day. When normalizing ∆T by amount of PAR, these trends are better seen (
Figure 4b).
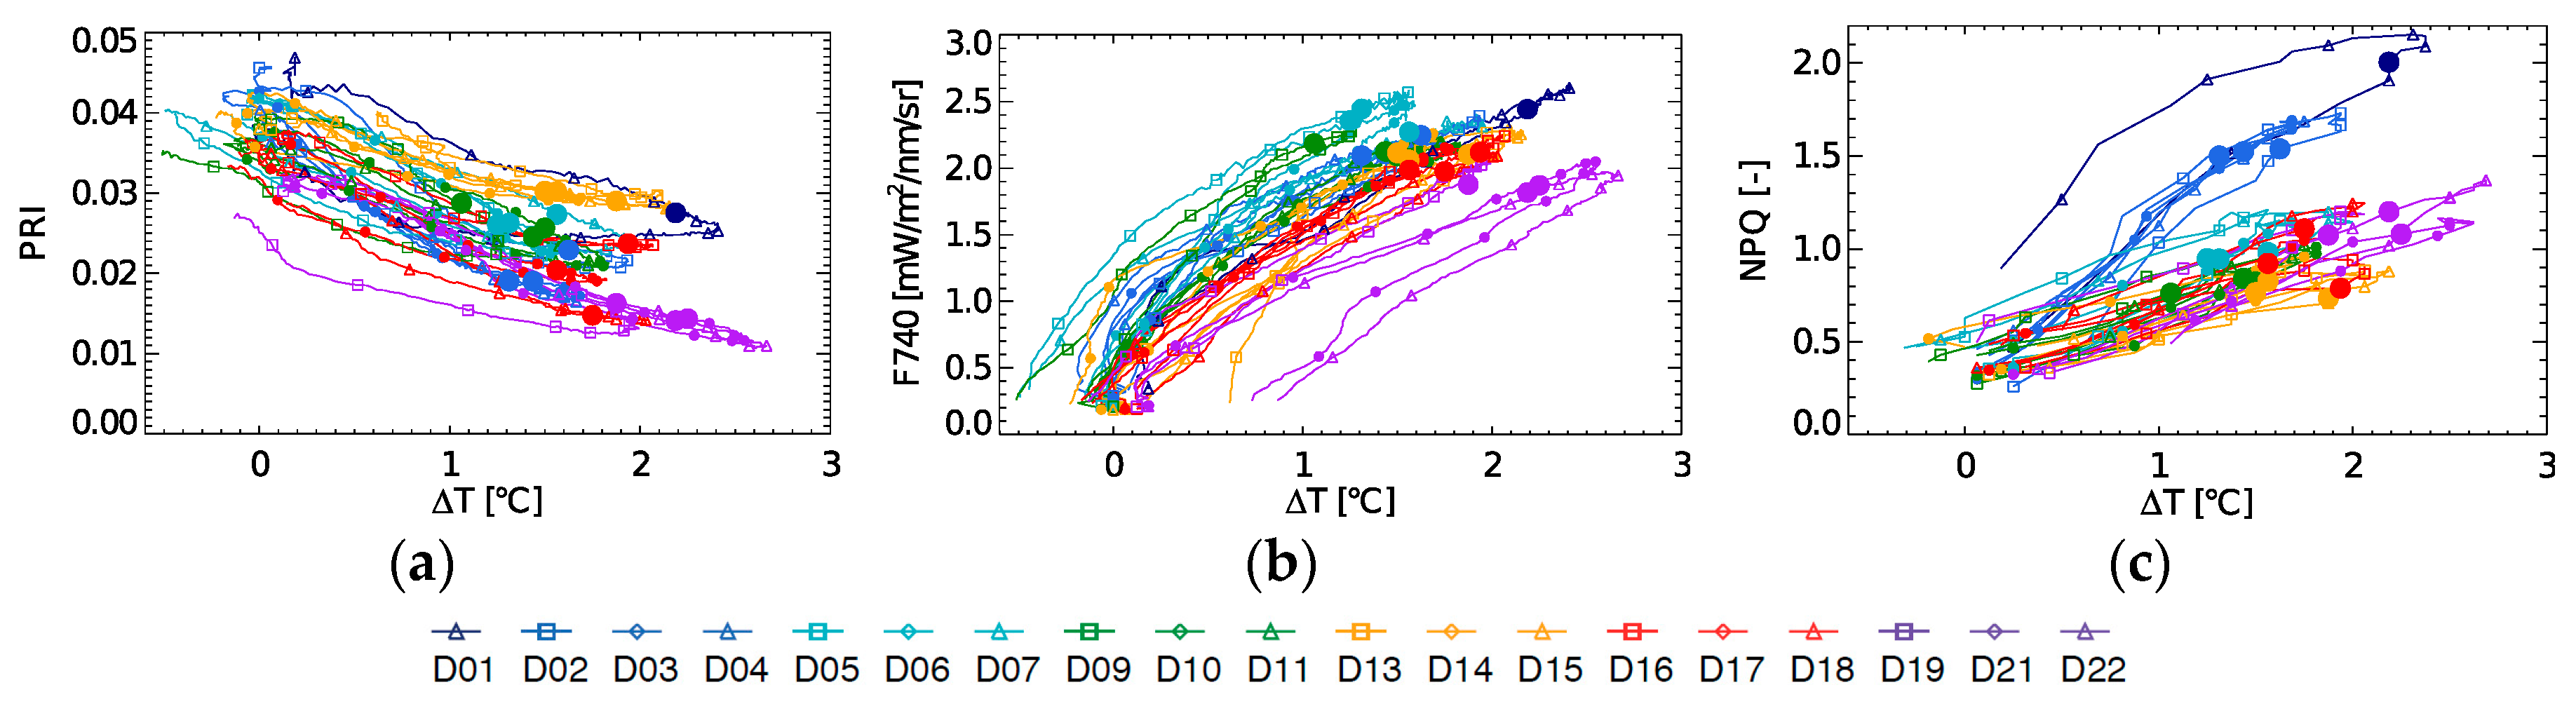
Diurnal evolution of PRI, fluorescence at 740 nm (F740) and NPQ in relation to ∆T are shown in
Figure 5a–c. PRI and ∆T show a different relationship for each day of the experiment, in which the 10:30 measurement does not follow any clear trend. F740 in function of ∆T at 10:30 shows a decreasing trend throughout the experiment, (whereas positive within each day), but only after the light stress has occurred (D9–D22). For the 10:30 NPQ-∆T a positive relationship can be seen, when not taking the light stress days into account (
Figure 5c). Also, it can be observed here that the strength of coupling between ∆T and NPQ varies. A weak coupling was found on D1 and by extension on D2–D4, i.e., the light stress days with high NPQ. This steep increase in ∆T on D1 suggests a fast increase in sensible heat due to an additional uncontrolled heat dissipation or closure of the stomata, inhibiting the latent heat exchange through evapotranspiration.
3.3. Diurnal F740 and PRI at Different Stress Stages
To show the diurnal course of passive fluorescence, the far-red second peak fluorescence, located at 740 nm (F740), was used; however, it is important to mention that we found a 1:1 correlation with fluorescence at 760 nm (R
2 = 0.999), therefore all the following discussion and results are extendable to measurements using the O2-A band. In general, daily Chl F and PRI typical evolutions are easy to understand and interpret. F740 reacts fast on the incoming light in the morning and rises to a maximum before “solar noon” (
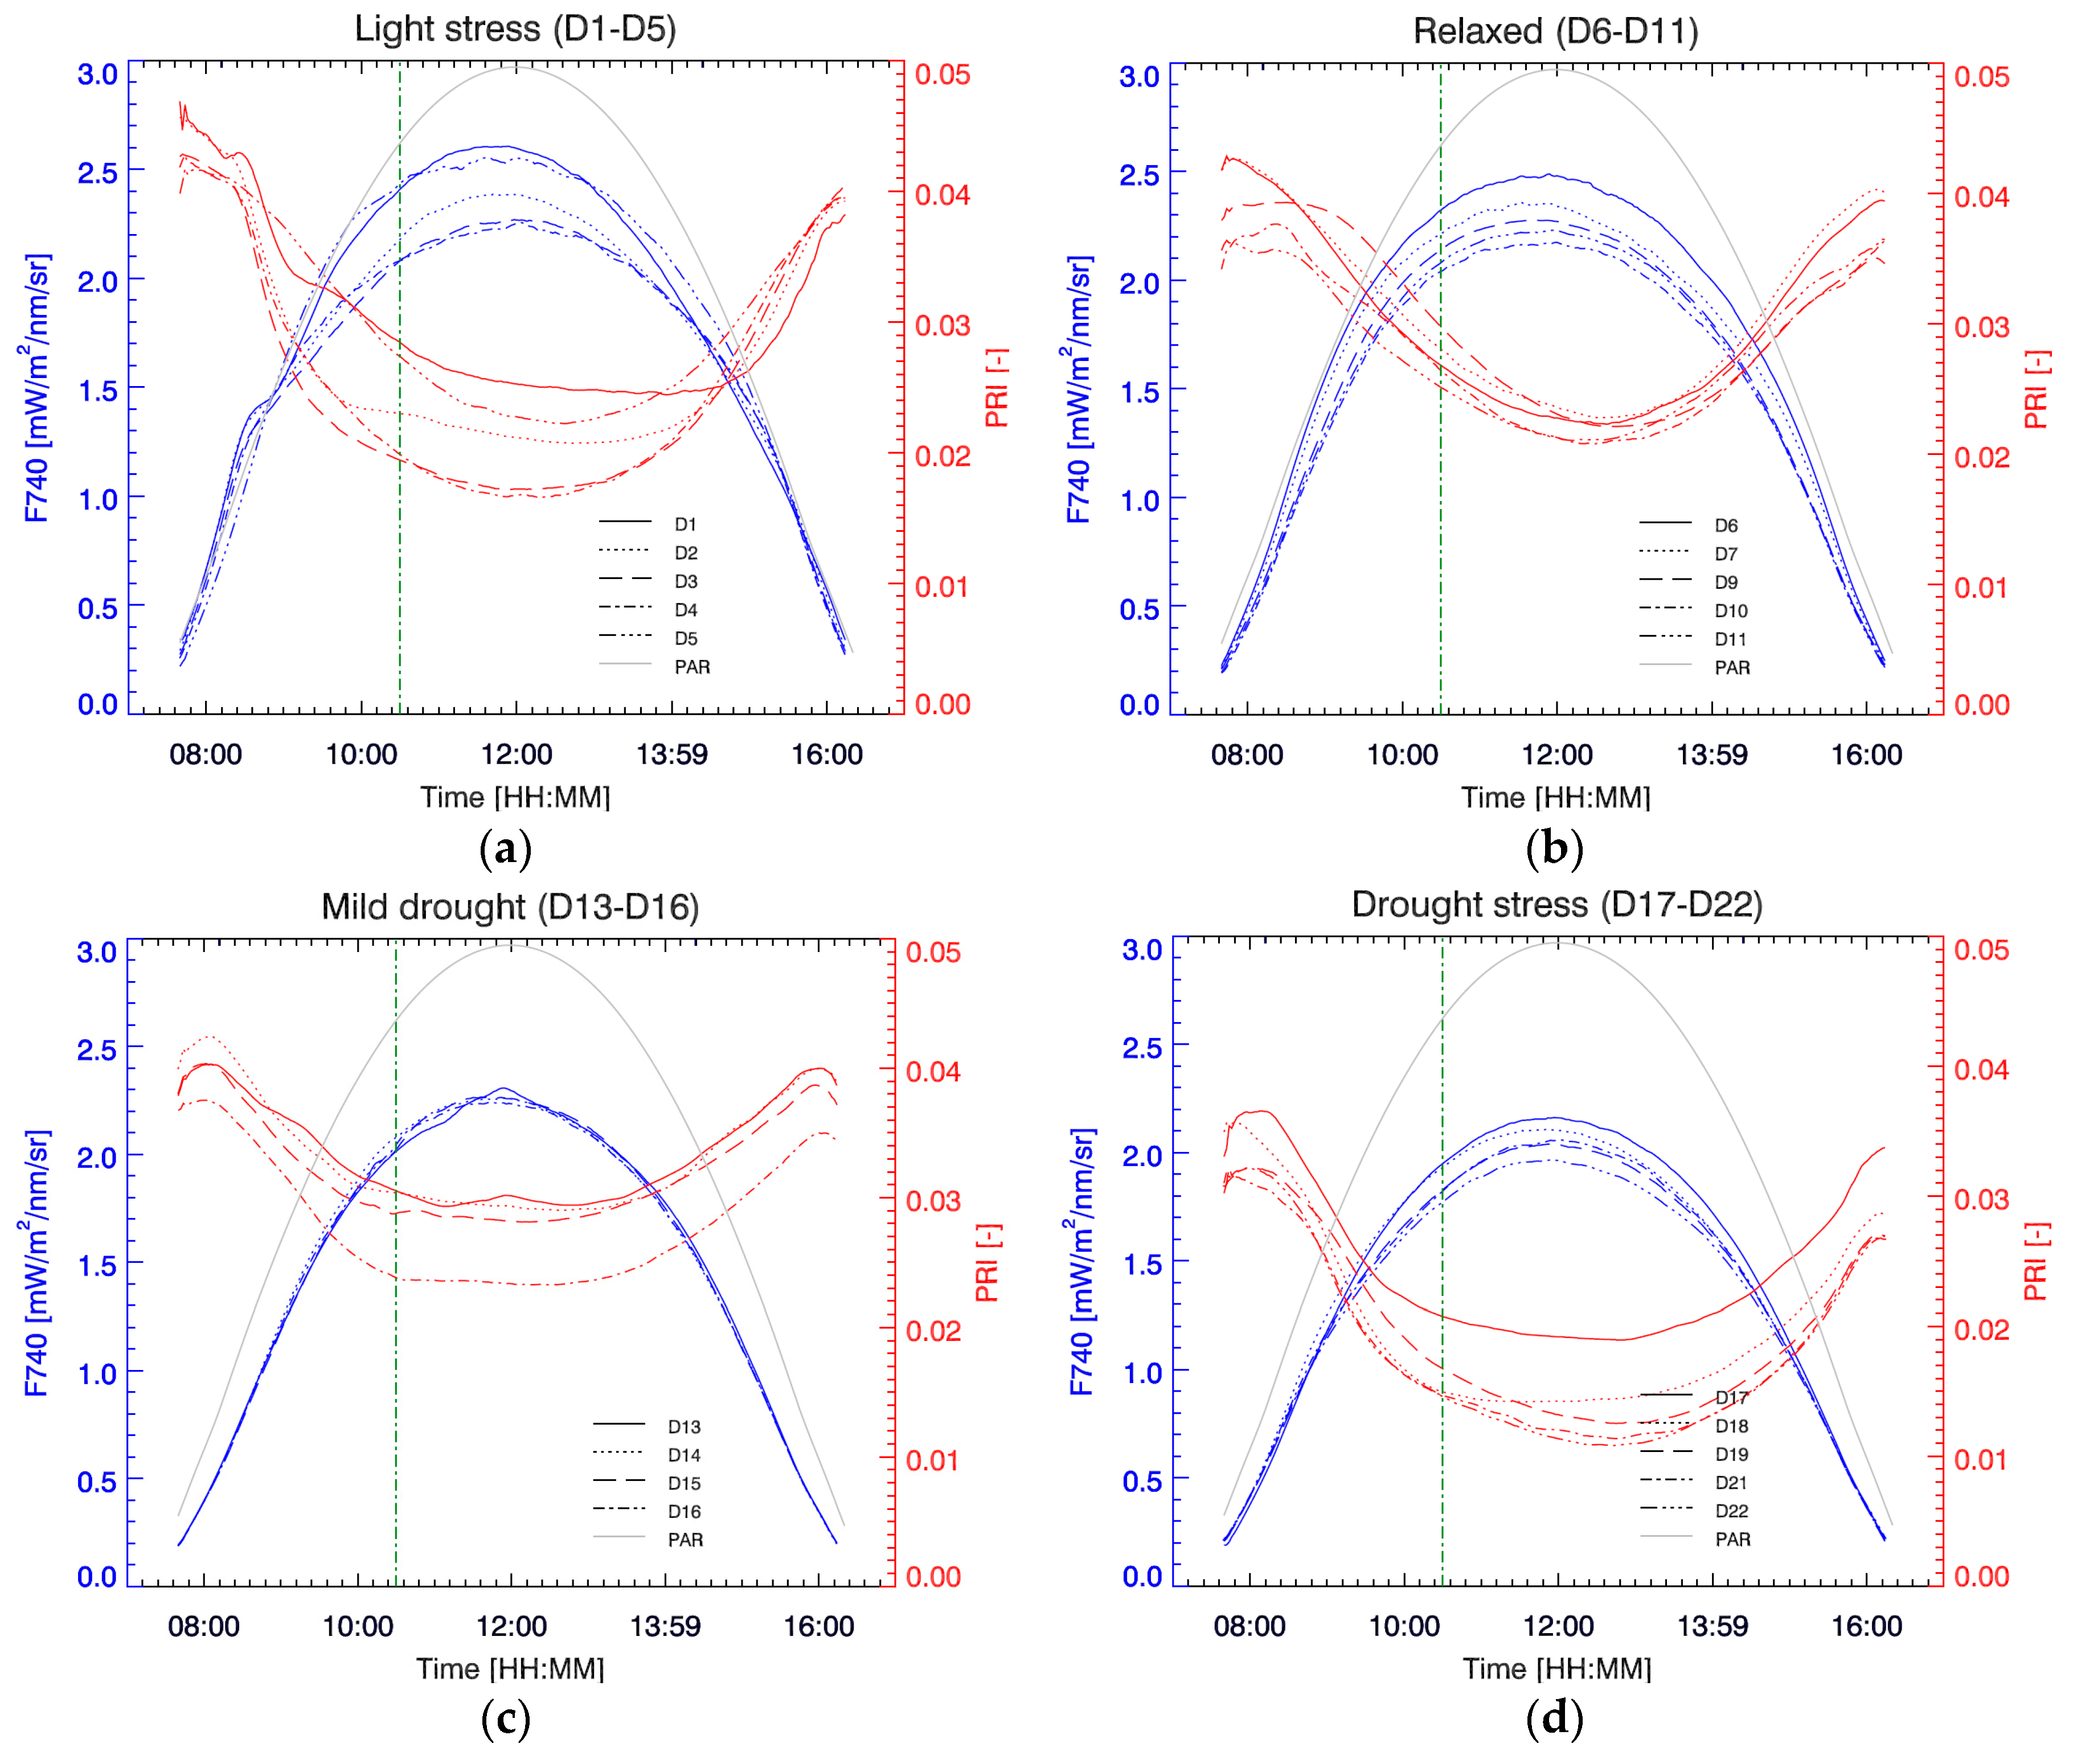
Figure 6). However, at a certain point in the morning, the increase in light becomes too excessive, activating other dissipation mechanisms. PRI, sensitive to the energy-dependent NPQ, decreases and reaches a minimum commonly after solar noon, before starting to rise again. Yet, we can observe that these mechanisms are variable in scale and timing during the stress experiment. According to the different trends in diurnal PRI we distinguished four phases in the experiment.
In a first phase (D1–D5), the plant is still well-watered but under severe light stress (compared to its growth under low light conditions around 100 µmol m
−2 s
−1). On D1 we see that, after 72 min of increasing light exposure, when PAR is around 400 µmol m
−2 s
−1 (right above the illumination level at which it was grown), PRI shows a steep decrease as a sudden response to the unexpected high light conditions (
Figure 6a). Simultaneously, F740 emission reacts to this increase by showing a sudden decrease in slope. After a steep PRI decrease in the morning hours, a further lesser steep decrease brings PRI to a minimum in the afternoon on D1. Hence, a rapid and subsequent slow decrease can be clearly distinguished on this day. Finally recovering in the later part of the day as incoming irradiation gets reduced. On the following days (D2–D4), PRI pursues the steep decrease in the morning for a longer period, reaching the PRI a much lower minimum around “solar noon”, and resulting in a more symmetrical PRI diurnal progress with a deep PRI valley. Meanwhile, F740 maximum decreases in a corresponding way. With this response, PRI and F740 seem to be in phase, i.e., both are simultaneously activated resulting in a synchronized F740 maximum and PRI minimum around solar noon. On D5, after four days of high diurnal light exposure, a first step in the relaxation of daily PRI takes place. PRI does not decrease as much as in previous days, and this relaxation effect is also reflected in the rise of the maximum diurnal F740 (
Figure 6a).
During a second phase (D6–D11), identified as a relaxed state, PRI further relaxes (
Figure 6b). The steep slope in the morning becomes attenuated, softening the PRI minimum. Due to this attenuated activation, a time shift takes place, postponing the PRI minimum to the afternoon. Meanwhile, the diurnal cycle of F740 shows a moderate intensity decrease.
During a third phase (D13–D16) drought stress is starting to increase and PRI is again decreasing faster in the morning (
Figure 6c). However, due to a small shift in leaf position and lost measurements on D12, overall PRI values are higher on D13. Nonetheless, daily PRI values start to decrease and on D16 a low PRI is steadily maintained during the hours around noon. At the same time, no change in the diurnal cycle of F740 is observed during this mild drought stress phase.
From D16 on, the drought stress starts prevailing and the PRI starts rapidly decreasing day by day early in the morning (
Figure 6d). The slopes here are, however, less steep compared to the slopes of the first light stress phase (D1–D4), but PRI begins already at lower values and reaches also lower minima. Notable is the shift of the time at which the minimum PRI occurs each day. Minimal daily PRI values of the entire experiment are reached on D22, with the minimum value one hour after solar noon. The afternoon recovery of PRI does not reach the early morning values, indicating that the protection mechanisms do not deactivate completely. Diurnal F740 shows a steady overall decrease that also reaches a minimum daily curve on the last experimental day. However, the strong time-shifts in the PRI minima from D16 to D22 do not find a counterpart in F740, which remains very stable; this falls in contrast to the first phase (D1–D5) of the experiment when both parameters presented opposing shifts.
In general, we can observe that the diurnal PRI demonstrates a higher variability, both in relative values as in diurnal shape, compared to the F740 diurnal variations. In the beginning of the experiment, PRI showed a higher variation in-between days during the morning hours (on-set of PRI) compared to the afternoon (recovery) hours. However, this was not the case during the last phase of the experiment. This indicates that there is a marked differentiation in behaviour regarding the nature of the stress.
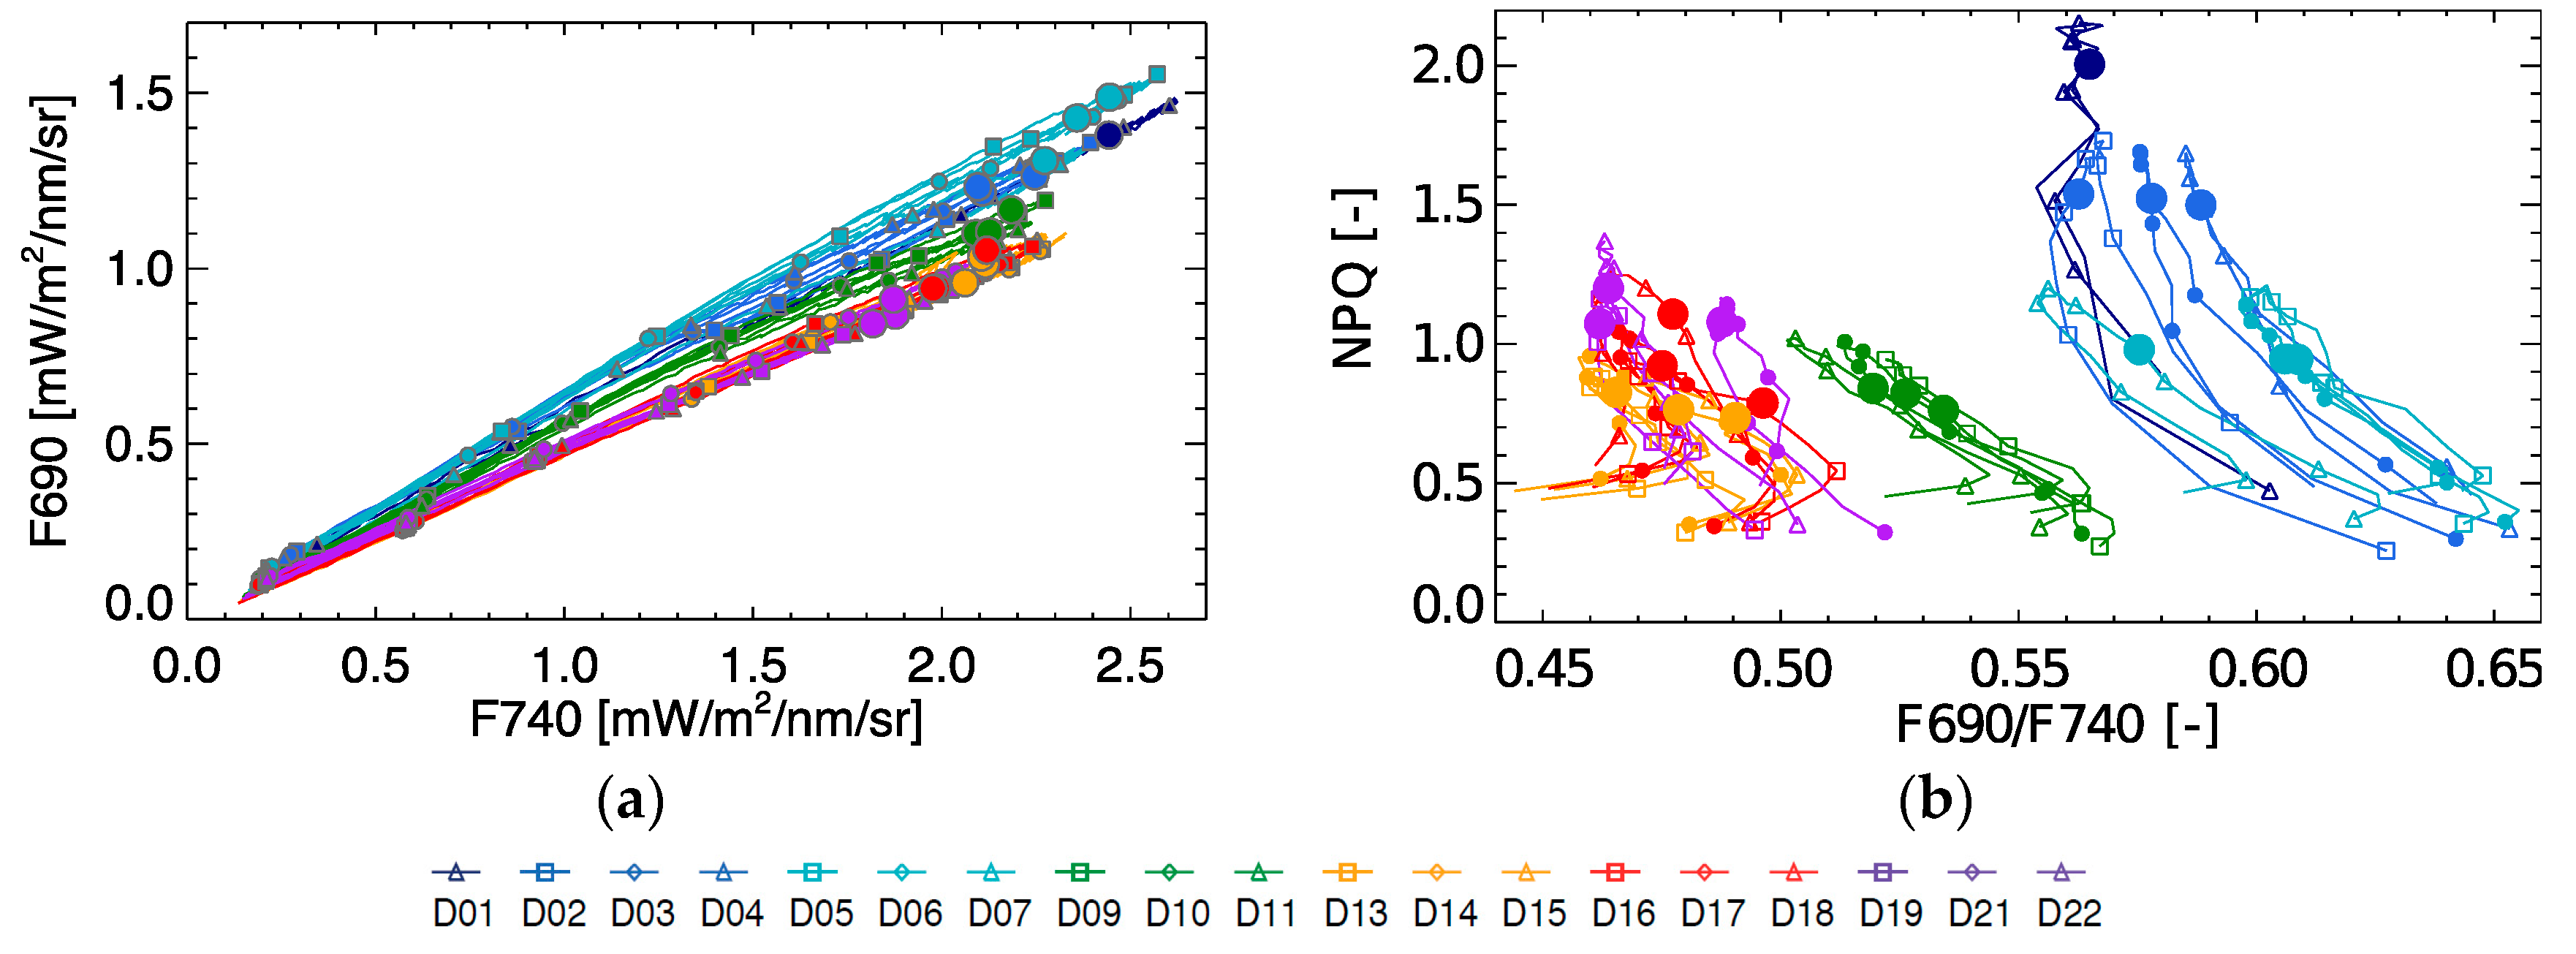
3.4. Diurnal NPQ in Relation to F690/F740, F740, FY740 and PRI
Based on spectral fluorescence the commonly used red/far-red fluorescence peak ratio was calculated. As can be seen from
Figure 7, the F690/F740 ratio shows some significant diurnal variation in function of NPQ, with an increasing ratio in the morning and a decreasing ratio in the afternoon. During the light stress days (D1–D4), the F690/F740 ratio showed overall higher values compared to the rest of the experiment. With increasing drought stress, the F690/F740 ratio measured at 10:30 decreases on D9–D11 (relaxation), and become even lower in the period D13–D22. However, there is few peak ratio variability between days both within the light stress phase and within the drought stress phase, showing a poor stress indicator for progressive stress. From
Figure 7 we can further observe that the peak ratio does not explain any variation in NPQ, but is able to separate light stress from the rest of states.
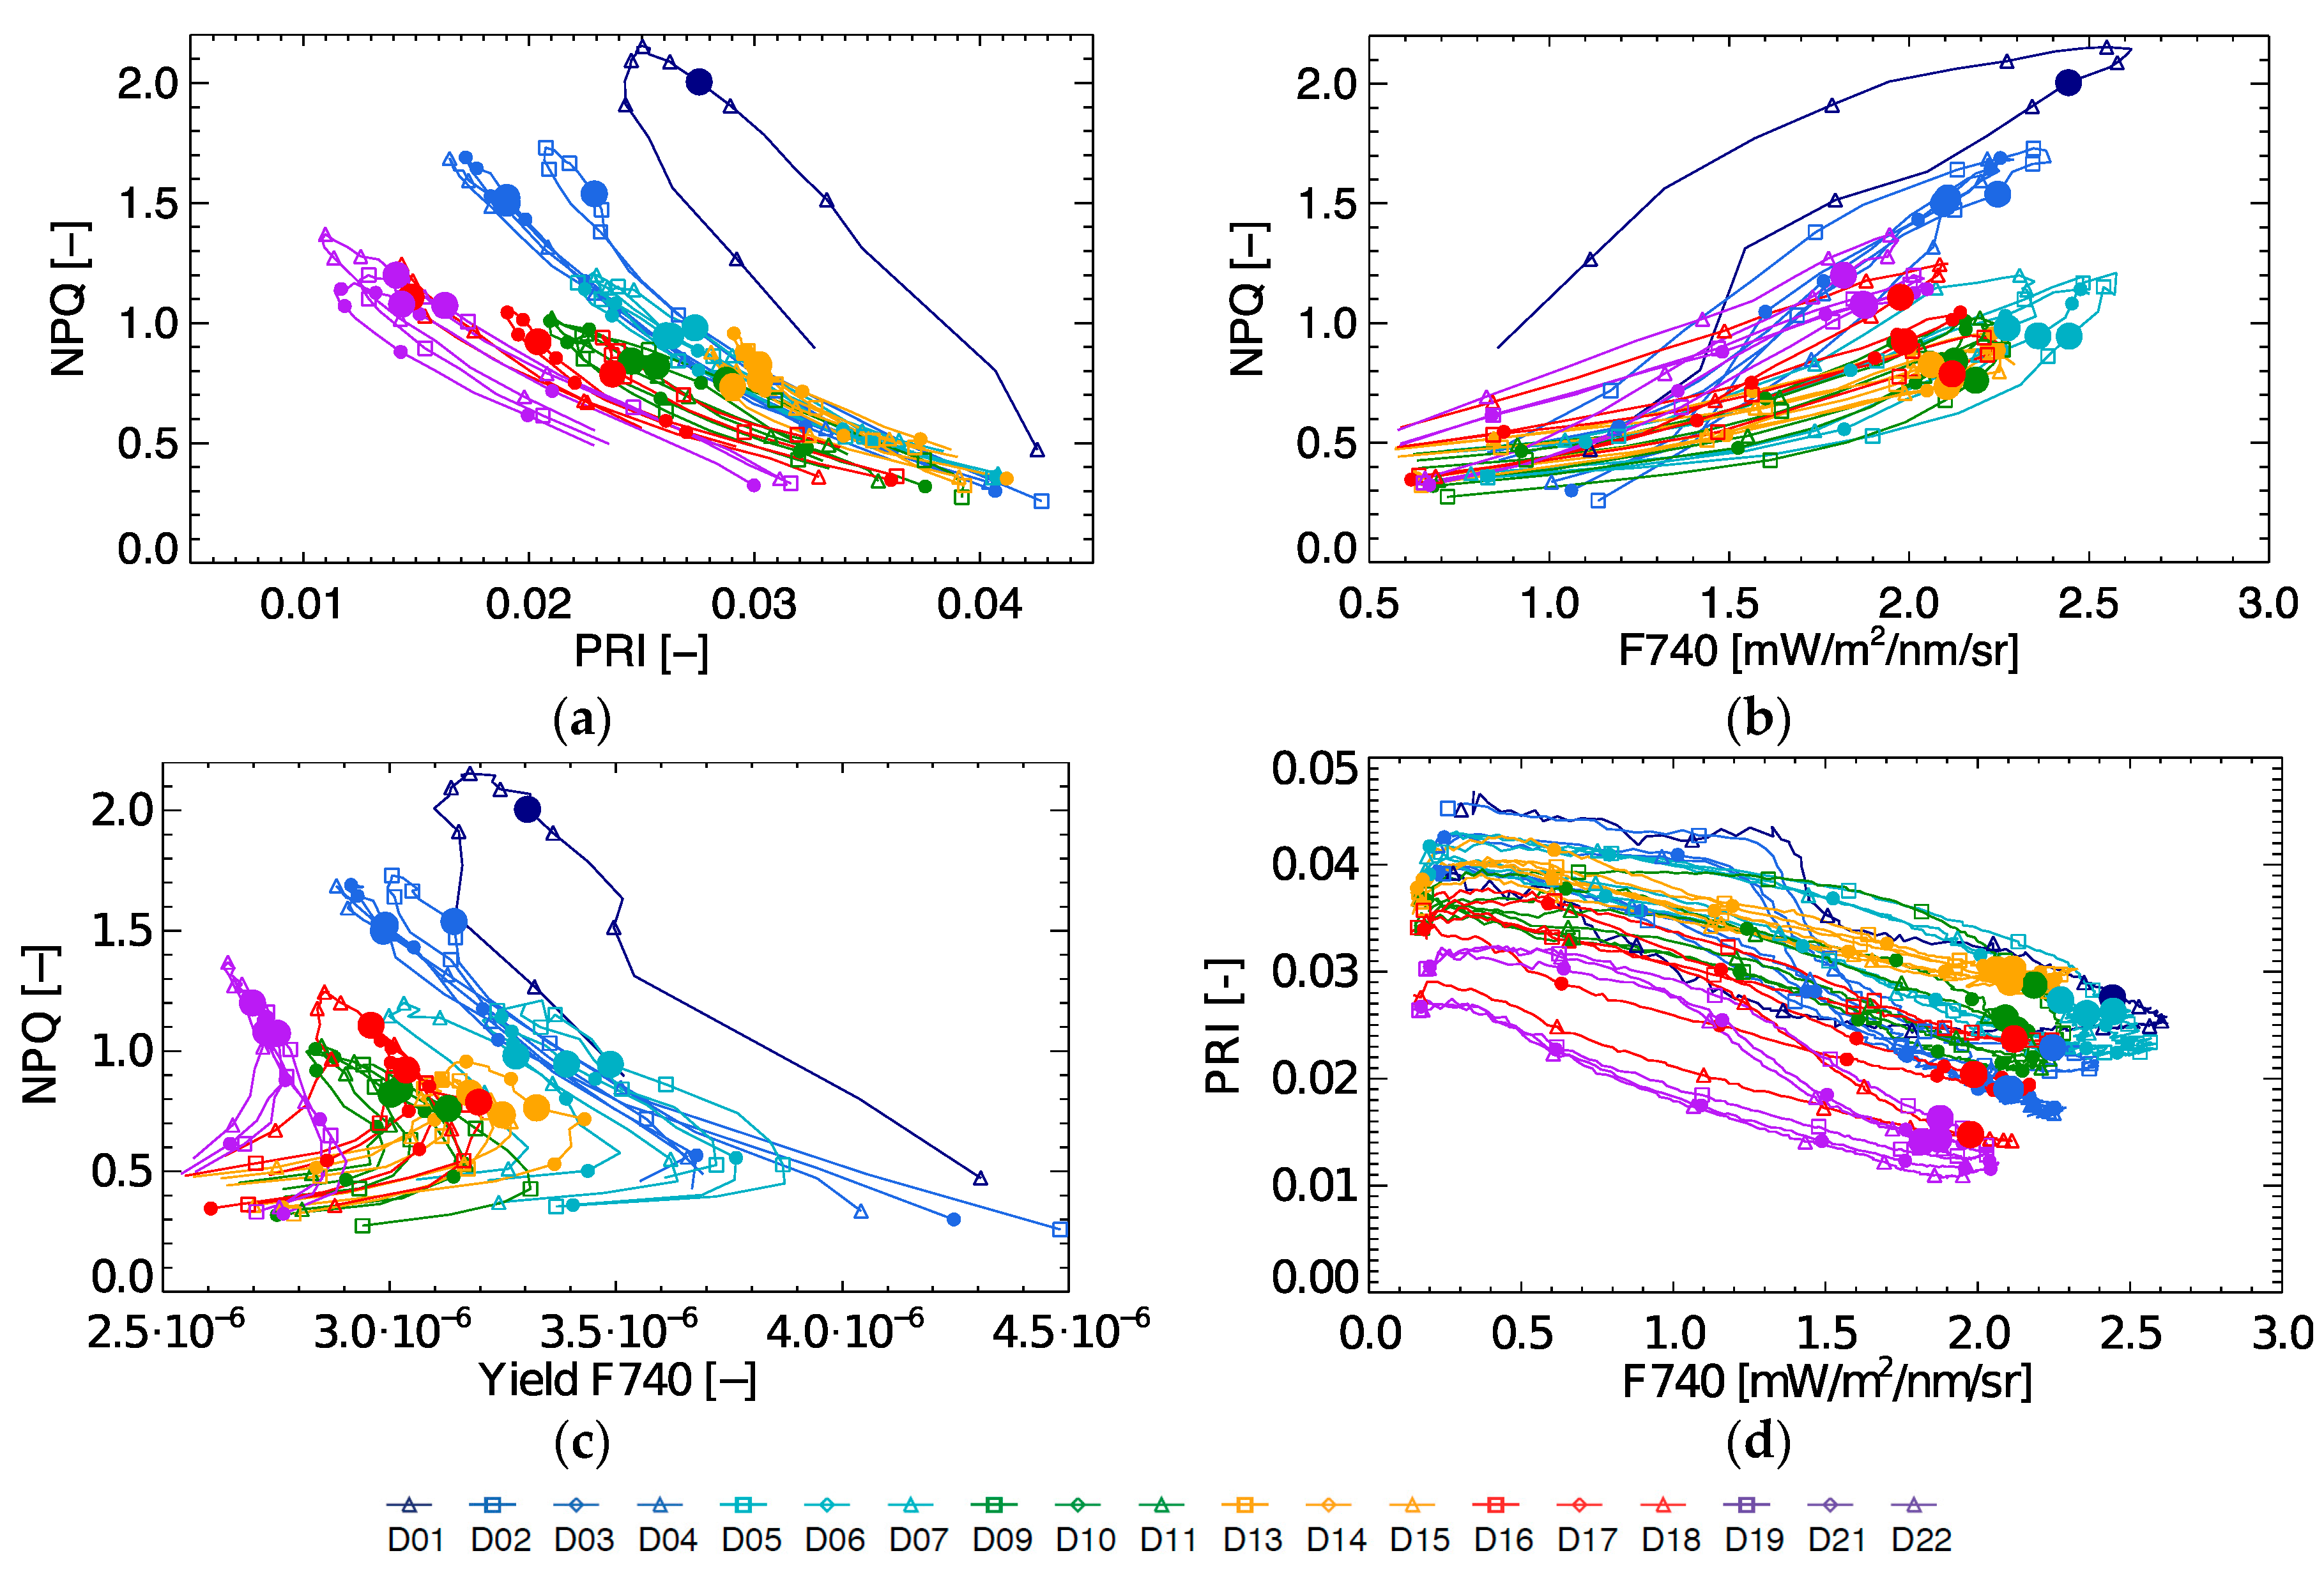
During the 22-day stress experiment NPQ and PRI are strongly coupled, but not related through a single relationship (
Figure 8a), and a linear regression provides an R
2 of 0.69 (excluding the light stress days). Even though there seems to be a non-linear correlation between both parameters for each individual day (except for day D1), this relationship shifts between days. Even more, when observing both parameters at a fixed instant in the diurnal cycle (10:30), it is clear that there is no consistent link throughout the stress experiment. Although, some observations can still be made. On D1, when high light stress occurs, the coupling between NPQ and PRI is very low. On the following days, a stronger daily coupling can be observed between both parameters, but the coupling slightly weakens again toward the end of the experiment (D19–D22). After the light stress days, NPQ decreases, remaining constant during D9–D16 with 10:30 values around 0.8. During this mild drought however PRI starts decreasing, and upon an increased drought stress both NPQ and PRI respectively increase and decrease. This PRI trend can be observed by looking at the marked 10:30 measurements, which show almost a day-by-day shift between D9 until D22.
When looking at the relationship of NPQ with fluorescence yield at 740 nm (
Figure 8c) it is found to be rather complex (yielding an R
2 of 0.59 excluding the light stress days). As FY is high at low light conditions, showing a first peak in the morning and a second but lower peak in the afternoon, diurnal FY shows an asymmetrical behaviour. In contrast, NPQ shows a one-peak diurnal trend with a peak around noon or afternoon depending on the timing of activation of the NPQ mechanisms at high light conditions. Hence, the NPQ-Yield F740 relationship is not straightforward. The observed variation in FY at 10:30 (0.27–0.37%) on D9–D22 cannot explain entirely the in between day NPQ variation.
NPQ and F740 measurements follow a daily loop with positive direction (
Figure 8b). Similar as in the case with NPQ and PRI, these daily loops are not unique throughout the stress experiment. The NPQ-F740 quenching slope is steeper during light stress, with the steepest slope on D1. Additionally, we have the same occurrence that one single F740 measurement does not match one single NPQ measurement over the entire experiment. As shown in
Figure 6, F740 is high at the beginning of the experiment, lowers and increases slightly during the relaxed period after light stress, after which a small further decrease continues until the end of the experiment. F740 and PRI show mutual diurnal trends with a negative direction showing a low morning and afternoon coupling at the beginning and at the end of the experiment (
Figure 8d). Hence, passively retrieved PRI or fluorescence in any of its forms (F760, yield or peak ratio) are not capable to singlehandedly determine the dynamics of NPQ for the whole period. Therefore, it becomes necessary to find other relationships.
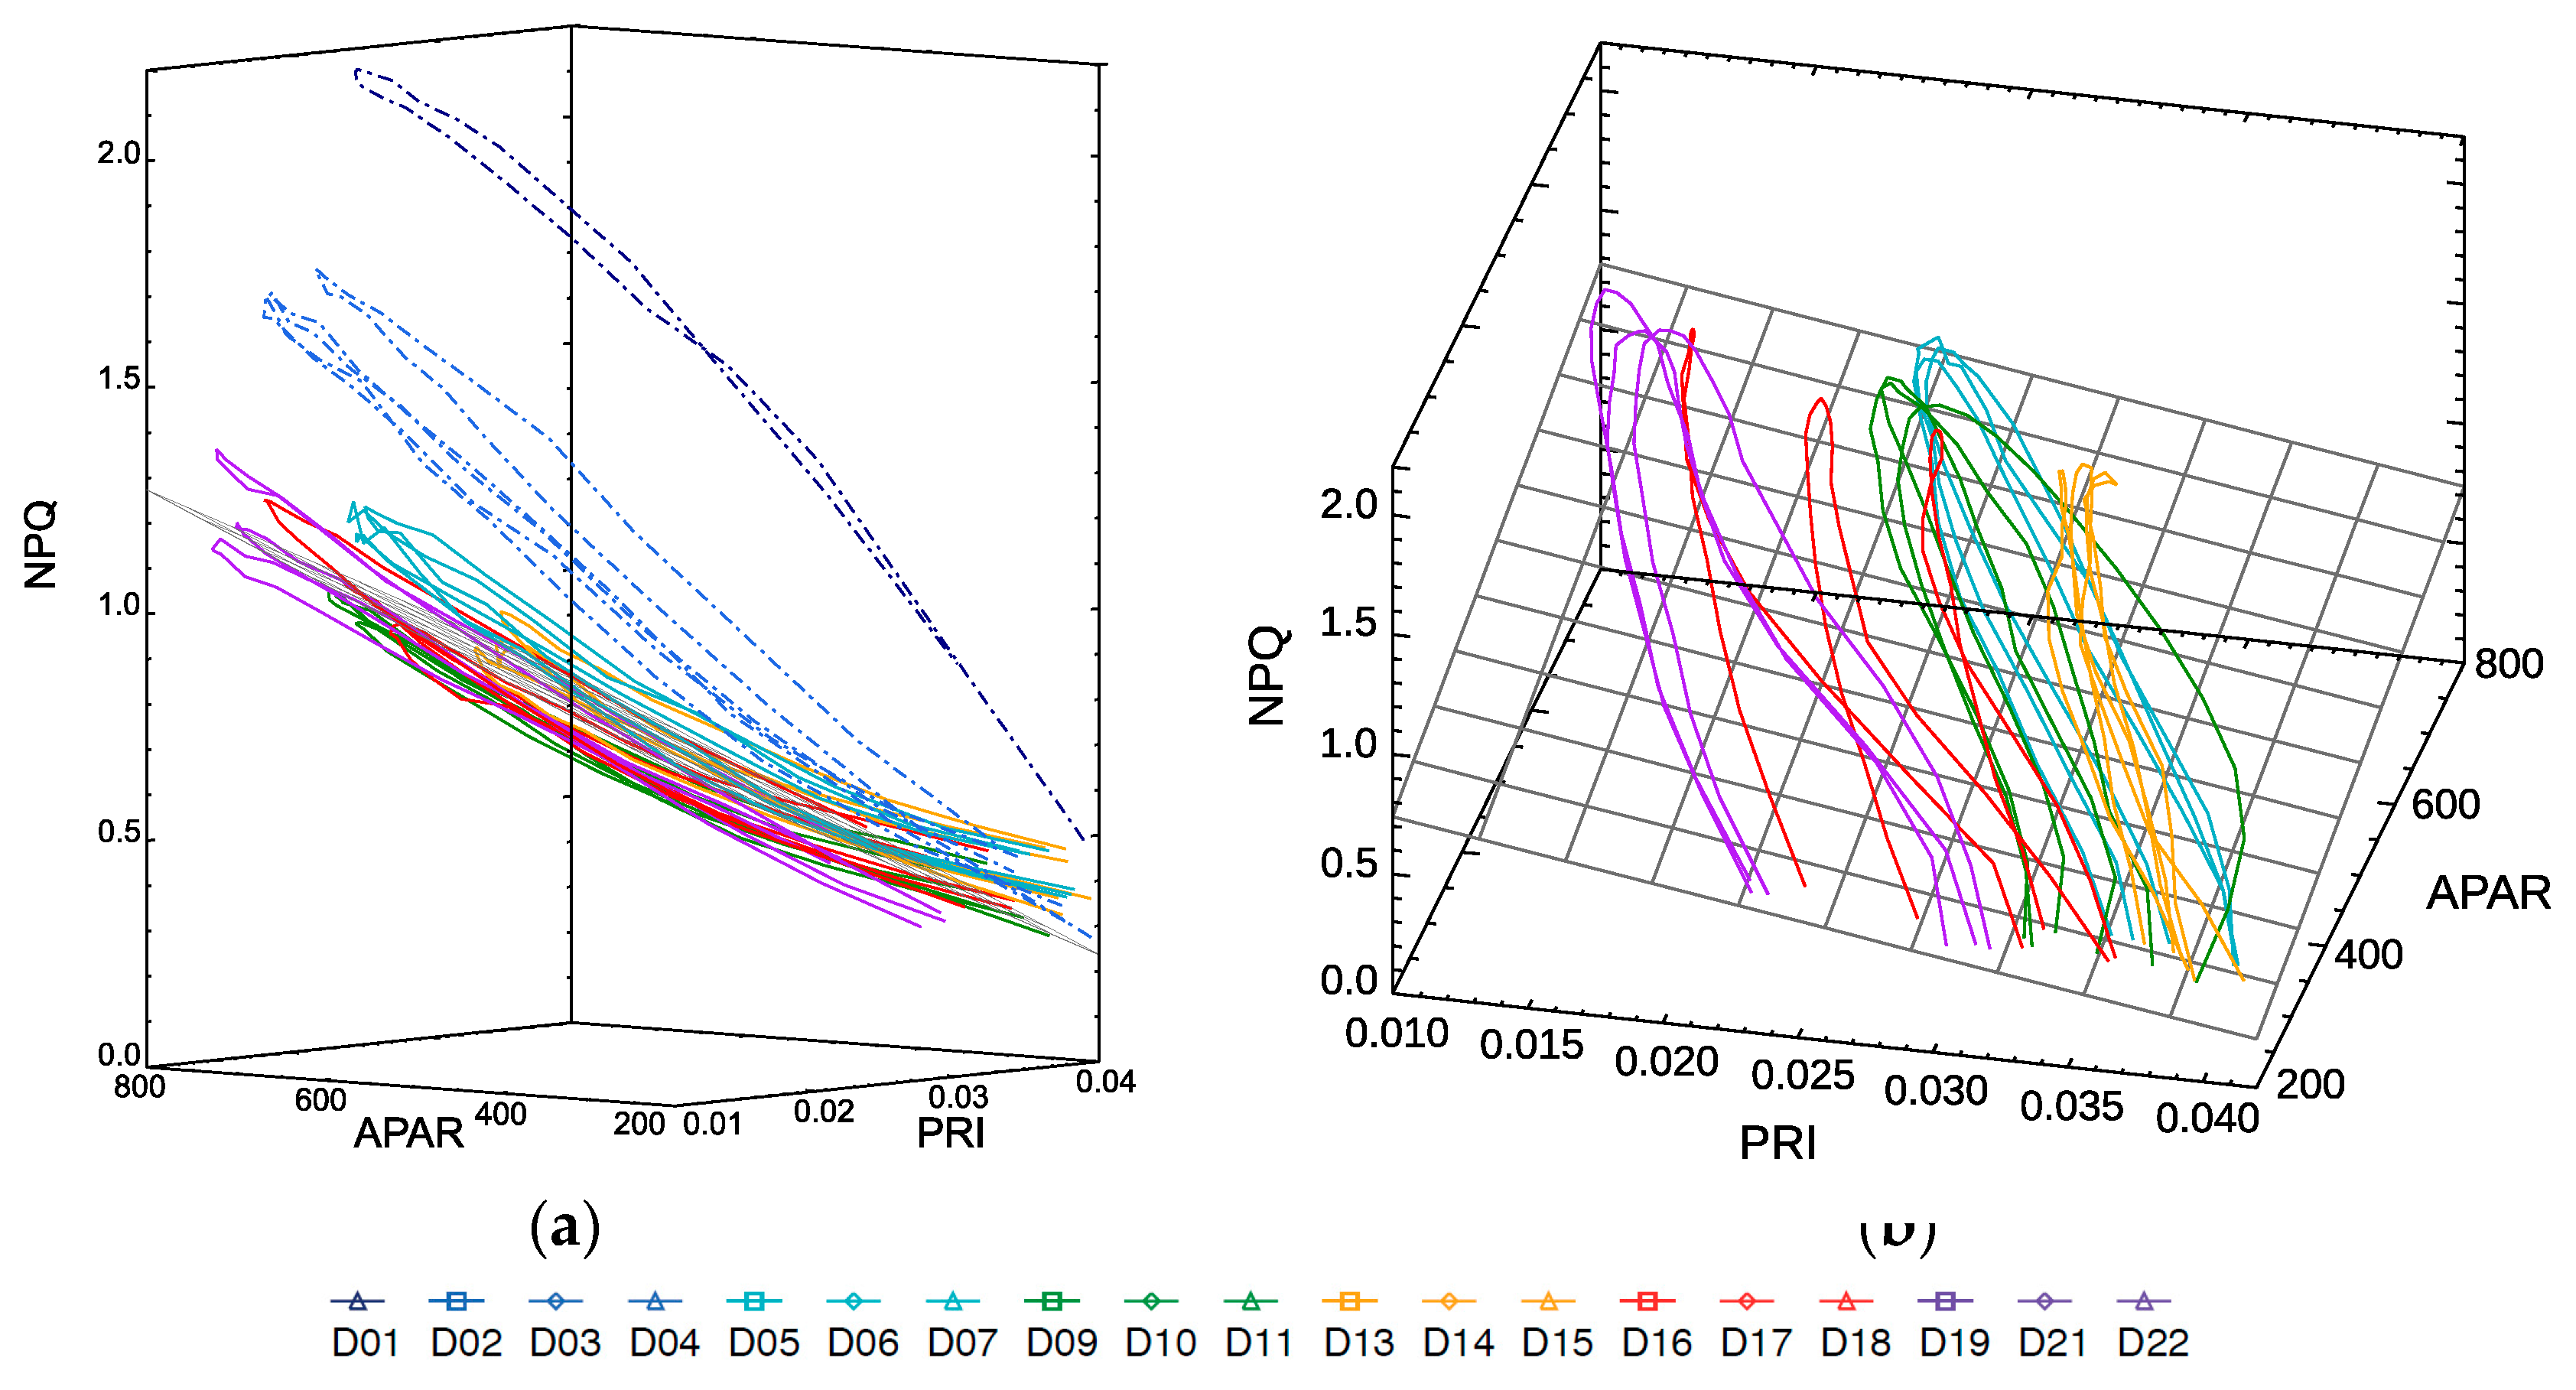
3.5. Estimation of Dynamic NPQ Based on Combined PRI and APAR
The photoprotection mechanisms will react to the amount of light received by the plant, the health status, and the availability of resources for photochemistry. Hence, photoprotection will be activated when absorbed light is in excess of what the plant can deal with, and deactivated when the APAR goes down to manageable levels. Provided that the photoprotective pigment pool is reflected by PRI, it seems reasonable to try combining APAR and PRI to find a relationship with NPQ.
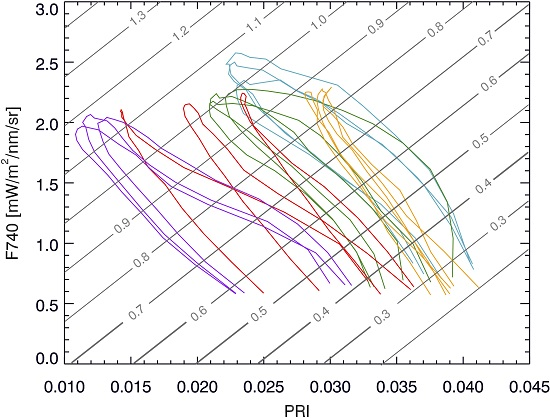
In
Figure 9, all data are plotted in a 3D graph, with NPQ on the z-axis, clearly showing how they fall across a tilted plane, except for the light-stress days D1–D4 (in dashed lines) that do not follow the trend of the rest of the data, as was also illustrated in
Figure 8. In first approach, a basic plane was fitted excluding the light stress days,
where
resulting in the linear estimation of NPQ with a RMSE of 0.08 and R
2 of 0.90.
From the graph in
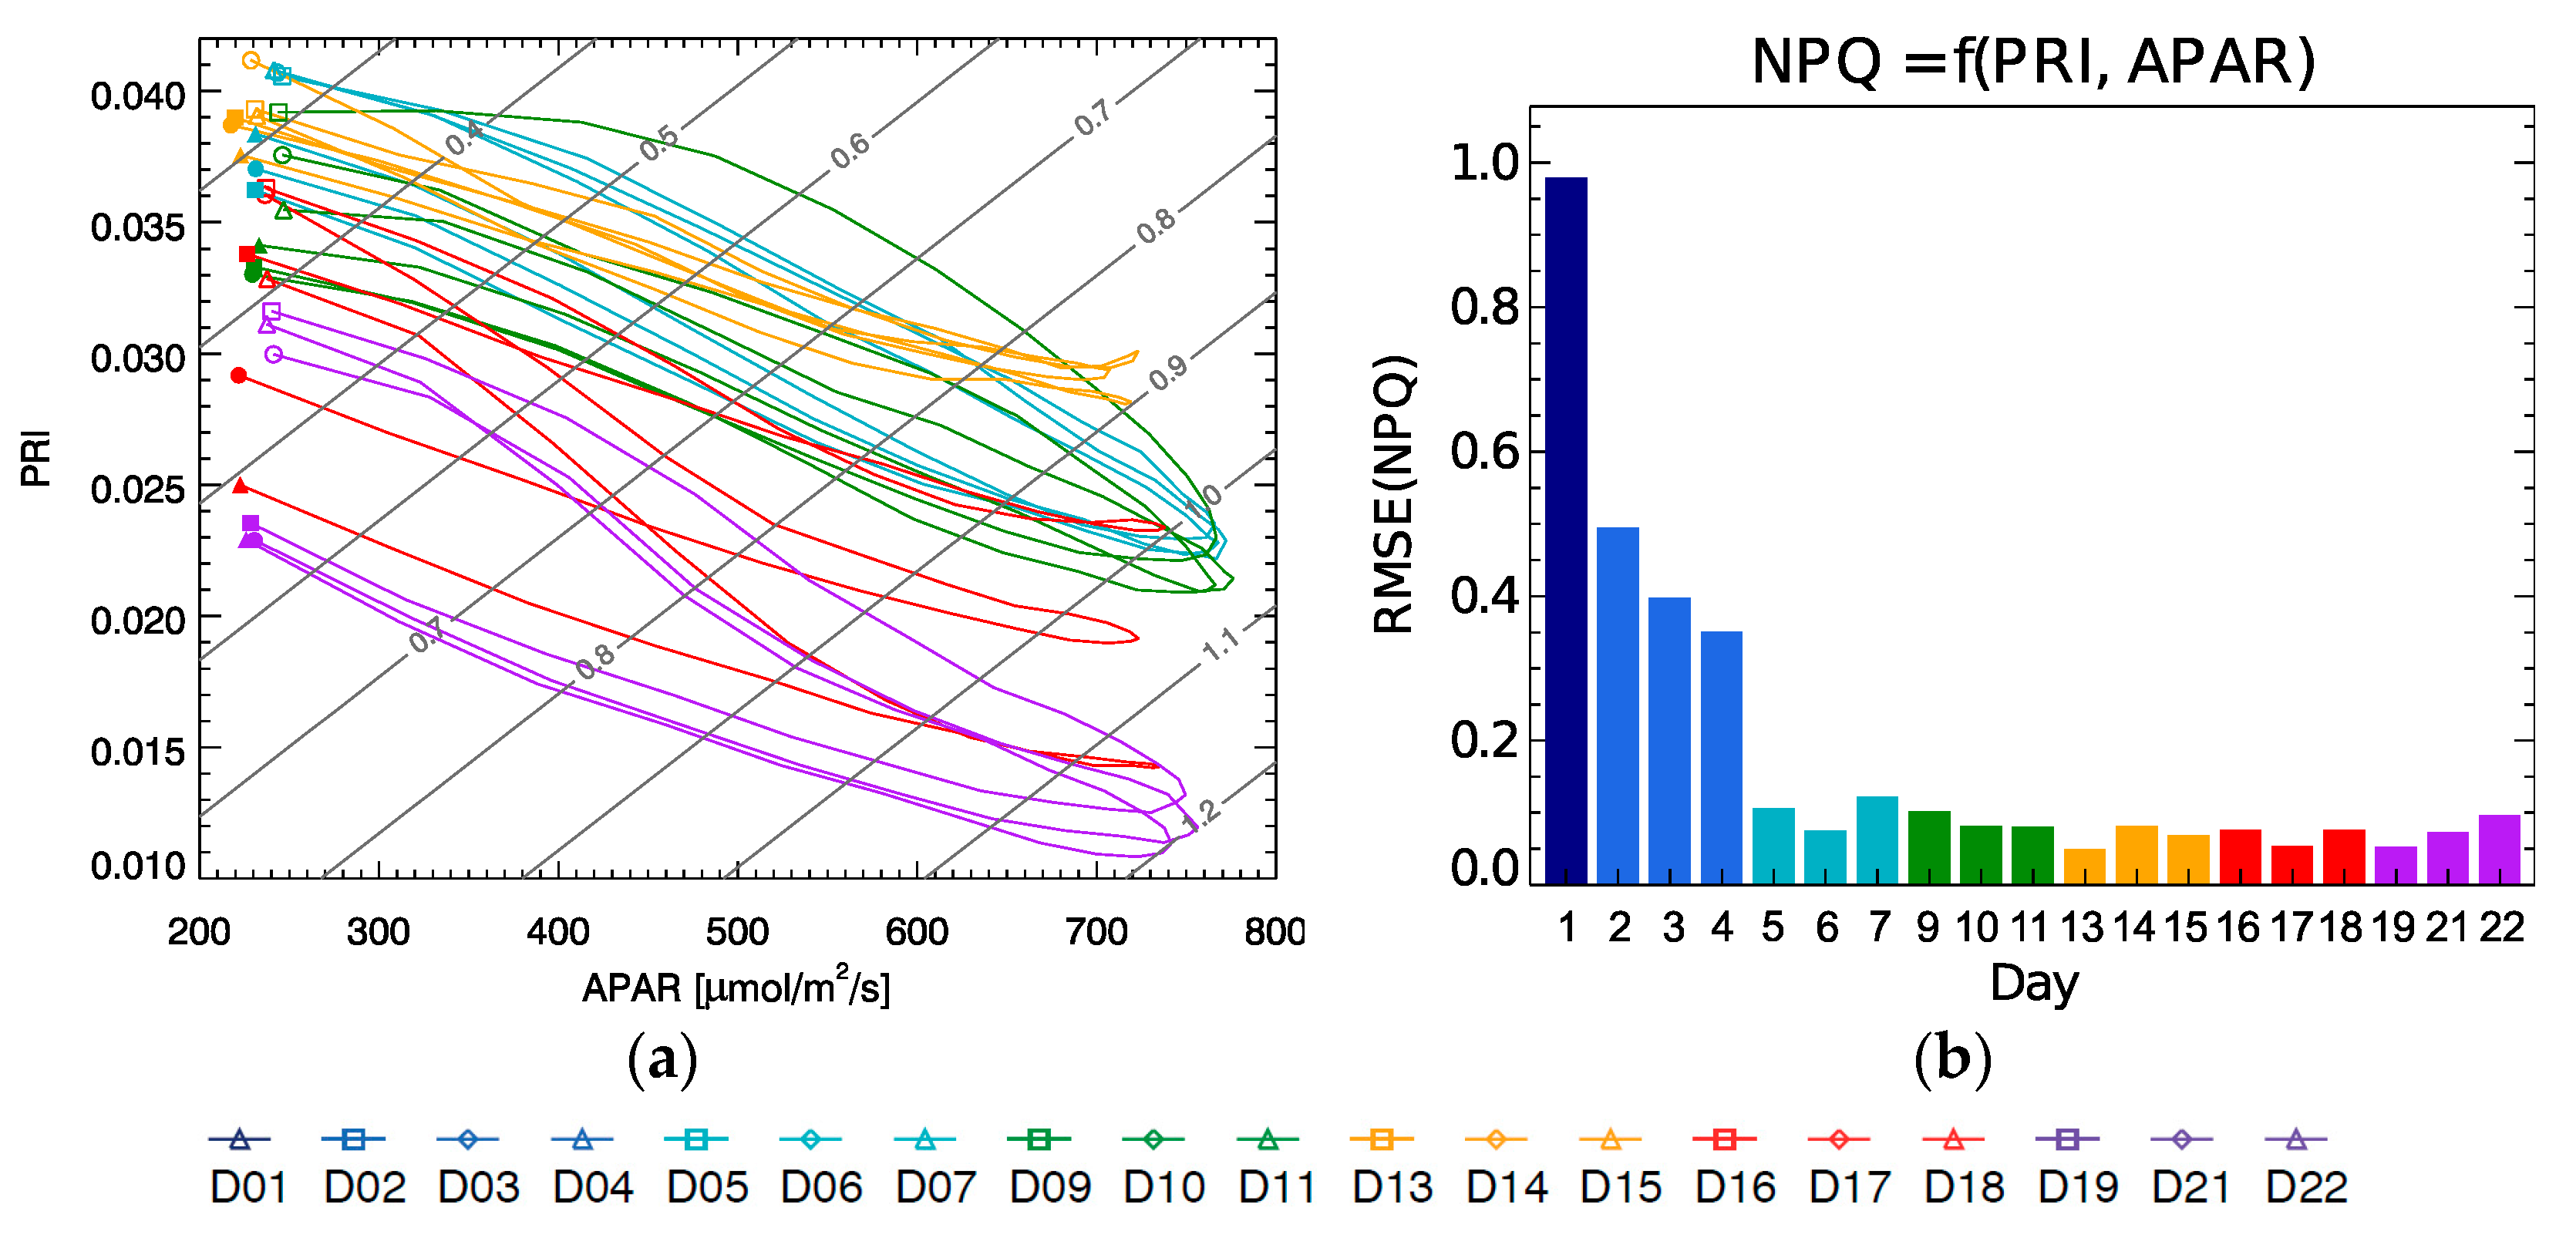
Figure 9a, we can see that morning and evening measurements (to the right hand of the plot) with low light conditions have a higher deviation from the plane fit surface, while the model predicts better for mid- and high-level light conditions. The fitting allows estimating NPQ for the whole development of the plant from its well adapted phase (from D5) to its severe drought (in D22) for the whole diurnal cycle as illustrated by
Figure 10.
Note that the isolines in
Figure 10a representing constant NPQ (in grey) run diagonally with respect to the APAR and PRI axis, while the curves for each day cycle show a hysteresis evolution, and they shift from day to day covering the whole plot area. This implies that a single parameter would not be sufficient to univocally determine the NPQ value on its own since there will be two possible values of NPQ for any single value of either parameter, APAR or PRI. Only when using the combination of both the duplicity is broken.
Figure 10b shows the average RMSE of the NPQ estimation using the plane fit for each individual day, with the error being close to or below 0.1, except for the light stress period D1–D4 that show much larger values, since they actually lie off the plane where the rest of the data are located (
Figure 9a). It should be also noted that when evaluating the NPQ prediction of this model to the 10:30 measurements (the planed FLEX overpass), the result yields an R
2 of 0.96 with a RMSE of 0.08.
4. Discussion
Few studies have tried to obtain knowledge on the dynamics of photosynthetic behaviour and photoprotection of plants based on spectral measurements. Atherton et al. [
12] demonstrated the possibility to predict PSII photochemical yield based on PRI and fluorescence dynamics in combination with simple empirical models. They, however, also stressed out the sensitive behaviour of PRI, wherefore the link with NPQ can change rapidly. During our 22-day experiment, diurnal PRI-NPQ relationships indeed changed daily, and moreover when stress occurred.
Based on the combination of empirical diurnal APAR, PRI, NPQ, F740 and ∆T, carefully measured by active and passive techniques at the same leaf spot, we could follow physiological patterns in the stress experiment. Light stress at the beginning of the experiment was identified by high NPQ values that showed a weak coupling with PRI, fluorescence or APAR, indicating the effect of dynamic photoinhibition. A similar observation of photoinhibition affecting the relationship between PRI and actual photochemical efficiency was mentioned by Ripullone et al. [
25]. Hence, to understand and predict photosynthesis parameters based on passive data, extreme light stress as created in this experiment should be avoided since vegetation is usually well adapted to its natural light environment. Here, we nevertheless observed how photoprotection mechanisms (qE) quickly take over from the photoinhibition (qI) (
Figure 3b), bringing the plant in a relaxed and photoprotected state as is shown by an increase in qE and a decrease in PRI.
Both F740 and NPQ are decreasing during the relaxed phase, suggesting an increase in photochemical efficiency, i.e., the leaf is starting to cope with the high illumination cycle thanks to earlier photoprotection by the repair cycle. Nonetheless, progressive drought is dominating the next two phases, reflected in a NPQ increase together with a PRI decrease. F740 also further decreases, although slightly. A lowered fluorescence intensity due to water-stressed trees has been observed by previous work of different authors [
26,
27], and has been explained by closure of the stomata and an increased photorespiration in C3 plants [
28]. An increasing oxidative stress as consequence of the decreased CO
2 availability induces NPQ mechanisms to rise again, quenching fluorescence. Since photosynthesis is inhibited by stomatal closure as suggested by the increased ∆T, the quenching relationship between NPQ and F740 results are slightly different on D21–D22, showing a steeper slope compared to the previous days (
Figure 8b). In response to stomatal closure, sensible heat loss increases quickly through the increase of leaf temperature by preventing cooling by latent heat exchange. At canopy scale, canopy temperature is therefore generally found a better and quick drought stress indicator compared to fluorescence and PRI [
27,
29]. Hence, exploitation of remotely sensed canopy temperature allows detecting an impediment of photosynthesis due to stomatal closure. Fluorescence intensity, however, might not change significantly under these circumstances. Under severe drought stress and almost complete stomatal closure, photoinhibition will eventually occur [
28], from which the beginning might be seen by a slow increase of the qI parameter towards the end of the experiment.
Predicting NPQ based on PRI and APAR would only work when photoinhibition is not occurring, i.e., the photoprotective qE component is dominating in the NPQ and qI is negligible. Although the severe drought stress days (D21–D22) behave under inhibitory conditions for photosynthesis, the drought stress days were also well predicted by the plane fit model for NPQ (
Figure 9). Hence, the model represents varying physiological conditions in which the dissipation mechanisms were altering under a progressive drought stress.
The obtained relationship needs to be interpreted considering the conditions under which it holds: (1) the chlorophyll content did not present a strong change through the experiment since the plant was already mature when the experiment started and it was not yet decaying when it finished, therefore the changes to PRI can be mainly associated to changes in photoprotective pigments, (2) the sample was receiving direct light, with fixed illumination and sensing geometries, thus no structural effects were present, (3) a different ratio of carotenoids to chlorophylls might lead to different coefficients.
If this relationship is to be extended to other phenological stages, species or to upscale to canopy level, it should be taken into consideration the sensitivity of PRI changes in chlorophyll content (regardless of having the same photoprotective state), the effect of the presence of shaded leaves (if the diffuse illumination is normalized by the global irradiance), or the change in the geometry (e.g., sun elevation through the year even at the same solar time).
Some remote sensing studies have incorporated a correction for PRI, taking into account changing pigment pools. Rahimzadeh-Bajgiran et al. [
13] corrected PRI with a spectral index for chlorophyll content, while Soudani et al. [
30] corrected for the variation in the intercept of the PRI vs. APAR relationships to improve the multi-year PRI-LUE relationship. However, we would like to stress out that diurnal dynamics in PRI, NPQ, and photoprotection in general remains to be further understood.
We remark that the proposed model shows an estimation for a limited range of NPQ under certain stable circumstances at leaf level. To understand and predict the dynamics of NPQ on a wider scale a further research is needed towards more species and environmental conditions.
5. Conclusions
Non-photochemical dissipation mechanisms are the major energy dissipation mechanisms under sunny conditions, influencing the relationship between Chl F yield and photosynthetic yield. This 22-day experiment illustrated the high plasticity of pigments to adapt to photoprotection needs on a day-by-day basis. It was been seen in a change in PRI, starting at lower values each day and showing earlier or later decreases in the day depending on photoprotection needs and capacity.
Results show it is feasible to estimate dynamic NPQ based on PRI and APAR, both retrieved from passive proximal sensing measurements. Diurnal NPQ-PRI relationships were not constant and can shift daily due to adaptation to changing stress conditions as shown in this light and drought stress experiment. Using APAR in combination with PRI data allowed the estimation of NPQ with good precision (RMSE = 0.08) through simple bi-linear regression. Under strong down-regulation of photosynthesis, e.g., photoinhibition due to unexpected high light conditions, the relationships between NPQ and PRI can however be strongly altered. It is important to remark that these findings are applicable to leaf level. To extend this approach to canopy level it should be necessary to carry out new proper experiments that also take into consideration other aspects that modify the response of PRI, such as structure, diffuse to direct illumination ratio, observational and illumination geometry. Nonetheless, strong NPQ levels or gradients, and thus effects on PRI, should be found at the higher canopy layers due to strong photoprotection needs of the top-of-canopy sunlit leaves.
The presented dataset and results set up a better understanding of how passive measurements can lead to the estimation of NPQ, which is an essential energy dissipation mechanism, that together with fluorescence emission and leaf-air temperature gradient, will serve to close the link with photosynthesis.

 and
and 