
Image Fusion-Based Land Cover Change Detection Using Multi-Temporal High-Resolution Satellite Images


1
School of Resources and Environmental Engineering, Anhui University, Hefei 230601, Anhui, China
2
Anhui Key Laboratory of Smart City and Geographical Condition Monitoring, Hefei 230031, Anhui, China
3
School of Civil Engineering, Chungbuk National University, Cheongju 361763, Chungbuk, Korea
*
Author to whom correspondence should be addressed.
Remote Sens. 2017, 9(8), 804; https://doi.org/10.3390/rs9080804
Submission received: 17 June 2017
/
Revised: 19 July 2017
/
Accepted: 4 August 2017
/
Published: 5 August 2017
Abstract
:Change detection is usually treated as a problem of explicitly detecting land cover transitions in satellite images obtained at different times, and helps with emergency response and government management. This study presents an unsupervised change detection method based on the image fusion of multi-temporal images. The main objective of this study is to improve the accuracy of unsupervised change detection from high-resolution multi-temporal images. Our method effectively reduces change detection errors, since spatial displacement and spectral differences between multi-temporal images are evaluated. To this end, a total of four cross-fused images are generated with multi-temporal images, and the iteratively reweighted multivariate alteration detection (IR-MAD) method—a measure for the spectral distortion of change information—is applied to the fused images. In this experiment, the land cover change maps were extracted using multi-temporal IKONOS-2, WorldView-3, and GF-1 satellite images. The effectiveness of the proposed method compared with other unsupervised change detection methods is demonstrated through experimentation. The proposed method achieved an overall accuracy of 80.51% and 97.87% for cases 1 and 2, respectively. Moreover, the proposed method performed better when differentiating the water area from the vegetation area compared to the existing change detection methods. Although the water area beneath moderate and sparse vegetation canopy was captured, vegetation cover and paved regions of the water body were the main sources of omission error, and commission errors occurred primarily in pixels of mixed land use and along the water body edge. Nevertheless, the proposed method, in conjunction with high-resolution satellite imagery, offers a robust and flexible approach to land cover change mapping that requires no ancillary data for rapid implementation.
1. Introduction
International and national institutions require information about the landscape and environment to support decision-makers, and Earth observation techniques are advanced tools that can meet this requirement [1]. As the landscape is not static, Earth observations should focus not only on mapping the static environment, but also on detecting changes, in order to meet the needs of contemporary users. Monitoring land cover conditions and changes is important in the evaluation of the status and transition of ecosystems, such as forest harvest [2], glacial retreat [3], urban expansion [4], wildfire [5], flooding, and drought [6]. Monitoring land cover changes is related to living space and social development, and this has forced policy-makers to include land cover conditions as issues of national importance. Monitoring land cover conditions and changes requires accurate and rapid acquisition of the necessary information about the extent and severity of the changes. Change detection techniques can be used to quickly estimate land cover condition. Information for objects or phenomena can be acquired by using remotely sensed data [7]. Change detection can identify differences by observing the state of an object or phenomenon at different times. For a better understanding of the land cover situation, timely and accurate change detection of the land cover region helps proper management of restoration plans.
With the development of technology and the improved quality of multi-temporal remote sensing data, change detection is becoming a topic of growing interest, and is one of the most important applications for land cover monitoring using multi-temporal satellite imagery. Multi-temporal images such as those from ASTER, Landsat, and MODIS sensors have generally been used for land cover monitoring, as they have a rapid revisit time and widely available spectral wavelengths. Land cover monitoring is analysed at different scales, with spatial resolutions varying from 15 to 1000 meters, but low spatial resolution is not sufficient for detailed analysis [8,9,10,11]. Synthetic-aperture radar (SAR) images have been employed because they can be acquired the data regardless of the weather condition [12,13,14]. Although these sensors have many advantages, high-resolution multi-temporal satellite images still have the best potential to detect land cover monitoring, as the optical image is used to analyse more details and to more precisely assess land cover change in the area.
In recent literature, various algorithms for automatic change detection have been proposed, such as change vector analysis (CVA) [10], Erreur Relative Globale Adimensionnelle de Synthese (ERGAS) [15], universal image quality index (UIQI) [16], and multivariate alteration detection (MAD) [17]. These algorithms have proven to be effective in many applications. CVA can be characterized by a change vector with measurable direction and magnitude among multi-temporal images [18], with the changed area determined based on the change vector by using a threshold. This method showed better performance in the comparative evaluation of change detection techniques for detecting land cover and land use changes using Landsat images [10]. The ERGAS method shows a relative dimensionless global error in the synthesis for local change detection in high-resolution multi-temporal images. This method exploits the benefits of the ERGAS index to maintain the independence of the number of spectral bands, and it does not need any parameters or assumptions to obtain the difference image [15]. The UIQI method is easy to calculate, can handle several types of image noise, and relates to the change information. It measures the distortion between multi-temporal images with loss of correlation, luminance distortion, and contrast distortion. A piecewise correlation between two multispectral image data sets can provide valuable information regarding the location and characteristics of change [16]. The MAD method is based on a canonical correlation analysis (CCA) applied to change detection. It features good de-correlation transform and analysis, and finds linear combinations to maximize the variance of spectral variations. This method can concentrate all spectral variations of land cover into MAD components in multi-temporal images [19]. In theory, the MAD method can provide an optimal change indicator for multi-temporal remotely sensed images [17,20]. In the above methods, the difference image is created by subtracting the pixel value from multi-temporal images. The difference image is one of the main providers of change information, as it contains clues about spectral changes and has significantly large values associated with regions that show a high probability of being changed [16]. Finally, the threshold method is employed to identify the changed area by empirical strategies or statistical methods. In the change detection method, it is important to obtain the difference information and select the threshold method, as the result of the change detection method based on the difference image is very heavily reliant on the spectral features [21]. The accuracy of the change detection results is dependent on many factors, such as geometric registration, calibration, and experience of the analyst [22]. Because the pixels are independent but not spatially independent, the difference information based on spectral feature may fail to detect the changes in the high-resolution multi-temporal satellite images. Therefore, modification of these algorithms is a must in order to minimize the false alarm rate and improve the accuracy of the change detection results.
A new unsupervised change detection algorithm is proposed in this study for detecting the changed land cover region using high-resolution multi-temporal satellite images. The performance of this approach has been tested for improving change detection accuracy and minimizing error for the different targets but with similar spectral information, especially for water and vegetation areas. For this, the image fusion process is applied to obtain more effective change detection results from multi-temporal data while emphasizing the spectral distortion among the fused images acquired at different times, as it is beneficial to differentiate the spectral information of the targets. The change information is extracted from the fused images using a modified iteratively reweighted multivariate alteration detection (IR-MAD) method, which can be used to evaluate the spectral distortion in order to maximize the variance of the spectral variations and minimize the effects of local spectral distortion by different sensor positions or acquisition times. Finally, the land cover change region is extracted by an automated thresholding method to determine the boundaries of change and non-change.
The remainder of the study is organized as follows. The details of our proposed method are presented in Section 2. The experimental data, analysis, and discussion of our results are presented in Section 3, where we apply our algorithm to the IKONOS-2, WorldView-3, and GF-1 multi-temporal images and compare our result with the existing CVA-, ERGAS-, spectral angle mapping- (SAM-), and original IR-MAD-based analysis. The conclusions are presented in Section 4.
2. Cross Fusion-Based Change Detection Method
Compared with classical unsupervised changed detection methods which are achieved based on different images, our method analyses the spectral distortion to extract the change information during the process of image fusion. Generally, image fusion technology is a process of combining relevant information from two or more images into a single image [23]. In this study, a cross fusion methodology is proposed by integrating multi-temporal images. It can be applied to detect the changed area through the spectral distorted area of cross-fused images at different times. In order to achieve the aims of the study, we analysed the discrimination between changed and unchanged pixels from cross-fused images.
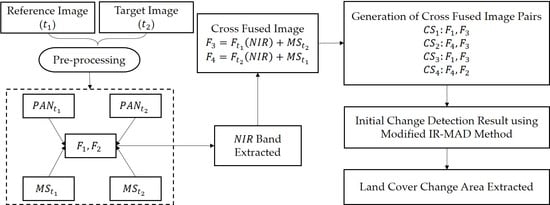
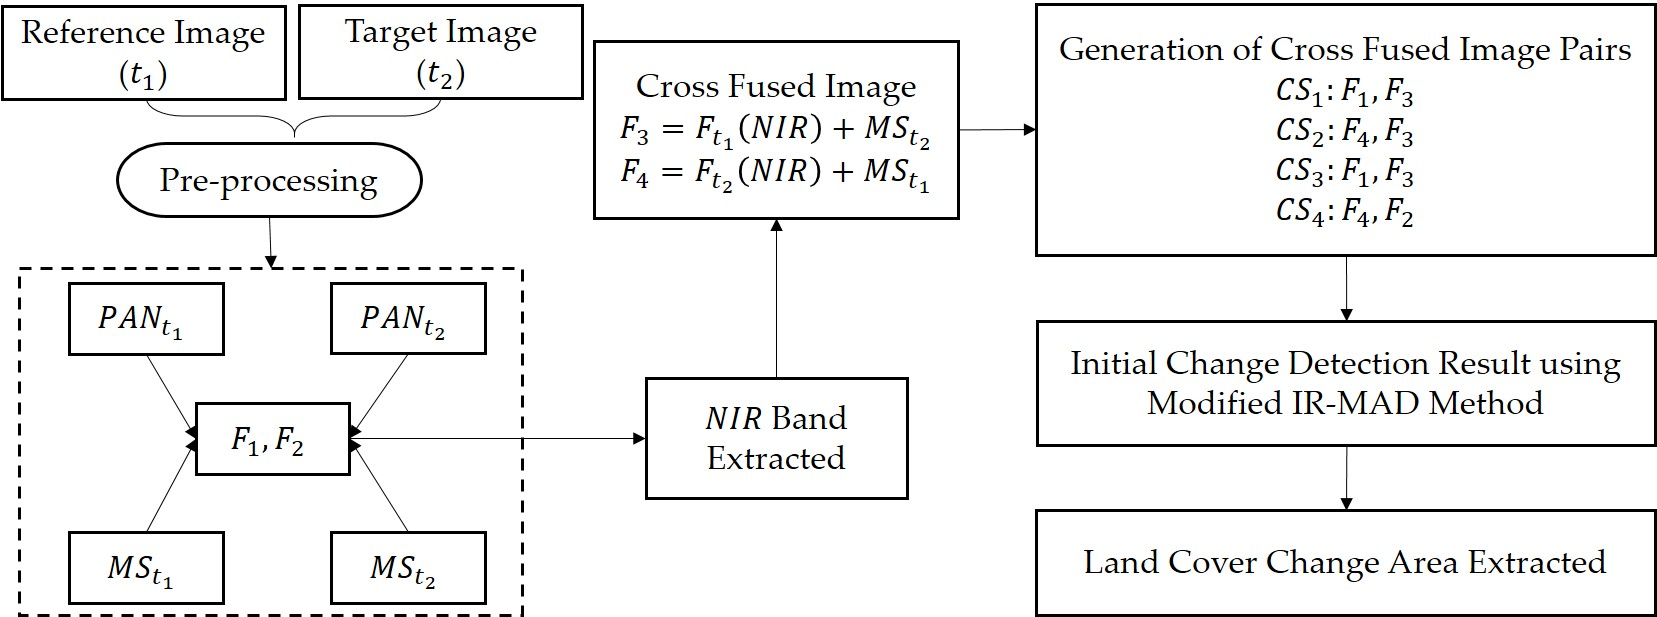
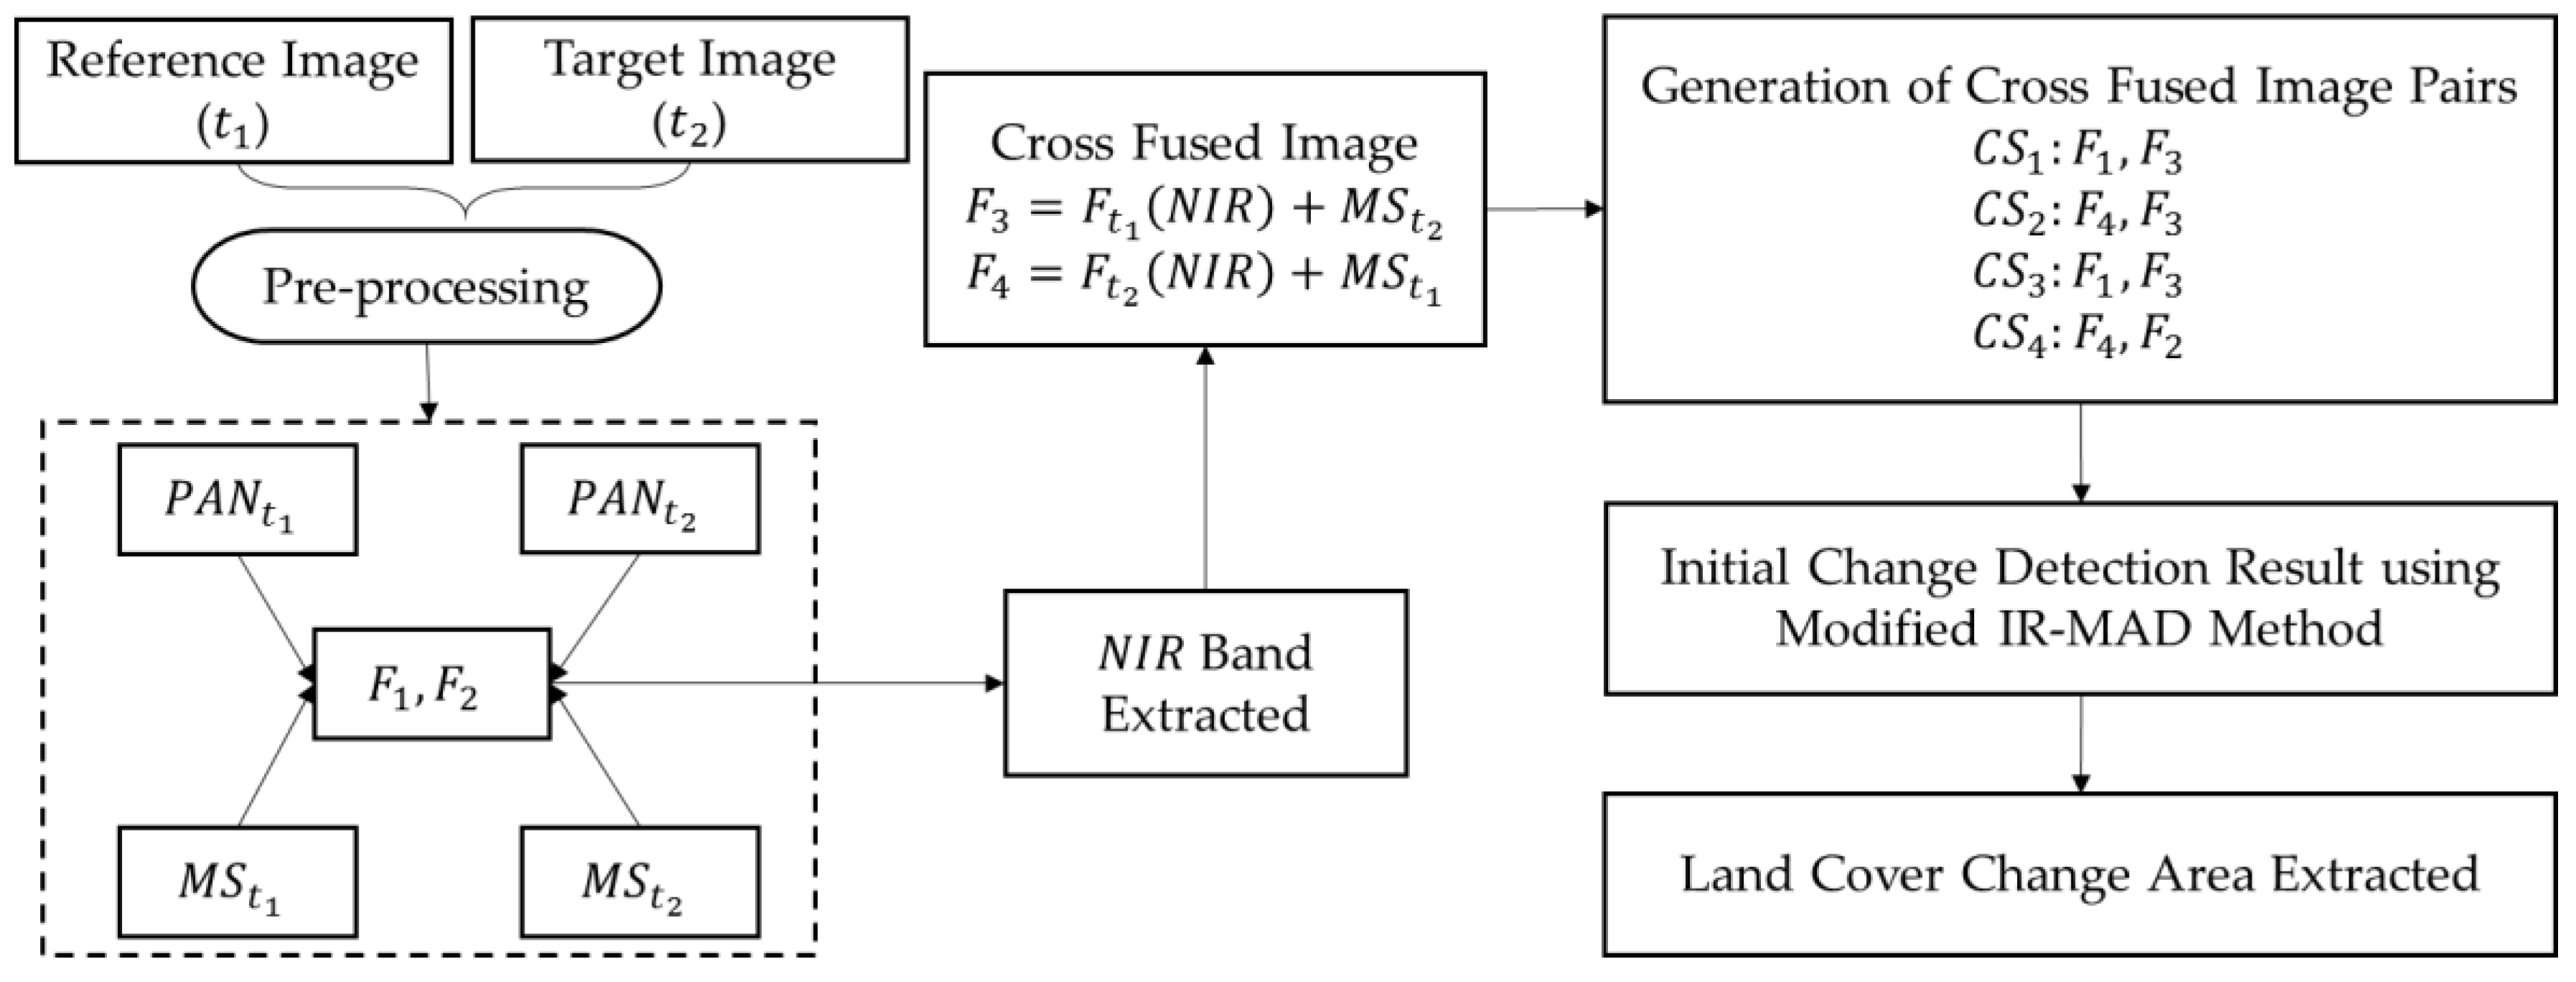
General image fusion or pansharpening use the same temporal panchromatic (PAN) and multispectral (MS) images. Therefore, we consider the two high-resolution datasets and , consisting of a PAN and four-band MS images, respectively, acquired in the same geographical area. The workflow of our algorithms is described in Figure 1 to explain the concept and procedure of the proposed change detection technique to detect the land cover change area.
2.1. Gram–Schmidt Adaptive (GSA) Image Fusion
Many satellites provide two types of images: high-resolution PAN images and low-resolution MS images. PAN images exhibit a high spatial quality, while MS images exhibit a high spectral quality. In order to improve the spatial information of an MS image using a PAN image, many image fusion methods have been proposed to fuse the two types of images. However, it is difficult to obtain high spatial resolution MS images due to the technical limitations of certain satellite sensors.
To achieve this aim, many image fusion methods have been proposed. The intensity-hue-saturation (IHS) transform can be used to rapidly merge the massive volumes of data by requiring only resampled MS data [24,25]. Multiresolution analysis (MRA)-based methods employ digital spatial filters to extract high spatial frequency information from a PAN image [26]. Gram–Schmidt sharpening uses the intensity image from a multiple regression analysis [27]. Most image fusion methods can be approximately summarized in two steps: (1) extract high-frequency spatial information from the PAN image, and (2) inject spatial details into a resized MS image by using different models [28]. In general, a framework can be defined as [29]
where and are the fused image and the resized MS image of the th band, respectively. is resampled to the same spatial resolution of the PAN image. is the PAN image that contains the primary high-frequency information. is the synthetic image having an equivalent spatial resolution with . is the adjustment coefficient, and determines the amount of spatial detail for the resized MS bands.
When applying image fusion methods, GSA is applied as a representative component substitution (CS)-based fusion algorithm. By applying a multivariate linear regression procedure, is determined between the resized MS image and the PAN image. Meanwhile, can define a proportion of the covariance value between the and resized MS image [30]. If a multi-temporal data set is not orthorectified, the fused images have different spatial characteristics generated by the PAN and MS images, because of relief displacement and the dissimilarity of the geometric characteristics of the features. In addition, they must have similar spectral and spatial resolution, so preprocessing is required, including geometric and atmospheric correction. According to the GSA image fusion method, and are generated for the IKONOS-2, WorldView-3, and GF-1 datasets in this study.
2.2. Cross-Fused Image Generation
The near-infrared (NIR) band is widely used in land cover monitoring, providing the normalized difference vegetation index [31], normalized difference water index [32], and normalized difference built index [33]. The NIR band is very important in these indexes, and can provide better automatic recognition results in the satellite imagery. The NIR band image is extracted, and is a very useful information source for detecting water or vegetation areas. The water area appears dark in the NIR band since the water has strong absorption characteristics, and the vegetation area has the opposite characteristics. Therefore, is the cross-fused image generated using the MS band and NIR band of , and is the cross-fused image generated using the MS band and NIR band of by using the GSA image fusion algorithm. They may generate obvious spectral distortions in the land cover change areas.
As a CS-based fusion algorithm, GSA can effectively inject spatial details into the fused image. However, each of the image fusion methods has its own disadvantages, with CS-based generating a spectral distortion (or colour/radiometric distortion). The spectral distortion is caused by the mismatch between the spectral response of the MS and PAN bands according to the different bandwidths [19,34]. In order to achieve the aim of our study, the change detection performance using this spectral distortion is used in this study. To this end, the cross-fused image is generated through the NIR band instead of the PAN image. Therefore, the fused images bring significant spectral distortion in the changed area, while keeping the radiometric characteristic of the water or vegetation body. The mismatch of the spectral response is out of the NIR spectral range, and the bandwidth of the NIR band is narrower than the PAN image. This characteristic can discriminate between changed and unchanged areas in the dataset in our experiment, especially in the water and vegetation areas.
2.3. Application of Modified IR-MAD by Cross-Fused Image
In the cross-fused images, we consider the spectral distortion as a distinguished feature of the changed area. However, a certain amount of spectral distortion is not ideal, as the cross-fused images are generated using two images at different times. This spectral distortion can cause massive false alarms of change in the area. Because some spatial inconsistency and shape disagreements would cause the distortion by multi-temporal images from different geometric characteristics, blurring and artefacts occur at relief features due to different sensor positions during the image fusion process. This indicates that the alteration of pixel values between unchanged flat terrain and relief features by acquisition angles may exhibit a slight variation, while the pixel values of the changed area exhibit a large variation.
In this study, the modified IR-MAD algorithm—an established change detection technique for multi-temporal images based on canonical correlation analysis—is used to alleviate this problem and quantify the land cover change area, which is an established change detection technique based on canonical correlation analysis, and it is a well-established change detection method for multi-temporal multispectral images. IR-MAD is an iterated version of a multivariate alteration detection (MAD) algorithm [20], in which the sum of squares of the normalized MAD variates follow a chi-square distribution with degrees of freedom corresponding to bands in the images [17]. Meanwhile, the IR-MAD method provides the change information by using the chi-square value and supplies the information for different categories of changes by means of the orthogonal MAD variates [19].
The IR-MAD algorithm is applied considering reference image and target image , acquired from the same area at different times with bands. and are generated as the random variables based on spectral transformation, using coefficient matrices and , as shown in Equation (2) [20]:
where the superscript is the transpose of each matrix, and the optimal values of and are calculated by maximizing the variance of and for determining the changed area. Next, the newly projected multispectral images and are defined by the solution of eigenvalue problems to the and from a canonical correlation analysis. The two eigenvalue problems are coupled through the parameter as shown in Equations (3) and (4):
where is the covariance matrix of the reference image, is the covariance matrix of the target image, and is the cross-covariance matrix between the two images.
The MAD variates are generated by taking the paired difference between and which represent the change information, as shown in Equation (5) [35]:
Using the sum of the squares of the standardized MAD variates, the probability of the changed information for pixel is defined in Equation (6):
is the MAD variate of the th band for pixel , and is the standard deviation of all observations for simplicity. is used to identify a greater chi-square value as a weight for the probability of changes in each pixel. By using , the mean, covariance, and correlation of and are determined as the weight factors. Based on the revised mean, covariance, and correlation values, the optimal matrices and are re-calculated by the weight factor until convergence through iterative updating of the weight factor.
In this study, the modified IR-MAD method is applied between the cross-fused image pairs based on the multi-temporal multispectral pixel. MAD variates corresponding to four pairs of cross-fused images are generated by using the optimal coefficients and through Equations (7)–(10):
where are the MAD variates of the fused image with the same temporal data. Using the same multispectral image with high spatial resolution, the fused image (, ) and cross- fused image (, ) in and are generated. Meanwhile, two cross-fused images (, ) in are generated from the different multispectral images with high spatial resolution of the NIR image. They have the same high spatial characteristics, and the spectral information of the changed area is retained by the multispectral images obtained at different times.
The IR-MAD is a high-performance methodology, but there are some important issues, such as the standardization of the individual MAD variates to the unchanged probability distribution. The wrong projection is originated for the MAD variates when a large number of pixels in the scene are changing between the different times [35]. Therefore, the change information in , , and is robust for extraction by spectral distortion. Because certain spectral distortion effects have occurred in the fused images using multi-temporal images, compensates for these effects in , , and . In this study, based on the combination of , , , and , the final change detection index for pixel is calculated using Equation (11):
are the th band MAD variates of the th pair of fused images for pixel . This method can effectively reduce the falsely detected changes by considering values four times in Equation (10). Although this method has a higher computational cost than the original IR-MAD, it is this key difference that allows the acquisition of better change detection results. The change information is computed between the four pairs of fused images (, , , ), and this technique is worth consideration for the detection of the water and vegetation area change in high-resolution multi-temporal images.
2.4. Extract of the Final Land Cover Change Area
In this study, a thresholding method—the Otsu thresholding algorithm—is combined with the modified IR-MAD image to obtain binary data of the changed and the unchanged area. The Otsu method is a popular thresholding method and can be used to select an optimal threshold by maximizing between-class variances [36]. In addition, it can provide histogram-based image segmentation with satisfactory desired characteristics. It does not affect image contrast and brightness, and is identified as the best method for automatic threshold determination. However, Otsu is inefficient, as the data have high computational cost; it needs to conduct a search for all the pixels and calculates the variance. With its representative automatic thresholding, effective performance, and easy application [37], the Otsu thresholding algorithm is applied to the change detection index image in this study.
2.5. Validation and Accuracy Evaluation
To determine the effectiveness of this unsupervised change detection method, we compared our results with other typical unsupervised change detection algorithms, such as the CVA, ERGAS, SAM, and original IR-MAD methods. The typical unsupervised change detection methods are applied based on the following steps: (1) and are generated by using a GSA method; (2) these typical methods are applied between the and GSA-fused images; and (3) the changed area is extracted using the Otsu algorithm. In the CVA-based change detection method, the relationships among the multi-temporal images can be characterized by change vectors with a measurable direction and magnitude. In the past, the ERGAS was proposed to estimate the overall spectral quality of fused images, and recently, the ERGAS index was applied to change detection so that the index is calculated around a neighbourhood, simultaneously processing all the spectral bands available. The SAM is one of the most extensively used change detection methods based on physical attributes, and this method treats each pixel in a multispectral image as an n-dimensional image and computes spectral similarity by determining the angle between spectra from multi-temporal images to determine the change information. The Otsu thresholding algorithm was applied to the binary images for the automatic determination of an optimal decision threshold in these methods.
During the processing of the ground truth image, we considered the changed area and unchanged area in the dataset. Since it is hard to detect all the changes (e.g., residential districts, roads, and buildings), we focus on changes caused by the land cover property. Meanwhile, the confusion matrix method was applied to evaluate the proposed method and statistical accuracy assessment of the tested methodologies. From the confusion matrix of each tested methodology, the overall accuracy (OA), kappa coefficient (KC), correctness (CR), false alarm rate (FAR), commission error (CE), and omission error (OE) were provided.
3. Experimental Results and Discussion
3.1. Image Preparation
In order to achieve the aims of this study, two multi-temporal datasets were used to evaluate the performance and feasibility of our methodology. The first case is located in Linhuan diggings, Huaibei, Anhui Province, China. The second case is located in Feidong, Hefei, Anhui Province.
The first case was acquired on 17 May 2004 by IKONOS-2 and 7 December 2014 by WorldView-3. The pair of images used for change detection has different spatial resolution, from 0.31 m to 1 m in the PAN band and from 1.24 m to 4 m in the MS bands. Because the spectral characteristics of the IKONOS-2 sensor differ from that of WorldView-3, only four spectral bands (red, green, blue, and NIR) were used from IKONOS-2 and WorldView-3. Table 1 presents the specifications of the data. The multi-temporal datasets in the scene were acquired with a 10-year gap, and this scene mutually exhibits a large area of changes caused by coal mining subsidence, as shown in Figure 2.
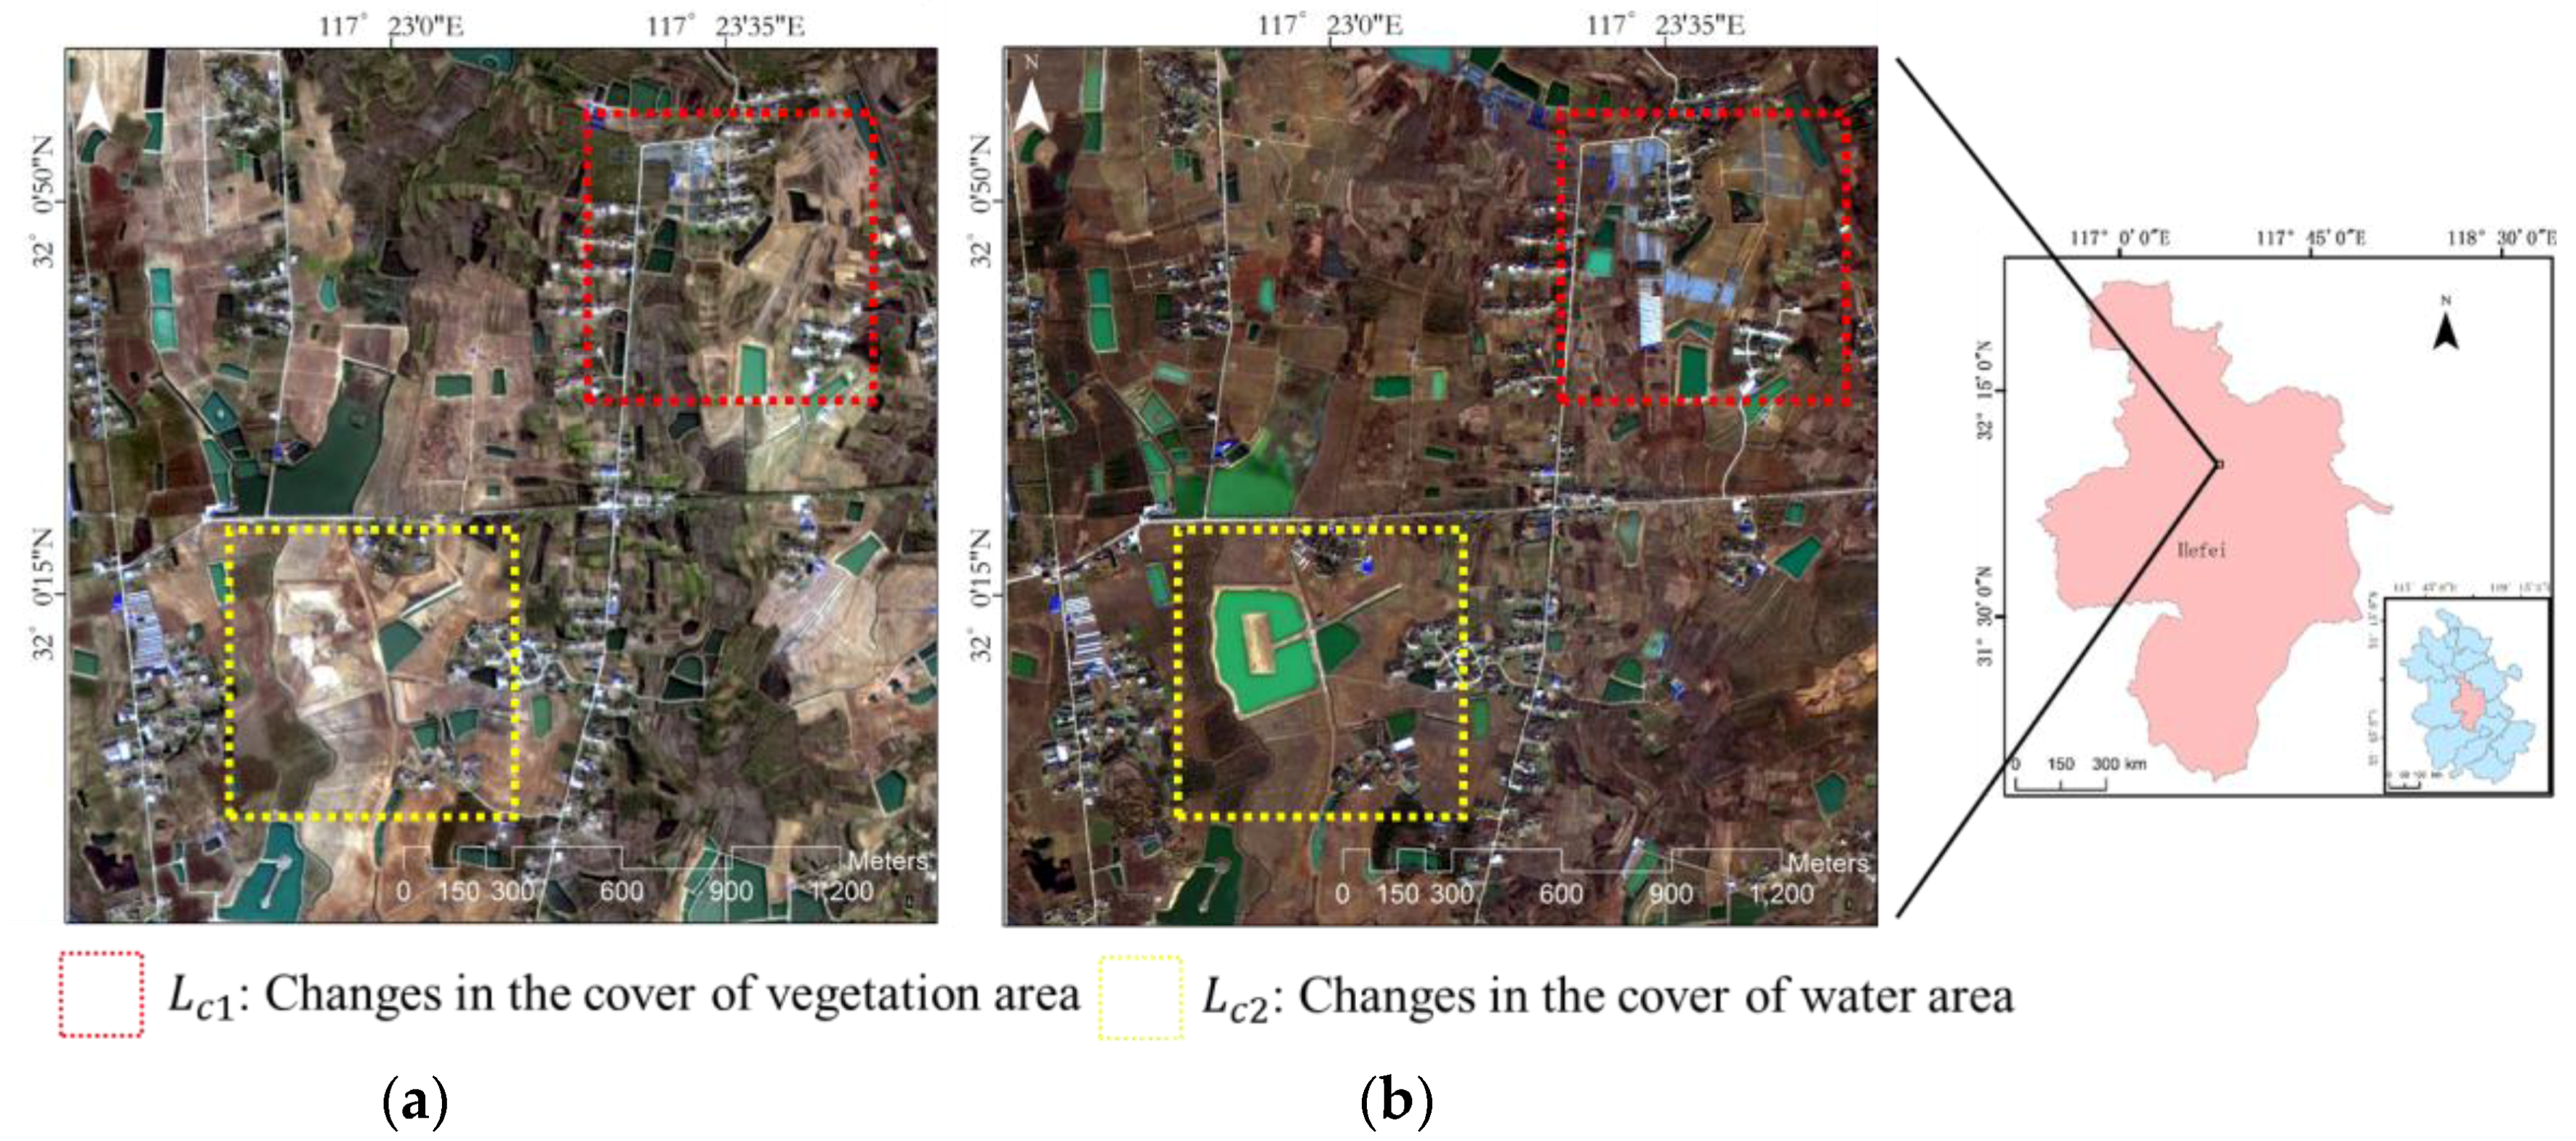
The second case was acquired on 14 April 2015 and 26 January 2016 by GF-1. GF-1 enables the acquisition of PAN images at a resolution of two meters and MS images with a spatial resolution of eight meters from space. It was launched on 26 April 2013. Table 2 presents the specifications of the data. The multi-temporal datasets in the scene were acquired with an eight month gap, as shown in Figure 3.
Preprocessing, including geometric and atmospheric correction, was performed to efficiently analyse the multi-temporal images from different sensors. To match the spatial resolution and to remove the misregistration error term, a geometric correction was applied using manual ground control points (GCPs). The root mean square error (RMSE) of the manual registration is approximately 0.517 and 0.65, respectively, for the two datasets. The multi-temporal images were converted to radiance brightness values, and each image was converted to reflectance. The data acquisition date and sun elevation were obtained from the header files. Next, the obtained value of radiance was subsequently converted to top of atmosphere (TOA) reflectance values for the bands. Finally, the fast line-of-sight atmospheric analysis of spectral hypercubes (FLAASH) model was employed for atmospheric correction.
In Figure 2 and Figure 3, these images are corrected by true colour synthesis, and two kinds of change areas between the multi-temporal satellite images are shown: (1) seasonal, morphological, or man-made factor changes to vegetated crop fields and bare land, labelled as ; and (2) changes in water area or the water bank geometry related to a rise in water level or land surface subsidence, labelled as . The reference data of the study area were defined after detailed field investigation, and thus the visual analysis involved some prior knowledge. The identification of two kinds of change is useful for evaluating and analysing land cover change for our proposed method. Distinguishing these two kinds of change was important to this study, and our proposed method was able to extract change information and identify the two kinds of change.
3.2. Procedures and Results
There are two pairs of high-resolution satellite images. The first case is a change detection problem having large changes in the IKONOS-2 and WorldView-3 images of the coal-mining subsidence region. The second case represents a change detection problem in the GF-1 images of farmland.
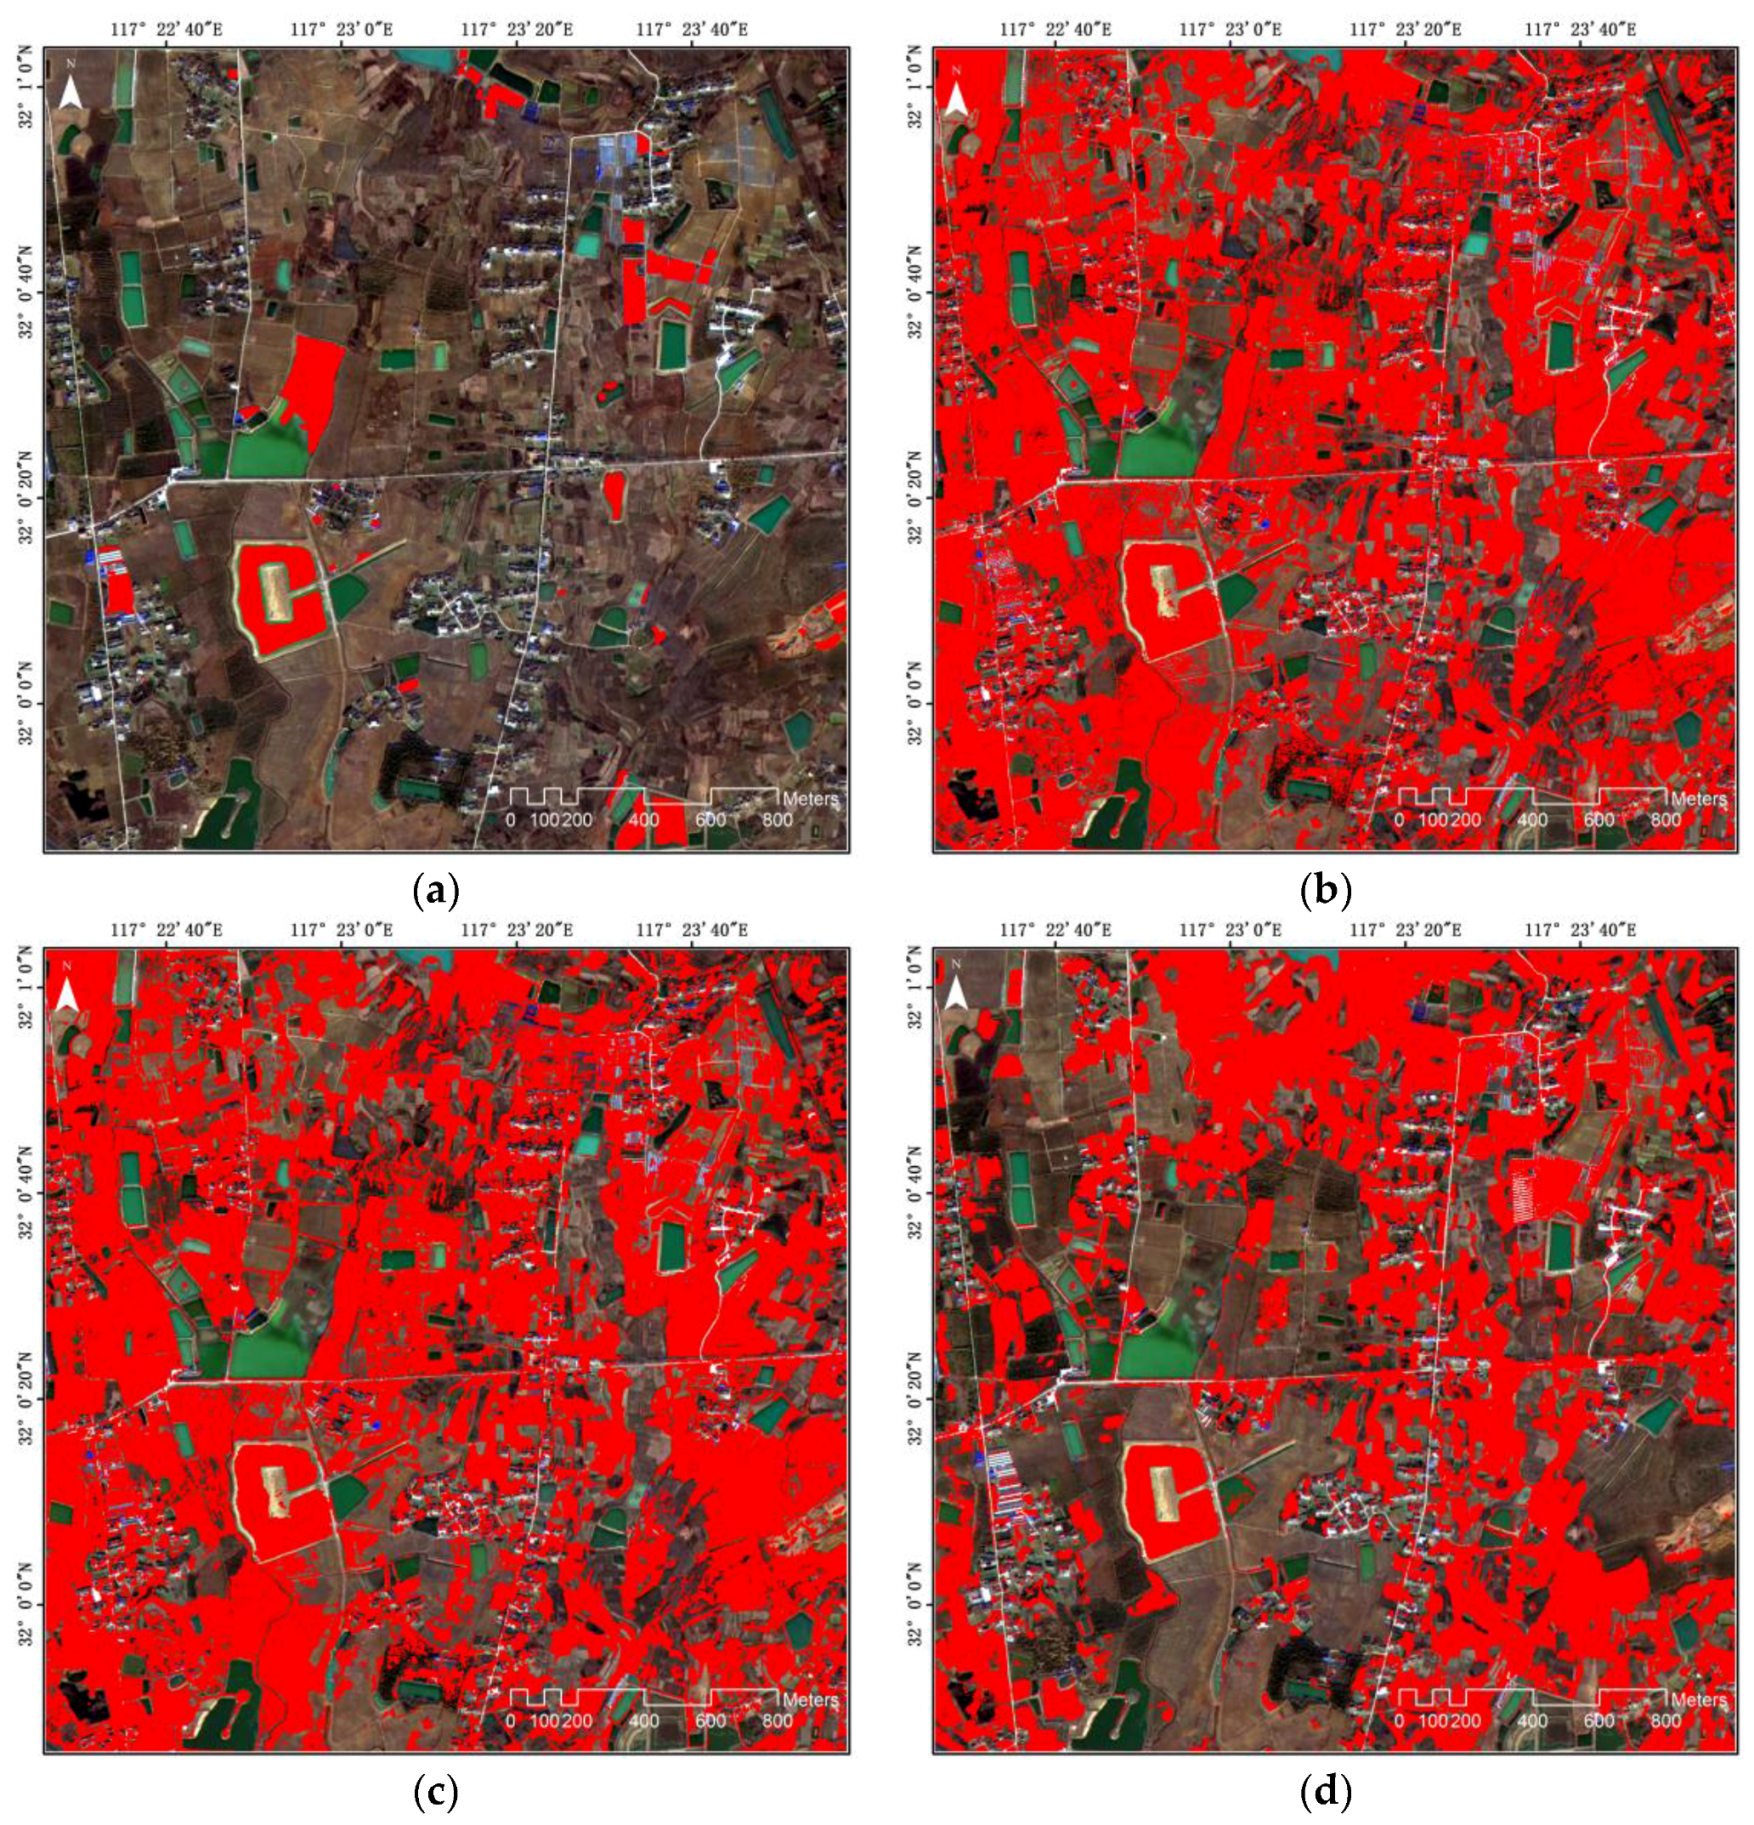
In order to evaluate and analyse the results quantitatively, a ground truth image was generated from the GSA-fused image ( and ) by manually digitizing the changed area, as shown in Figure 4a and Figure 5a. Compared with the ground truth image, the result of the changed area extraction can be obtained by change detection accuracies by our proposed method, and the other methods as shown in Figure 4 and Figure 5. A visual assessment of the change detection method results is included for the whole study area. In Figure 4 and Figure 5, the red colour represents the extracted changed pixels from the change detection results using the different methods. The results are superimposed over the multispectral image collected from the target images. Details for each case are described below. The detailed quantitative change detection accuracy assessment results are shown in Table 3 and Table 4.
The change detection result of the two study areas are displayed in Figure 4 and Figure 5. Our method efficiently detected the changed areas that correspond to the complex landscape and line features. To analyse the effectiveness of our method based on the detection and false alarm rates, the change detection accuracy results are shown in Table 3 and Table 4. The original IR-MAD change detection method has a better result for CE, but the results using the proposed method exhibit higher accuracy than the other unsupervised results obtained from the other methods. The original IR-MAD method obtained fine results, but it was difficult to extract some non-sensitive features (e.g., areas blending vegetation and bare land or vegetation and water bodies), because these targets have similar spectral characteristics and influence each other. However, our proposed method can be effectively used to improve the change information extraction by cross-fused images, which are generated through the high-resolution NIR band and low-resolution MS bands. In this way, a new image with non-sensitive enhanced objects can be reconstructed.
3.3. Analysis and Discussion of the Results
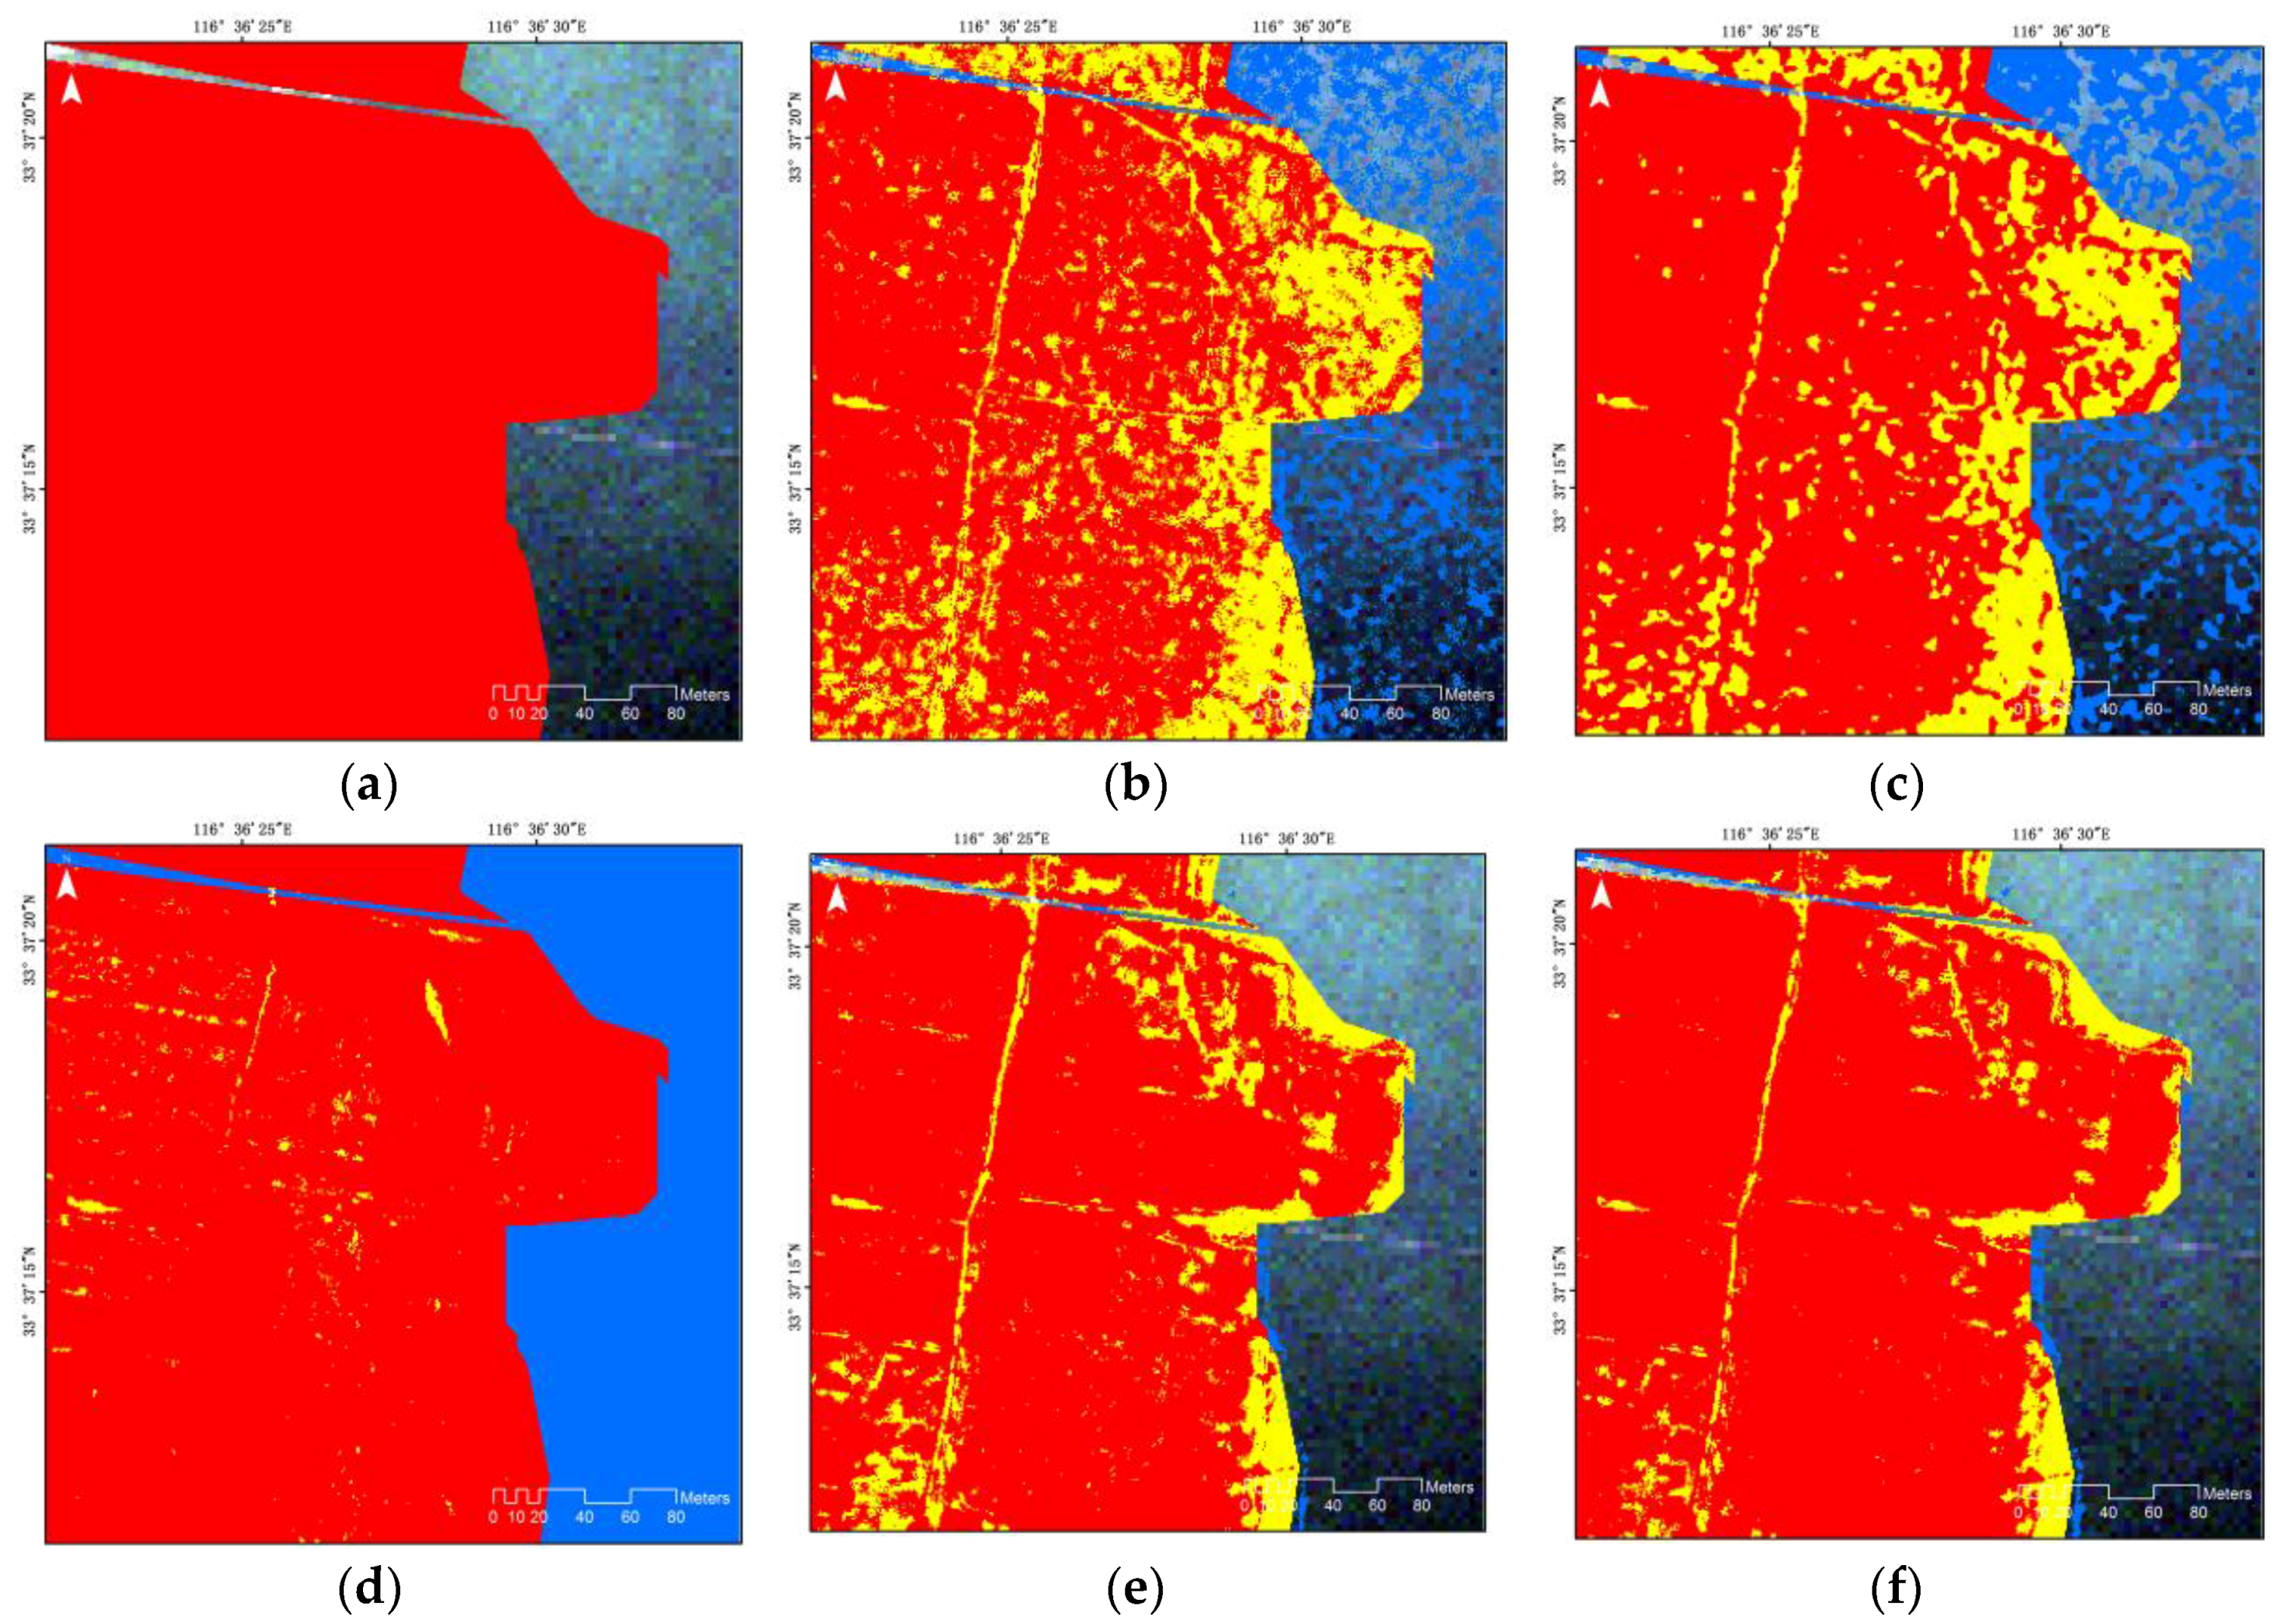
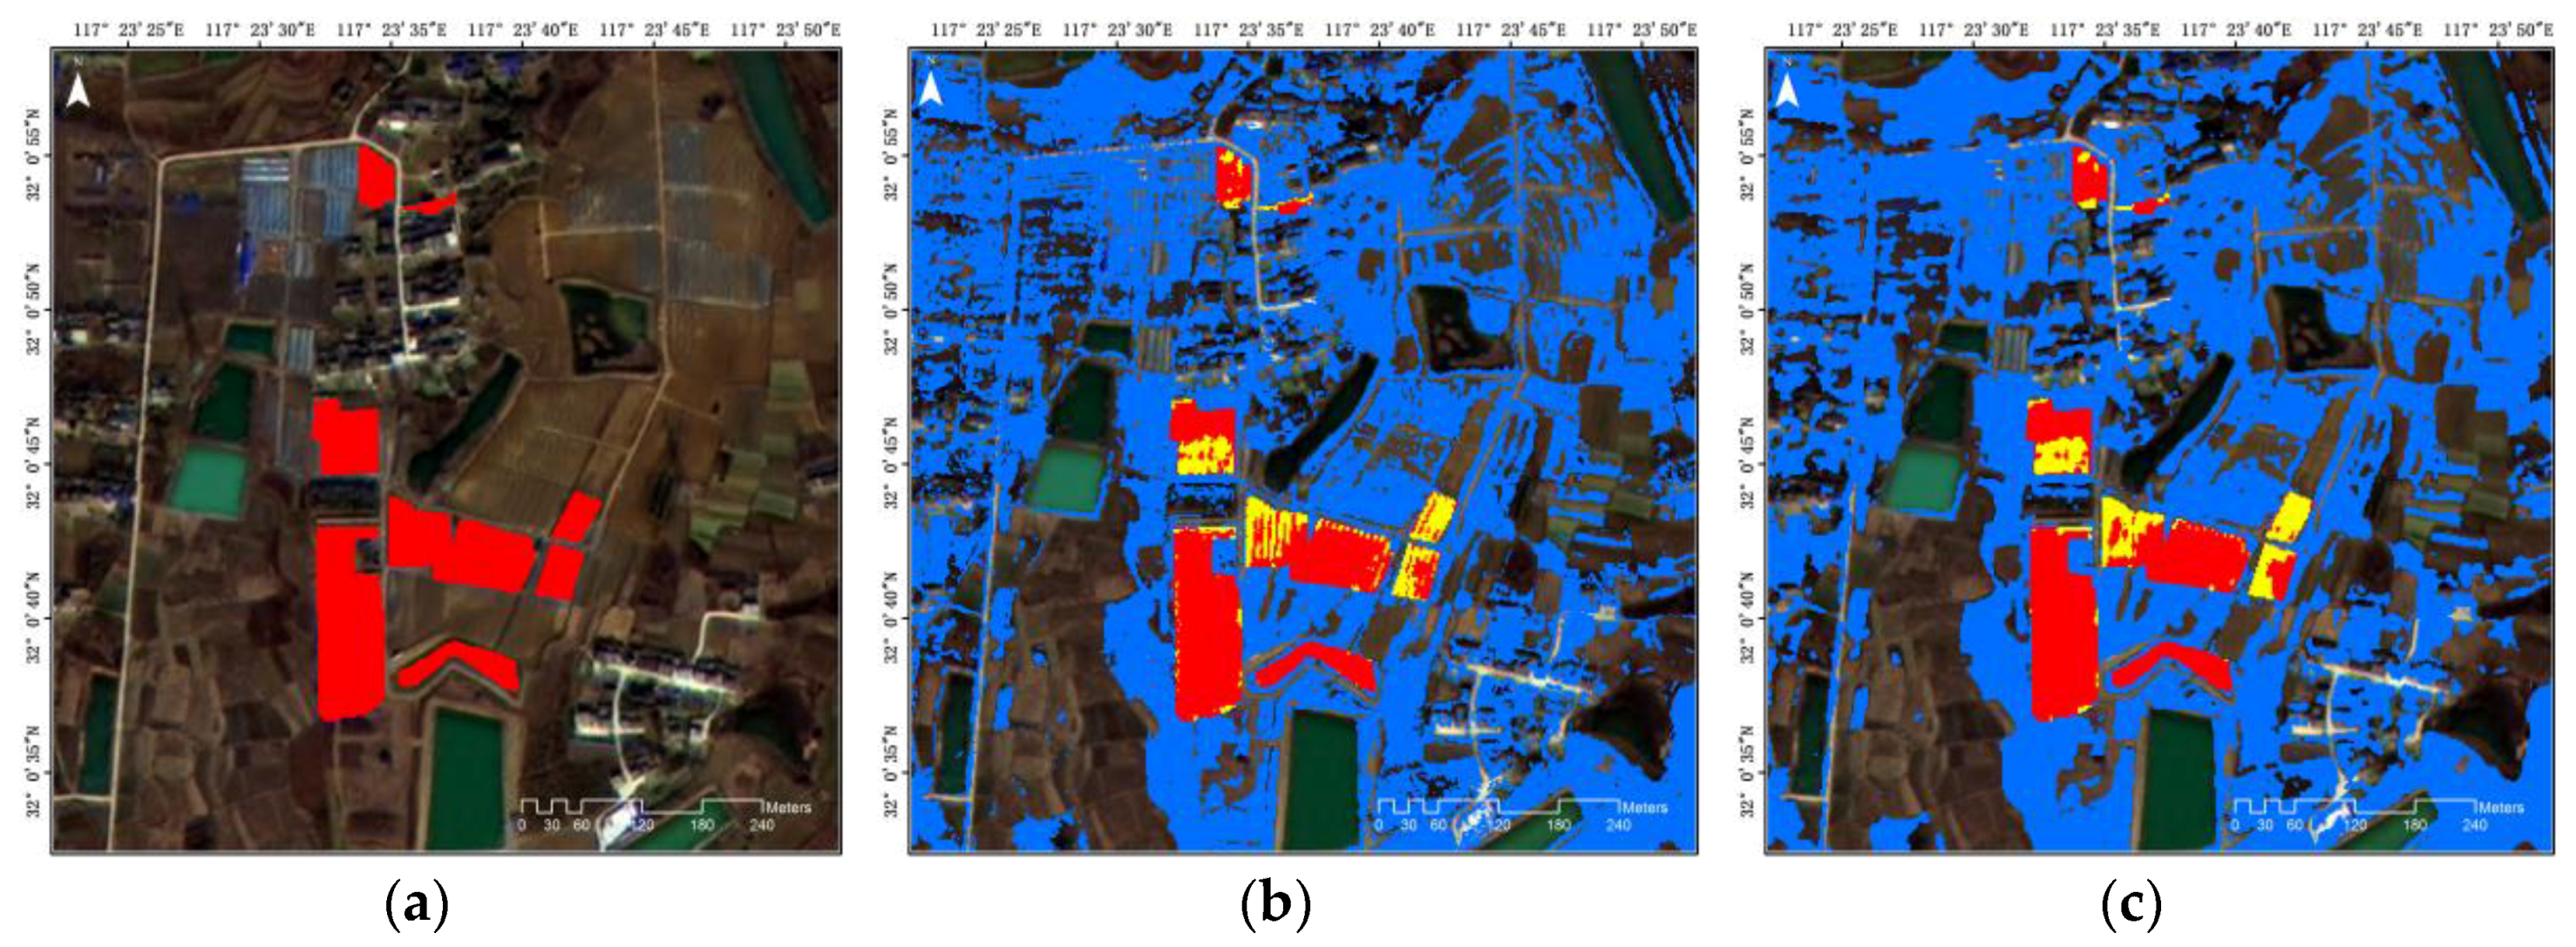
Compared with typical unsupervised change detection algorithms, the results of the cross-fused images effectively improved the accuracy of change detection, as shown in Table 3 and Table 4. In the results from the original multi-temporal fused image, some parts of the unchanged area are considered to be changed areas. Table 3 and Table 4 present the quantitative estimation results for each change detection method using a confusion matrix that is based on the ground truth data. The results from the proposed method in this study exhibit higher accuracy than the unsupervised change detection results obtained from the other methods. Figure 6, Figure 7, Figure 8 and Figure 9 show the detailed images extracted from different kinds of changes by each method. The red colour represents the extracted changed pixels from the change detection results, and the blue and yellow colours represent the commission and omission errors, respectively.
Figure 6 and Table 5 show that there are similar change detection results for cultivated areas, because they have great spectrometric differences caused by the differences in the sensors and seasons. However, our proposed method obtains a stable result.
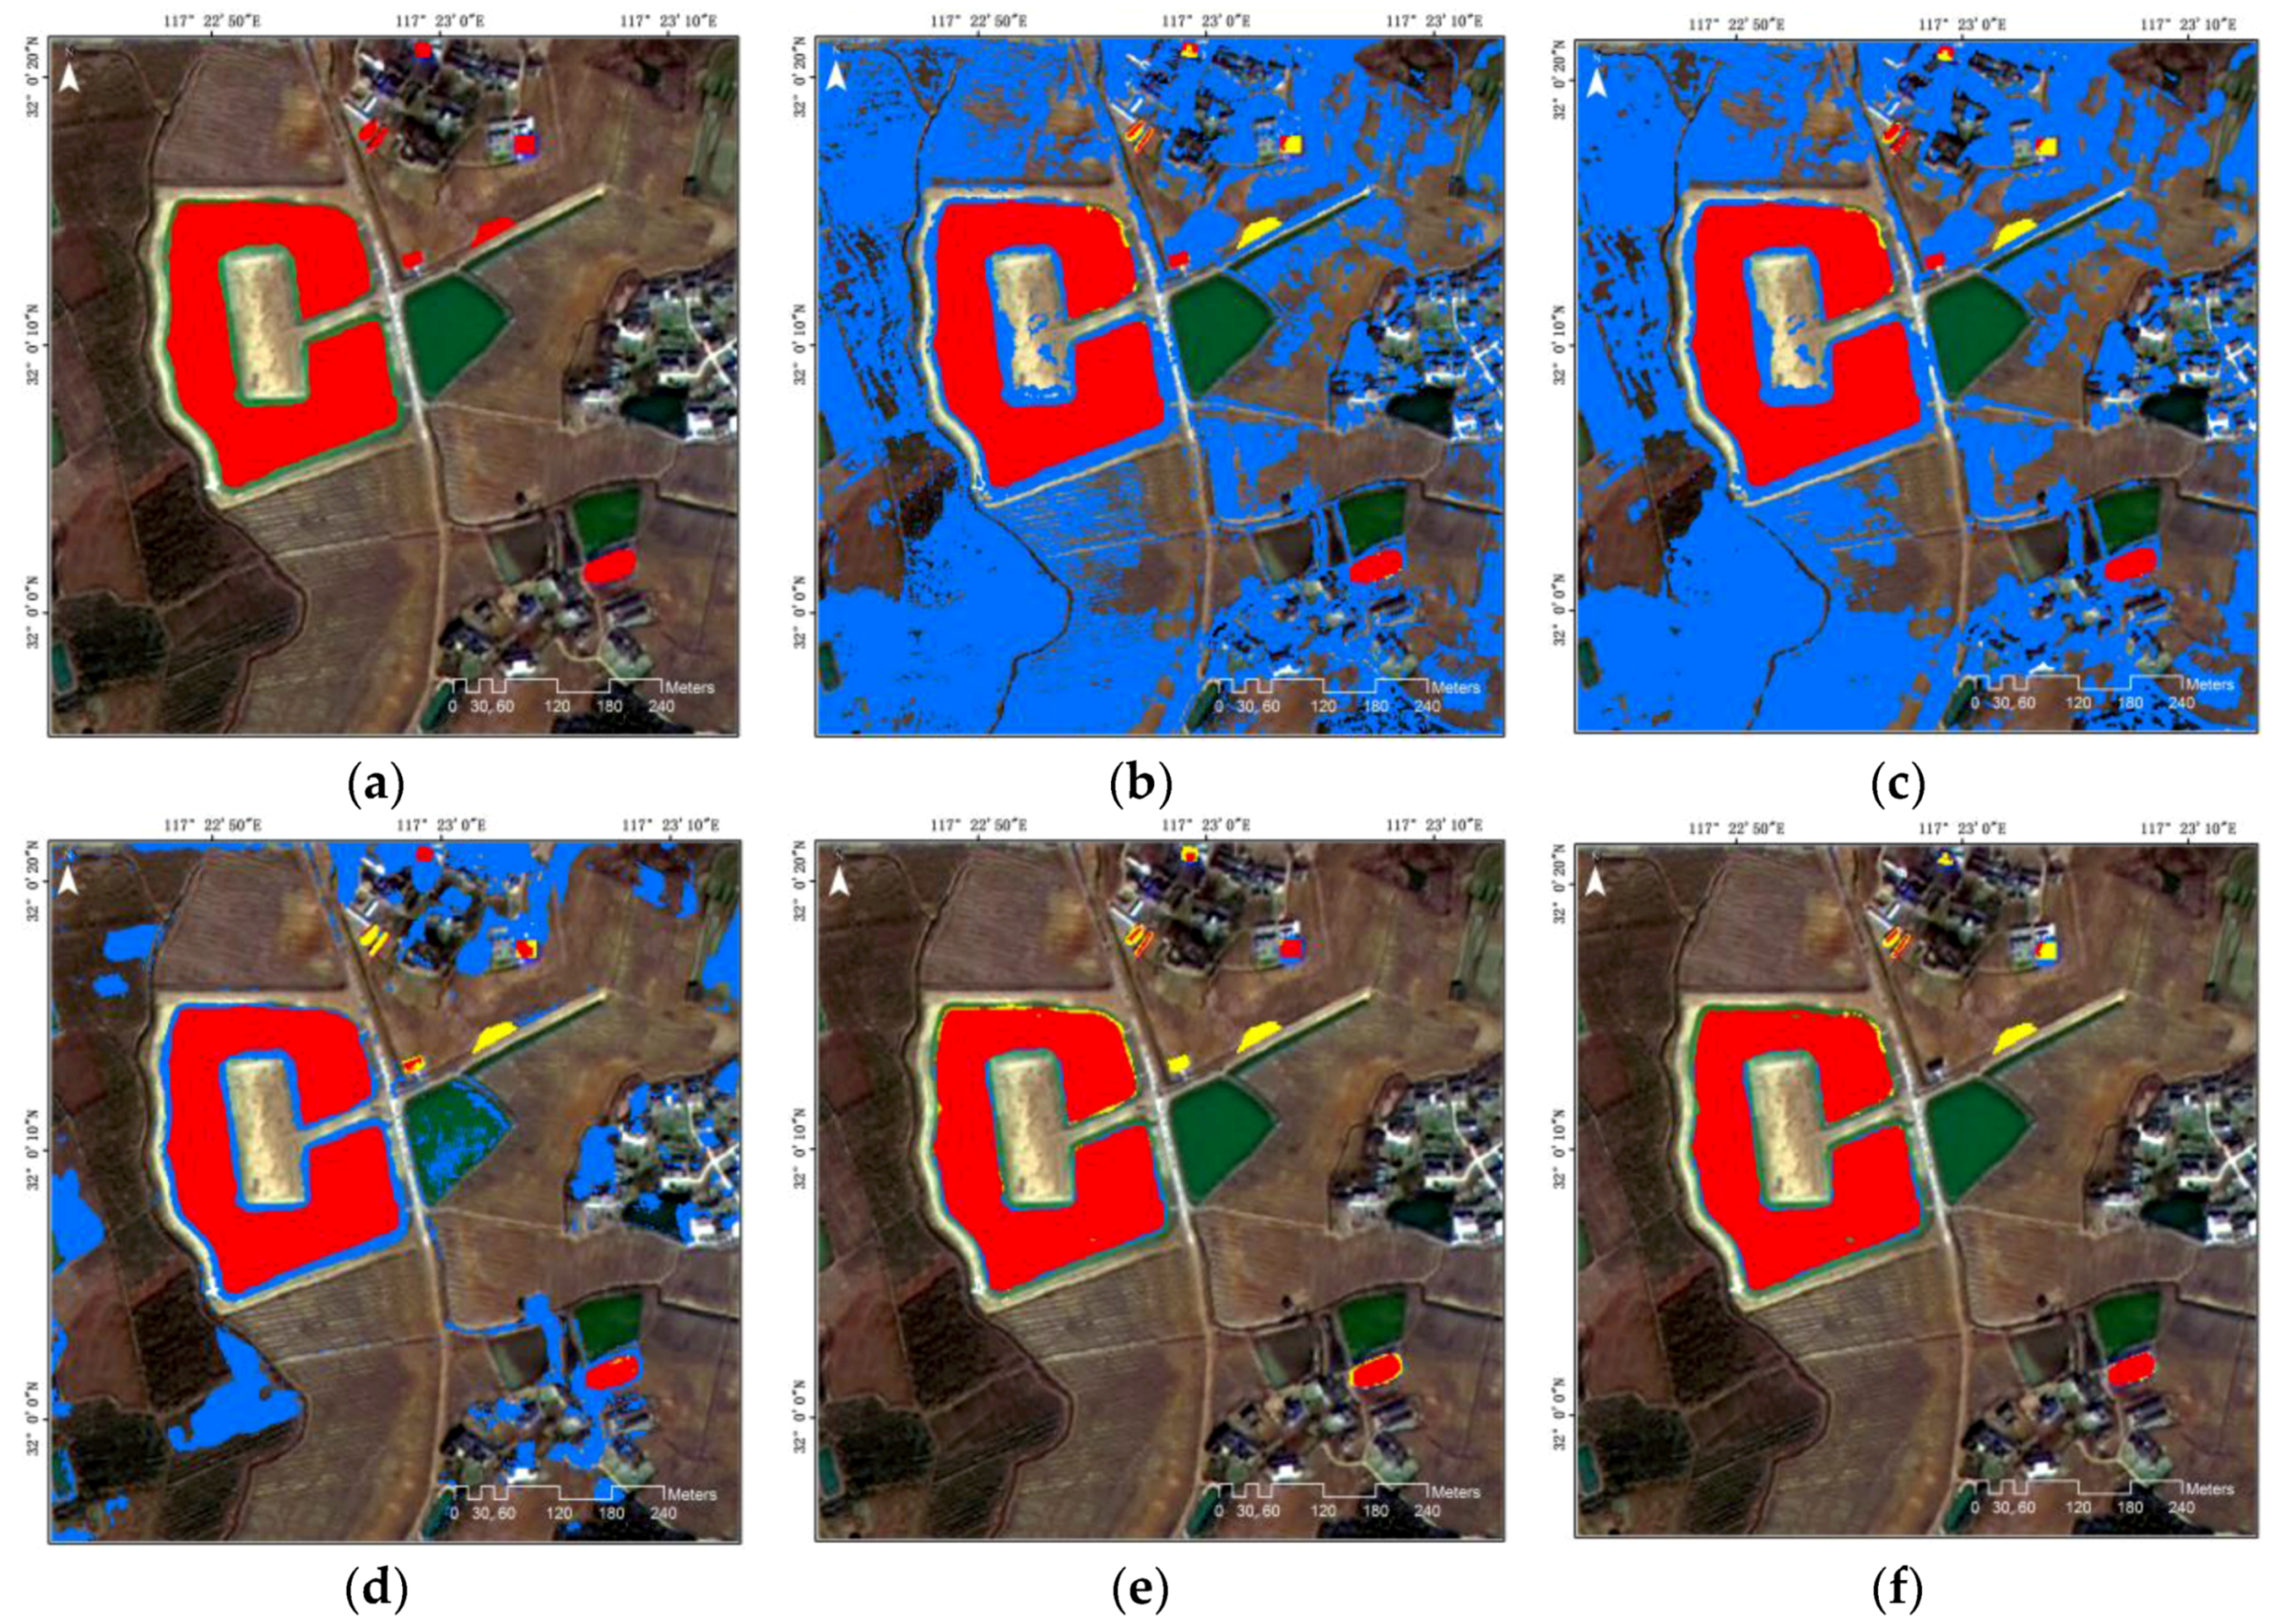
Figure 7 shows an example of a large-scale subsidence region as a changed area, from vegetation or bare areas to a water area. In this kind of change area, our method obtained the highest OA (92.68%) and KC (0.83) compared with the other methods, as shown in Table 5. The typical unsupervised change detection algorithms detect too many unchanged areas and overestimate the changed area caused by similar spectral characteristics.
For the kind of as shown in Figure 8, compared with the original IR-MAD algorithm, our proposed method has higher OA and a similar KC, as shown in Table 6. Because the cross-fused image was generated by the NIR band image and MS image, it is sensitive to vegetation targets. However, the proposed method is different and can detect man-made objects.
As shown in Figure 9, the proposed method can be effective in extracting the changed area and keeping the whole changed target. Compared with the other methods, the proposed method was able to reduce the error detection due to a seasonal difference. However, a part of the changed area was defined as unchanged area, and it is difficult to accurately separate the mud area.
Figure 6, Figure 7, Figure 8 and Figure 9 show detailed images of the unsupervised change detection results obtained using the proposed method and the other methods. As a whole, the proposed method using cross-fused images effectively reduced the error of change detection compared with the other methods using the general fused images. In the results from the general fused images, certain parts of the unchanged area were considered to comprise the changed area. The results of the CVA- and ERGAS-based methods were similar. Some parts of the same object were considered as different objects, such as a part of the water and vegetation areas, because the dataset was acquired for different years and seasons. Using the ground truth image, the results of the SAM method indicate that the extracted water area was over-estimated compared to the proposed method, and the unchanged water body was even incorrectly classified as the changed area.
Although the proposed method has a satisfactory result for the changed area extraction, it produces false positives in some regions, especially for man-made targets such as buildings and roads. This is because the atmospheric effects caused extra spectral distortion after atmospheric correction, and the different angles in the multi-temporal high-resolution images caused spatial inconsistency. In addition, the image fusion method aggravated the spectral distortion.
These experiments confirm that the proposed method can identify different kinds of change, and is more effective than the existing methods for land cover change detection. Although noise still exists, leading to some error detection, the proposed method efficiently detects the changed area that corresponds to complex areas and similar spectral characteristics. In addition, the threshold method is important in obtaining the result of change detection by empirical strategies or statistical methods. In this study, we focus on the change information extraction, although the threshold method affects the change detection result (such as noise pixel or target boundary). The Otsu method was applied because of its representative automatic thresholding, effective performance, and easy application. Therefore, we can conclude that our method improves change detection accuracy while minimizing the effect of blended areas, such as vegetation and bare land or vegetation and water bodies for land cover change detection.
4. Conclusions
In this study, we proposed a combination of image fusion and spectral distortion measures as an unsupervised change detection methodology for land cover change detection. From the multi-temporal IKONOS-2, WorldView-3 images, and GF-1, the proposed method based on cross-fused images and MAD variates was applied to increase the accuracy of change detection and minimize the error detection. Four pairs of cross-fused images were generated by the GSA fusion method. The optimal change information was calculated through the combination of MAD variates, which was used for the pairs of fused images. The experimental results could produce a good result for the changed area compared with the traditional CVA-, ERGAS-, SAM-, and original IR-MAD based change detection methods. The OAs of the proposed method were 80.51% and 97.87% for the two case studies, which is better than the original IR-MAD-based unsupervised change detection method, and the proposed method achieved a higher KC than the conventional methods. Meanwhile, the proposed method was able to extract a better identification of the merging area of water and vegetation based on the cross-fused image and provided a good performance for the different targets with similar spectral information. It allows us to assess the changed region and make decisions for government solutions accordingly.
Two experiments carried out on IKONOS-2, WorldView-3, and GF-1 high-resolution MS images confirmed the effectiveness of our proposed method for land cover change detection. Both qualitative and quantitative results indicate that our proposed method has better capabilities than the original IR-MAD. This also confirms the suitability of the Otsu algorithm used in our approach. The proposed method was able to retrieve the main information related to change and to distinguish different kinds of change present in our datasets. In particular, our proposed method could identify seasonal and structural changes in vegetation and water areas and separate pseudo-changes and artefacts caused by the shooting angle of the sensor from real changes. However, there were some false or missing detections caused by noise in the pixel-based change detection using cross-fused images and the modified IR-MAD method.
This study focuses on water and vegetation-related areas in the land cover change area which are sensitive to the NIR band. As such, the proposed method is based on the NIR band of the cross-fused image for the land cover change detection, and the proposed method has a strong advantage for the separation of bare areas and original water and vegetation areas, though there is some detection error in the regions that are not in these categories. Obviously, the proposed method improved the accuracy of change detection over the other methods when the region was constructed mainly of water and vegetation areas.
In order to improve the accuracy of land cover change detection, we will focus on making a more accurate framework to increase true positives and suppress false positives. The proposed framework also needs further experimental validation in different sites to confirm the robustness, because the results were affected by man-made targets or noise. In addition, the different image fusion algorithms will be investigated to analyse the effect of the change detection results.
Acknowledgments
This research was supported by the Anhui Key Laboratory of Smart City and Geographical Condition Monitoring (2016KJQ010007), the Natural Science Foundation of Anhui Province under grant (1608085MD83), the Anhui University Doctoral Scientific Research Foundation of Biao Wang and Penghai Wu.
Author Contributions
Biao Wang, Jaewan Choi, Seokeun Choi, and Soungki Lee conceived and designed the study. Penghai Wu analysed and performed the image fusion method. Yan Gao completed the visual validation and interpretation of the results. All authors provided feedback and text to significantly improve the quality of the manuscript.
Conflicts of Interest
The authors declare no conflict of interest.
References
- Aleksandrowicz, S.; Turlej, K.; Lewiński, S.; Bochenek, Z. Change detection algorithm for the production of land cover change maps over the european union countries. Remote Sens. 2014, 6, 5976–5994. [Google Scholar] [CrossRef]
- Zhu, Z.; Woodcock, C.E.; Olofsson, P. Continuous monitoring of forest disturbance using all available landsat imagery. Remote Sens. Environ. 2012, 122, 75–91. [Google Scholar] [CrossRef]
- Burns, P.; Nolin, A. Using atmospherically-corrected landsat imagery to measure glacier area change in the cordillera blanca, peru from 1987 to 2010. Remote Sens. Environ. 2014, 140, 165–178. [Google Scholar] [CrossRef]
- Song, X.-P.; Sexton, J.O.; Huang, C.; Channan, S.; Townshend, J.R. Characterizing the magnitude, timing and duration of urban growth from time series of landsat-based estimates of impervious cover. Remote Sens. Environ. 2016, 175, 1–13. [Google Scholar] [CrossRef]
- Schroeder, T.A.; Wulder, M.A.; Healey, S.P.; Moisen, G.G. Mapping wildfire and clearcut harvest disturbances in boreal forests with landsat time series data. Remote Sens. Environ. 2011, 115, 1421–1433. [Google Scholar] [CrossRef]
- Jin, S.; Yang, L.; Zhu, Z.; Homer, C. A land cover change detection and classification protocol for updating alaska nlcd 2001 to 2011. Remote Sens. Environ. 2017, 195, 44–55. [Google Scholar] [CrossRef]
- Unlu, T.; Akcin, H.; Yilmaz, O. An integrated approach for the prediction of subsidence for coal mining basins. Eng. Geol. 2013, 166, 186–203. [Google Scholar] [CrossRef]
- Yenilmez, F.; Kuter, N.; Emil, M.K.; Aksoy, A. Evaluation of pollution levels at an abandoned coal mine site in turkey with the aid of gis. Int. J. Coal Geol. 2011, 86, 12–19. [Google Scholar] [CrossRef]
- Schroeter, L.; Gläβer, C. Analyses and monitoring of lignite mining lakes in eastern germany with spectral signatures of landsat tm satellite data. Int. J. Coal Geol. 2011, 86, 27–39. [Google Scholar] [CrossRef]
- Scharsich, V.; Mtata, K.; Hauhs, M.; Lange, H.; Bogner, C. Analysing land cover and land use change in the matobo national park and surroundings in zimbabwe. Remote Sens. Environ. 2017, 194, 278–286. [Google Scholar] [CrossRef]
- Chen, B.; Huang, B.; Xu, B. Multi-source remotely sensed data fusion for improving land cover classification. ISPRS J. Photogramm. Remote Sens. 2017, 124, 27–39. [Google Scholar] [CrossRef]
- Jiang, L.; Lin, H.; Ma, J.; Kong, B.; Wang, Y. Potential of small-baseline sar interferometry for monitoring land subsidence related to underground coal fires: Wuda (Northern China) case study. Remote Sens. Environ. 2011, 115, 257–268. [Google Scholar] [CrossRef]
- Raucoules, D.; Cartannaz, C.; Mathieu, F.; Midot, D. Combined use of space-borne sar interferometric techniques and ground-based measurements on a 0.3 km2 subsidence phenomenon. Remote Sens. Environ. 2013, 139, 331–339. [Google Scholar] [CrossRef]
- Jiang, M.; Yong, B.; Tian, X.; Malhotra, R.; Hu, R.; Li, Z.; Yu, Z.; Zhang, X. The potential of more accurate insar covariance matrix estimation for land cover mapping. ISPRS J. Photogramm. Remote Sens. 2017, 126, 120–128. [Google Scholar] [CrossRef]
- Renza, D.; Martinez, E.; Arquero, A. A new approach to change detection in multispectral images by means of ergas index. IEEE Geosci. Remote Sens. Lett. 2013, 10, 76–80. [Google Scholar] [CrossRef] [Green Version]
- Byun, Y.; Han, Y.; Chae, T. Image fusion-based change detection for flood extent extraction using bi-temporal very high-resolution satellite images. Remote Sens. 2015, 7, 10347–10363. [Google Scholar] [CrossRef]
- Nielsen, A.A.; Conradsen, K.; Simpson, J.J. Multivariate alteration detection (mad) and maf postprocessing in multispectral, bitemporal image data: New approaches to change detection studies. Remote Sens. Environ. 1998, 64, 1–19. [Google Scholar] [CrossRef]
- Chen, Q.; Chen, Y. Multi-feature object-based change detection using self-adaptive weight change vector analysis. Remote Sens. 2016, 8, 549. [Google Scholar] [CrossRef]
- Wang, B.; Choi, S.-K.; Han, Y.-K.; Lee, S.-K.; Choi, J.-W. Application of ir-mad using synthetically fused images for change detection in hyperspectral data. Remote Sens. Lett. 2015, 6, 578–586. [Google Scholar] [CrossRef]
- Nielsen, A.A. The regularized iteratively reweighted mad method for change detection in multi-and hyperspectral data. IEEE Trans. Image Process. 2007, 16, 463–478. [Google Scholar] [CrossRef] [PubMed]
- Almutairi, A.; Warner, T.A. Change detection accuracy and image properties: A study using simulated data. Remote Sens. 2010, 2, 1508–1529. [Google Scholar] [CrossRef]
- Olofsson, P.; Foody, G.M.; Herold, M.; Stehman, S.V.; Woodcock, C.E.; Wulder, M.A. Good practices for estimating area and assessing accuracy of land change. Remote Sens. Environ. 2014, 148, 42–57. [Google Scholar] [CrossRef]
- Liu, Z.; Blasch, E.; John, V. Statistical comparison of image fusion algorithms: Recommendations. Inf. Fusion 2017, 36, 251–260. [Google Scholar] [CrossRef]
- Chen, C.M.; Hepner, G.F.; Forster, R.R. Fusion of hyperspectral and radar data using the ihs transformation to enhance urban surface features. ISPRS J. Photogramm. Remote Sens. 2003, 58, 19–30. [Google Scholar] [CrossRef]
- El-Mezouar, M.C.; Taleb, N.; Kpalma, K.; Ronsin, J. An ihs-based fusion for color distortion reduction and vegetation enhancement in ikonos imagery. IEEE Trans. Geosci. Remote Sens. 2011, 49, 1590–1602. [Google Scholar] [CrossRef]
- Baronti, S.; Aiazzi, B.; Selva, M.; Garzelli, A.; Alparone, L. A theoretical analysis of the effects of aliasing and misregistration on pansharpened imagery. IEEE J. Sel. Top. Signal Process. 2011, 5, 446–453. [Google Scholar] [CrossRef]
- Laben, C.A.; Brower, B.V. Process for Enhancing the Spatial Resolution of Multispectral Imagery Using Pan-Sharpening. U.S. Patents 6011875 A, 4 January 2000. [Google Scholar]
- Pushparaj, J.; Hegde, A.V. Comparison of various pan-sharpening methods using quickbird-2 and landsat-8 imagery. Arab. J. Geosci. 2017, 10, 1–17. [Google Scholar] [CrossRef]
- Dou, W.; Chen, Y.; Li, X.; Sui, D.Z. A general framework for component substitution image fusion: An implementation using the fast image fusion method. Comput. Geosci. 2007, 33, 219–228. [Google Scholar] [CrossRef]
- Aiazzi, B.; Baronti, S.; Selva, M. Improving component substitution pansharpening through multivariate regression of ms +pan data. IEEE Trans. Geosci. Remote Sens. 2007, 45, 3230–3239. [Google Scholar] [CrossRef]
- Lu, M.; Chen, J.; Tang, H.; Rao, Y.; Yang, P.; Wu, W. Land cover change detection by integrating object-based data blending model of landsat and modis. Remote Sens. Environ. 2016, 184, 374–386. [Google Scholar] [CrossRef]
- Ding, C.; Liu, X.; Huang, F.; Li, Y.; Zou, X. Onset of drying and dormancy in relation to water dynamics of semi-arid grasslands from modis ndwi. Agric. For. Meteorol. 2017, 234–235, 22–30. [Google Scholar] [CrossRef]
- Deng, C.; Wu, C. Bci: A biophysical composition index for remote sensing of urban environments. Remote Sens. Environ. 2012, 127, 247–259. [Google Scholar] [CrossRef]
- Thomas, C.; Ranchin, T.; Wald, L.; Chanussot, J. Synthesis of multispectral images to high spatial resolution: A critical review of fusion methods based on remote sensing physics. IEEE Trans. Geosci. Remote Sens. 2008, 46, 1301–1312. [Google Scholar] [CrossRef] [Green Version]
- Marpu, P.R.; Gamba, P.; Canty, M.J. Improving change detection results of ir-mad by eliminating strong changes. IEEE Geosci. Remote Sens. Lett. 2011, 8, 799–803. [Google Scholar] [CrossRef]
- Level Otsu, N. A threshold selection method from gray-level histogram. IEEE Trans. Syst. Man Cybern. 1979, 9, 62–66. [Google Scholar] [CrossRef]
- Wang, B.; Choi, S.; Byun, Y.; Lee, S.; Choi, J. Object-based change detection of very high resolution satellite imagery using the cross-sharpening of multitemporal data. IEEE Geosci. Remote Sens. Lett. 2015, 12, 1151–1155. [Google Scholar] [CrossRef]
Figure 1.
Workflow of the proposed methodology for land cover change area extraction by using multi-temporal high resolution satellite images. IR-MAD: iteratively reweighted multivariate alteration detection; MS: multispectral; NIR: near-infrared; PAN: panchromatic.
Figure 1.
Workflow of the proposed methodology for land cover change area extraction by using multi-temporal high resolution satellite images. IR-MAD: iteratively reweighted multivariate alteration detection; MS: multispectral; NIR: near-infrared; PAN: panchromatic.

Figure 2.
Multi-temporal images of Linhuan diggings used in the first experiment: (a) the multispectral image from IKONOS-2 satellite collected as reference image; and (b) the multispectral image from WorldView-3 satellite collected as target image.
Figure 2.
Multi-temporal images of Linhuan diggings used in the first experiment: (a) the multispectral image from IKONOS-2 satellite collected as reference image; and (b) the multispectral image from WorldView-3 satellite collected as target image.
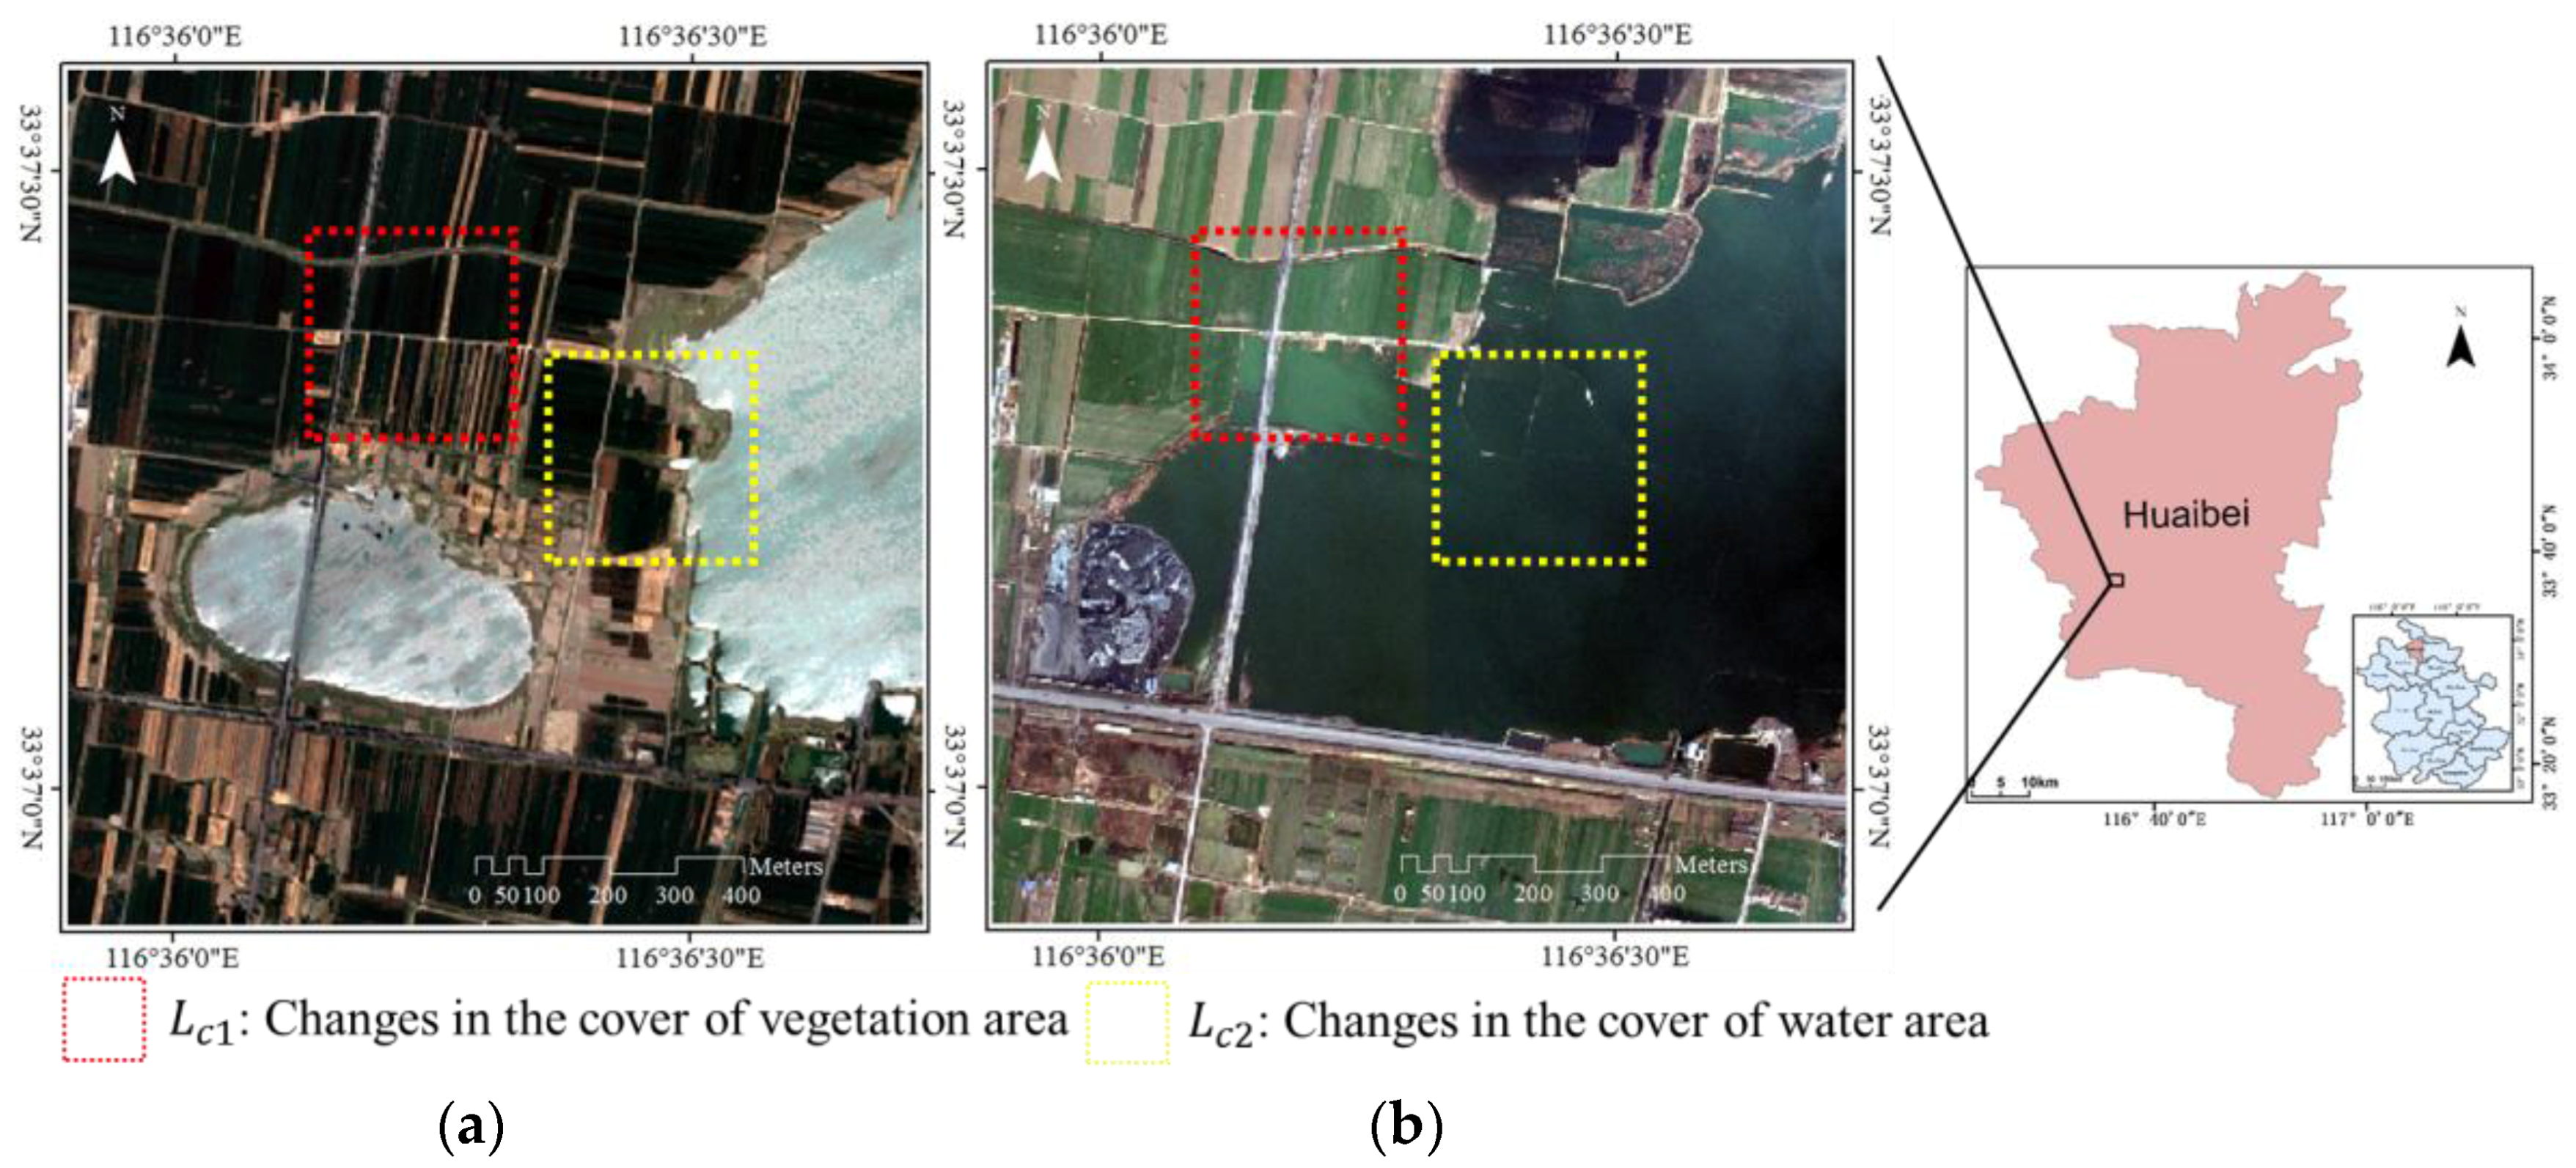
Figure 3.
Multi-temporal images of Feidong used in the second experiment from GF-1 satellite: (a) reference image; and (b) target image.
Figure 3.
Multi-temporal images of Feidong used in the second experiment from GF-1 satellite: (a) reference image; and (b) target image.

Figure 4.
Unsupervised change detection results of first case by using the tested methods: (a) ground truth image; (b) result of the change vector analysis (CVA) method; (c) result of the Erreur Relative Globale Adimensionnelle de Synthese (ERGAS) method; (d) result of the spectral angle mapping (SAM) method; (e) result of the original IR-MAD method; (f) result of the proposed method.
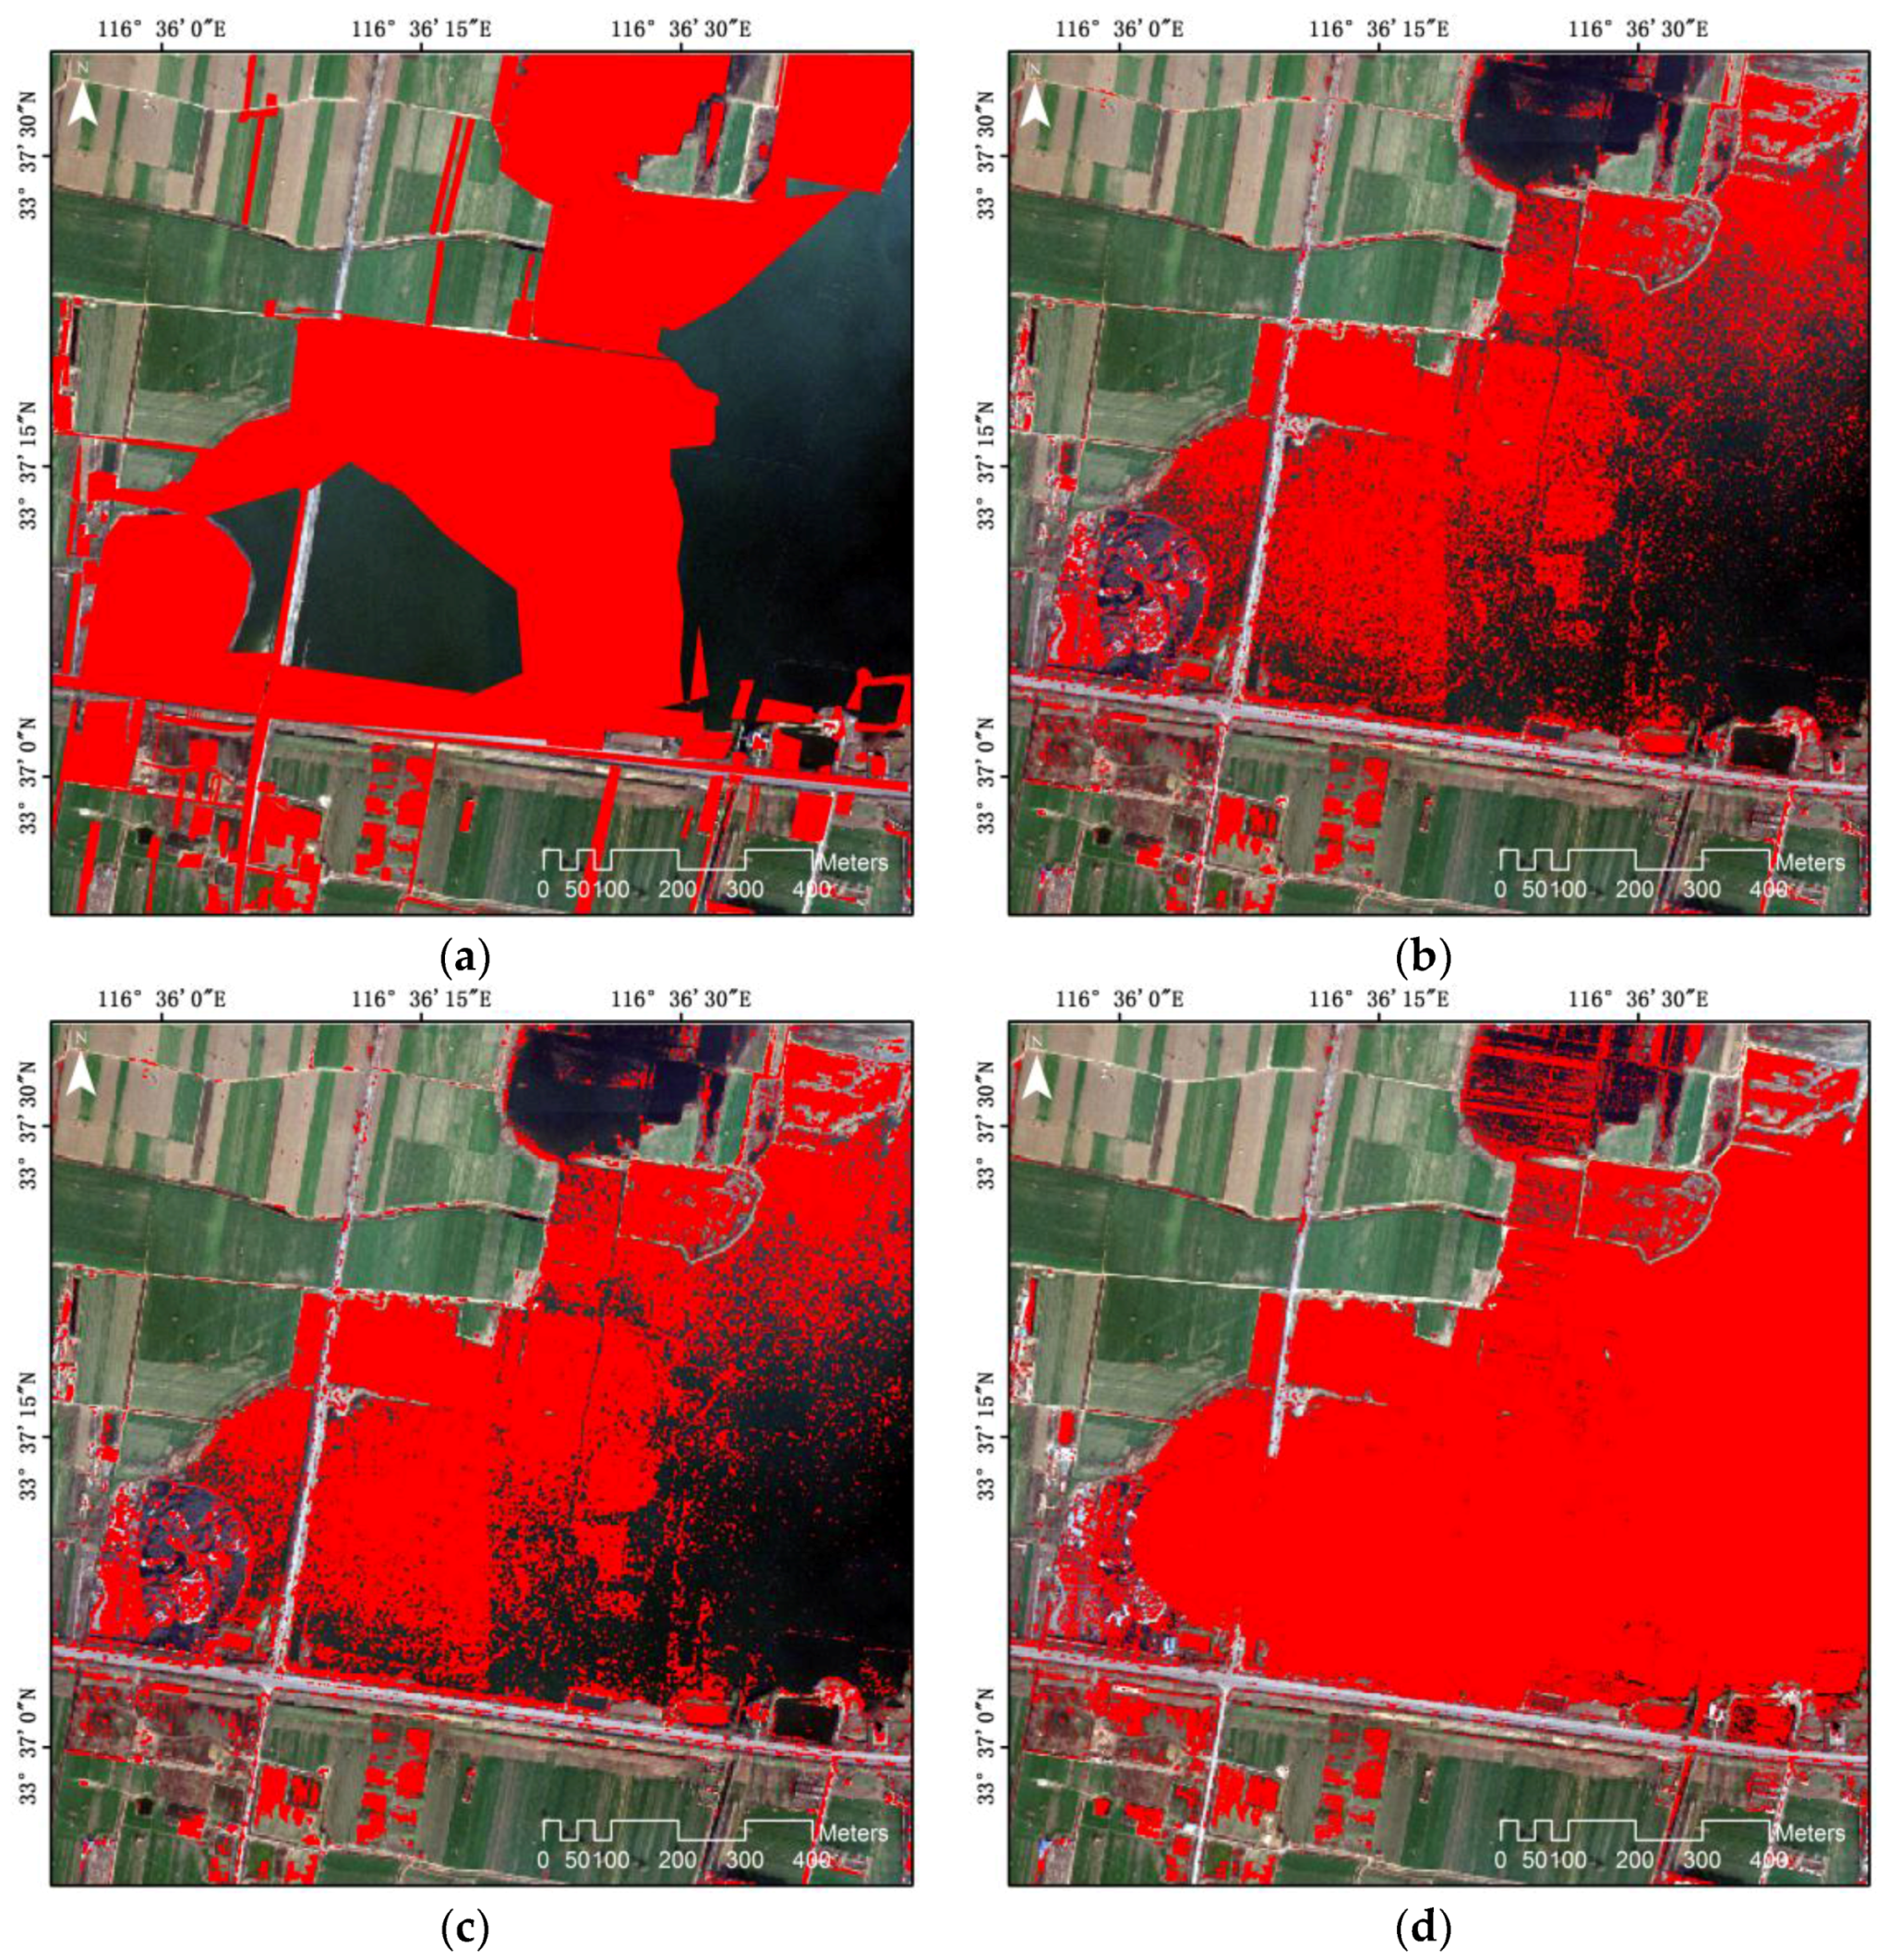
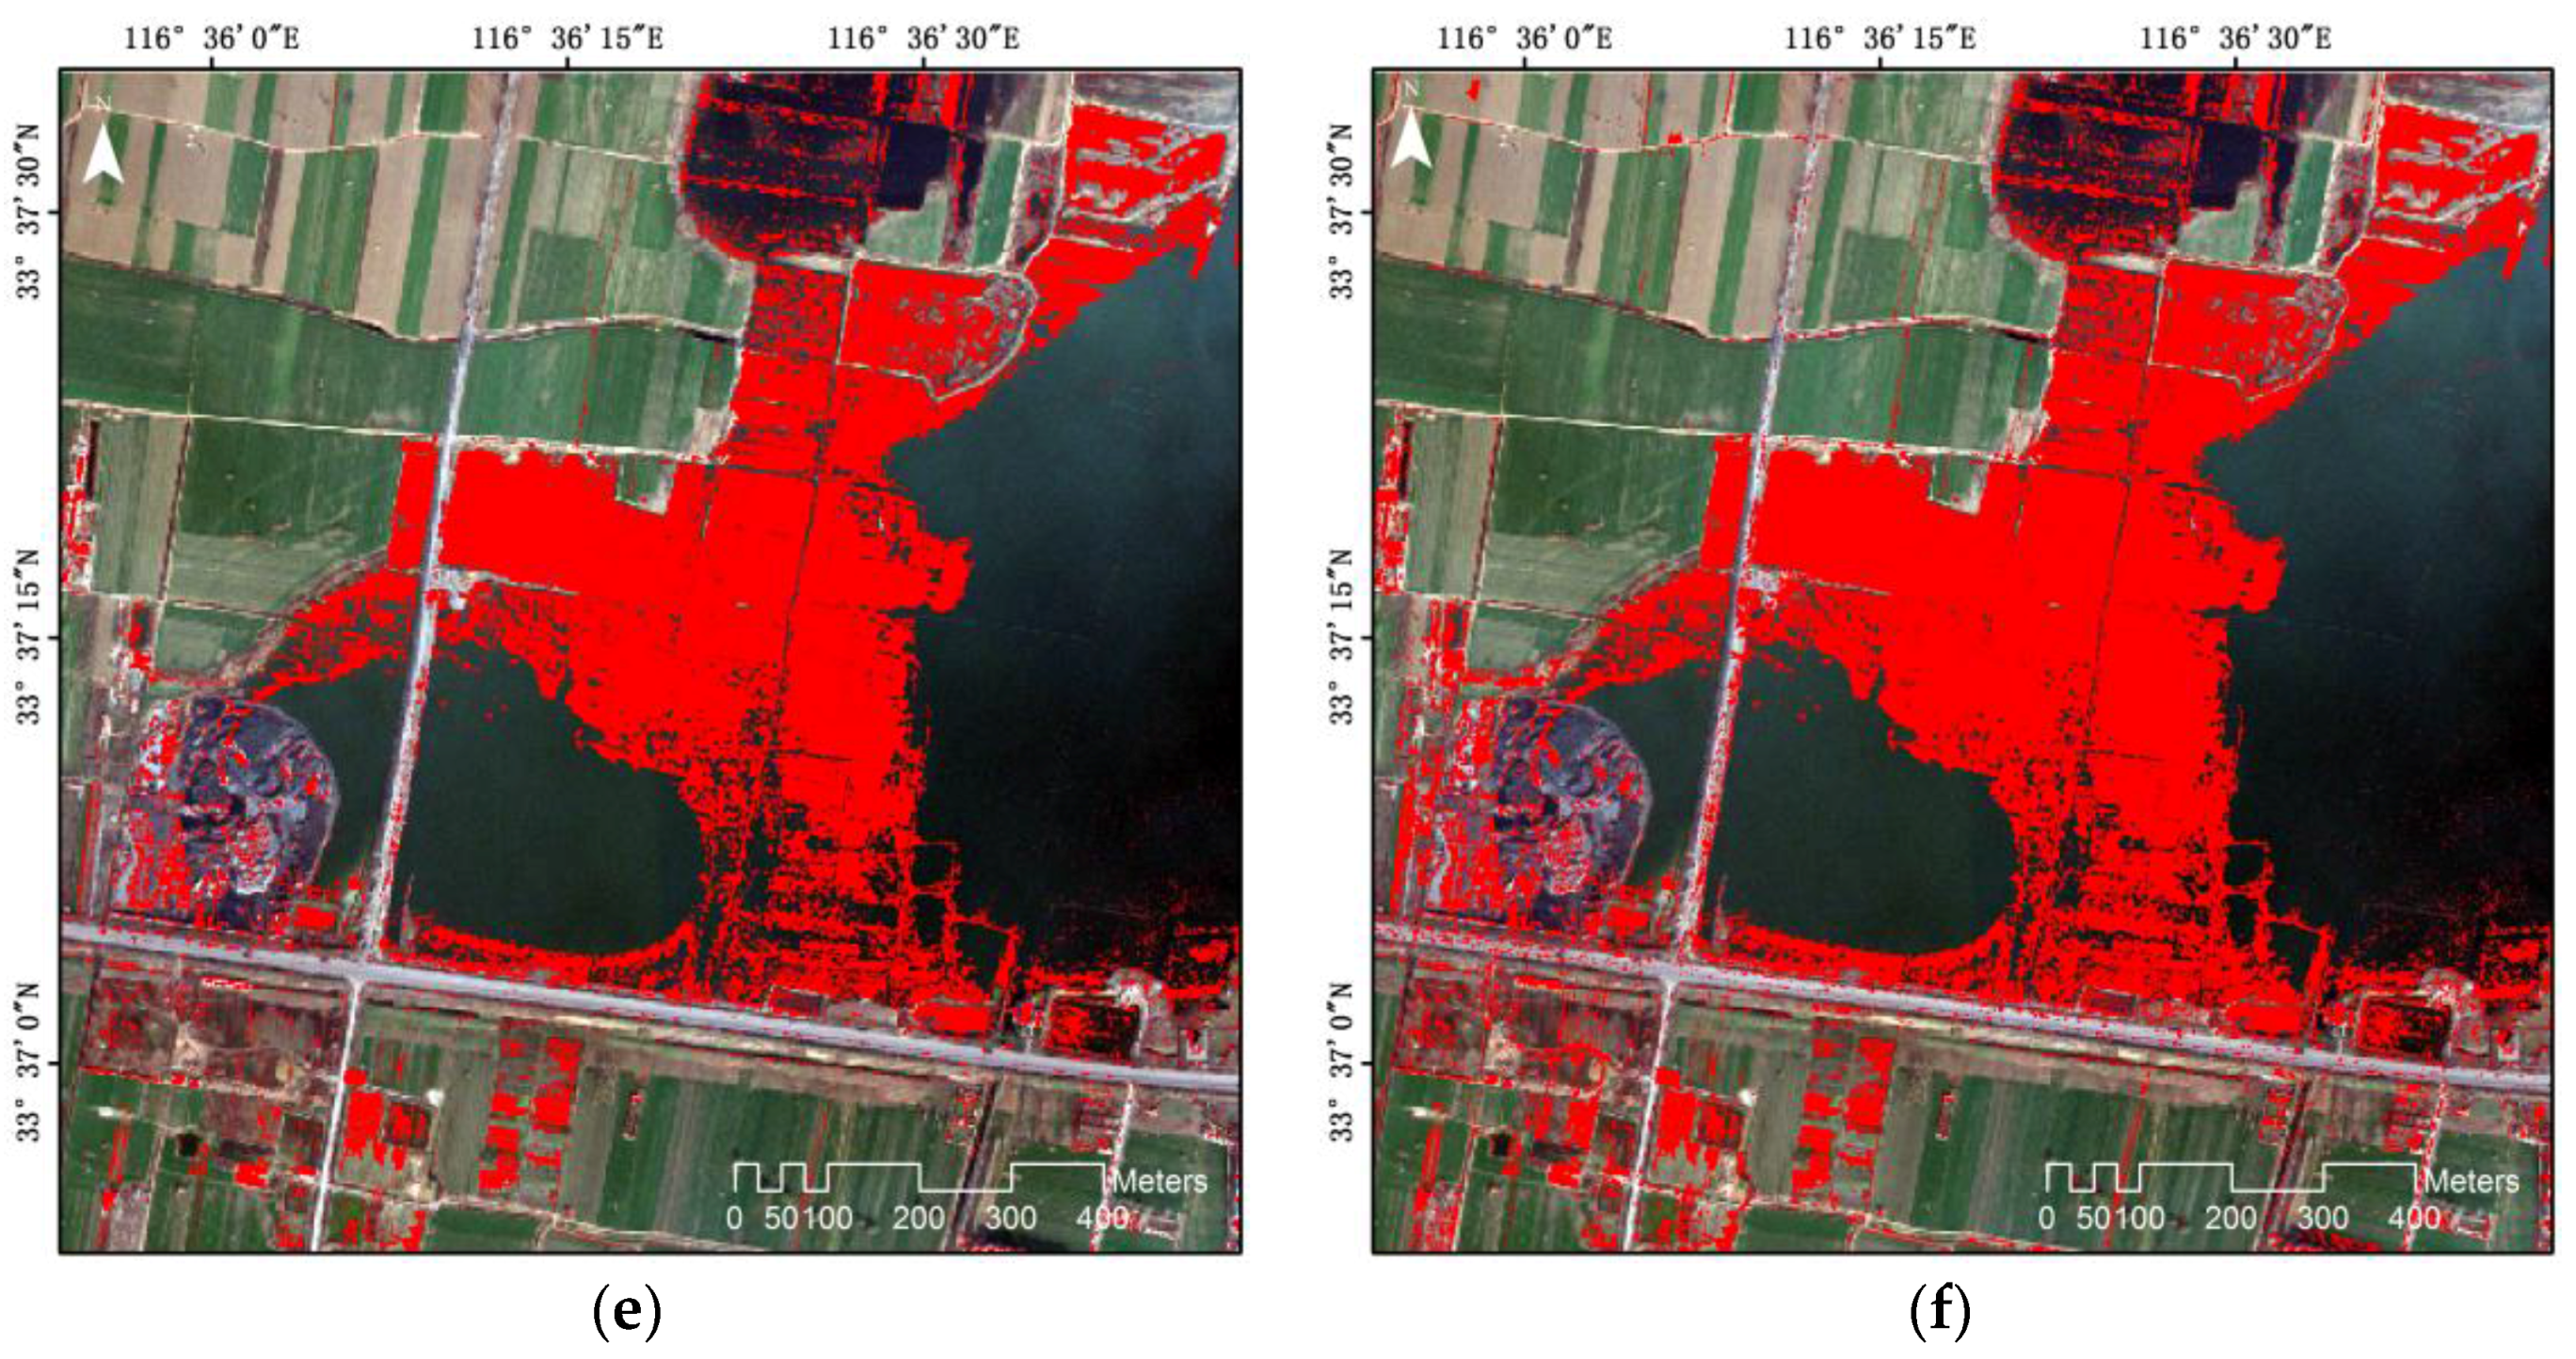
Figure 5.
Unsupervised change detection results of second case by using the tested methods: (a) ground truth image; (b) result of the CVA method; (c) result of the ERGAS method; (d) result of the SAM method; (e) result of the original IR-MAD method; (f) result of the proposed method.
Figure 5.
Unsupervised change detection results of second case by using the tested methods: (a) ground truth image; (b) result of the CVA method; (c) result of the ERGAS method; (d) result of the SAM method; (e) result of the original IR-MAD method; (f) result of the proposed method.

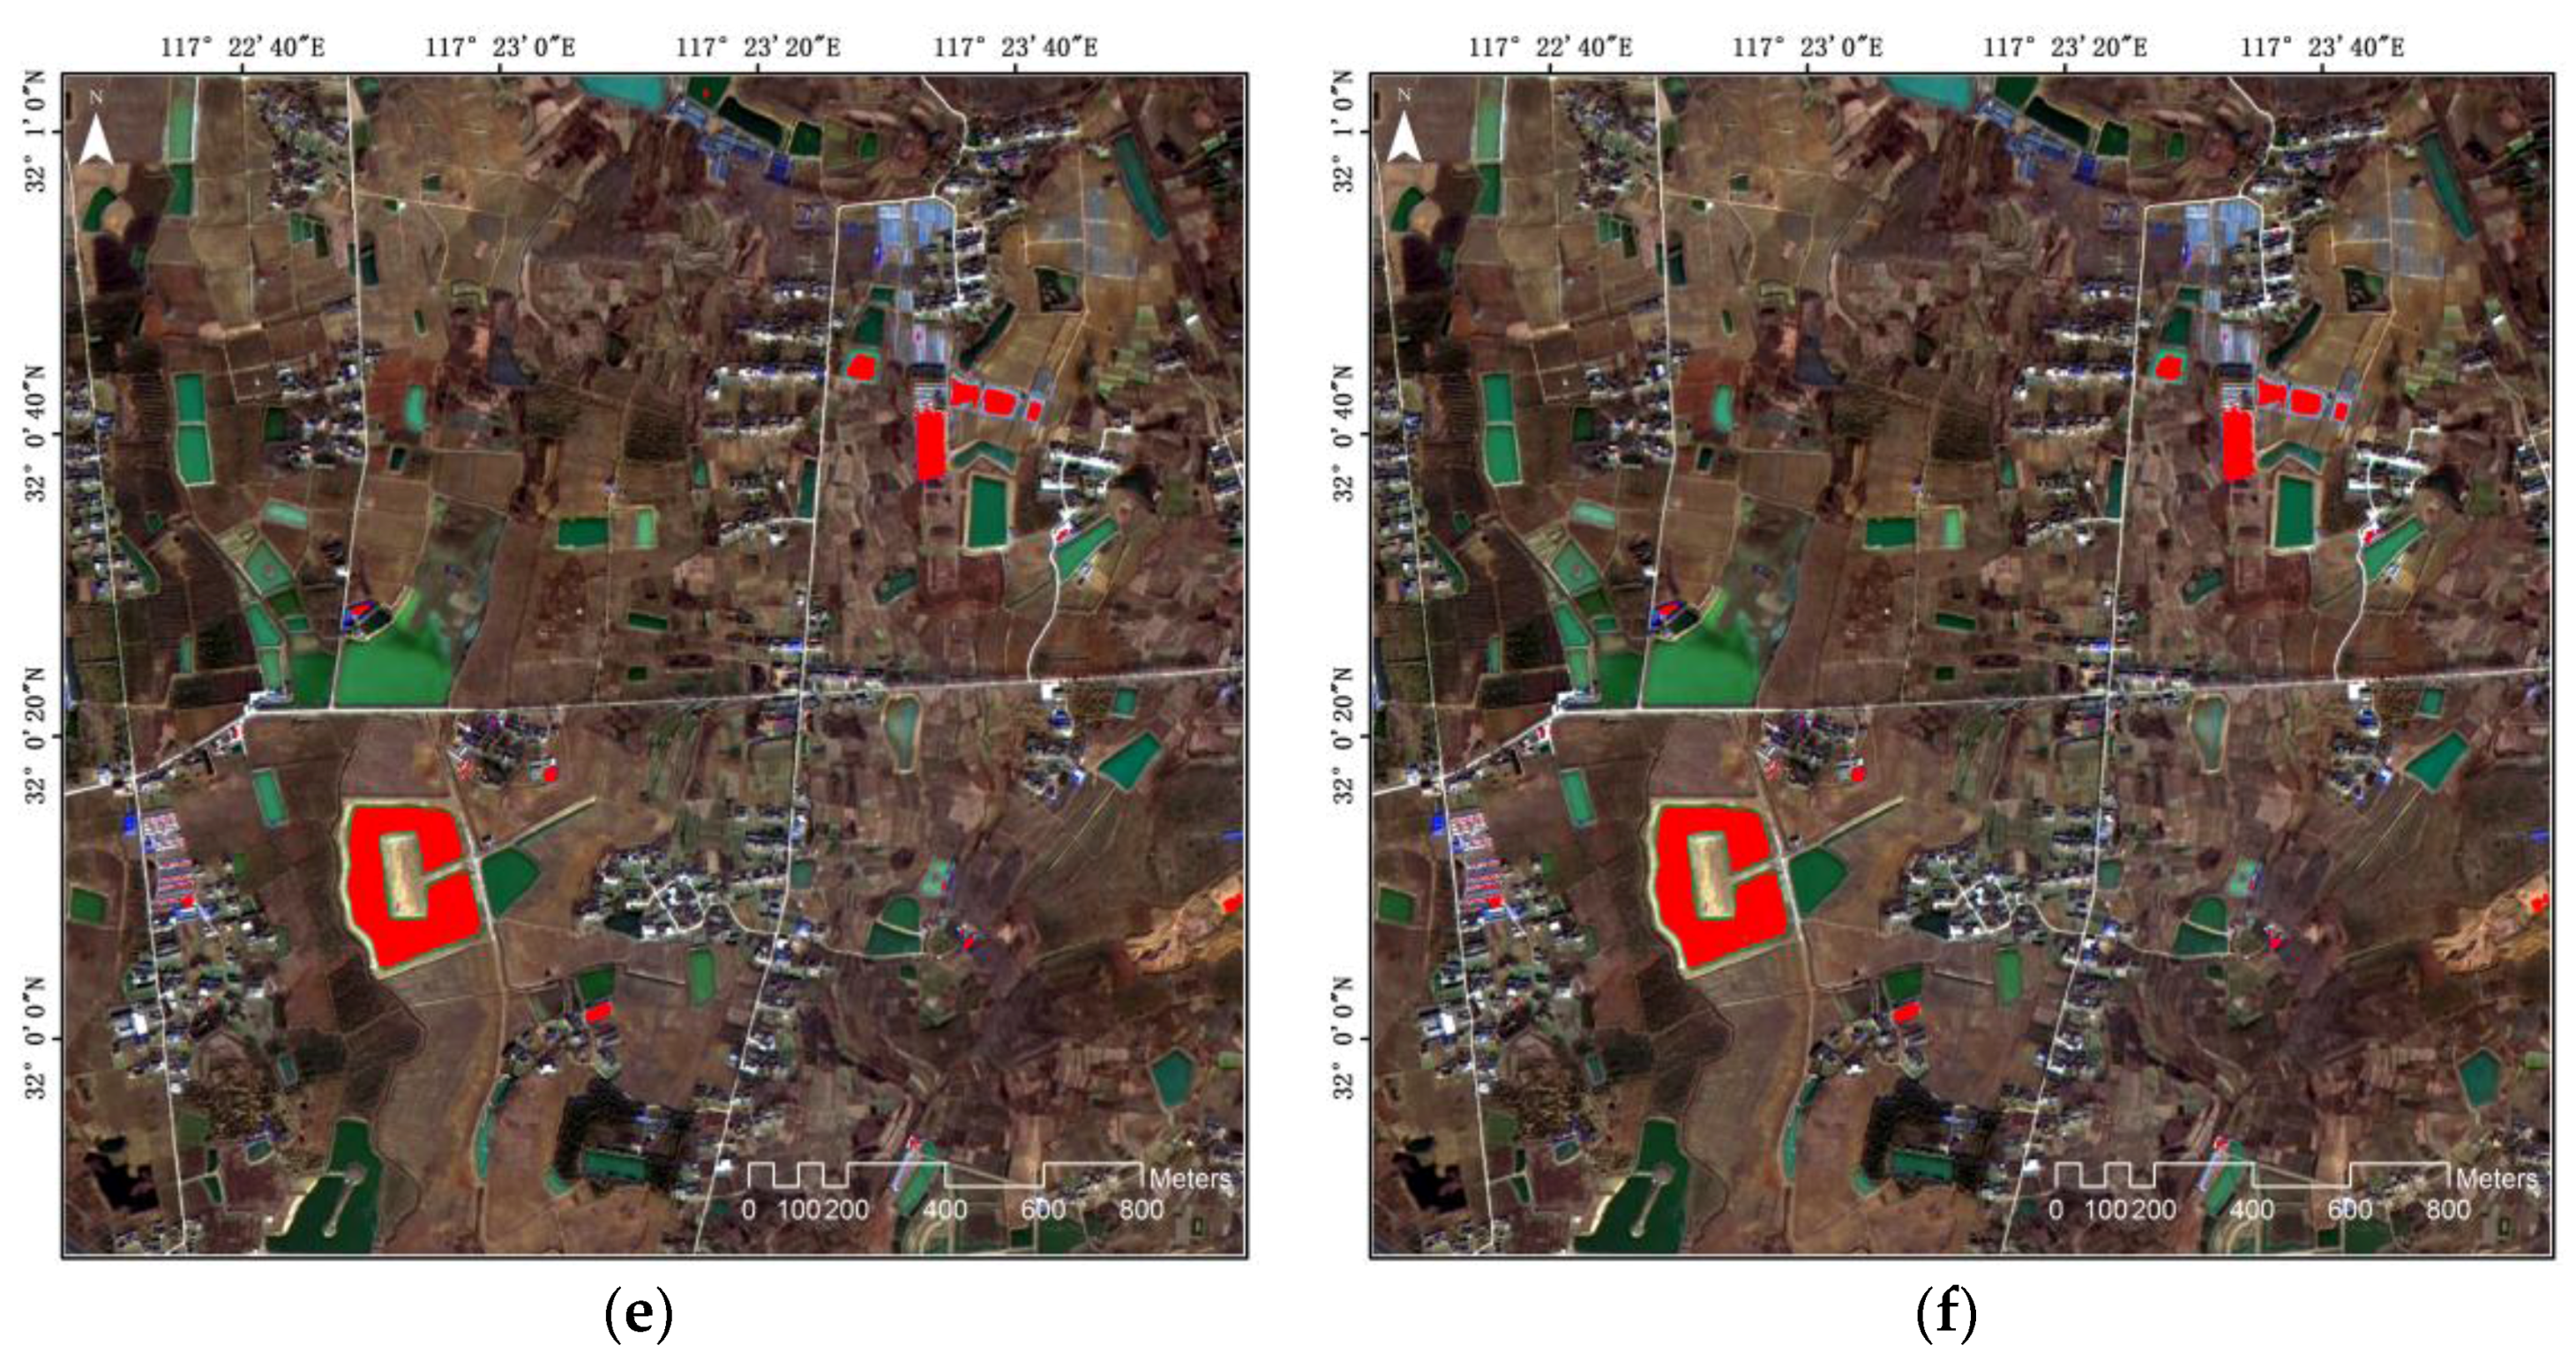
Figure 6.
Detailed images (400 × 400 pixels) of the change detection results () in the first case: (a) location image of ground truth image; (b) result of CVA method; (c) result of the ERGAS method; (d) result of the SAM method; (e) result of the original IR-MAD method; (f) result of the proposed method.
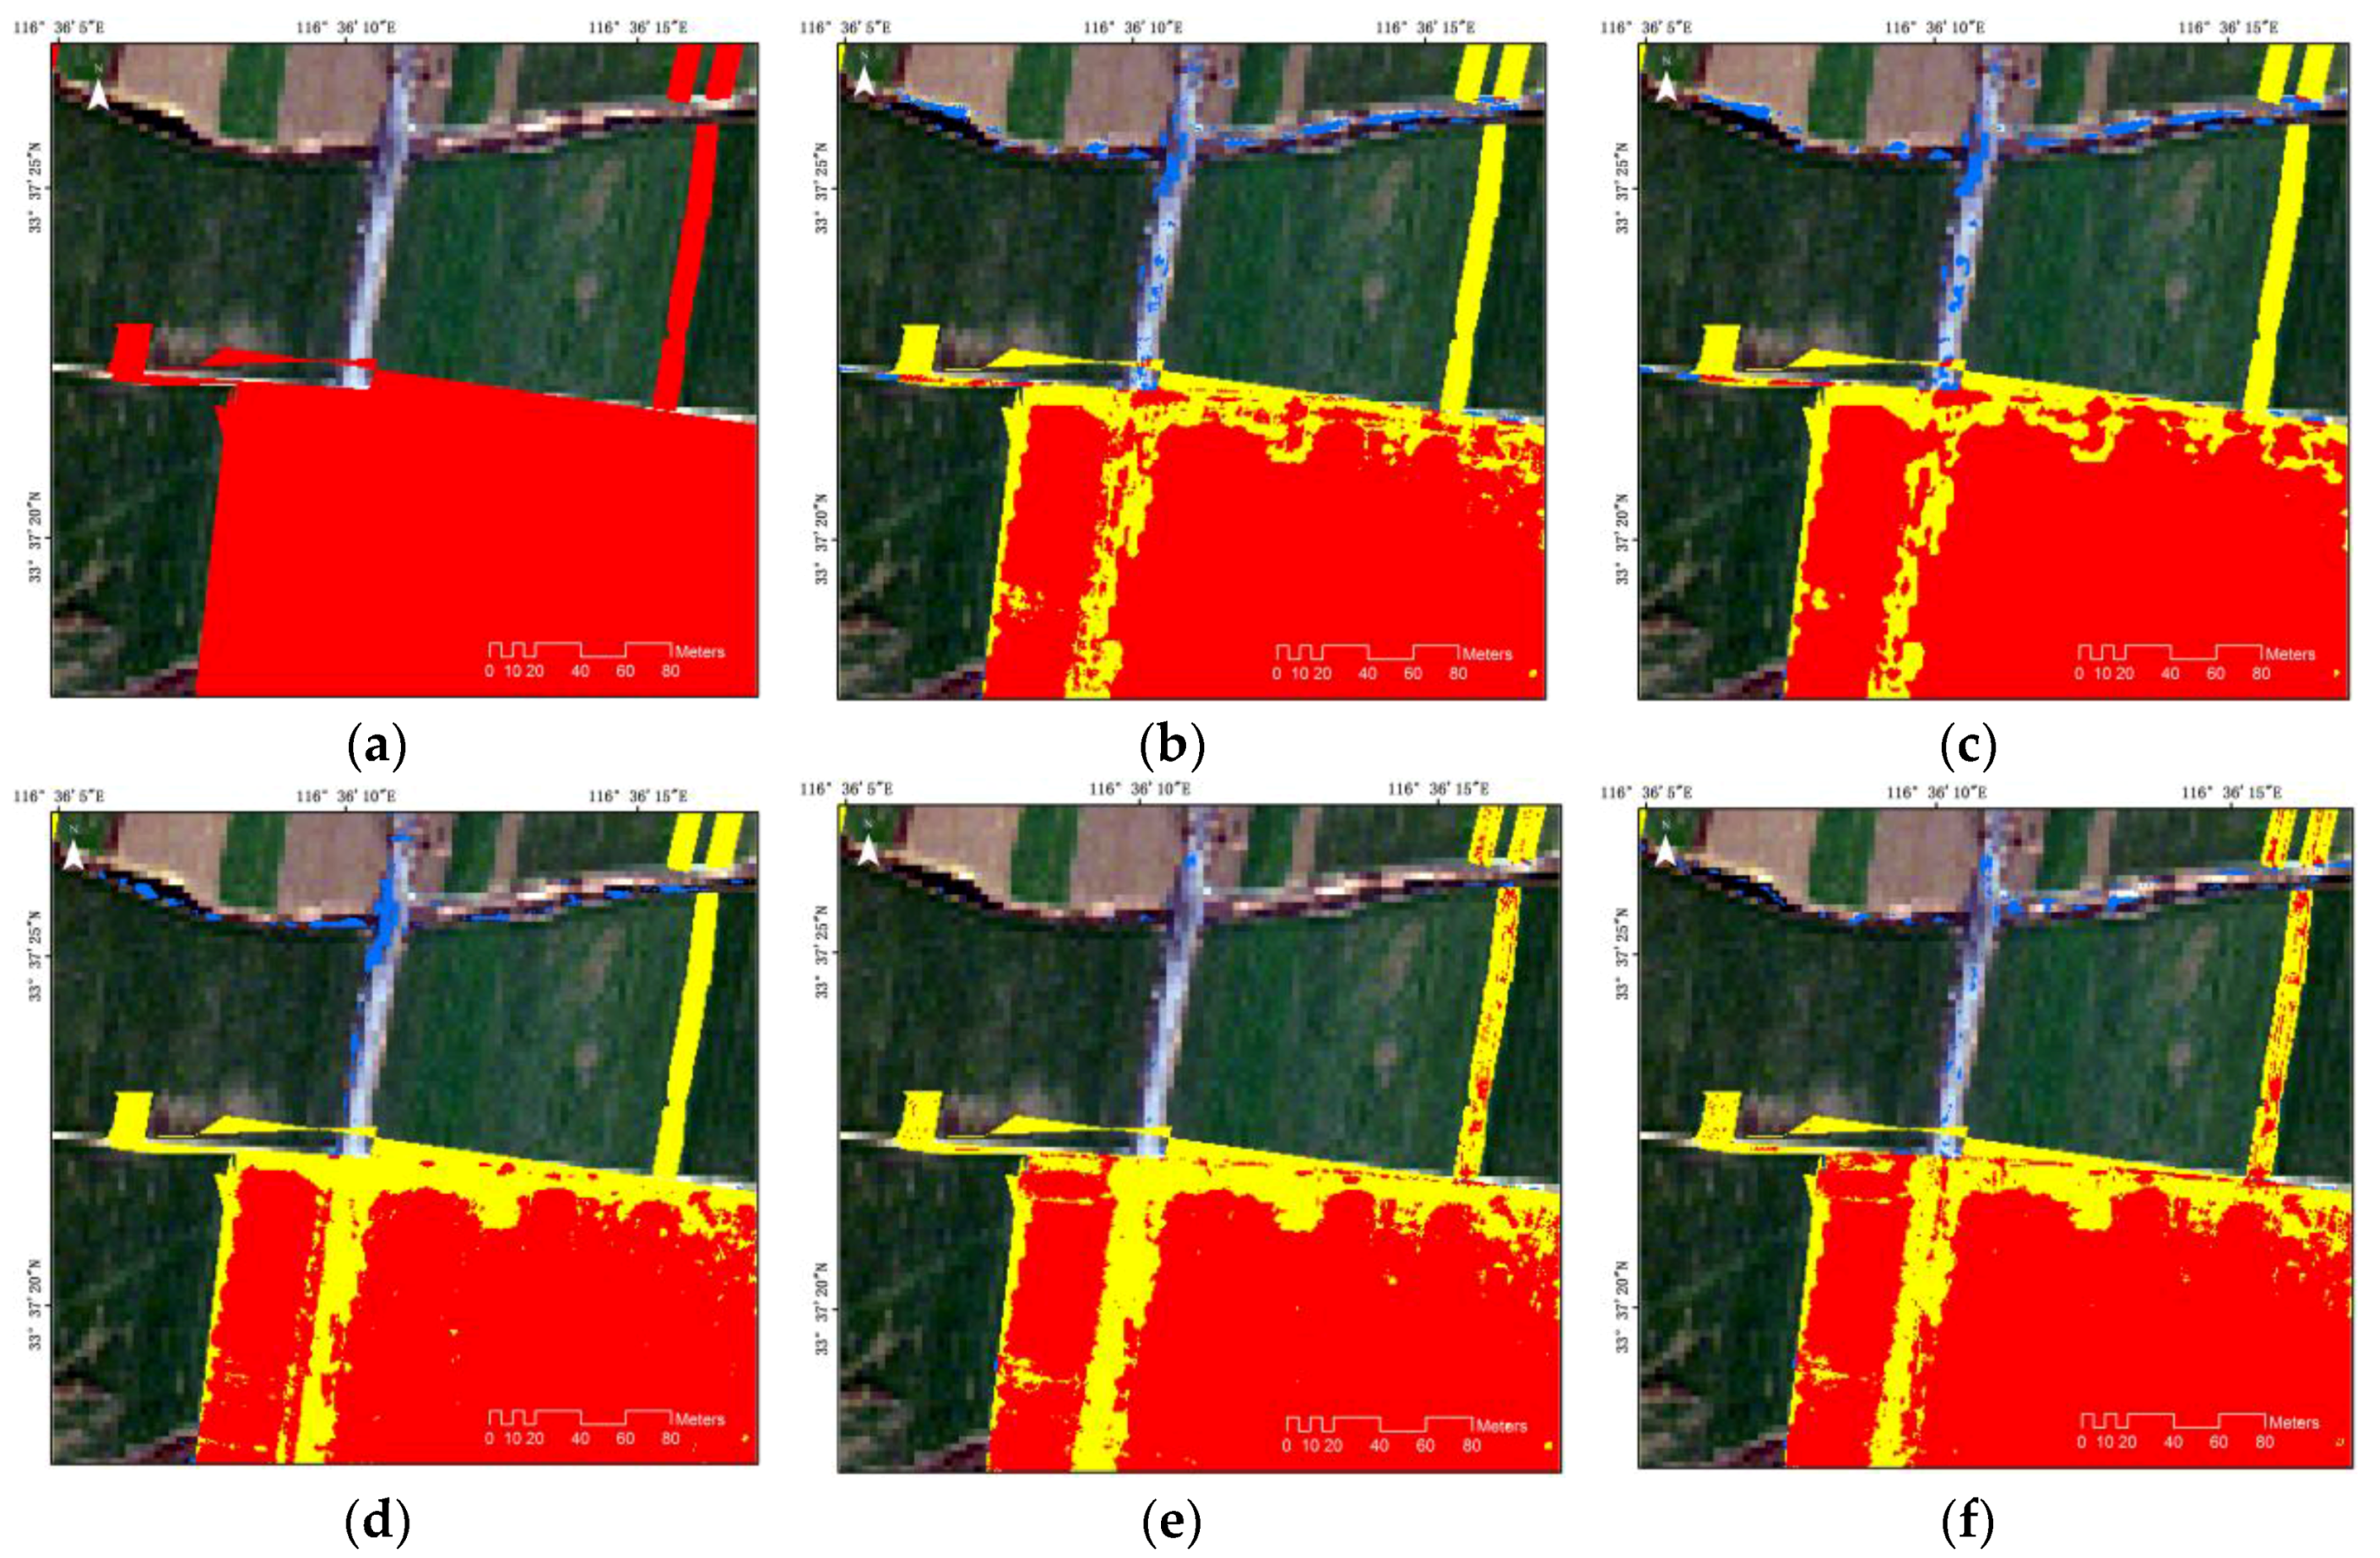
Figure 7.
Detailed images (400 × 400 pixels) of the change detection results () in the first case: (a) location image of ground truth image; (b) result of CVA method; (c) result of the ERGAS method; (d) result of the SAM method; (e) result of the original IR-MAD method; (f) result of the proposed method.

Figure 8.
Detailed images (400 × 400 pixels) of the change detection results () in the second case: (a) location image of ground truth image; (b) result of CVA method; (c) result of the ERGAS method; (d) result of the SAM method; (e) result of the original IR-MAD method; (f) result of the proposed method.

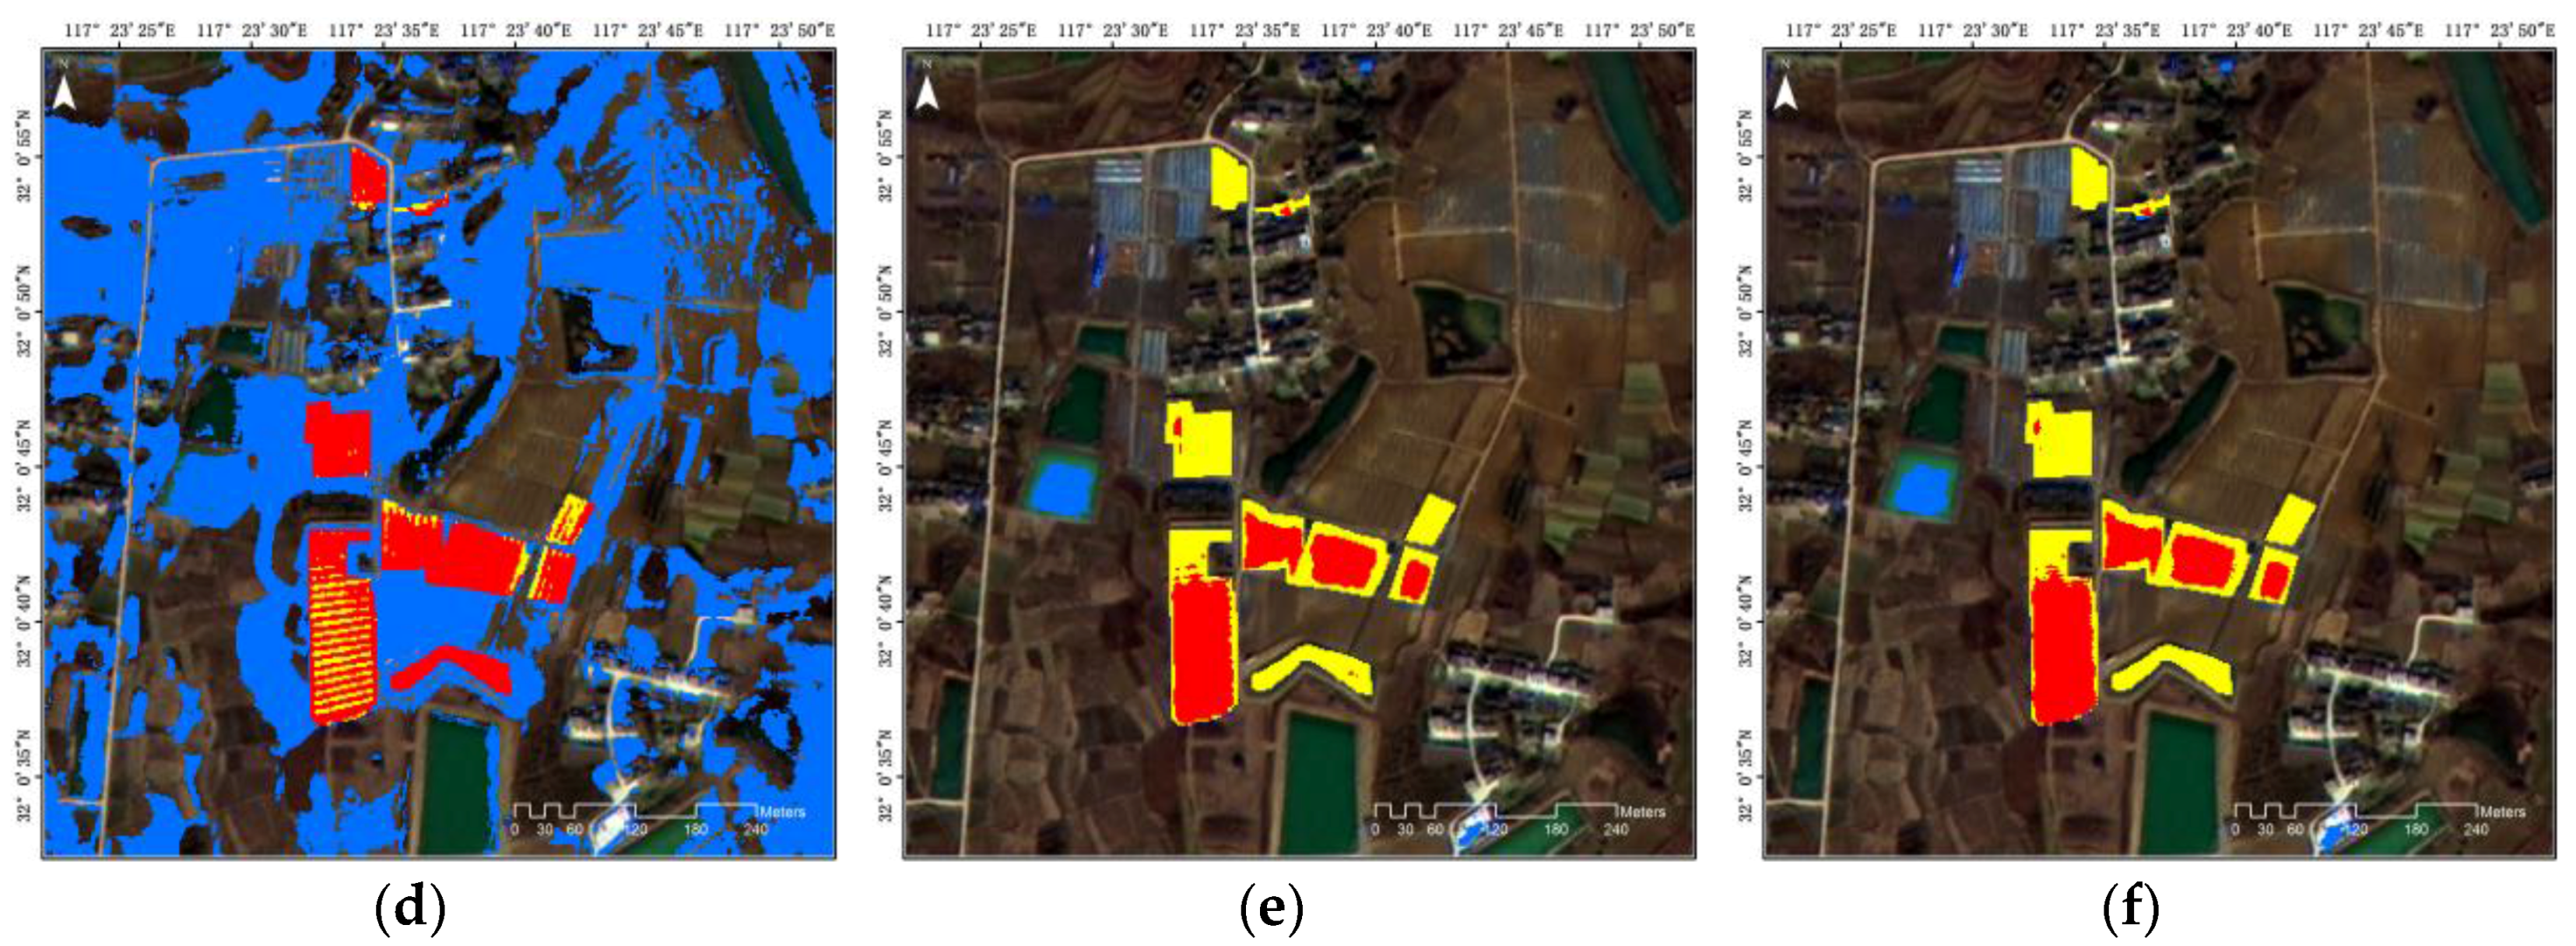
Figure 9.
Detailed images (400 × 400 pixels) of the change detection results () in the second case: (a) location image of ground truth image; (b) result of CVA method; (c) result of the ERGAS method; (d) result of the SAM method; (e) result of the original IR-MAD method; (f) result of the proposed method.

Table 1.
Data specifications of first case.
| Reference Image | Target Image | |
|---|---|---|
| Sensor | IKONOS-2 | WorldView-3 |
| Date | 17/05/2004 | 07/12/2014 |
| Spatial resolution | PAN: 1 m MS: 4 m | PAN: 0.31 m MS: 1.24 m |
| Image size (pixels) | PAN: 1600 MS: 400 | PAN: 1600 MS: 400 |
| Radiometric resolution | 11 bit | 11 bit |
| Wavelength (μm) | Band 1: 0.45–0.52 Band 2: 0.51–0.60 Band 3: 0.63–0.70 Band 4: 0.76–0.85 | Band 1: 0.400–0.450 Band 2: 0.450–0.510 Band 3: 0.510–0.580 Band 4: 0.585–0.625 Band 5: 0.630–0.690 Band 6: 0.705–0.745 Band 7: 0.770–0.895 Band 8: 0.860–1.040 |
Table 2.
Data specifications of second case.
| Reference Image | Target Image | |
|---|---|---|
| Sensor | GF-1 | |
| Date | 14/04/2015 | 26/01/2016 |
| Spatial resolution | PAN: 2 m MS: 8 m | |
| Image size (pixels) | PAN: 1200 MS: 1200 | |
| Radiometric resolution | 10 bit | |
| Wavelength (μm) | Band 1: 0.45–0.52 Band 2: 0.52–0.59 Band 3: 0.63–0.69 Band 4: 0.77–0.89 | |
Table 3.
Change detection accuracy results of first case. OA: overall accuracy; KC: kappa coefficient; CR: correctness; FAR: false alarm rate; CE: commission error; OE: omission error.
Table 3.
Change detection accuracy results of first case. OA: overall accuracy; KC: kappa coefficient; CR: correctness; FAR: false alarm rate; CE: commission error; OE: omission error.
| OA (%) | KC | CR | FAR | CE (%) | OE (%) | |
|---|---|---|---|---|---|---|
| CVA | 69.74 | 0.33 | 0.66 | 0.15 | 34.04 | 53.90 |
| ERGAS | 70.29 | 0.35 | 0.66 | 0.16 | 34.18 | 50.66 |
| SAM | 64.36 | 0.28 | 0.53 | 0.37 | 46.60 | 33.35 |
| Original IR-MAD | 78.47 | 0.50 | 0.93 | 0.02 | 7.30 | 51.46 |
| Proposed Method | 80.51 | 0.56 | 0.89 | 0.04 | 11.42 | 42.66 |
Table 4.
Change detection accuracy results of second case.
| OA (%) | KC | CR | FAR | CE (%) | OE (%) | |
|---|---|---|---|---|---|---|
| CVA | 47.94 | 0.01 | 0.03 | 0.52 | 0.97 | 0.44 |
| ERGAS | 47.73 | 0.01 | 0.03 | 0.53 | 0.97 | 0.42 |
| SAM | 64.10 | 0.03 | 0.05 | 0.36 | 0.96 | 0.46 |
| Original IR-MAD | 97.86 | 0.52 | 0.91 | 0.01 | 0.10 | 0.63 |
| Proposed Method | 97.87 | 0.52 | 0.92 | 0.01 | 0.11 | 0.43 |
Table 5.
The accuracy for the two kinds of detailed images in the first case.
| OA (%) | KC | OA (%) | KC | |
| CVA | 89.42 | 0.77 | 70.65 | 0.34 |
| ERGAS | 89.93 | 0.78 | 70.10 | 0.39 |
| SAM | 88.56 | 0.75 | 71.56 | 0.02 |
| Original IR-MAD | 88.82 | 0.75 | 89.74 | 0.77 |
| Proposed Method | 89.78 | 0.78 | 92.68 | 0.83 |
Table 6.
The accuracy for the two kinds of detailed images in the second case.
| OA (%) | KC | OA (%) | KC | |
| CVA | 52.81 | 0.06 | 54.52 | 0.14 |
| ERGAS | 52.64 | 0.06 | 54.11 | 0.14 |
| SAM | 58.21 | 0.08 | 87.68 | 0.51 |
| Original IR-MAD | 96.67 | 0.56 | 99.12 | 0.94 |
| Proposed Method | 96.70 | 0.56 | 99.16 | 0.94 |
© 2017 by the authors. Licensee MDPI, Basel, Switzerland. This article is an open access article distributed under the terms and conditions of the Creative Commons Attribution (CC BY) license (http://creativecommons.org/licenses/by/4.0/).
Share and Cite
MDPI and ACS Style
Wang, B.; Choi, J.; Choi, S.; Lee, S.; Wu, P.; Gao, Y. Image Fusion-Based Land Cover Change Detection Using Multi-Temporal High-Resolution Satellite Images. Remote Sens. 2017, 9, 804. https://doi.org/10.3390/rs9080804
AMA Style
Wang B, Choi J, Choi S, Lee S, Wu P, Gao Y. Image Fusion-Based Land Cover Change Detection Using Multi-Temporal High-Resolution Satellite Images. Remote Sensing. 2017; 9(8):804. https://doi.org/10.3390/rs9080804
Chicago/Turabian StyleWang, Biao, Jaewan Choi, Seokeun Choi, Soungki Lee, Penghai Wu, and Yan Gao. 2017. "Image Fusion-Based Land Cover Change Detection Using Multi-Temporal High-Resolution Satellite Images" Remote Sensing 9, no. 8: 804. https://doi.org/10.3390/rs9080804
Note that from the first issue of 2016, this journal uses article numbers instead of page numbers. See further details here.