Estimation of Satellite-Based SO42− and NH4+ Composition of Ambient Fine Particulate Matter over China Using Chemical Transport Model

1
State Key Laboratory of Remote Sensing Science, Institute of Remote Sensing and Digital Earth, Chinese Academy of Sciences, Beijing 100101, China
2
University of the Chinese Academy of Sciences, Beijing 100049, China
3
School of Computer and Information Engineering, Henan University, Kaifeng 475004, China
*
Authors to whom correspondence should be addressed.
Remote Sens. 2017, 9(8), 817; https://doi.org/10.3390/rs9080817
Submission received: 30 June 2017
/
Revised: 4 August 2017
/
Accepted: 7 August 2017
/
Published: 9 August 2017
(This article belongs to the Special Issue Aerosol Remote Sensing)
Abstract
:Epidemiologic and health impact studies have examined the chemical composition of ambient PM2.5 in China but have been constrained by the paucity of long-term ground measurements. Using the GEOS-Chem chemical transport model and satellite-derived PM2.5 data, sulfate and ammonium levels were estimated over China from 2004 to 2014. A comparison of the satellite-estimated dataset with model simulations based on ground measurements obtained from the literature indicated our results are more accurate. Using satellite-derived PM2.5 data with a spatial resolution of 0.1 × 0.1°, we further presented finer satellite-estimated sulfate and ammonium concentrations in anthropogenic polluted regions, including the NCP (the North China Plain), the SCB (the Sichuan Basin) and the PRD (the Pearl River Delta). Linear regression results obtained on a national scale yielded an r value of 0.62, NMB of −35.9%, NME of 48.2%, ARB_50% of 53.68% for sulfate and an r value of 0.63, slope of 0.67, and intercept of 5.14 for ammonium. In typical regions, the satellite-derived dataset was significantly robust. Based on the satellite-derived dataset, the spatial-temporal variation of 11-year annual average satellite-derived SO42− and NH4+ concentrations and time series of monthly average concentrations were also investigated. On a national scale, both exhibited a downward trend each year between 2004 and 2014 (SO42−: −0.61%; NH4+: −0.21%), large values were mainly concentrated in the NCP and SCB. For regions captured at a finer resolution, the inter-annual variation trends presented a positive trend over the periods 2004–2007 and 2008–2011, followed by a negative trend over the period 2012–2014, and sulfate concentrations varied appreciably. Moreover, the seasonal distributions of the 11-year satellite-derived dataset over China were presented. The distribution of both sulfate and ammonium concentrations exhibited seasonal characteristics, with the seasonal concentrations ranking as follows: winter > summer > autumn > spring. High concentrations of these species were concentrated in the NCP and SCB, originating from coal-fired power plants and agricultural activities, respectively. Efforts to reduce sulfur dioxide (SO2) emissions have yielded remarkable results since the government has adopted stricter control measures in recent years. Moreover, ammonia emissions should be controlled while reducing the concentration of sulfur, nitrogen and particulate matter. This study provides an assessment of the population’s exposure to certain chemical components.
1. Introduction
Numerous epidemiologic studies have indicated that high concentrations of fine particle matter with an aerodynamic diameter less than 2.5 μm (PM2.5) are strongly associated with adverse health effects [1,2]. A number of studies show that PM2.5, originating from direct emission and secondary conversion, is a complex compound containing secondary sulfate (SO42−), ammonium (NH4+), nitrate (NO3−), organic carbon (OC), elemental carbon (EC) and other components. As such, PM2.5 has a strong effect on the hydroscopic nature and acidity of aerosols [3]. Several studies have shown that short-term human exposure to the various chemical components of PM2.5 has led to increased hospital admissions [4,5], cardiovascular and respiratory problems as well as all-cause mortality [6,7]. The Ministry of Environmental Protection (MEP) has begun to carry out routine monitoring of PM2.5 total mass concentration since a national network for PM2.5 monitoring was established in January 2013. In addition, ground measurements of chemical composition have been conducted in several representative cities over certain sampling periods. Although the national network encompasses all provincial capital cities and other major cities, various sampling methods of chemical composition have been insufficiently consistent to evaluate the similarities and differences between different locations [8]. Thus, no information concerning species concentrations over wide geographical areas or historical PM2.5 trends before 2013 are available. Doubtlessly, assessments of the long-term health impacts of exposure to various PM2.5 components have been hindered because of the paucity of PM2.5 data. Additional observations are needed to improve our elucidation of the relationship between spatial patterns of fine particulate matter components and health impacts.
Advances in satellite remote sensing technology have provided a low-cost and effective way of monitoring aerosol optical depth (AOD), the integrated extinction coefficient of the entire air column, for which data can be reliably retrieved over land. To date, a variety of mature studies have been conducted to establish the relationship between satellite-derived products and fine particulate matter near the ground using scale factors [9,10], physical semi-empirical methods [11,12], and statistical models [13,14]. Moreover, satellite remote sensing technology is an effective way of obtaining fine particulate matter compositions, providing researchers the chance to understand the distribution characteristics of each composition [15].
Chemical transport models (CTMs) have been widely used to retrieve AOD and AOD components [16,17] and thereby calculate the relationship between satellite-derived AOD and ground particulate matter on a regional or even larger scale to fill the gap represented by satellite observations contaminated by clouds or bright surfaces. For example, Liu et al. [9] first proposed a scale factor to estimate ground-level PM2.5 from satellite-derived AOD data using a CTM. Van Donkelaar et al. extended the approach used by Liu et al. (2004) to estimate average global PM2.5 concentrations at a resolution of 1 × 1° from 2001 to 2002 using MODIS and MISR AOD data [18]. Several follow-up studies have further investigated long-term PM2.5 concentrations through data integration based on conversion factors calculated from CTMs over China [19] or over the entire globe [10]. Considering emission inventories and precursor gases as input, CTMs have also been capable of simulating various chemical components of PM2.5. For example, inspired by AOD assimilation methods [20], Sajeev et al. [15] combined satellite-derived AOD data with global modeling of the coincident aerosol vertical profile and composition to produce a global long-term mean ambient outdoor satellite-model PM2.5 composition dataset at a spatial resolution of 0.1 × 0.1°. Following [15], Geng et al. estimated the chemical composition of PM2.5 over China. Their results demonstrated that it was feasible to estimate PM2.5 composition by integrating CTMs and satellite-derived PM2.5 data [21].
Based on the relationship between the total PM2.5 concentration and various compositions, each composition is strongly correlated to the ratio of its mass concentration to the total mass concentration relative to that of each composition to AOD. To date, no studies have specifically focused on the various chemical components of PM2.5 by satellite remote sensing technology or integrated CTMs with satellite-derived PM2.5 data to understand the distribution of ground-level PM2.5 components over a regional or national scale.
In this study, using CTM output to represent local conversion factors between PM2.5 and its components, we first estimated chemical components of PM2.5 based on satellite-derived data, using SO42− and NH4+ as examples. Herein, the methods for calculating SO42− and NH4+ concentrations from satellite-derived PM2.5 data are presented first. Second, the satellite-derived PM2.5 and model-simulated results are validated using ground-observed concentrations; the satellite-model concentrations are further evaluated based on in situ measurements obtained from the literature. Third, the spatiotemporal distributions of SO42− and NH4+ are demonstrated by annual average and regions.
2. Data and Methods
2.1. Ground-Based Measurement Data
Hourly national-scale PM2.5 concentrations for China from January 2013 to December 2014 were collected from the official website of the China Environmental Monitoring Center (CEMC) [22]. National PM2.5 air-quality monitoring networks were not established in China until 2013; monitoring of chemical components (such as SO42− and NH4+) was conducted by only a few institutes, with data unavailable over China, before that year. Thus, PM2.5 data for the period 2004–2012 and measurements of the chemical components of PM2.5 during that study period were collected from previous studies; the relevant data are summarized in Table S1. All ground PM2.5 measurements were measured using tapered element oscillating microbalance (TEOM) technology or beta attenuation monitors. Taking the period during which data were collected from the literature as a standard, the monthly average PM2.5 concentrations (2013–2014) were obtained; the corresponding sites are indicated by red circles in Figure 1. The overall ground PM2.5 measurements were used to evaluate our model. In addition, the network comprised four air-quality monitoring stations in the Jing-Jin-Ji urban agglomeration, including three urban sites (Beijing, Tianjin, Tangshan) and a background site (Xinglong), which employed two eight-stage samplers (Andersen Series 20-800, Minneapolis, MN, USA) to simultaneously sample particles from September 2009 to August 2010 [23]. Each set of samples was continuously collected for 24 h (Xinglong for 48 h) on a biweekly basis. Monthly average concentrations of PM2.5 components such as SO42− and NH4+ were calculated. As shown in Figure 1, green triangles denote the data available for SO42− and blue open circles denote the data available for NH4+; these data were used to evaluate our estimation.
2.2. Satellite-Estimated PM2.5 Data
Various methods can be used to estimate ground-level PM2.5 concentrations from satellite AOD data, including the use of conversion factors between PM2.5 and AOD via CTMs [9,10,18], semi-empirical models [12,24] and statistical models [13,25,26]. Compared with the utilization of PM2.5/AOD conversion factors and semi-empirical methods, statistical models, particularly advanced statistical models, are well recognized as the most popular approach, yielding higher accuracy in estimating satellite-derived PM2.5 data because of the incorporation of different meteorological factors, land use data, population distribution data, etc.
Given that the existing advanced statistical methods are mature, the method put forward by Ma et al. [27] was employed in our work. Ma et al. developed a two-stage spatial statistical model by integrating MODIS Collection 6 AOD data, assimilated meteorology data, and land use data with PM2.5 concentrations measured by China’s established ground monitoring network. An inverse variance weighting (IVW) approach was developed to combine MODIS Dark Target and Deep Blue AOD data to optimize data coverage. Compared with AERONET observations, these combined AOD data performed similarly (R2 = 0.80, mean bias = 0.07) to MODIS’s operational combined AOD data (R2 = 0.80, mean bias = 0.07) but had 90% greater coverage. Historical daily PM2.5 concentrations (2004–2012) were estimated using the model developed based on national-scale data in 2013, assuming that the daily relationship between PM2.5 and AOD was constant over the same day in each year. Ground PM2.5 measurements were conducted only in specific sites or cities (such as Beijing and Xi’an) before 2013, with additional national-scale ground observations performed from January to June 2014, providing the historical ground-based PM2.5 data for evaluating model-predicted PM2.5 concentrations. The results showed that these estimates enabled better performance at the monthly level, with an R2 value of 0.73, slope of 0.91, intercept of 8.64 and seasonal levels with high coefficients (R2: 0.79) and a slope near 1 (slope: 0.92), which illustrated that this statistical model was so robust that the results obtained from derived PM2.5 concentrations were used as a data source for our model.
2.3. Model-Simulated Data
GEOS-Chem (GC) is a global 3-D CTM driven by meteorological input from the Goddard Earth Observing System (GEOS) of the NASA Global Modeling and Assimilation Office, providing continuous spatial and temporal coverage of aerosols, various aerosol components, certain particulate matter tracers and gases (http://acmg.seas.harvard.edu/geos/). In this study, Version 9.2 of the GEOS-Chem model covering the study domain for the period 2004–2014 was utilized to simulate component mixing ratios, such as those of sulfate (SO42−), nitrate (NO3−), ammonium (NH4+), BCPI, BCPO, OCPI, OCPO, DST1, DST2, DST3, DST4, SALA, SALC, SO4s, and NITs (ppbv). In GEOS-Chem version 9.2, the Emission Database for Global Atmospheric Research (EDGAR) version 3 [28] and the REanalysis of the TROposhperic chemical composition (RETRO) are respectively used to calculate global anthropogenic pollutant gas (e.g., SOx, NOx, CO) and VOC emissions. The sulfate simulation also uses NH3 biofuel and natural source emissions from Global Emissions Inventory Activity (GEIA) [29]. Over China, anthropogenic emissions used in the GEOS-Chem model were year-by-year emissions during the period 2004–2014 taken from the MEIC inventory, including SO2, NOx, NH3, CO, OC, BC and NMVOCs. Anthropogenic emissions over Southeast Asia outside China were taken from the INTEX-B inventory [30]. The Streets 2006 regional inventory [31] is used to overwrite the default biofuel inventory of Yevich & Lgan in GEOS-Chem [32] over China. For other non-anthropogenic emissions, biogenic species are emitted following the Model of Emissions of Gases and Aerosols from Nature (MEGAN 2.1) model inventory [33]. Biomass burning emissions for aerosol species of OC, BC, etc. are based on The Global Fire Emission Database (GFED) version 3 inventory. In addition, soil NOx [34], lighting NOx [35,36] and fertilizer NOx are included in the non-anthropogenic emissions.
This model has a spatial resolution of 2 × 2.5° and a temporal resolution of 3 h. The vertical layers of this model extended from the surface to the top of the atmosphere (0.14 hPa), with 37 vertical levels in total. The lowest layer of this model was centered at 120 m above ground. After converting the units of ppbv to mass concentration (μg/m3), the sum of the above mentioned components at the surface level was treated as the PM2.5 total mass concentration. Correspondingly, the mass concentrations of SO42− and NH4+ in the lowest layer were extracted from the model simulations.
2.4. Inferring PM2.5 Chemical Components
Our approach for estimating satellite-retrieved surface PM2.5 concentrations using the relationship between model-simulated PM2.5 concentrations and chemical components of PM2.5 is based on the method developed by Sajeev et al. [15], who concluded that the correlation between satellite-modeled PM2.5 components in North American and in situ observations reached 0.45 for organic matter and 0.95 for sulfate. That approach was further developed by Geng et al., who found that the chemical compositions over four polluted regions showed good consistency with ground measurements, with r values in the range of 0.65–0.75 for different species. Undoubtedly, these results have provided new possibilities for estimating PM2.5 components using satellite technology.
To the best of our knowledge, total PM2.5 can be classified into sulfate, nitrate, ammonium, organic matter (OM), black carbon (BC), crustal elements, and unaccounted-for components for material balance, which means that total PM2.5 concentrations scale with the increase or decrease in the concentration of each component. As a result, the method for estimating SO42− and NH4+ from satellite-derived PM2.5 data in this work can be expressed as Equation (1). As indicated by Liu et al., finer resolution and wider coverage have always been the advantage of satellite remote sensing technology [9]. The higher resolution that satellite remote sensing data have, the more likely those data will be used to estimate long-term chemical compositions over China, even historical concentrations. Therefore, using simulated compositions of PM2.5, our satellite-derived PM2.5 concentrations (gathered at a resolution of 0.1 × 0.1°) were fully employed, enhancing our method for estimating SO42− and NH4+ from satellite-derived PM2.5 data in this work.
where k represents SO42− or NH4+, c denotes satellite-derived results at the coarse resolution of 2 × 2.5° consistent with the model, and f denotes satellite-estimated results at a finer resolution of 0.1 × 0.1°. Either c or f can be applied in Equation (1) at a given time.
The method used in our analysis is similar to that used by Geng et al., both of which have attempted to fill the gaps in PM2.5 chemical composition measurements over China based on satellite data and conversion factors derived from the Chemical Transport Model. Specifically, Geng et al. estimated the satellite-derived chemical compositions of PM2.5 by applying composition-specific conversion factors to satellite AOD. Compared with AOD, PM2.5 can reflect more information about various chemical components (e.g., sulfate, nitrate, ammonium, BC, OC) at the surface level and under dry conditions.
The uncertainties associated with satellite-model concentrations of PM2.5 components are mainly associated with the satellite-estimated PM2.5 concentrations, the simulated PM2.5 data and its fractional composition and incomplete sampling. The accuracy of the satellite-estimated PM2.5 data was described in Section 2.2, and that of the model-simulated PM2.5 data is discussed in Section 3.1. The normalized mean relative bias (NMRB) parameter is introduced to reflect the degree of divergence between GC-simulated or satellite-derived PM2.5 data and ground truths in our work. To reduce the effects of different sampling sites and periods on the estimation model, three indicators were introduced to determine the bias between each modeled or satellite-estimated component and ground observations: normalized mean bias (NMB), normalized mean error (NME) and absolute relative bias (ARB). The total error was the sum of the described errors in quadrature.
3. Results and Discussion
3.1. Validating PM2.5 from Model-Simulated and Satellite-Derived Data
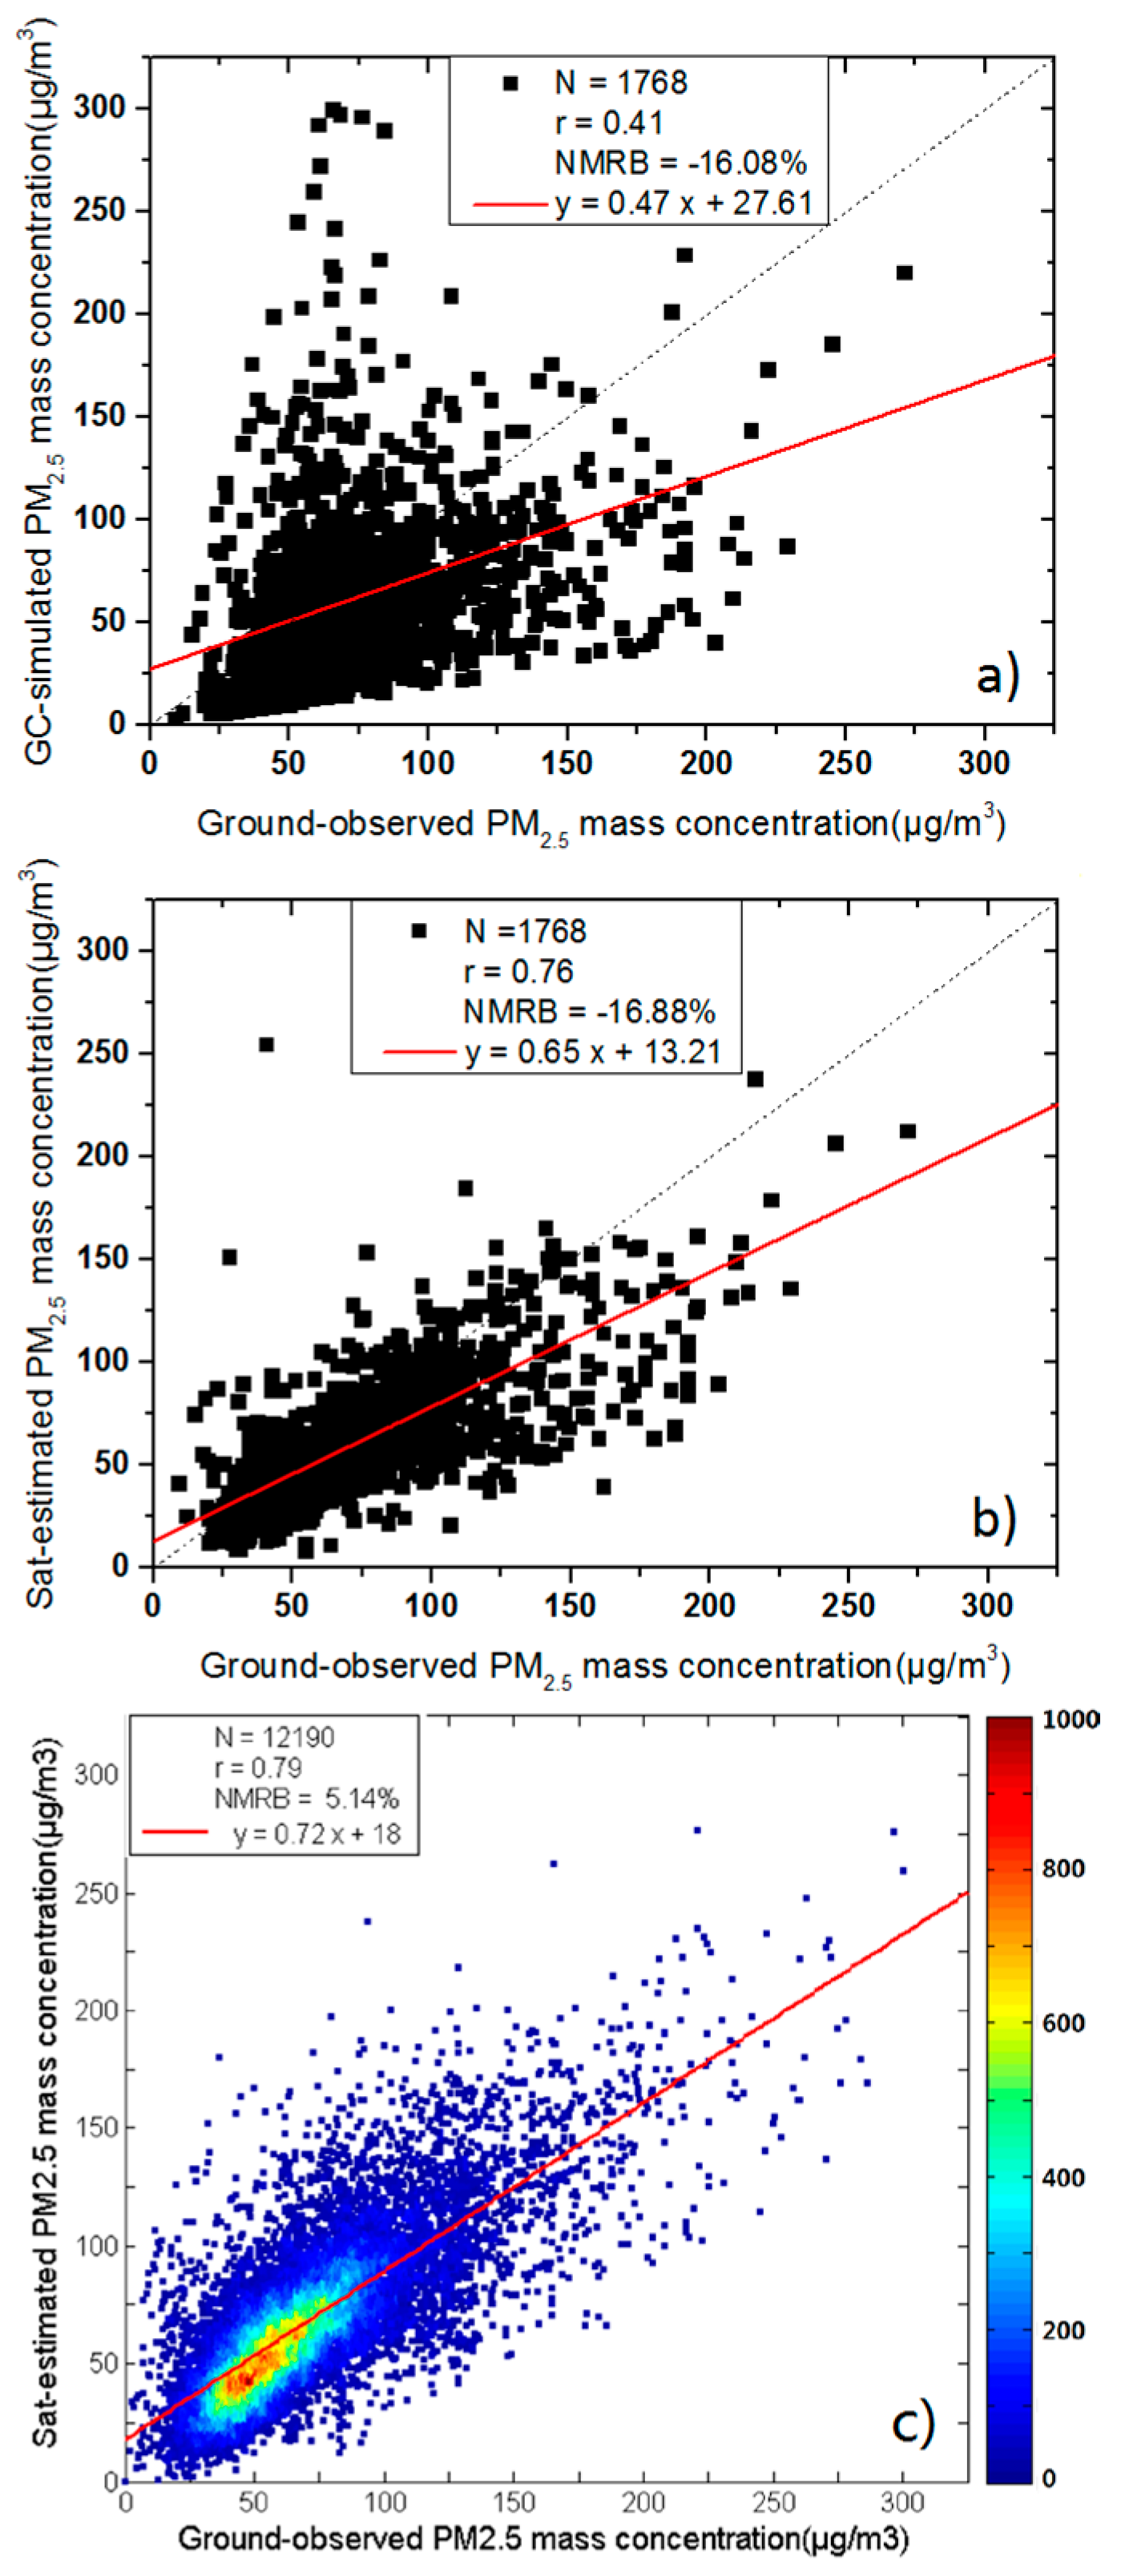
The study region for the current analysis lies between latitude 15° and 55° and longitude 70° and 140°, and most of the pollutant sources are located in Mainland China. Given the spatial resolution of 2 × 2.5° of our model, satellite-based PM2.5 results were spatially averaged to make coincident comparisons against in situ data. Overall, the number of monthly mean records from 2004 to 2014 over Mainland China is 1768. Linear regression of the GC results against ground-based observations (Figure 2a) yields an r value of 0.41, slope of 0.47 and intercept of 27.61, which indicates that the model underestimates PM2.5 values under most conditions. However, a strong correlation between the satellite-based and in situ PM2.5 concentrations is obtained, with an r value of 0.76, slope of 0.65 and intercept of 13.21 (Figure 2b). The regression line of satellite-estimated PM2.5 against that of ground observations is closer to the 1:1 line than that between GC and in situ observations. Specifically, the NMRB of the GC-simulated vs. ground-based data (−16.08%) is smaller than that of the satellite-derived vs. ground-based data (−16.88%), indicating that satellite retrievals show a slightly larger deviation relative to ground truths than GC while demonstrating better correlated parameters.
In addition, a comparison of satellite-derived PM2.5 against the ground measurements obtained at a finer resolution of 0.1 × 0.1° is presented in Figure 2c. The number of matched-up samples increased to 12,190 because of the improvement of the resolution. Regression parameters including the correlated coefficient (0.80), slope (0.72), intercept (18.0) and NMRB (3.89%) in Figure 2c demonstrate that the performance of Sat vs. Ground measurements at 10 km is significantly better than that of GC vs. Ground measurements at a resolution of 2 × 2.5°, which is also higher than that of Sat vs. Ground measurements at a resolution of 2 × 2.5°. In particular, the NMRB value was improved by 12.19% relative to the absolute value.
3.2. Evaluation of Satellite-Estimated Chemical Components
To make clear comparisons between satellite-derived concentrations and ground measurement data collected from the literature and model simulations vs. in situ data, satellite-based and model-simulated data were extracted and averaged according to the corresponding sample period. To this end, ARB_30% and ARB_50% were utilized to calculate the percentage of absolute bias between model-simulated or satellite-derived records and ground observations within 30% or 50% of the total samples.
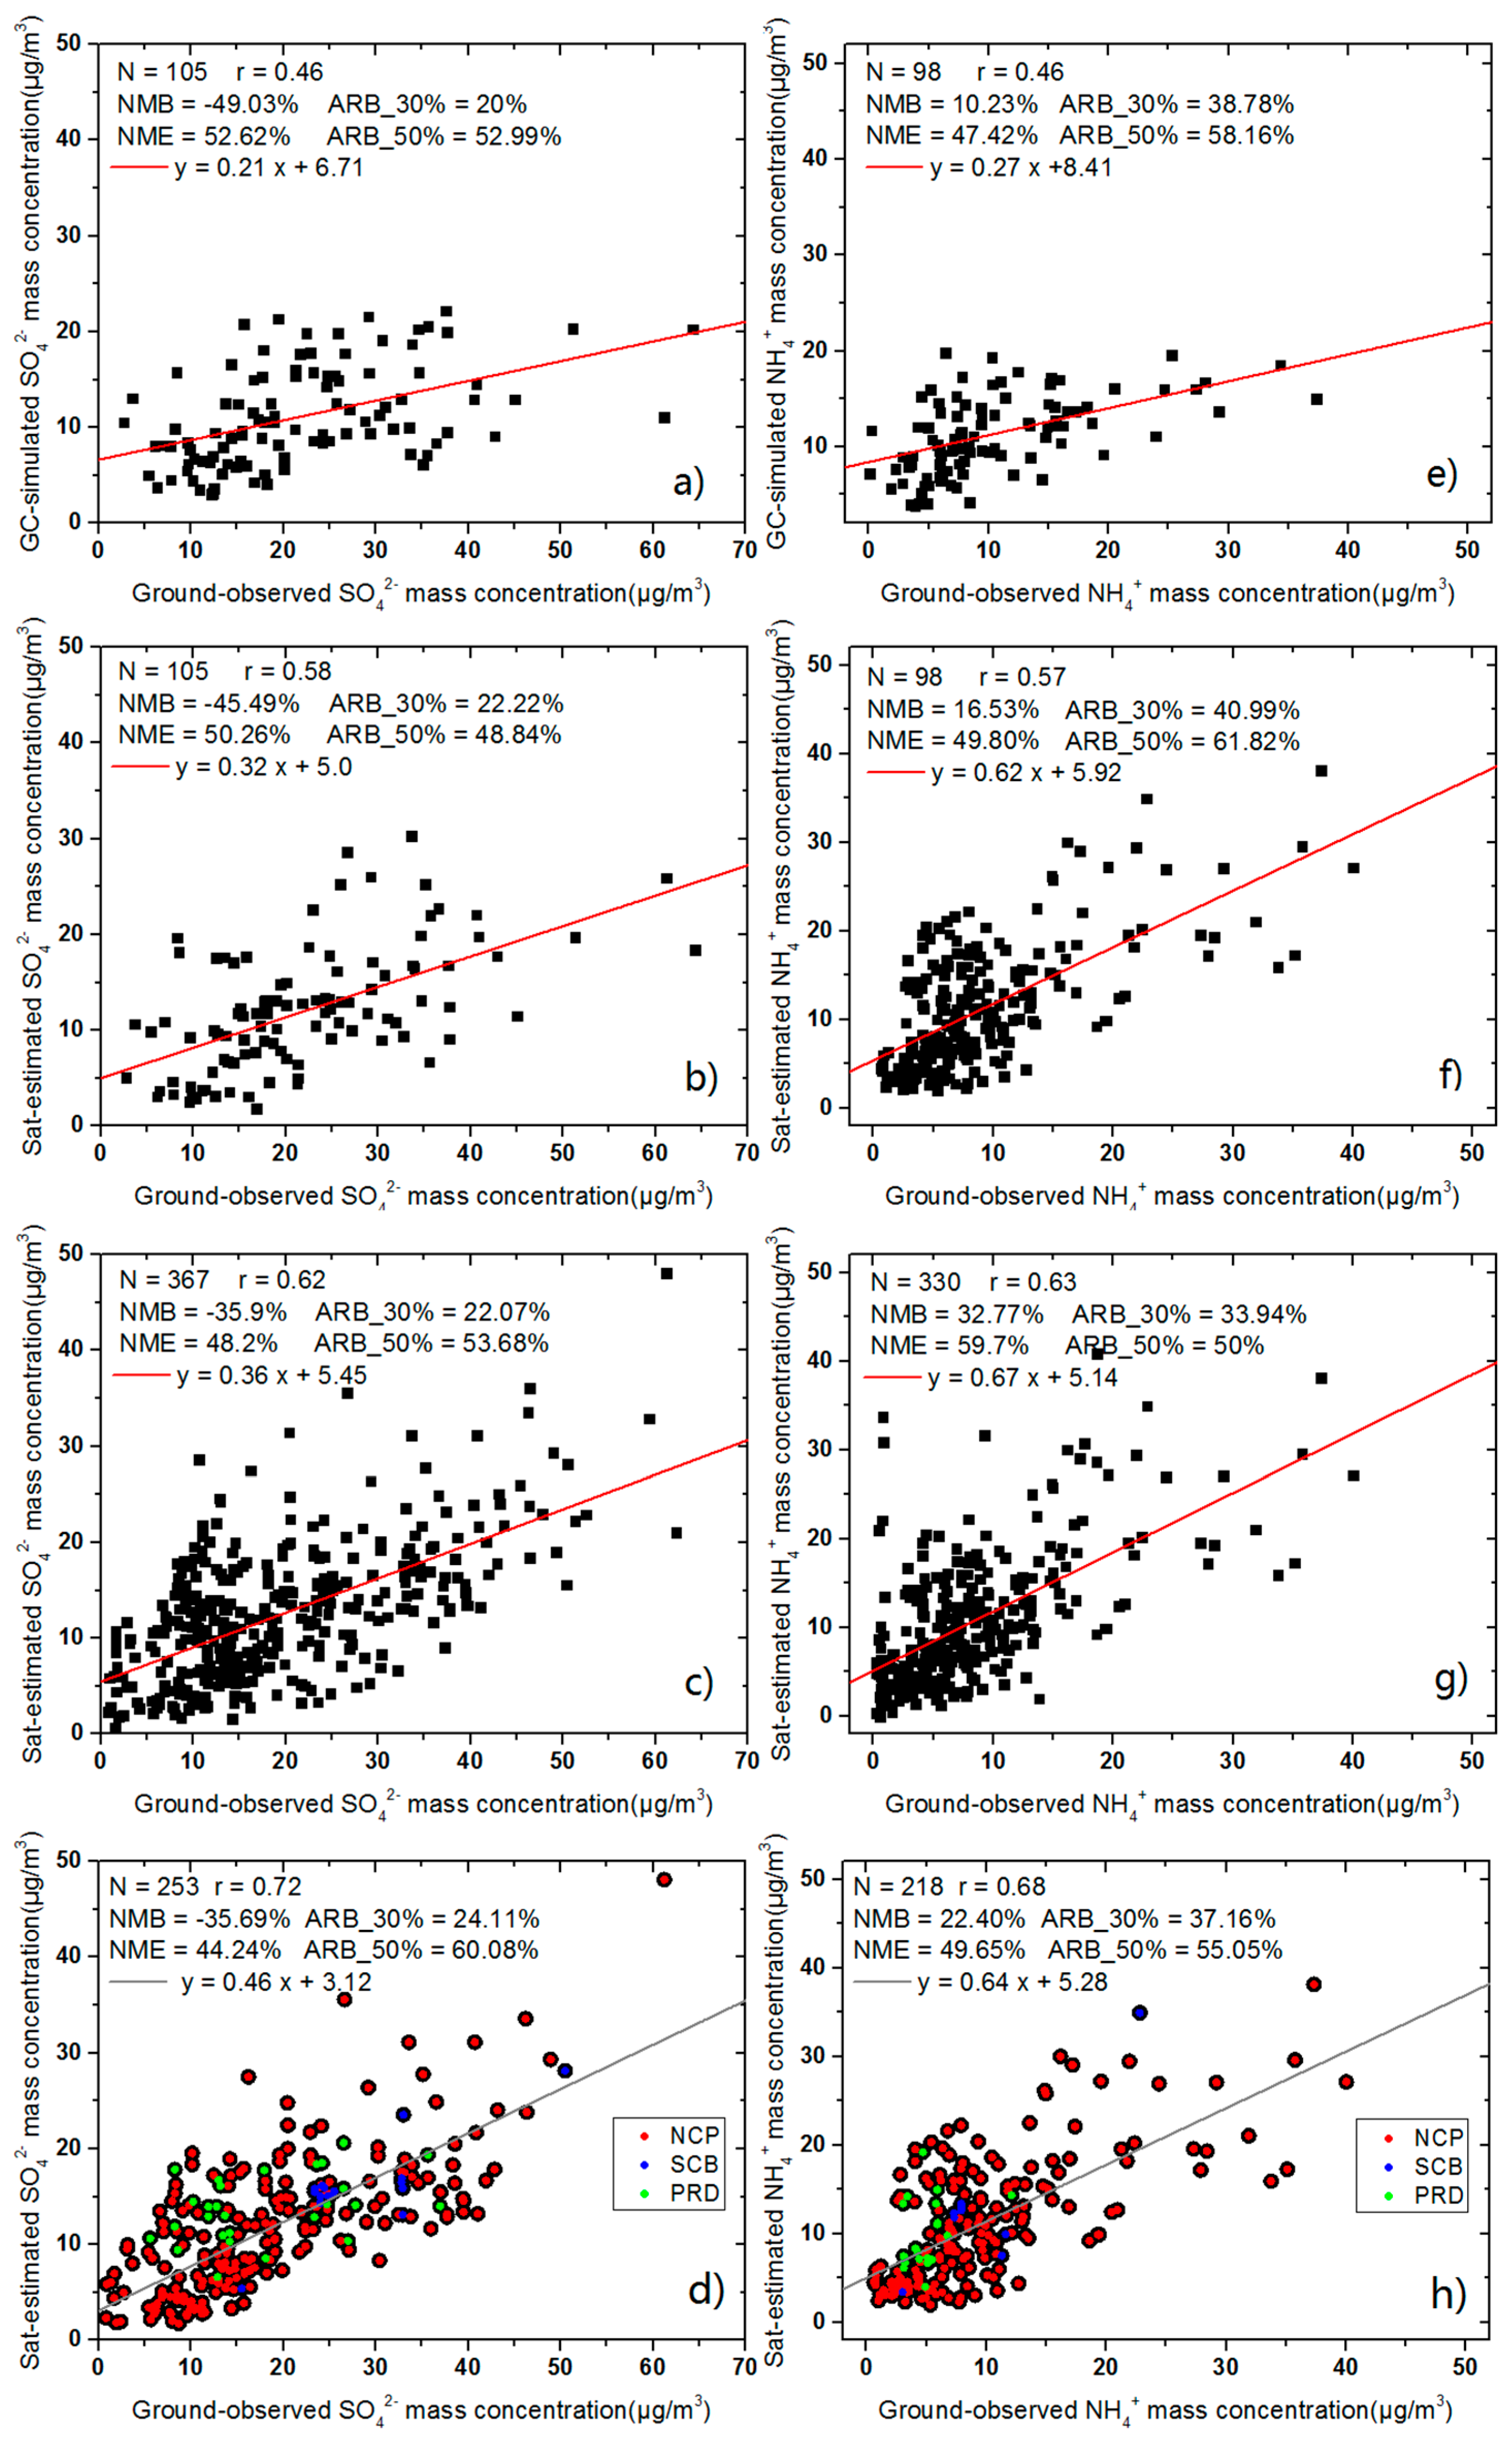
According to the resolution of model, first, satellite-derived SO42− and model simulations were compared with in situ data as shown in Figure 3a,b, respectively; the same results are shown for NH4+ in Figure 3e,f. There were only 105 matched records of SO42− concentration over China from 2004 to 2014. The linear regression in Figure 3a showed the following values: r = 0.46, slope = 0.21 and intercept = 6.71 μg/m3. Satellite-estimated SO42− concentrations in this study showed good agreement with ground observations, achieving a slightly higher slope (0.32), lower intercept (5.0 μg/m3) and r value of 0.58. Although the NMB and NME values of both the GC-Ground and Sat-Ground comparisons were large, the comparison between satellite-derived and ground-observed SO42− mass concentrations exhibited slight increases in NMB and NME of 3.74% and 2.36%, respectively. Similarly, the percentage of satellite-derived records increased by 2.22%, but model simulations performed better ARB_0.5 values (GC: 52.99%; Satellite: 48.84%). The same information appeared in Figure 3e,f with 98 matched records is similar as in 3a,b, respectively, but for NH4+. Compared with the model simulations, the satellite retrievals were more consistent with the ground measurements (r: 0.57; slope: 0.62; intercept: 5.92). The comparison of NMB (GC: 10.23%; Satellite: 16.53%) and NME (GC: 47.42%; Satellite: 49.80%) indicated a lower divergence of the model simulations, whereas the ARB_0.3 (40.99%) and ARB_0.5 (61.82%) values of the satellite retrievals were slightly improved relative to those of the model simulations (ARB_0.3: 38.78%; ARB_0.5: 58.16%).
Although several parameters of the satellite-derived results obtained at a resolution of 2 × 2.5° performed better than those of the model results, they were not enough to demonstrate the availability of satellite retrievals using the ratio of chemical component concentrations to total PM2.5 concentrations based on GC. The comparisons between satellite estimations and ground measurements at a resolution of 0.1 × 0.1° are presented in Figure 3c for SO42− and Figure 3g for NH4+ using all samples in China. The number of matched samples increased to 367 for SO42− and 330 for NH4+ along with the advancement of spatial resolution. Apparent improvements in the linear regression factors for both SO42− (r: 0.62; slope: 0.36; intercept: 5.45) and NH4+ (r: 0.63; slope: 0.67; intercept: 5.14) were observed relative to the comparisons for the coarse resolution. For our defined evaluation parameters, satellite-estimated SO42− at the finer resolution performed well relative to the results shown in Figure 3a,b, except that the ARB_30% value was higher than that shown in Figure 3a but lower than that shown in 3b; on the other hand, our estimated NH4+ in 3g behaved worse than the original results obtained at a resolution of 2 × 2.5°.
As presented in Figure 1, we concluded that most samplers of chemical concentrations were concentrated in several regions. In this analysis, four sub-regions were extracted to further validate our method: the North China Plain (NCP, 34–40°N, 112–120°E), the Sichuan Basin (SCB, 27–33°N, 102–110°E), and the Pearl River Delta (PRD, 22–25°N, 110–117°E) (indicated by the blue boxes in Figure 1, all of which exhibited distinct regional characteristics because of different natural environments and anthropogenic or other industrial emissions. Compared with the results shown in Figure 3a,b,e,f, linear regression showed that the chemical concentrations estimated in this study were more consistent with ground measurements, with r values of 0.72 and 0.68 for SO42− and NH4+, respectively. Moreover, the results were better than those obtained at the same resolution but over China (Figure 3c,g, respectively). Regarding the statistical parameters, the NMB, NME and ARB_values of SO42− were significantly improved, especially relative to the model results, whereas those of NH4+ were slightly worse than both the satellite estimations and model simulations obtained at a coarse resolution but better than the comparisons made at a finer resolution over China. In addition, for the NCP region, the satellite-derived data had relatively small bias with respect to SO42− but overestimated NH4+ values. For the southern region, both satellite retrievals underestimated SO42− concentrations but overestimated NH4+ concentrations. The overestimation of satellite-derived NH4+ concentrations over China mainly resulted from the larger fraction of GEOS-Chem simulated NH4+, in agreement with previous studies [37,38,39]. Overall, the satellite-derived concentrations at each resolution (2 × 2.5° and 0.1 × 0.1°) showed improvements over the model-simulated concentrations.
3.3. Spatial-Temporal Variations in PM2.5 Chemical Components
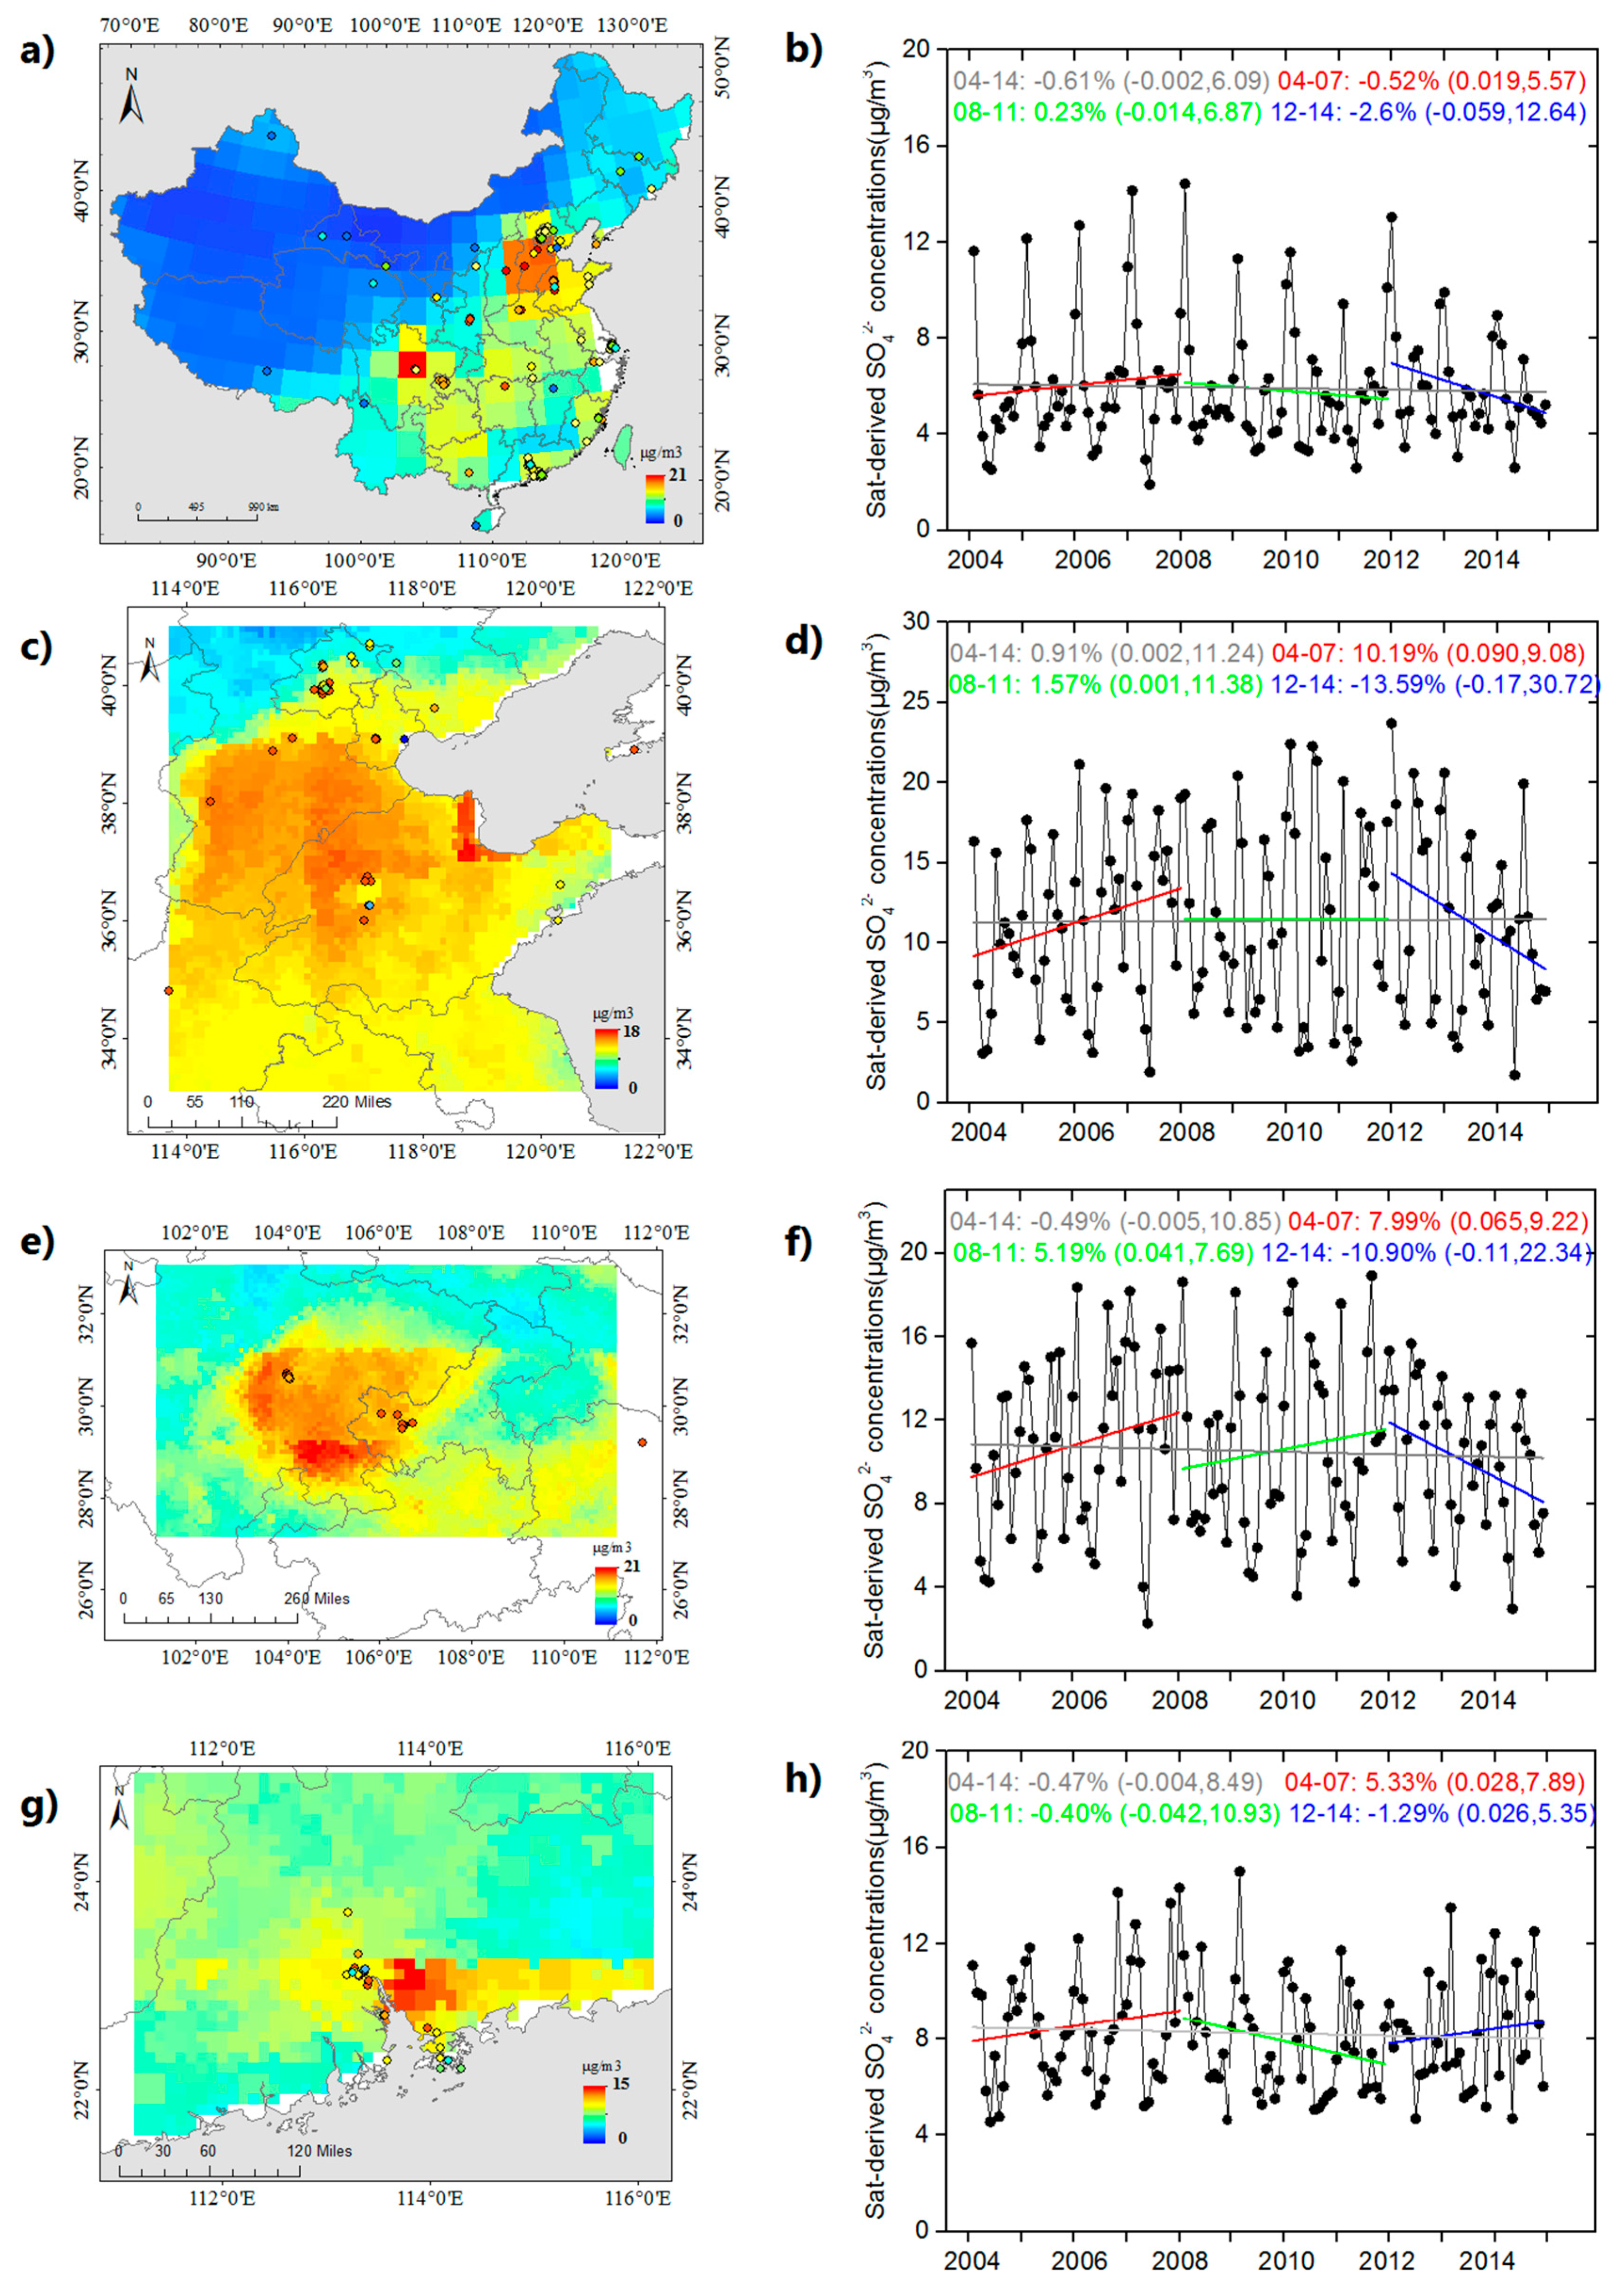
The left side of Figure 4 presents the spatial patterns of 11-year mean sulfate estimations (2004–2014) at different resolutions in China (Figure 4a) and the NCP (Figure 4c), SCB (Figure 4e) and PRD (Figure 4g). China showed an overall decreasing trend of 0.61% per year for SO42− concentration during the period 2004–2014. A negative trend of 0.52% per year was observed in 2004–2007, followed by a positive trend of 0.23% per year in 2008–2011, and a decreasing trend of 2.6% per year was observed in 2012–2014. To our knowledge, the growth of the Chinese economy over the past two decades has been mainly driven by rapid industrialization and urbanization, accompanying by large increases in in both electricity generation and the number of vehicles on roads [40]. The sources of SO2 emission mainly came from coal-fired power plants, industry, transport and residential combustion, and volcanic eruption [41]. As indicated by Geng et al., this reduction was mainly driven by power plants. Although the increasing electricity demand tended to increase SO2 emissions during the period 2005–2011, the reduced SO2 emission factor (EF) completely reversed SO2 emissions in the power sector, causing them to decrease at a rate of 1.4 Tg/year. The same decrease in sulfate concentration was confirmed by Li et al., who demonstrated a recent large reduction in sulfur oxide emissions from Chinese power plants based on satellite observations [42]. The 11-year mean SO42− estimations over China were characterized by distinct geographical differences, with sparsely populated, underdeveloped economies on the western side of the classic Heihe-Tengchong Line but a high-population-density, relatively prosperous development on the eastern side. Regarding the satellite-derived sulfate results (Figure 4a), the highest values over China were located in the SCB, followed by those in the NCP and the PRD, which were similar not only to the overlaid ground measurements but also to regional variations in satellite-observed tropospheric SO2 (SO2 vertical column density, VCD_SO2) obtained using OMI from 2005 to 2014 [43] and using the 2004–2009 SCIAMACHY [44]. As a major contributor to these results, the geographical patterns of sulfate concentrations were in agreement with the total PM2.5 estimations conducted by Ma et al. [27].
Compared with the spatial distribution at the coarse resolution, Figure 4c,e,g show finer regional patterns and similar variations in the corresponding region in Figure 4a. Zhang et al. analyzed 10-year (2005–2014) average VCD_SO2 values in Henan Province using OMI at a resolution of 2.5 × 2.5°. Our results showed a low bias of variation (Figure 4c), particularly in the northern areas [43]. Specifically, our estimations in the NCP generally exceeded 12 μg/m3; in order of decreasing concentration, areas ranked as follows: Hebei, Shandong, Henan and Beijing. The spatial patterns of in situ measurements in the SCB were well captured by the satellite-based data, with concentrations increasing because of anthropogenic pollution sources in Chengdu and adjacent cities (Figure 4e). The maximum values over the PRD were located only south of Guangzhou, in areas such as Dongguan and surrounded cities, whereas most concentrations generally reached 8–10 μg/m3. The overlying solid circles indicate that better consistency with satellite estimations was achieved in Hong Kong, although some bias was observed in the downtown area.
Figure 4b,d,f present monthly sulfate concentrations in the NCP, SCB and PRD, respectively, from 2004 to 2014 at a resolution of 0.1 × 0.1°. The results presented significant regional variability, especially at the inflection points, where concentrations begin to decrease or rebound, and at the maxima over these regions. Specifically, the SCB (−0.49%) and the PRD (−0.47%) exhibited an overall decreasing trend each year during the period 2004–2014, whereas the NCP showed an overall positive trend of 0.91% per year. Regarding the inter-annual variations, a distinct increasing trend was observed in 2004–2007, followed by a relatively gentle positive trend in 2008–2011, which ended in a sharply decreasing trend in both the NCP and SCB. For comparison, SO2 loading over the NCP peaked in 2007, and then exhibited decreasing trend during the following period but rebounded in 2011, despite relatively large year-to-year variations [45]. The PRD exhibited similar inter-annual variations in 2004–2007 and 2012–2014 but presented a decreasing trend of 0.40% per year from 2008 to 2011. Overall, desulfurization regulations aimed to reduce SO2 emissions was the primary contributor to the sulfate concentration reduction [46]. Our results suggest that the decline in sulfate concentration was generally most pronounced during the 12th Five Year Plan (2011–2015), particularly in the NCP (−13.59%) and SCB (−10.90%). Much less heating was needed in the PRD, and coal combustion was derived mainly from coal-fired power plants. It was therefore likely that the mandatory installation of flue-gas desulfurization measures in power plants had taken effect from 2010, the last year in the 11th Five Year Plan (2006–2010). However, Zhao et al. demonstrated that sulfate concentrations decreased throughout most of China, with the largest reduction occurring in the NCP but improvements observed in the SCB and parts of the PRD and Eastern Hubei based on an emission inventory of SO2, NOx, PM10, PM2.5, BC, OC, NMVOC, and NH3 over China for the years 2005–2010 [47]. It is likely that Zhao et al. employed the integrated emission inventory developed by Wang et al. [48], whereas anthropogenic emissions over China used in our model were obtained from MEIC inventory, resulting in different patterns in different geographical regions, particularly the NCP. Moreover, chemical reactions between sulfate and surrounding matter in the air may lead to differences between satellite-estimated sulfate concentrations and direct emissions.
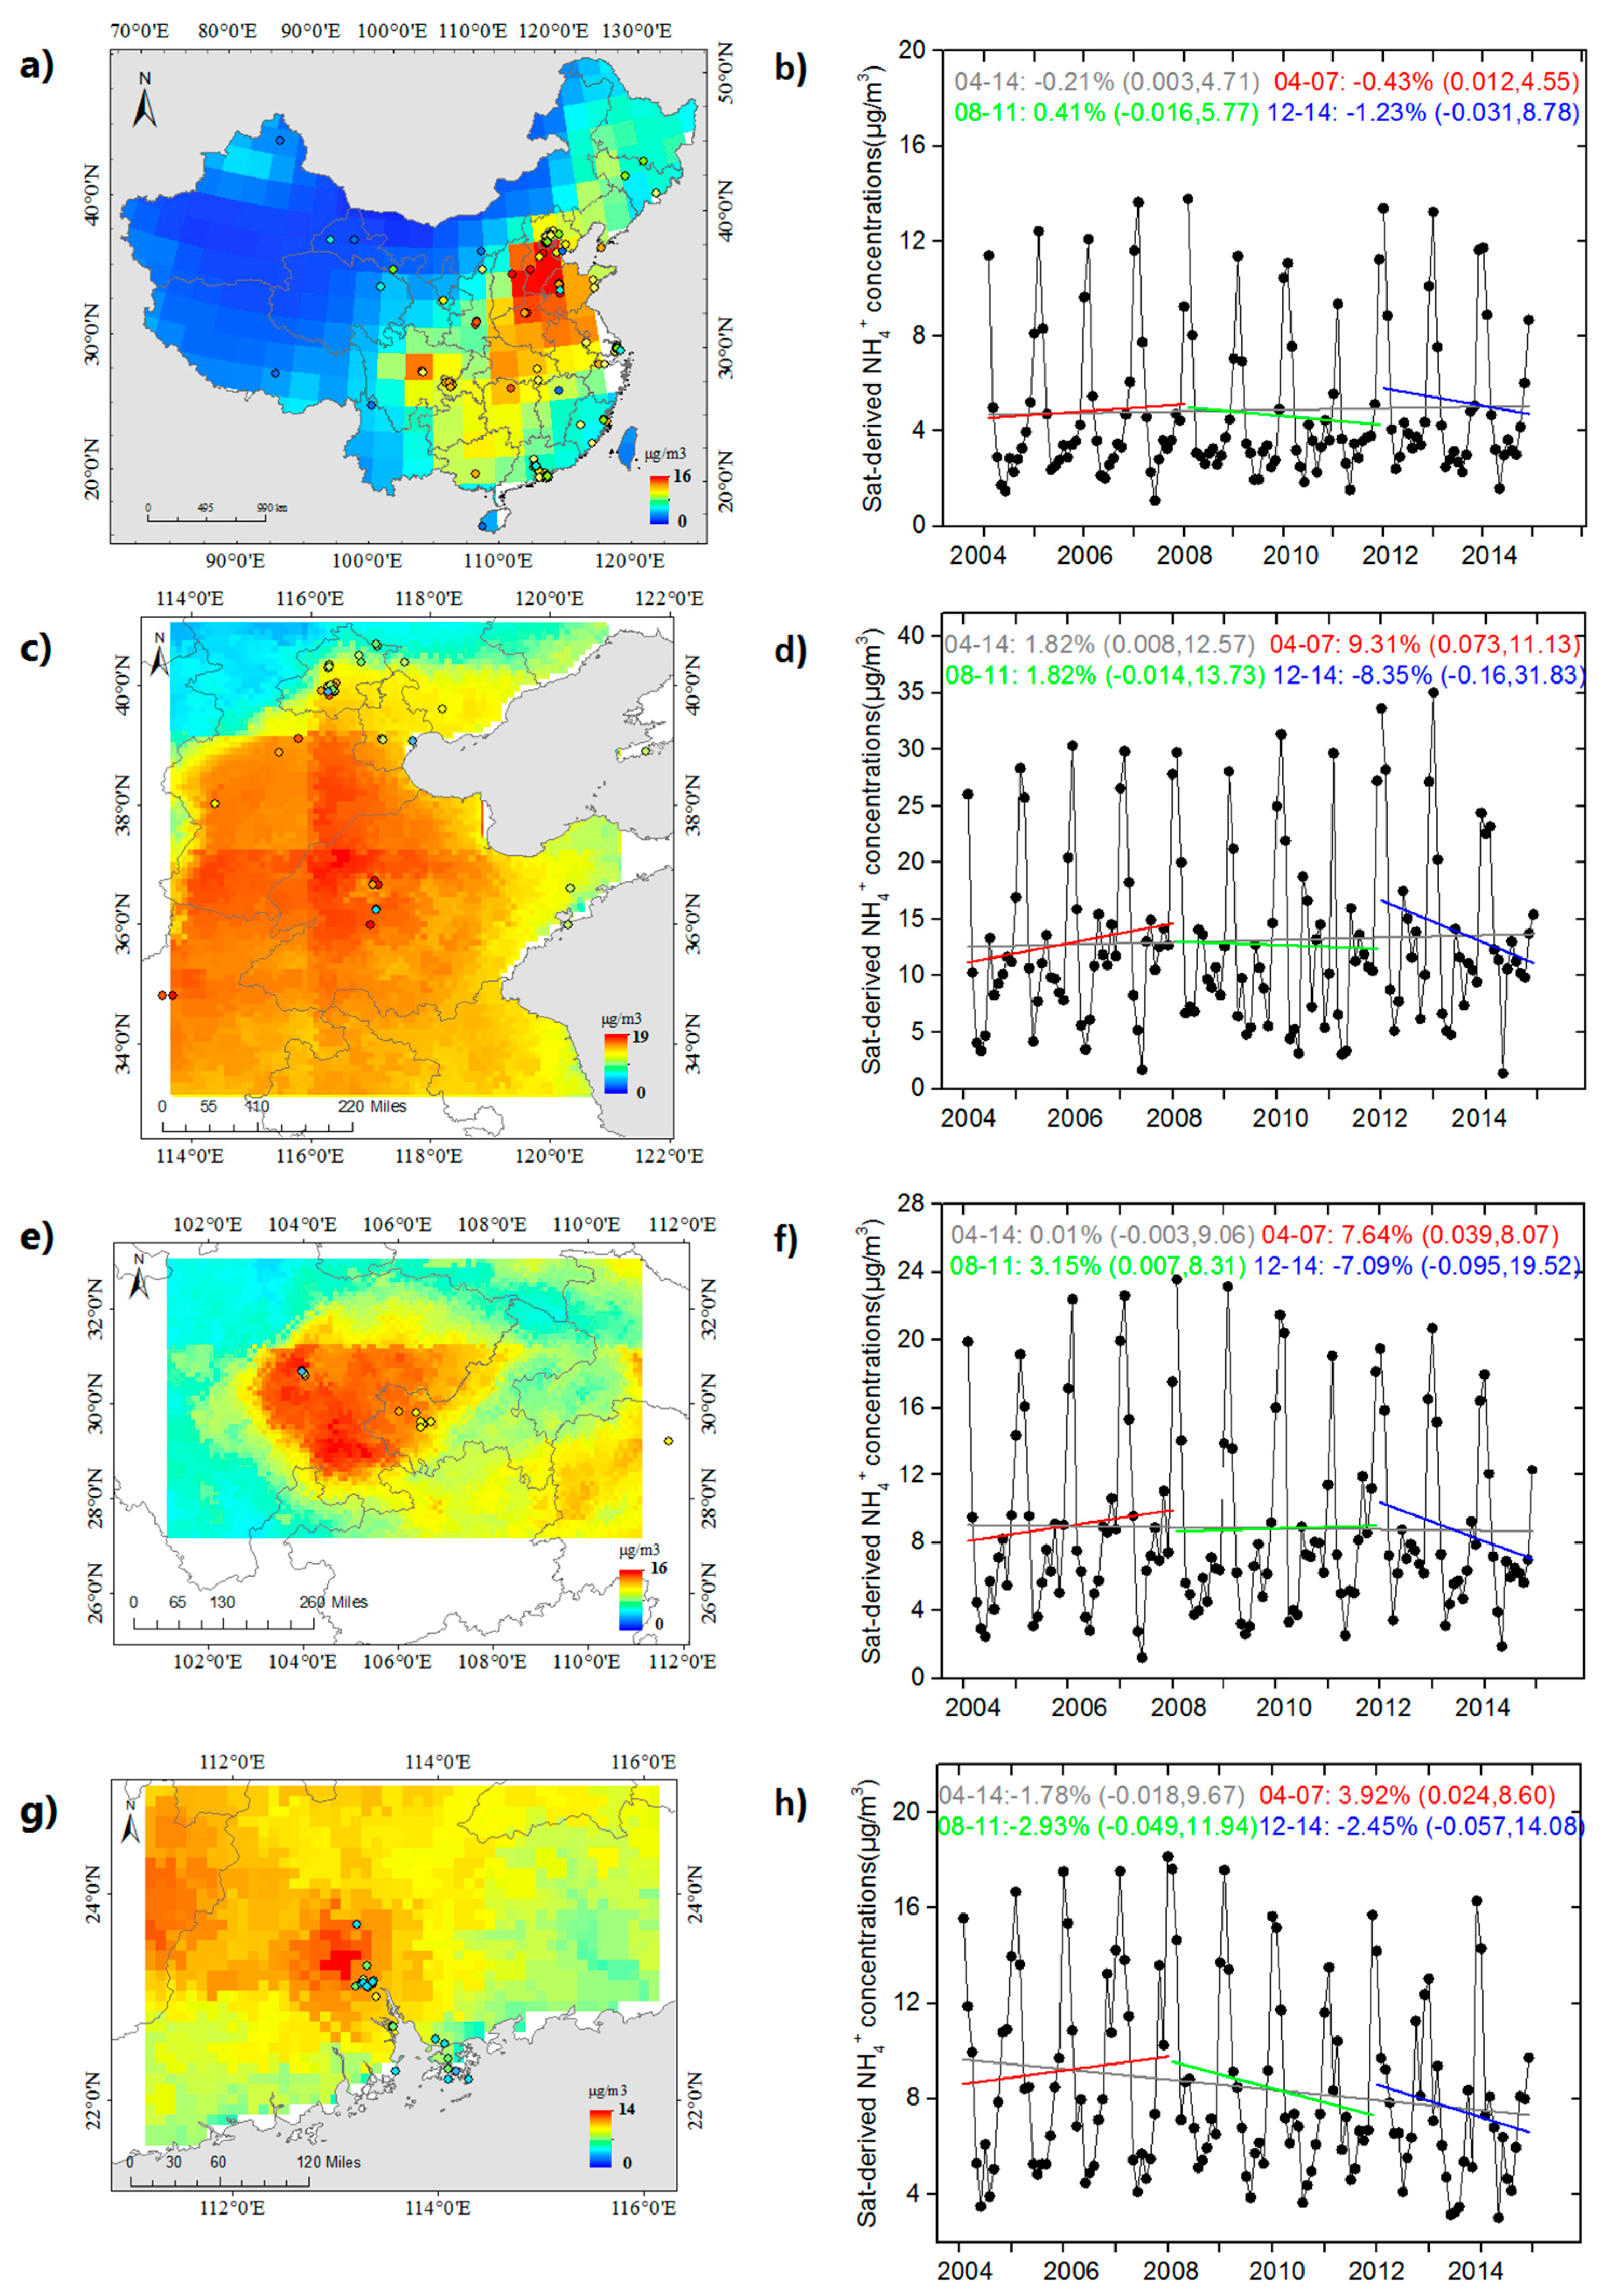
The spatial distributions and time series of ammonium concentrations are shown in Figure 5. On the national scale, the satellite-derived ammonium concentrations exhibited an overall negative trend of 0.21% per year during the study period; a positive trend of 0.41% occurred in 2008–2011, whereas a decreasing trend of 0.43% per year was observed in 2004–2007, followed by a negative annual trend in 2012–2014. The geographical patterns of the 11-year annual ammonium concentrations also indicated heavily pollution in the east and relatively clean air in the west. Regardless of resolution, we concluded that sulfate had greater relative importance in the composition of secondary inorganic aerosols (sulfate, nitrate and ammonium, SNA) and total PM2.5 concentrations than ammonium in China, except in the NCP. For the national distribution captured at a resolution of 2 × 2.5°, the highest values were observed in the NCP, the entire provinces of Henan and Hubei, and the north of Hunan Province, which shows a high population density and increasing economic expansion, reflecting the slightly different emission characteristics of sulfate and ammonium. Previous studies have concluded that these high regional concentrations were caused by agricultural activities [49,50,51]. The regional variations among the NCP, SCB and ZSJ coincide with those observed by Warner et al., who analyzed 13-year average ammonia concentrations from September 2002 through August 2015 based on data from the Atmospheric Infrared Sounder (AIRS) [52]. Relative to overlaid ground measurements, the higher NH4+ fraction simulated by the model caused a relative overestimation of the satellite estimations over these polluted regions. The same NH4+ fractions yielded by the model were used to obtain the satellite-estimated concentrations at a resolution of 0.1 × 0.1°; therefore, the problem of overestimation persisted. The concentration distributions of sulfate (Figure 4e) and ammonium (Figure 5e) over the SCB showed some similarities. High ammonium values in the PRD were mainly concentrated at the center of Guangzhou and some cities located in the northwest of this region.
Time series of monthly satellite-derived ammonium concentrations in three sub-regions exhibited similar increasing/decreasing trends during our defined time ranges compared with those obtained for sulfate in the corresponding regions. Overall, only the PRD presented a downward trend of 1.78% per year from 2004 to 2014. Concentrations in the SCB remained practically unchanged, varying at a rate of 0.01% per year with an intercept near 0. Concentrations in the NCP, on the other hand, increased at a rate of 1.82% per year. Within the different time ranges, the magnitudes of the positive or negative trends observed for ammonium concentrations were lower than those observed for sulfate. Although satellite-estimated ammonium concentrations in China or specific regions presented negative or slightly increasing trends during the period 2004–2014, the effect of NH3 emission or NH4+ on other pollutants was still significant. As indicated by Zhao et al., the concentrations of SIA and the extinction coefficient increased in most of China, implying that NH3 emission should be reduced simultaneously in China.
3.4. Seasonal Variations in PM2.5 Chemical Components
Figure 6 and Figure 7 present the seasonal distribution of the satellite-derived sulfate and ammonium concentrations, respectively, at a resolution of 2 × 2.5° over China from 2004 to 2014. Overall, the distribution of both the sulfate and ammonium concentrations presented seasonal variations, with concentrations ranking as follows: winter > summer > autumn > spring. The maximum sulfate concentration was 25 μg/m3 in winter, lower than the maximum ammonium concentration (30 μg/m3). Several publications have shown that SNA generally ranks in the order of sulfate > ammonium > nitrate, for example, in Nanjing [53], in Beijing [54], and over the Jing-Jin-Ji urban agglomeration [23]. Therefore, our conclusions that the overestimation of NH4+ concentrations and underestimation of SO42− concentrations were caused by the overestimation/underestimation of the fractions simulated from GEOS-Chem are further confirmed. As shown in Figure 6, the high concentrations were primarily located over the NCP and the SCB throughout the entire year, especially in winter and summer. Based on the designated pollution sources, sulfate concentrations were derived not only from the SO2 emissions of multiple industries, but from secondary generation, affected by interactions in gas-phase or liquid-phase chemical processes. The sulfur oxidation ratio (SOR) can clearly indicate secondary transformation processes. In particular, high SOR values suggest that the photochemical oxidation of precursor gases has led to the formation of large proportions of sulfate [55,56]. Li et al. concluded that SOR values in summer and autumn were higher than those in spring and winter over the Jing-Jin-Ji urban agglomeration region [23]. In this analysis, however, we found that Beijing exhibited seasonal characteristics, with higher sulfate and ammonium concentrations in summer than in autumn and winter. Therefore, it is likely that the mandatory installation of desulfurization devices made certain effects [57]. Photochemical reactions occurring in summer and the combination of slightly higher NH4+ and SO42− concentrations [58] were also important. High relative humidity and strong solar radiation also greatly accelerated the generation of SNA. For example, most southern regions with unfavorable weather conditions showed ion concentrations that were generally higher in winter than in other seasons, such as Guangzhou. In addition, surface topography is an important factor constraining pollutant dispersion. For example, the satellite-derived sulfate concentrations over the SCB were the highest in winter and autumn.
A hand of studies have concluded that the tropospheric ammonia distribution indicated by satellite data is higher in summer and spring than in autumn and winter [52,59]. This conclusion was also drawn by Liu et al., who obtained ground NH3 concentrations in China based on satellite column density using a CTM [60]. Moreover, Liu et al. concluded that the seasonal ground NH3 concentrations were in agreement with the seasonal patterns of NH3 emissions in China indicated by Kang et al. [61], Huang et al. [62], and Xu et al. [63]. As shown in Figure 7, our seasonal patterns do not conform to those reported in the abovementioned studies but are well consistent with the estimations reported by Geng et al. It is likely that the discrepancies in seasonal characteristics are attributed to the following factors. First, ground ammonium occurred in the form of ions though gas-phase and aqueous-phase reactions with acidic species (e.g., H2SO4, HNO3 and HCl), producing differences relative to data obtained from satellite-derived tropospheric column density, other ground-level NH3 concentrations, or direct emissions. Moreover, although NH3 as a precursor is strongly correlated to ground NH4+ concentrations, the processes of secondary transformation and generation are strongly affected by meteorological parameters, such as temperature, wind speed, humidity, and precipitation. Although no quantitative analysis has been dedicated to examining the effects on NH4+ concentrations on a national scale, or the corresponding seasonal patterns, several studies have shown that effluent NH3 interacts with various substances in the air, resulting in the frequent combined pollution, especially in winter. For example, the concentrations observed in the northeast regions and the north of Xinjiang reached 10–20 μg/m3 whereas those observed during the three other seasons were very low. By analyzing the material balance of NH4+, Lai et al. found that ammonium mainly occurred in the form of (NH4)2SO4 and NH4NO3 in winter, whereas it occurred as NH4HNO3 and NH4NO3 throughout the rest of the year [64]. Regarding the overall spatial distribution of the satellite-derived ammonium concentrations, we concluded that high values mainly occurred in the NCP, the SCB, and the provinces of Hubei and Hunan. From the perspective of source appointment, these regions are large agricultural provinces with developed grain production and livestock farming. For example, the NCP has been referred to as “China’s granary” because it provides 40% and 25% of China’s wheat and corn production, respectively, on 3.3% of the nation’s surface area [51]. Furthermore, livestock farming and fertilizer application account for 85% of ammonium emissions over the SCB. A host of evidence shows that agricultural sources contributed a major portion of NH3 emissions, approximately 80–90% of total anthropogenic emission [65]. Certain regions exhibit different seasonal characteristics, such as Guangzhou and the SCB, where autumn concentrations are higher than summer concentrations. This trend coincides with the growth cycle of crops, with straw burning occurring mainly during the harvest season. With respect to Jiangsu, the representative city of Jiangsu Province, our results are not consistent with those of Wang et al. [53], who concluded that water-soluble ions showed seasonal characteristics (i.e., winter > spring > autumn > summer). The model-simulated fractions likely require further improvement.
3.5. Uncertainties Analysis
Notably, every variable employed in our method had some uncertainties, thus propagating error between these variables. Overall, the national relative uncertainties of the satellite dataset obtained at a resolution of 2 × 2.5° were estimated to be 34.17% for sulfate and 16.71% for ammonium, whereas those at 10 km presented a slight improvement for sulfate (25.65%) and a degradation of 23.46% for ammonium. This finding indicates that our results exhibited higher reliability with the improvement of satellite-based resolution; in other words, the satellite estimations were hampered by the model’s coarse resolution of 2 × 2.5°. Regarding the anthropogenic polluted regions on which we concentrated in this analysis, the relative uncertainties in both sulfate and ammonium concentrations were significantly improved, i.e., 25.49% for sulfate and 16.25% for ammonium. As shown in Figure 1, most ground-observation stations were located in developed areas; thus, it was likely that instrument maintenance and calibration in the NCP, SCB and PRD increased the robustness of our study. The lack of ground truths for chemical composition and quality assurance contributed to our relatively high uncertainties. Additionally, a new mechanism of haze formation shows that the effect of other compositions on sulfate or ammonium is not negligible. For example, coexistence with NOx can reduce the environmental capacity for SO2, leading to the rapid conversion of SO2 to sulfate because NO2 and SO2 have a synergistic effect when they react on the surface of mineral dust [66].
4. Conclusions
The SO42− and NH4+ chemical composition of ambient PM2.5 in China was estimated from satellite-derived PM2.5 data for the period 2004–2014, during which no national ground measurements had yet been established. In this study, we employed the fractions of CTM-simulated chemical compositions and PM2.5. Good agreement was found between the estimated concentrations and ground measurements obtained from the literature. Due to the finer resolution of satellite-derived PM2.5 data, we further examined satellite-estimated sulfate and ammonium concentrations at 10 km × 10 km in anthropogenic polluted regions. Linear regression analysis and relevant evaluation parameters demonstrated that the satellite-derived concentrations obtained at the improved resolution were more in line with in situ observations.
We analyzed the spatial distribution of 11-year annual average satellite-derived SO42− and NH4+ concentrations and time series of monthly average concentrations based on satellite-derived datasets. On the national scale, both exhibited an annual decreasing trend during the period 2004–2014 (SO42−: −0.61%; NH4+: −0.21%), with high values mainly concentrated in the NCP and SCB. At finer resolution, satellite-derived sulfate values in these three regions were more consistent with the ground-based results, whereas ammonium concentrations generally showed a high bias relative to the ground measurements. The inter-annual variation trends of sulfate and ammonium were positive in 2004–2007 and 2008–2011, respectively, followed by a negative trend in 2012–2014, and the magnitudes of the variations in sulfate concentration were appreciable. Furthermore, the seasonal distributions of the 11-year satellite-derived dataset over China were evaluated. The distribution of both sulfate and ammonium varied seasonally according to the following order: winter > summer > autumn > spring. Several publications have concluded that the precursor gases SO2 and NH3 are strongly correlated with sulfate and ammonium concentrations, and researchers have examined these gases to explain the variations in sulfate and ammonium concentrations. Compared with the distribution of emission sources, high SO2 emission in the NCP and the SCB was related to increased heating during winter, and coal consumption was mainly attributed to coal-fired power plants and residential combustion. Photochemical reactions in summer may be another contributor to the trends observed in this study. NH3 is more highly emitted located in areas that participate heavily in agricultural activities during harvest seasons. To our knowledge, SO2 emissions have decreased remarkably since the government enacted stricter control measures in recent years. Based on the abovementioned analysis, we found that NH4+ plays an important role in the formation of (NH4)2SO4 and NH4NO3 due to the interaction of ions. Therefore, to efficiently control particulate air pollution in prominent urban agglomerations, we should control ammonia emissions while reducing sulfur, nitrogen and particulate matter.
The greatest limitation preventing us from examining other PM2.5 chemical components (e.g., BC and OC) was the lack of ground-based observations. The measured chemical components used in this study were mainly derived from several urban and background sites in the NCP, SCB, and PRD regions. Fewer samples and an inconsistent method of calculating BC and organic matter could have introduced uncertainties into our validation results. Further development of this study can be summarized as follows. First, we will supplement our work with more satellite-estimated PM2.5 chemical components if enough ground-observed data are available. Second, it should be noted that the current GEOS-Chem data used in our method is at a resolution of 2 × 2.5°, while a China nested grid version with 0.5 × 0.5° is already published. Although it is a time-consuming work to run the long-term high-resolution data for the whole Chinese domain, our test by a small number of GEOS-Chem nested data showed the use of high-resolution GEOS-Chem data would give very different performance, perspectives and evaluation results. In order to better support the related studies (e.g., health exposure), our on-going work is extend our method by coupling the nested GEOS-Chem data at a resolution of 0.5 × 0.5° or higher resolution in China for a long period. Third, meteorological factors, such as temperature, wind, and relative humidity, play an important role in the formation of secondary pollutants, which all contribute to greater spatial variations in the chemical components we examined; therefore, our satellite-estimated results should be integrated with these factors. And then, we plan to conduct an assessment of the long-term exposure to SO42− or NH4+ in China, aiming to enhance environmental control policy and reduce air pollution.
Supplementary Materials
The following are available online at www.mdpi.com/2072-4292/9/8/817/s1, Table S1: Ground measurements collected from publications.
Acknowledgments
This work was supported by the National Natural Science Foundation of China (Grant No. 91543128 and 41471367), and the National Key R&D Program of China (2016YFC0201507).
Author Contributions
Y.S. and S.L. conceived the idea; S.L. and L.C. provided the design of total content; Y.S. and C.Y. processed the data and discussed the analysis section; W.Z. conducted the collection of ground-based chemical components data; Y.S. and W.Z. conducted the validation; Y.S., S.L., L.C. and C.Y. contributed to the writing and revisions.
Conflicts of Interest
The authors declare no conflict of interest.
References
- De Keijzer, C.; Agis, D.; Ambros, A.; Arevalo, G.; Baldasano, J.M.; Bande, S.; Barrera-Gomez, J.; Benach, J.; Cirach, M.; Dadvand, P.; et al. The association of air pollution and greenness with mortality and life expectancy in Spain: A small-area study. Environ. Int. 2017, 99, 170–176. [Google Scholar] [CrossRef] [PubMed]
- Cesaroni, G.; Badaloni, C.; Gariazzo, C.; Stafoggia, M.; Sozzi, R.; Davoli, M.; Forastiere, F. Long-term exposure to urban air pollution and mortality in a cohort of more than a million adults in Rome. Environ. Health Perspect. 2013, 121, 324–331. [Google Scholar] [CrossRef] [PubMed]
- Ocskay, R.; Salma, I.; Wang, W.; Maenhaut, W. Characterization and diurnal variation of size-resolved inorganic water-soluble ions at a rural background site. J. Environ. Monit. 2006, 8, 300–306. [Google Scholar] [CrossRef] [PubMed]
- Qiao, L.P.; Cai, J.; Wang, H.L.; Wang, W.B.; Zhou, M.; Lou, S.R.; Chen, R.J.; Dai, H.X.; Chen, C.H.; Kan, H.D. PM2.5 constituents and hospital emergency-room visits in Shanghai, China. Environ. Sci. Technol. 2014, 48, 10406–10414. [Google Scholar] [CrossRef] [PubMed]
- Bell, M.L.; Ebisu, K.; Leaderer, B.P.; Gent, J.F.; Lee, H.J.; Koutrakis, P.; Wang, Y.; Dominici, F.; Peng, R.D. Associations of PM2.5 constituents and sources with hospital admissions: Analysis of four counties in Connecticut and Massachusetts (USA) for persons ≥65 years of age. Environ. Health Perspect. 2014, 122, 138–144. [Google Scholar] [CrossRef] [PubMed] [Green Version]
- Cao, J.J.; Xu, H.M.; Xu, Q.; Chen, B.H.; Kan, H.D. Fine particulate matter constituents and cardiopulmonary mortality in a heavily polluted Chinese city. Environ. Health Perspect. 2012, 120, 373–378. [Google Scholar] [CrossRef] [PubMed]
- Son, J.Y.; Lee, J.T.; Kim, K.H.; Jung, K.; Bell, M.L. Characterization of fine particulate matter and associations between particulate chemical constituents and mortality in Seoul, Korea. Environ. Health Perspect. 2012, 120, 872–878. [Google Scholar] [CrossRef] [PubMed]
- Cao, J.J.; Shen, Z.X.; Chow, J.C.; Watson, J.G.; Lee, S.C.; Tie, X.X.; Ho, K.F.; Wang, G.H.; Han, Y.M. Winter and summer PM2.5 chemical compositions in fourteen Chinese cities. J. Air Waste Manag. Assoc. 2012, 62, 1214–1226. [Google Scholar] [CrossRef] [PubMed]
- Liu, Y.; Sarnat, J.A.; Coull, B.A.; Koutrakis, P.; Jacob, D.J. Validation of multiangle imaging spectroradiometer (MISR) aerosol optical thickness measurements using aerosol robotic network (AERONET) observations over the contiguous United States. J. Geophys. Res. Atmos. 2004, 109. [Google Scholar] [CrossRef]
- Van Donkelaar, A.; Martin, R.V.; Brauer, M.; Kahn, R.; Levy, R.; Verduzco, C.; Villeneuve, P.J. Global estimates of ambient fine particulate matter concentrations from satellite-based aerosol optical depth: Development and application. Environ. Health Perspect. 2010, 118, 847–855. [Google Scholar] [CrossRef] [PubMed]
- Chu, D.A.; Tsai, T.C.; Chen, J.P.; Chang, S.C.; Jeng, Y.J.; Chiang, W.L.; Lin, N.H. Interpreting aerosol lidar profiles to better estimate surface PM2.5 for columnar aod measurements. Atmos. Environ. 2013, 79, 172–187. [Google Scholar] [CrossRef]
- Zhang, Y.; Li, Z.Q. Remote sensing of atmospheric fine particulate matter (PM2.5) mass concentration near the ground from satellite observation. Remote Sens. Environ. 2015, 160, 252–262. [Google Scholar] [CrossRef]
- Wang, J.; Christopher, S.A. Intercomparison between satellite-derived aerosol optical thickness and PM2.5 mass: Implications for air quality studies. Geophys. Res. Lett. 2003, 30. [Google Scholar] [CrossRef]
- Liu, Y.; Sarnat, J.A.; Kilaru, A.; Jacob, D.J.; Koutrakis, P. Estimating ground-level PM2.5 in the Eastern United States using satellite remote sensing. Environ. Sci. Technol. 2005, 39, 3269–3278. [Google Scholar] [CrossRef] [PubMed] [Green Version]
- Philip, S.; Martin, R.V.; van Donkelaar, A.; Lo, J.W.H.; Wang, Y.X.; Chen, D.; Zhang, L.; Kasibhatla, P.S.; Wang, S.W.; Zhang, Q.; et al. Global chemical composition of ambient fine particulate matter for exposure assessment. Environ. Sci. Technol. 2014, 48, 13060–13068. [Google Scholar] [CrossRef] [PubMed]
- Li, S.S.; Yu, C.; Chen, L.F.; Tao, J.H.; Letu, H.; Ge, W.; Si, Y.D.; Liu, Y. Inter-comparison of model-simulated and satellite-retrieved componential aerosol optical depths in China. Atmos. Environ. 2016, 141, 320–332. [Google Scholar] [CrossRef]
- Li, S.S.; Garay, M.J.; Chen, L.F.; Rees, E.; Liu, Y. Comparison of geos-chem aerosol optical depth with AERONET and MISR data over the contiguous United States. J. Geophys. Res. Atmos. 2013, 118, 11228–11241. [Google Scholar] [CrossRef]
- Van Donkelaar, A.; Martin, R.V.; Park, R.J. Estimating ground-level PM2.5 using aerosol optical depth determined from satellite remote sensing. J. Geophys. Res. Atmos. 2006, 111. [Google Scholar] [CrossRef]
- Geng, G.N.; Zhang, Q.; Martin, R.V.; van Donkelaar, A.; Huo, H.; Che, H.Z.; Lin, J.T.; He, K.B. Estimating long-term PM2.5 concentrations in China using satellite-based aerosol optical depth and a chemical transport model. Remote Sens. Environ. 2015, 166, 262–270. [Google Scholar] [CrossRef]
- Saide, P.E.; Carmichael, G.R.; Liu, Z.; Schwartz, C.S.; Lin, H.C.; da Silva, A.M.; Hyer, E. Aerosol optical depth assimilation for a size-resolved sectional model: Impacts of observationally constrained, multi-wavelength and fine mode retrievals on regional scale analyses and forecasts. Atmos. Chem. Phys. 2013, 13, 10425–10444. [Google Scholar] [CrossRef]
- Chemical Composition of Ambient PM2.5 over China and Relationship to Precursor Emissions during 2005–2012. Available online: http://www.atmos-chem-phys-discuss.net/acp-2016-1187/ (accessed on 12 March 2017).
- The Website of the China Environmental Monitoring Center. Available online: http://113.108.142.147:20035/emcpublish (accessed on 12 Febraury 2017).
- Li, X.R.; Wang, L.L.; Ji, D.S.; Wen, T.X.; Pan, Y.P.; Sun, Y.; Wang, Y.S. Characterization of the size-segregated water-soluble inorganic ions in the Jing-Jin-Ji urban agglomeration: Spatial/temporal variability, size distribution and sources. Atmos. Environ. 2013, 77, 250–259. [Google Scholar] [CrossRef]
- Lin, C.Q.; Li, Y.; Yuan, Z.B.; Lau, A.K.H.; Li, C.C.; Fung, J.C.H. Using satellite remote sensing data to estimate the high-resolution distribution of ground-level PM2.5. Remote Sens. Environ. 2015, 156, 117–128. [Google Scholar] [CrossRef]
- Zheng, Y.X.; Zhang, Q.; Liu, Y.; Geng, G.N.; He, K.B. Estimating ground-level PM2.5 concentrations over three megalopolises in China using satellite-derived aerosol optical depth measurements. Atmos. Environ. 2016, 124, 232–242. [Google Scholar] [CrossRef]
- Ma, Z.W.; Hu, X.F.; Huang, L.; Bi, J.; Liu, Y. Estimating ground-level PM2.5 in China using satellite remote sensing. Environ. Sci. Technol. 2014, 48, 7436–7444. [Google Scholar] [CrossRef] [PubMed]
- Ma, Z.W.; Hu, X.F.; Sayer, A.M.; Levy, R.; Zhang, Q.; Xue, Y.G.; Tong, S.L.; Bi, J.; Huang, L.; Liu, Y. Satellite-based spatiotemporal trends in PM2.5 concentrations: China, 2004–2013. Environ. Health Perspect. 2016, 124, 184–192. [Google Scholar] [CrossRef] [PubMed]
- Olivier, J.G.J.; Bouwman, A.F.; Van der Hoek, K.W.; Berdowski, J.J.M. Global air emission inventories for anthropogenic sources of NOx, NH3 and N2O in 1990. Environ. Pollut. 1998, 102, 135–148. [Google Scholar] [CrossRef]
- Benkovitz, C.M.; Scholtz, M.T.; Pacyna, J.; Tarrason, L.; Dignon, J.; Voldner, E.C.; Spiro, P.A.; Logan, J.A.; Graedel, T.E. Global gridded inventories of anthropogenic emissions of Sulfur and Nitrogen. J. Geophys. Res. Atmos. 1996, 101, 29239–29253. [Google Scholar] [CrossRef]
- Zhang, Q.; Wang, S. A study of the atmospheric boundary layer structure during a clear day in the arid region of Northwest China. Acta Meteorol. Sin. 2009, 23, 327–337. [Google Scholar]
- Streets, D.G.; Zhang, Q.; Wang, L.T.; He, K.B.; Hao, J.M.; Wu, Y.; Tang, Y.H.; Carmichael, G.R. Revisiting China’s CO emissions after the transport and chemical evolution over the pacific (trace-p) mission: Synthesis of inventories, atmospheric modeling, and observations. J. Geophys. Res. Atmos. 2006, 111. [Google Scholar] [CrossRef]
- Yevich, R.; Logan, J.A. An assessment of biofuel use and burning of agricultural waste in the developing world. Glob. Biogeochem. Cycles 2003, 17. [Google Scholar] [CrossRef]
- Guenther, A.B.; Jiang, X.; Heald, C.L.; Sakulyanontvittaya, T.; Duhl, T.; Emmons, L.K.; Wang, X. The model of emissions of gases and aerosols from nature Version 2.1 (Megan2.1): An extended and updated framework for modeling biogenic emissions. Geosci. Model Dev. 2012, 5, 1471–1492. [Google Scholar] [CrossRef] [Green Version]
- Hudman, R.C.; Moore, N.E.; Mebust, A.K.; Martin, R.V.; Russell, A.R.; Valin, L.C.; Cohen, R.C. Steps towards a mechanistic model of global soil Nitric Oxide emissions: Implementation and space based-constraints. Atmos. Chem. Phys. 2012, 12, 7779–7795. [Google Scholar] [CrossRef] [Green Version]
- Murray, L.T.; Jacob, D.J.; Logan, J.A.; Hudman, R.C.; Koshak, W.J. Optimized regional and interannual variability of lightning in a global chemical transport model constrained by lis/otd satellite data. J. Geophys. Res. Atmos. 2012, 117. [Google Scholar] [CrossRef]
- Martin, R.V.; Sauvage, B.; Folkins, I.; Sioris, C.E.; Boone, C.; Bernath, P.; Ziemke, J. Space-based constraints on the production of Nitric Oxide by lightning. J. Geophys. Res. Atmos. 2007, 112. [Google Scholar] [CrossRef]
- Park, R.J.; Jacob, D.J.; Field, B.D.; Yantosca, R.M.; Chin, M. Natural and transboundary pollution influences on sulfate-nitrate-ammonium aerosols in the United States: Implications for policy. J. Geophys. Res. Atmos. 2004, 109. [Google Scholar] [CrossRef]
- Zhang, L.; Jacob, D.J.; Knipping, E.M.; Kumar, N.; Munger, J.W.; Carouge, C.C.; van Donkelaar, A.; Wang, Y.X.; Chen, D. Nitrogen deposition to the United States: Distribution, sources, and processes. Atmos. Chem. Phys. 2012, 12, 4539–4554. [Google Scholar] [CrossRef] [Green Version]
- Wang, Y.; Zhang, Q.Q.; He, K.; Zhang, Q.; Chai, L. Sulfate-nitrate-ammonium aerosols over China: Response to 2000–2015 emission changes of Sulfur Dioxide, Nitrogen Oxides, and Ammonia. Atmos. Chem. Phys. 2013, 13, 2635–2652. [Google Scholar] [CrossRef]
- Huang, J.P.; Zhou, C.H.; Lee, X.H.; Bao, Y.X.; Zhao, X.Y.; Fung, J.; Richter, A.; Liu, X.; Zheng, Y.Q. The effects of rapid urbanization on the levels in tropospheric Nitrogen Dioxide and Ozone over East China. Atmos. Environ. 2013, 77, 558–567. [Google Scholar] [CrossRef]
- Lu, Z.; Streets, D.G.; Zhang, Q.; Wang, S.; Carmichael, G.R.; Cheng, Y.F.; Wei, C.; Chin, M.; Diehl, T.; Tan, Q. Sulfur Dioxide emissions in China and sulfur trends in East Asia since 2000. Atmos. Chem. Phys. 2010, 10, 6311–6331. [Google Scholar] [CrossRef]
- Li, C.; Zhang, Q.; Krotkov, N.A.; Streets, D.G.; He, K.B.; Tsay, S.C.; Gleason, J.F. Recent large reduction in Sulfur Dioxide emissions from Chinese power plants observed by the Ozone monitoring instrument. Geophys. Res. Lett. 2010, 37. [Google Scholar] [CrossRef]
- Zhang, L.S.; Lee, C.S.; Zhang, R.Q.; Chen, L.F. Spatial and temporal evaluation of long term trend (2005–2014) of omi retrieved NO2 and SO2 concentrations in Henan Province, China. Atmos. Environ. 2017, 154, 151–166. [Google Scholar] [CrossRef]
- Zhang, X.Y.; van Geffen, J.; Liao, H.; Zhang, P.; Lou, S.J. Spatiotemporal variations of tropospheric SO2 over China by sciamachy observations during 2004–2009. Atmos. Environ. 2012, 60, 238–246. [Google Scholar] [CrossRef]
- Krotkov, N.A.; McLinden, C.A.; Li, C.; Lamsal, L.N.; Celarier, E.A.; Marchenko, S.V.; Swartz, W.H.; Bucsela, E.J.; Joiner, J.; Duncan, B.N.; et al. Aura omi observations of regional SO2 and NO2 pollution changes from 2005 to 2015. Atmos. Chem. Phys. 2016, 16, 4605–4629. [Google Scholar] [CrossRef]
- Wang, S.W.; Zhang, Q.; Martin, R.V.; Philip, S.; Liu, F.; Li, M.; Jiang, X.J.; He, K.B. Satellite measurements oversee China’s Sulfur Dioxide emission reductions from coal-fired power plants. Environ. Res. Lett. 2015, 10, 114015. [Google Scholar] [CrossRef]
- Zhao, B.; Wang, S.X.; Dong, X.Y.; Wang, J.D.; Duan, L.; Fu, X.; Hao, J.M.; Fu, J. Environmental effects of the recent emission changes in China: Implications for particulate matter pollution and soil acidification. Environ. Res. Lett. 2013, 8, 10. [Google Scholar] [CrossRef]
- Wang, S.X.; Xing, J.; Chatani, S.; Hao, J.M.; Klimont, Z.; Cofala, J.; Amann, M. Verification of anthropogenic emissions of China by satellite and ground observations. Atmos. Environ. 2011, 45, 6347–6358. [Google Scholar] [CrossRef]
- Zhou, Y.; Cheng, S.Y.; Lang, J.L.; Chen, D.S.; Zhao, B.B.; Liu, C.; Xu, R.; Li, T.T. A comprehensive ammonia emission inventory with high-resolution and its evaluation in the Beijing-Tianjin-Hebei (BTH) region, China. Atmos. Environ. 2015, 106, 305–317. [Google Scholar] [CrossRef]
- Warner, J.X.; Dickerson, R.R.; Wei, Z.; Strow, L.L.; Wang, Y.; Liang, Q. Increased atmospheric ammonia over the world’s major agricultural areas detected from space. Geophys. Res. Lett. 2017, 44, 2875–2884. [Google Scholar] [CrossRef]
- Zhang, Y.; Dore, A.J.; Ma, L.; Liu, X.J.; Ma, W.Q.; Cape, J.N.; Zhang, F.S. Agricultural Ammonia emissions inventory and spatial distribution in the North China Plain. Environ. Pollut. 2010, 158, 490–501. [Google Scholar] [CrossRef] [PubMed] [Green Version]
- Warner, J.X.; Wei, Z.G.; Strow, L.L.; Dickerson, R.R.; Nowak, J.B. The global tropospheric Ammonia distribution as seen in the 13-year airs measurement record. Atmos. Chem. Phys. 2016, 16, 5467–5479. [Google Scholar] [CrossRef]
- Wang, H.L.; An, J.L.; Cheng, M.T.; Shen, L.J.; Zhu, B.; Li, Y.; Wang, Y.S.; Duan, Q.; Sullivan, A.; Xia, L. One year online measurements of water-soluble ions at the industrially polluted town of Nanjing, China: Sources, seasonal and diurnal variations. Chemosphere 2016, 148, 526–536. [Google Scholar] [CrossRef] [PubMed]
- Cheng, Y.; Engling, G.; He, K.B.; Duan, F.K.; Ma, Y.L.; Du, Z.Y.; Liu, J.M.; Zheng, M.; Weber, R.J. Biomass burning contribution to Beijing aerosol. Atmos. Chem. Phys. 2013, 13, 7765–7781. [Google Scholar] [CrossRef]
- Shen, Z.X.; Cao, J.J.; Arimoto, R.; Han, Z.W.; Zhang, R.J.; Han, Y.M.; Liu, S.X.; Okuda, T.; Nakao, S.; Tanaka, S. Ionic composition of tsp and PM2.5 during dust storms and air pollution episodes at Xi’an, China. Atmos. Environ. 2009, 43, 2911–2918. [Google Scholar] [CrossRef]
- Zhang, T.; Cao, J.J.; Tie, X.X.; Shen, Z.X.; Liu, S.X.; Ding, H.; Han, Y.M.; Wang, G.H.; Ho, K.F.; Qiang, J.; et al. Water-soluble ions in atmospheric aerosols measured in Xi’an, China: Seasonal variations and sources. Atmos. Res. 2011, 102, 110–119. [Google Scholar] [CrossRef]
- Itahashi, S.; Uno, I.; Yumimoto, K.; Irie, H.; Osada, K.; Ogata, K.; Fukushima, H.; Wang, Z.; Ohara, T. Interannual variation in the fine-mode modis aerosol optical depth and its relationship to the changes in Sulfur Dioxide emissions in China between 2000 and 2010. Atmos. Chem. Phys. 2012, 12, 2631–2640. [Google Scholar] [CrossRef] [Green Version]
- Zhang, R.; Jing, J.; Tao, J.; Hsu, S.C.; Wang, G.; Cao, J.; Lee, C.S.L.; Zhu, L.; Chen, Z.; Zhao, Y.; et al. Chemical characterization and source apportionment of PM2.5 in Beijing: Seasonal perspective. Atmos. Chem. Phys. 2013, 13, 7053–7074. [Google Scholar] [CrossRef]
- Van Damme, M.; Erisman, J.W.; Clarisse, L.; Dammers, E.; Whitburn, S.; Clerbaux, C.; Dolman, A.J.; Coheur, P.F. Worldwide spatiotemporal atmospheric ammonia (NH3) columns variability revealed by satellite. Geophys. Res. Lett. 2015, 42, 8660–8668. [Google Scholar] [CrossRef]
- Ground Ammonia Concentrations over China Derived from Satellite and Atmospheric Transport Modeling. Available online: https://www.mdpi.com/2072-4292/9/5/467 (accessed on 12 May 2017).
- Kang, Y.N.; Liu, M.X.; Song, Y.; Huang, X.; Yao, H.; Cai, X.H.; Zhang, H.S.; Kang, L.; Liu, X.J.; Yan, X.Y.; et al. High-resolution Ammonia emissions inventories in China from 1980 to 2012. Atmos. Chem. Phys. 2016, 16, 2043–2058. [Google Scholar] [CrossRef]
- Huang, X.; Song, Y.; Li, M.M.; Li, J.F.; Huo, Q.; Cai, X.H.; Zhu, T.; Hu, M.; Zhang, H.S. A high-resolution Ammonia emission inventory in China. Glob. Biogeochem. Cycles 2012, 26. [Google Scholar] [CrossRef]
- Xu, P.; Zhang, Y.S.; Gong, W.W.; Hou, X.K.; Kroeze, C.; Gao, W.; Luan, S.J. An inventory of the emission of Ammonia from agricultural fertilizer application in China for 2010 and its high-resolution spatial distribution. Atmos. Environ. 2015, 115, 141–148. [Google Scholar] [CrossRef]
- Lai, S.C.; Zou, S.C.; Cao, J.J.; Lee, S.C.; Kin-Fai, H.O. Characterizing ionic species in PM in four pearl river Delta cities, South China. J. Environ. Sci. 2007, 19, 939–947. [Google Scholar] [CrossRef]
- Backes, A.; Aulinger, A.; Bieser, J.; Matthias, V.; Quante, M. Ammonia emissions in Europe, part I: Development of a dynamical Ammonia emission inventory. Atmos. Environ. 2016, 131, 55–66. [Google Scholar] [CrossRef]
- He, H.; Wang, Y.S.; Ma, Q.X.; Ma, J.Z.; Chu, B.W.; Ji, D.S.; Tang, G.Q.; Liu, C.; Zhang, H.X.; Hao, J.M. Mineral dust and nox promote the conversion of SO2 to sulfate in heavy pollution days. Sci. Rep. 2014, 4, 4172. [Google Scholar] [CrossRef] [PubMed]
Figure 1.
Spatial distribution of ground PM2.5 and chemical component monitoring sites. Red solid circles denote sites with PM2.5 data available from 2004 to 2014. Green triangles and blue open circles are similar to the red solid circles but for SO42− and NH4+, respectively. Three black boxes denote the regions on which our study focused.
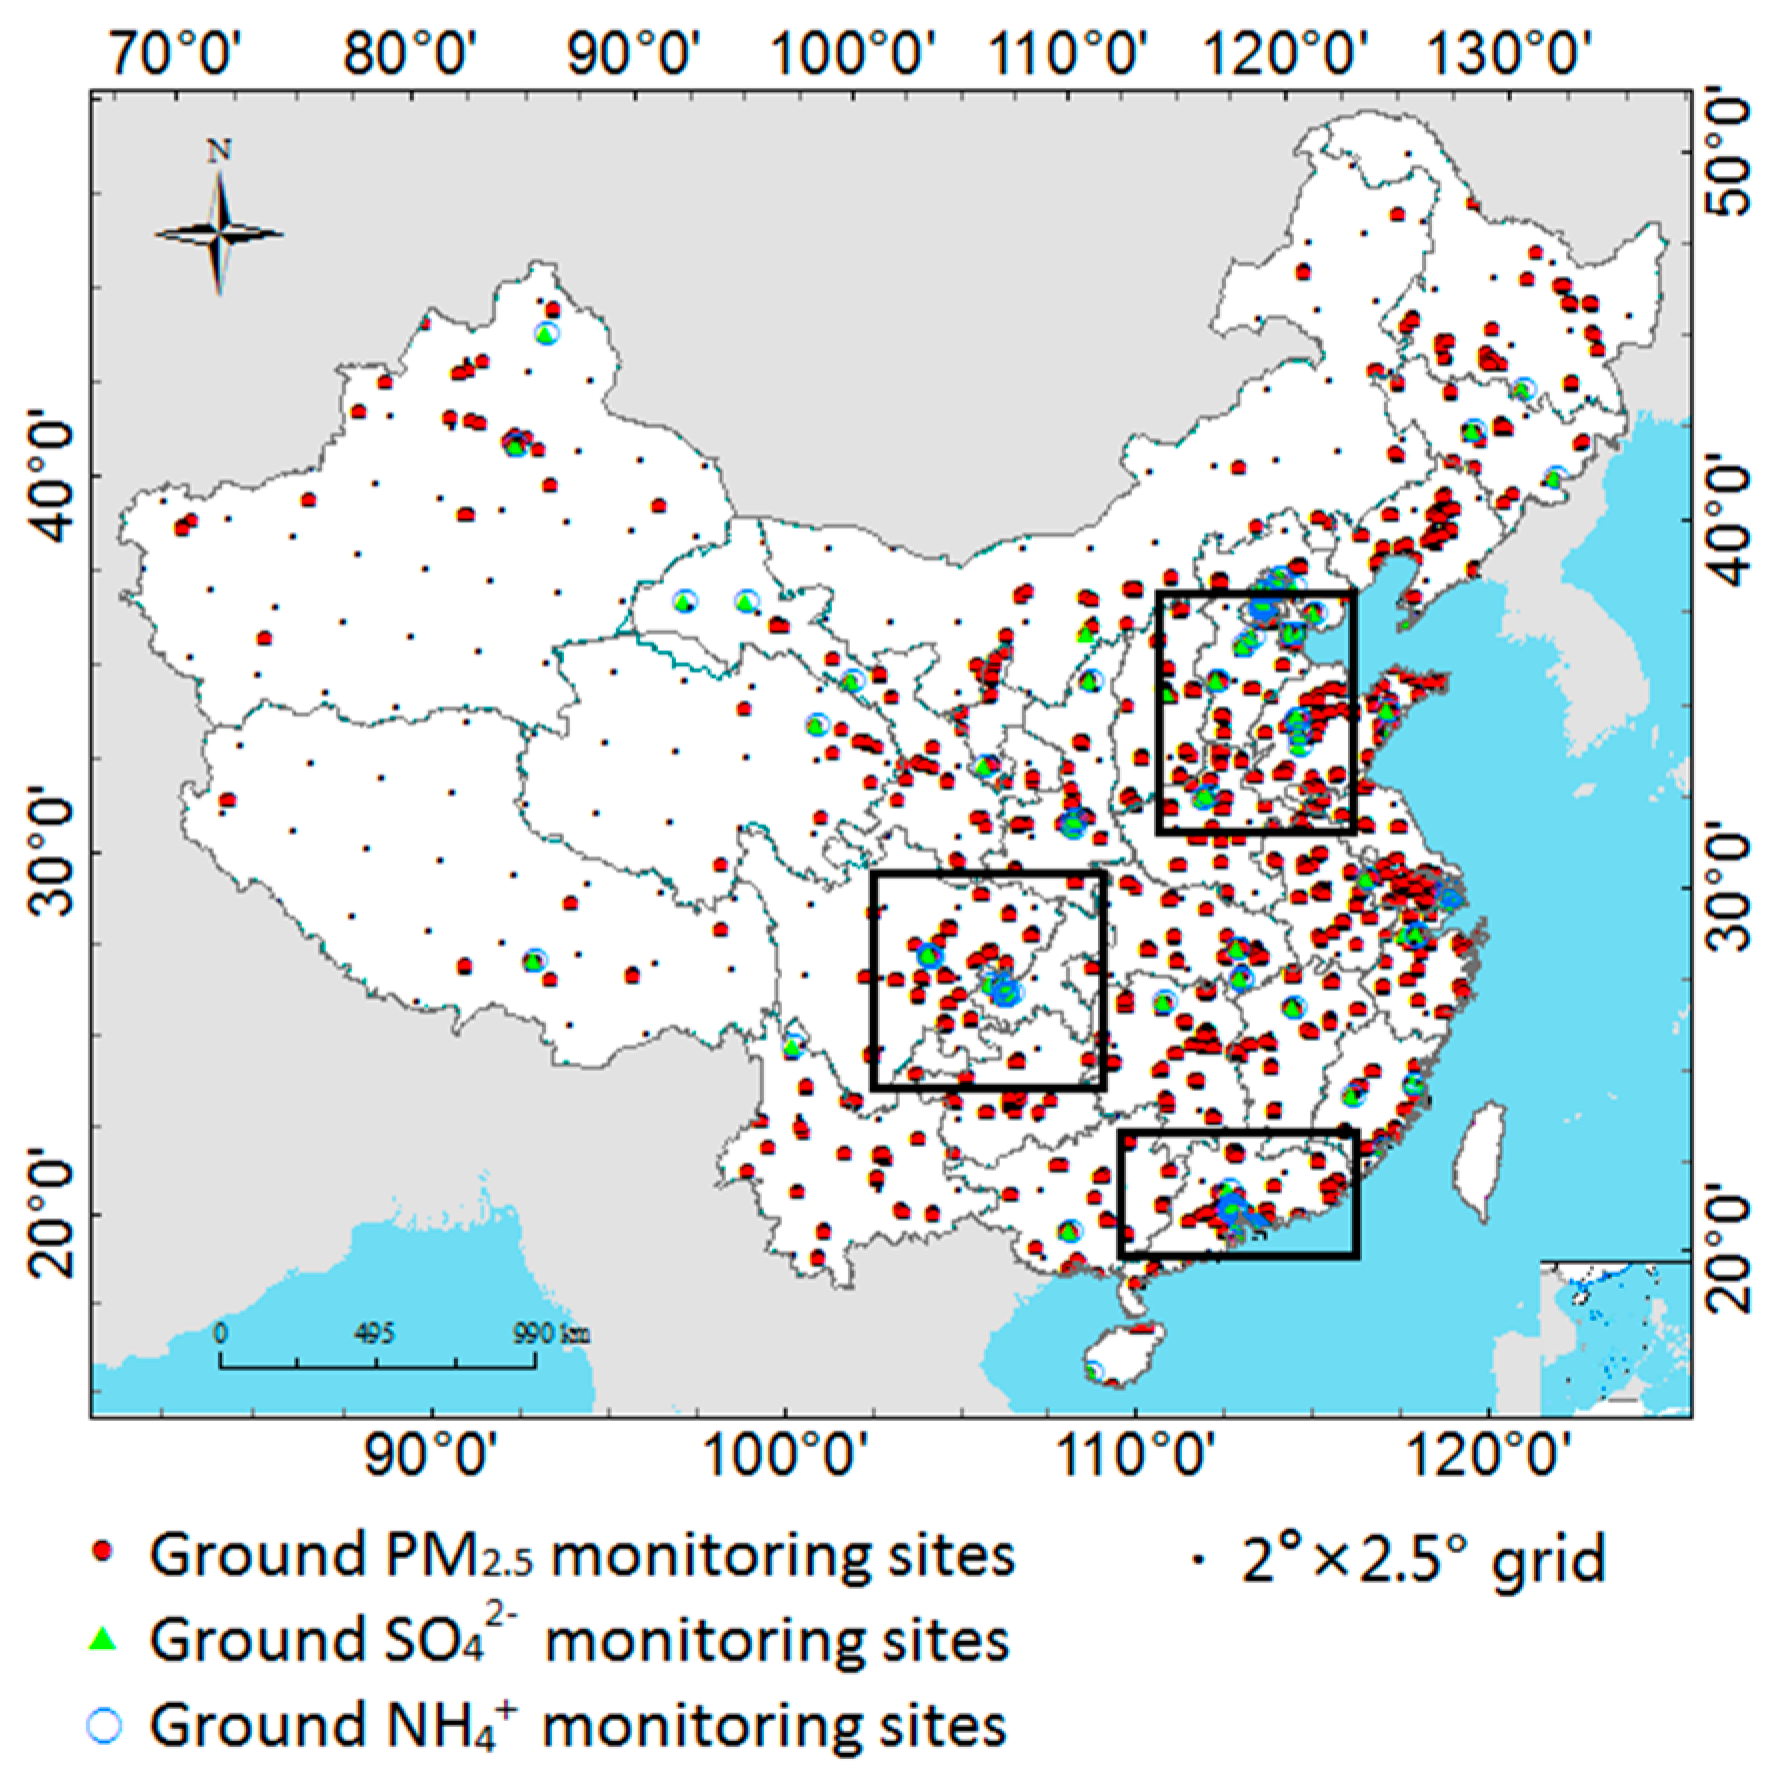
Figure 2.
Evaluation of GC-simulated (a) and satellite-derived (b,c) monthly mean PM2.5 using ground measurements from 2004 to 2014. (a,b) indicate the results obtained at the coarse resolution, and (c) represents the comparison between ground measurements and satellite-derived results at a resolution of 0.1 × 0.1°. The color bar represents the number of data with those particular ordered pair values.

Figure 3.
Evaluation of satellite-derived SO42− (b–d) and NH4+ (f–h) chemical component concentrations (the second line is for 2 × 2.5°; the third line is for 0.1 × 0.1°) and that of model-simulated data (a,e) (the first line) using in situ data collected from the literature. The colors of the symbols represent the regions to which the samples belong.

Figure 4.
Spatial distribution of annual average satellite-derived SO42− concentrations at a resolution of 2 × 2.5°. (a) Overlaid with ground measurements. (b) Time series of monthly satellite-derived SO42− concentrations at the same resolution over China during the period 2004–2014. (c,d) Similar results to those presented in (a,b) but in the NCP at 0.1 × 0.1°. (e,f) Same as (c,d) but in the SCB. (g,h) Same as (c,d) but in the PRD.

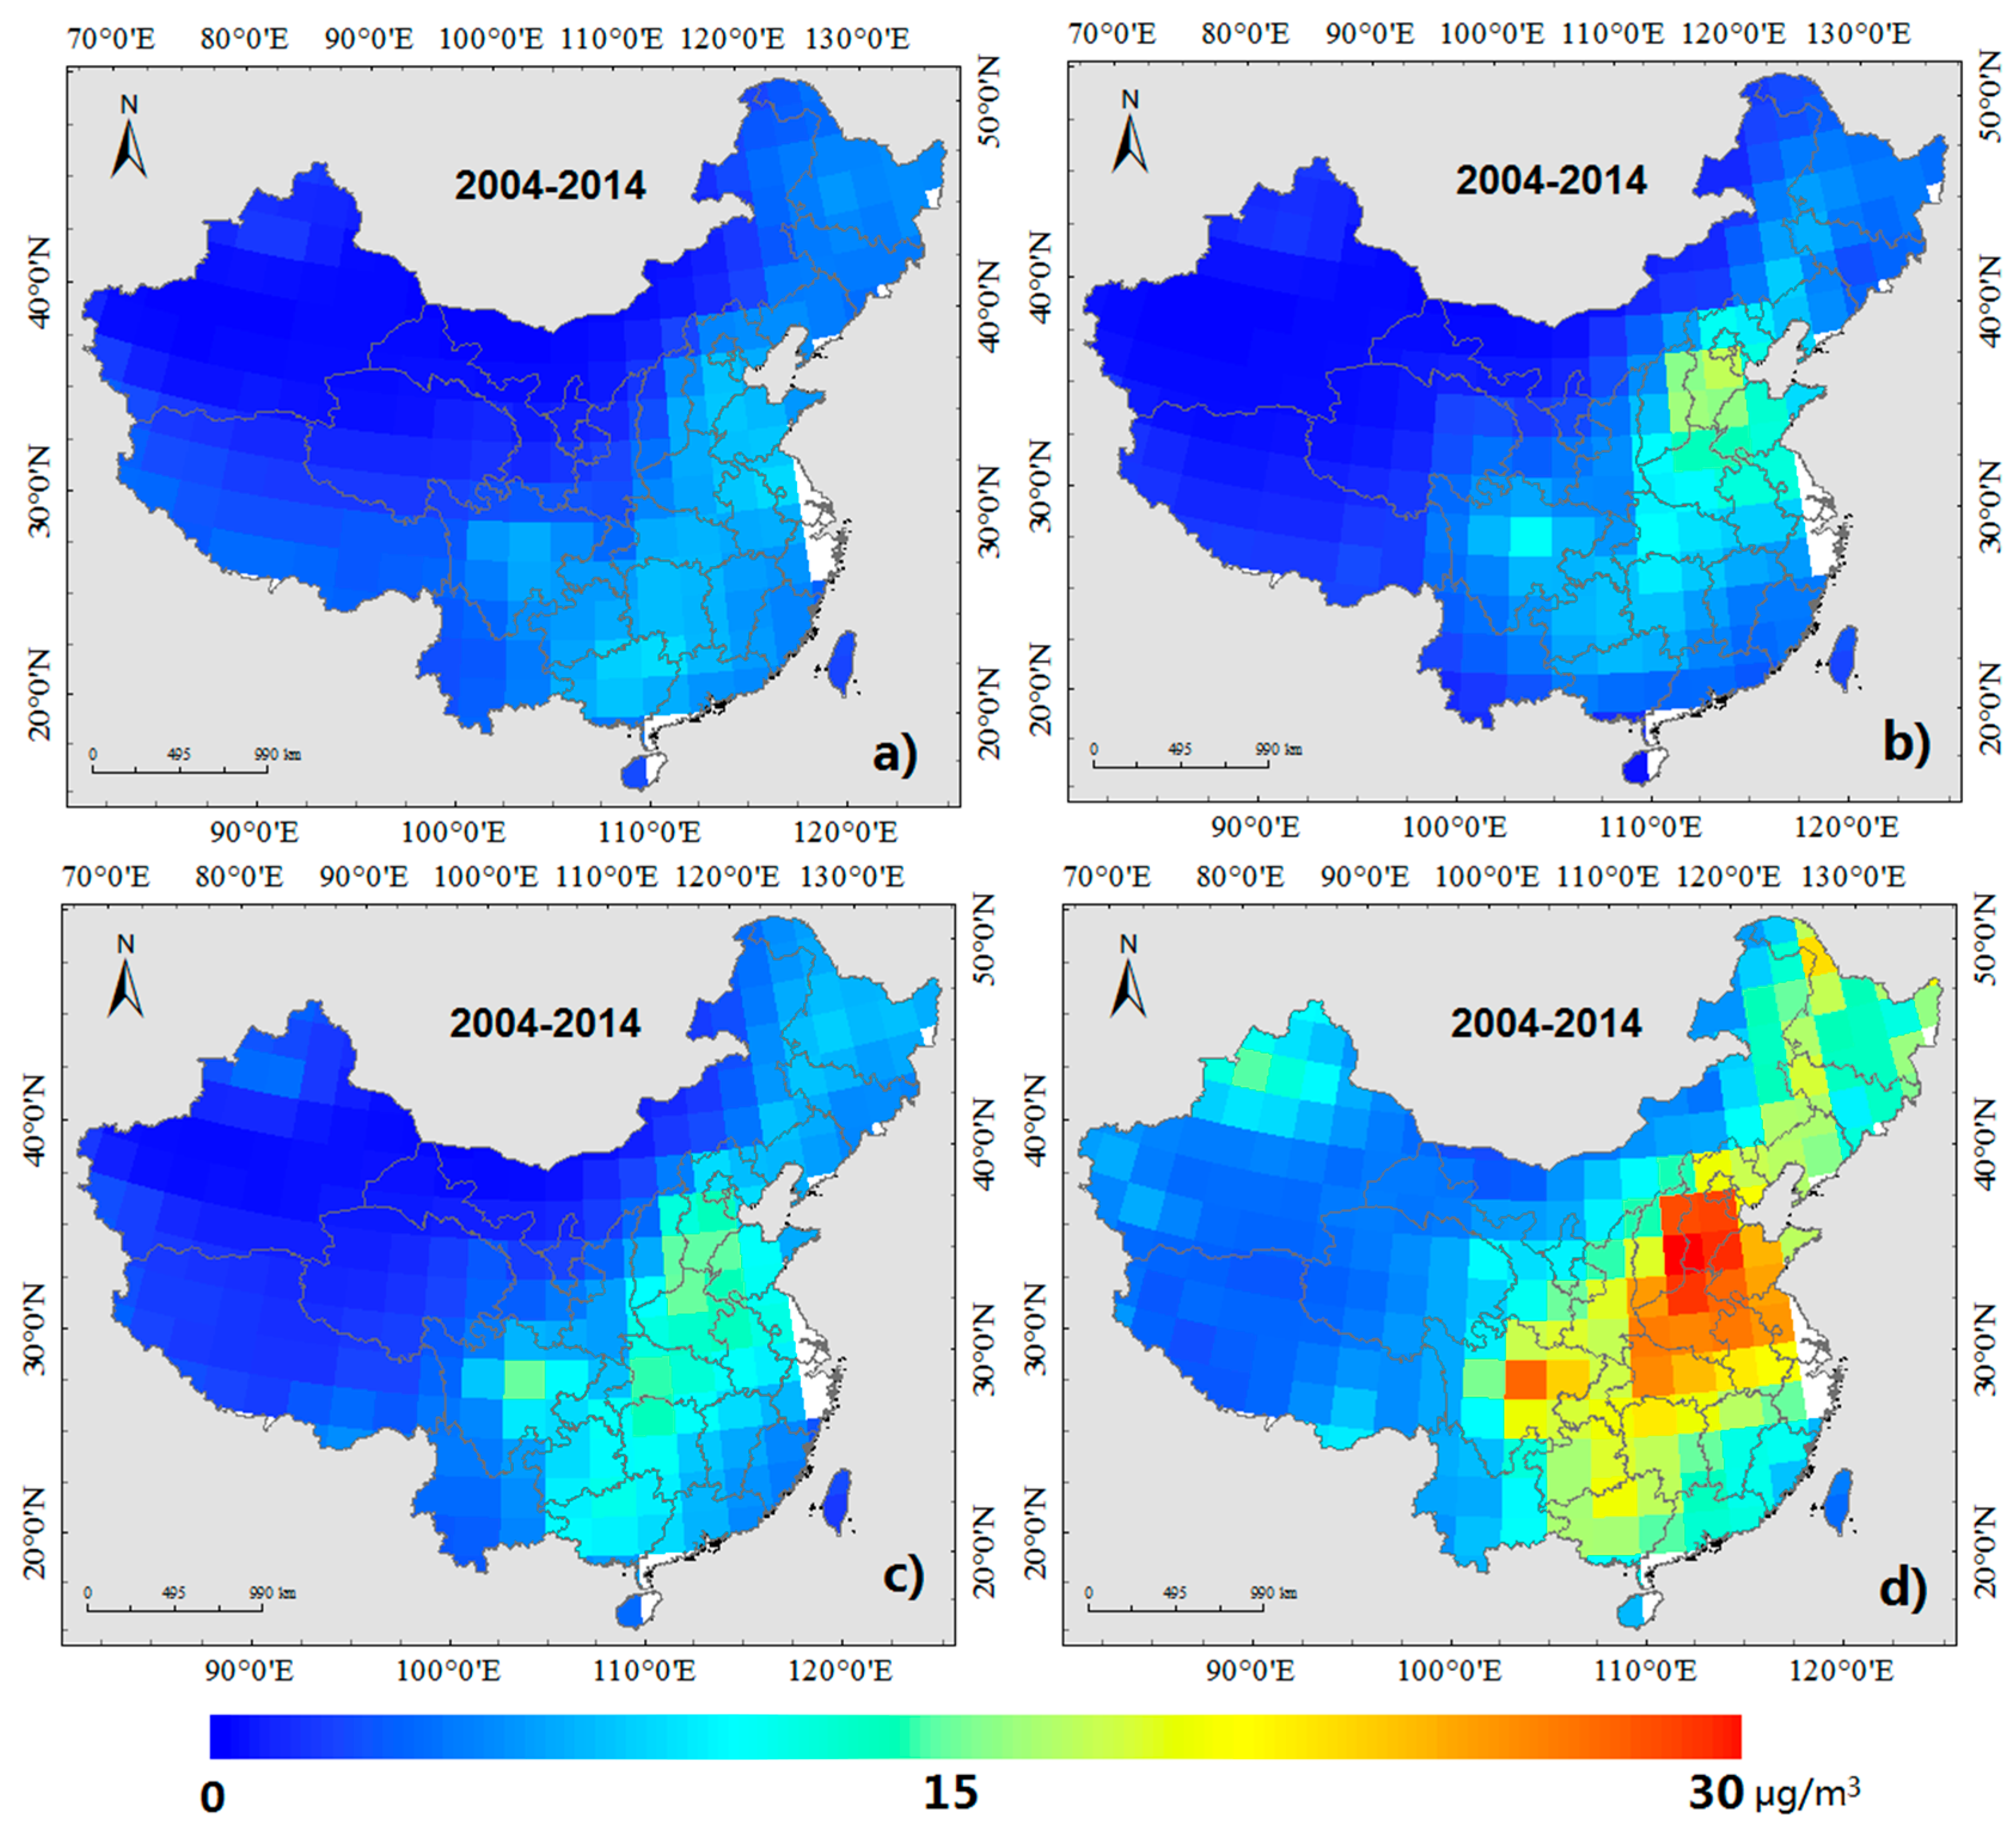
Figure 5.
The same results as shown in Figure 4 but for NH4+.
Figure 5.
The same results as shown in Figure 4 but for NH4+.

Figure 6.
Seasonal distributions of averaged SO42− concentrations over China during the period 2004–2014: (a) spring (March–May), (b) summer (June–August), (c) autumn (September–November) and (d) winter (December–February).
Figure 6.
Seasonal distributions of averaged SO42− concentrations over China during the period 2004–2014: (a) spring (March–May), (b) summer (June–August), (c) autumn (September–November) and (d) winter (December–February).
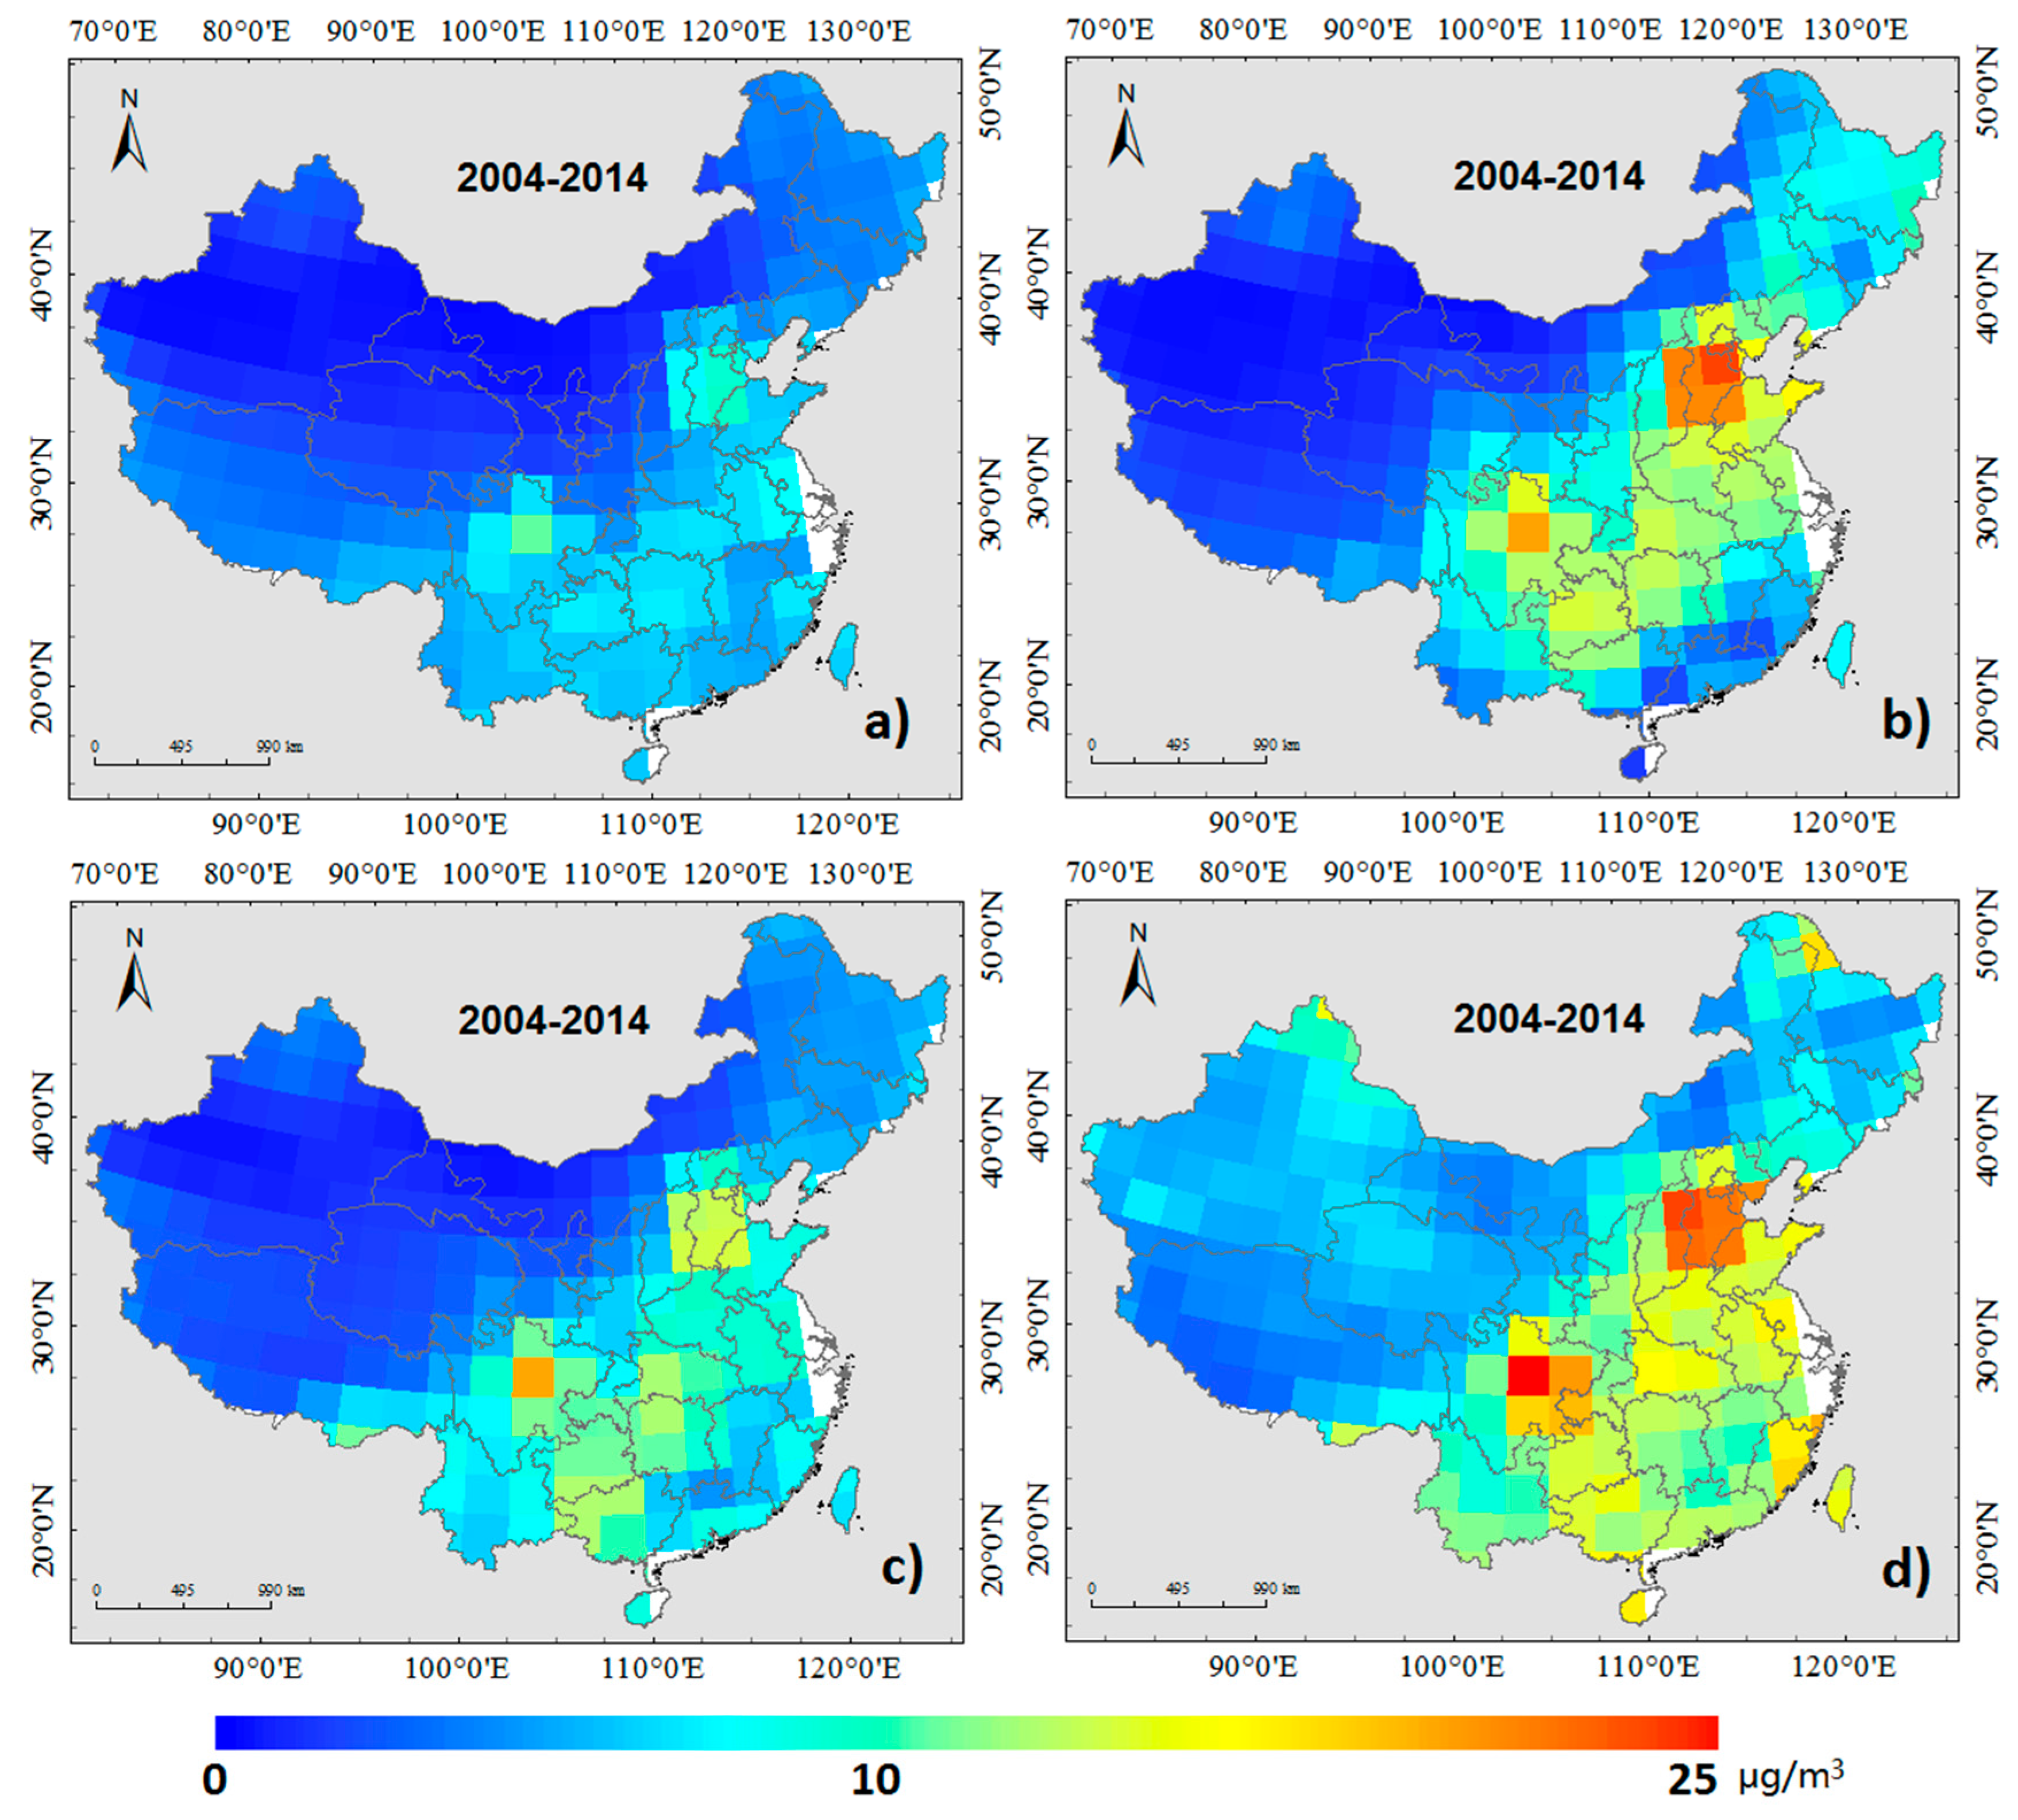
Figure 7.
The same data shown in Figure 6 but for satellite-derived NH4+ concentrations.
Figure 7.
The same data shown in Figure 6 but for satellite-derived NH4+ concentrations.

© 2017 by the authors. Licensee MDPI, Basel, Switzerland. This article is an open access article distributed under the terms and conditions of the Creative Commons Attribution (CC BY) license (http://creativecommons.org/licenses/by/4.0/).
Share and Cite
MDPI and ACS Style
Si, Y.; Li, S.; Chen, L.; Yu, C.; Zhu, W. Estimation of Satellite-Based SO42− and NH4+ Composition of Ambient Fine Particulate Matter over China Using Chemical Transport Model. Remote Sens. 2017, 9, 817. https://doi.org/10.3390/rs9080817
AMA Style
Si Y, Li S, Chen L, Yu C, Zhu W. Estimation of Satellite-Based SO42− and NH4+ Composition of Ambient Fine Particulate Matter over China Using Chemical Transport Model. Remote Sensing. 2017; 9(8):817. https://doi.org/10.3390/rs9080817
Chicago/Turabian StyleSi, Yidan, Shenshen Li, Liangfu Chen, Chao Yu, and Wende Zhu. 2017. "Estimation of Satellite-Based SO42− and NH4+ Composition of Ambient Fine Particulate Matter over China Using Chemical Transport Model" Remote Sensing 9, no. 8: 817. https://doi.org/10.3390/rs9080817
Note that from the first issue of 2016, this journal uses article numbers instead of page numbers. See further details here.