Low-Altitude Aerial Methane Concentration Mapping


School of Engineering, The University of British Columbia, Kelowna V1V1V7, BC, Canada
*
Author to whom correspondence should be addressed.
Remote Sens. 2017, 9(8), 823; https://doi.org/10.3390/rs9080823
Submission received: 17 May 2017
/
Revised: 28 July 2017
/
Accepted: 2 August 2017
/
Published: 10 August 2017
(This article belongs to the Special Issue Remote Sensing of Greenhouse Gases)
Abstract
:Detection of leaks of fugitive greenhouse gases (GHGs) from landfills and natural gas infrastructure is critical for not only their safe operation but also for protecting the environment. Current inspection practices involve moving a methane detector within the target area by a person or vehicle. This procedure is dangerous, time consuming, labor intensive and above all unavailable when access to the desired area is limited. Remote sensing by an unmanned aerial vehicle (UAV) equipped with a methane detector is a cost-effective and fast method for methane detection and monitoring, especially for vast and remote areas. This paper describes the integration of an off-the-shelf laser-based methane detector into a multi-rotor UAV and demonstrates its efficacy in generating an aerial methane concentration map of a landfill. The UAV flies a preset flight path measuring methane concentrations in a vertical air column between the UAV and the ground surface. Measurements were taken at 10 Hz giving a typical distance between measurements of 0.2 m when flying at 2 m/s. The UAV was set to fly at 25 to 30 m above the ground. We conclude that besides its utility in landfill monitoring, the proposed method is ready for other environmental applications as well as the inspection of natural gas infrastructure that can release methane with much higher concentrations.

1. Introduction
Gas monitoring is critical for detecting gas leaks over various sites, such as landfills and natural gas infrastructure. Landfills present a potential hazard to the environment when methane that is generated by decomposition of the waste escapes to the atmosphere. In the past two decades, several accidents caused by landfill explosions have been reported. For instance, two accidents caused several fatalities, injuries, and destroyed properties at landfill sites in North Carolina and Skellingsted [1]. The accidents at both sites were caused by a gas explosion after it accumulated in an enclosed area. Similarly, natural gas pipelines can be a significant source of fugitive methane emissions. For example, during 2001–2005, more than 1300 gas leaks were reported in the province of Alberta, Canada alone [2]. Landfills and pipelines are located in different terrains and geographical locations and are exposed to variable climatic conditions and geological hazards. These sites are regularly inspected and repaired when required to ensure continuous service and safe operations. However, the U.S. Pipeline and Hazardous Safety Administration reported that failures at natural gas pipelines cause more than 17 fatalities, 68 injuries, $133 million in property damages and a total of $3 billion collateral damages annually [3]. Latest studies show that any pipeline leak over 2–3% will offset the environmental benefits of natural gas over other fossil fuels. Controlling the fugitive emissions is difficult. For example, the Los Angeles Basin has a production leak rate as high as 17% [4].
One of the current inspection procedures involves the use of a remote sensing detector containing an optical spectroscopic, an infrared camera, or gas sensor. Typically, the detector is held by a worker who walks along or drives over landfills, pipelines, and pump stations looking for a higher than normal concentration of methane. This approach is labor intensive, slow, costly, and limited by accessibility to the target area and infrastructure in challenging locations. Hence, a more efficient and cost-effective method is required.
During the past two decades, researchers have developed techniques that improve gas monitoring and leak detection. However, detecting the existence of gas leaks is not the only information researchers were after; other critical information such as measuring gas flux, and leak location are also important [5,6,7]. The latter is considered imperative to decide the most efficient retrofit measure. Several criteria are considered to classify leak detection techniques. One of the most common classifications is based on the technical nature of the methods [8,9]. Using this classifier, the detection techniques can be split into three categories: non-technical, hardware, and software based methods. A non-technical method is detection that relies on the natural senses without the use of any device, e.g., smelling. Hardware-based gas-detection methods use electro-mechanical sensing devices, while software-based methods depend on software programs. Examples for each category with the advantages and disadvantages of each method are listed in Table 1. An extensive survey of the gas leak detection techniques can be found in [1,3].
Landfills emit gas with approximately forty to sixty percent methane (CH4) while the remainder is mainly composed of carbon dioxide (CO2). Therefore, measuring the methane concentration in air is considered a very practical way to measure gas flux and detect leaks. There are different methods to measure the concentration of methane gas in air. One method is ground-based flux chambers. These can operate over long timescales and provide accurate measurements. However, they lack the practicality of covering a wide area. Another method uses a satellite along with an inverse transport model [23]. A widely used method is remote sensing, which is known for its practicality for measuring over a wide area. Remote sensing approaches differ depending on the technology used to measure the methane concentration. Some detectors use semiconductors [24] and catalytic combustion elements [25]. However, those methods are not used to measure high-concentration gas in open air because of their sensitivity to the ambient temperature changing the sensor thermal conductivity [26]. Another shortcoming of these sensors is their limited selectivity in the presence of other volatile gases that can cause a false alarm. Infrared absorption [27] is another method commonly used in the field. The disadvantage of this method is the high cost since they require expensive optical components and complex electronics. A laser technology can be used to measure the concentration of methane gas. A laser diode wavelength-sweep technique is used to detect the presence of methane in a column of air containing the laser beam [28].
Currently, there are three different solutions for inspection of natural gas leaks using remote sensing technology: foot patrols, land vehicles, and helicopters. Each solution has its advantages and disadvantages. The effectiveness of each technique depends on its unique features, such as detection area, time requirement, and costs. In addition, the inspection procedure has many different challenges. For instance, the accessibility and the size of landfills (typically more than 30 acres), and the lengths of pipelines are major challenges for leak inspections. While foot patrols are straightforward to carry out in urban, hard terrain, and complex environments, they are very slow and cannot cover a large area. Using land vehicles with a sensing system allows the task to be completed faster. This procedure requires suitable roads through the targeted area or along the targeted pipelines. However, this is not possible in certain areas such as in rough terrain or mountains. Helicopters, on the other hand, do not require any additional infrastructure and can cover large areas in a short time. Helicopter limitations arise from their relatively high cost of operation and lack of access to obscured environments such as forests. Utilizing unmanned aerial vehicles (UAVs) or drones equipped with a light-weight gas sensing system can overcome some of the disadvantages of the current methane monitoring methods. UAVs have the same advantages that helicopters have; they require no additional infrastructure that land vehicles need, and they can cover a large area in a short time. Also, they are relatively low cost and require much less maintenance than a helicopter. Their small size, compared with a helicopter, allows them to come closer to the target even in complex environments. However, UAVs suffer from a short flight duration in comparison with a helicopter and flight restriction regulations. Table 2 summarizes the main advantages and disadvantages of each type of inspection process.
Recently, unmanned aerial vehicles equipped with digital cameras and other sensors have been used to monitor large areas in different applications such as forest firefighting, road maintenance, and visual pipeline inspection. It is expected that UAVs will replace the use of piloted aircraft for many aerial inspection and surveying applications. UAVs can be controlled either fully autonomously by their on-board autopilots, or remotely by an operator using a ground control station. The applications range from surveillance and aerial mapping to firefighting and infrastructure inspection [29,30,31]. Some recent work has used UAVs for pipeline inspections. One demonstration trial involved surveying a section of a pipeline in Alaska [32]. Some applications were mainly based on using a single sensor, such as laser sensor [33] gas filter [34] and hyperspectral imaging technology [35], while others used sensor fusion algorithms to fuse the measurements gathered from a laser sensor and an electro-optical sensor [36]. Lehmann et al. [37] reported a more specific use of UAV for remote sensing of methane concentration using camera system for environmental studies. Khan et al. [38] introduced their lightweight low-power gas sensor for methane detection using UAVs.
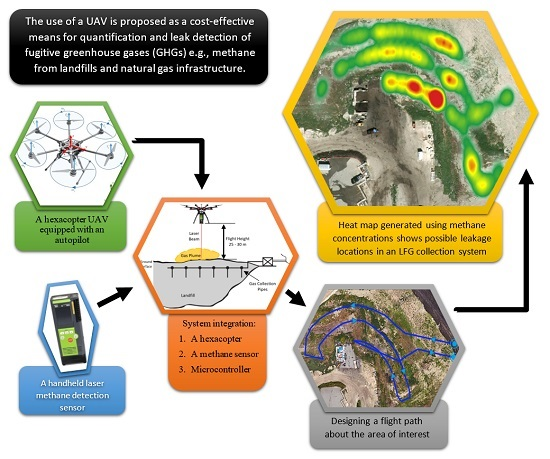
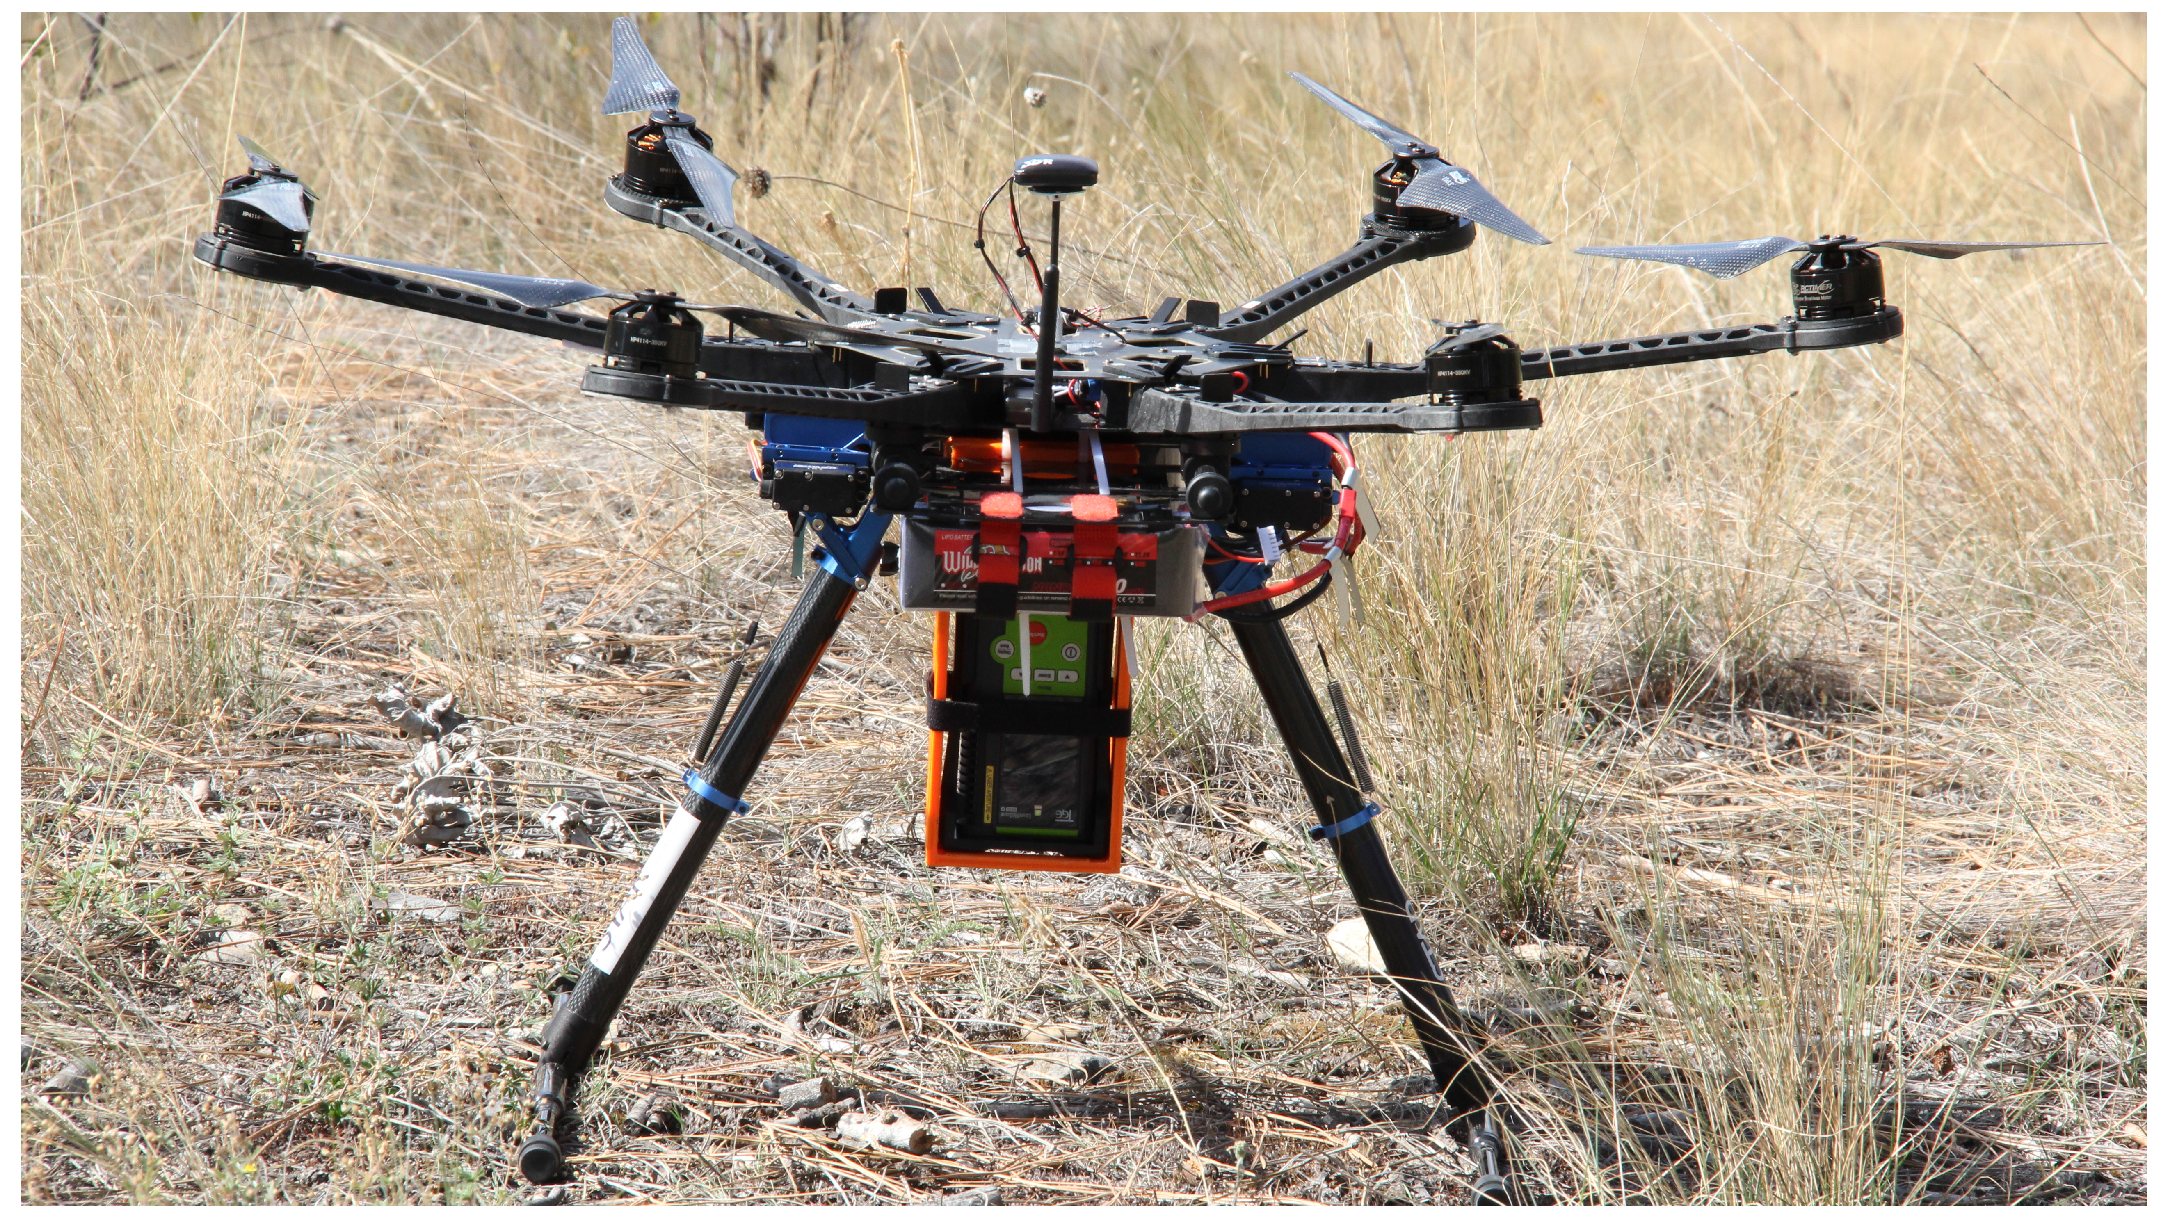
In this paper, we demonstrate our efforts to detect methane leaks and map methane concentrations using a laser-based portable methane sensor over a municipal landfill with a gas collection system. The area surveyed was known to have leaks from the gas collection system. For this purpose, we equipped a hexacopter UAV with a laser-based methane detector, and a microcontroller as shown in Figure 1. Wishing to emphasized ease of use and utility of the system in general, we present our system integration and demonstrate the data analysis and the methane concentration mapping for test flights over the landfill. The use of a UAV proposed in this research is a potential cost-effective strategy for quantification and leak detection of fugitive greenhouse gases such as methane from landfills and natural gas infrastructure. The system is fully autonomous, provides a total flight time of approximately 30 min, and can be deployed by an operator with limited UAV flight skills. A methane concentration map generated by flying over the landfill with fugitive methane emissions is used as a proof of concept.
2. System Integration
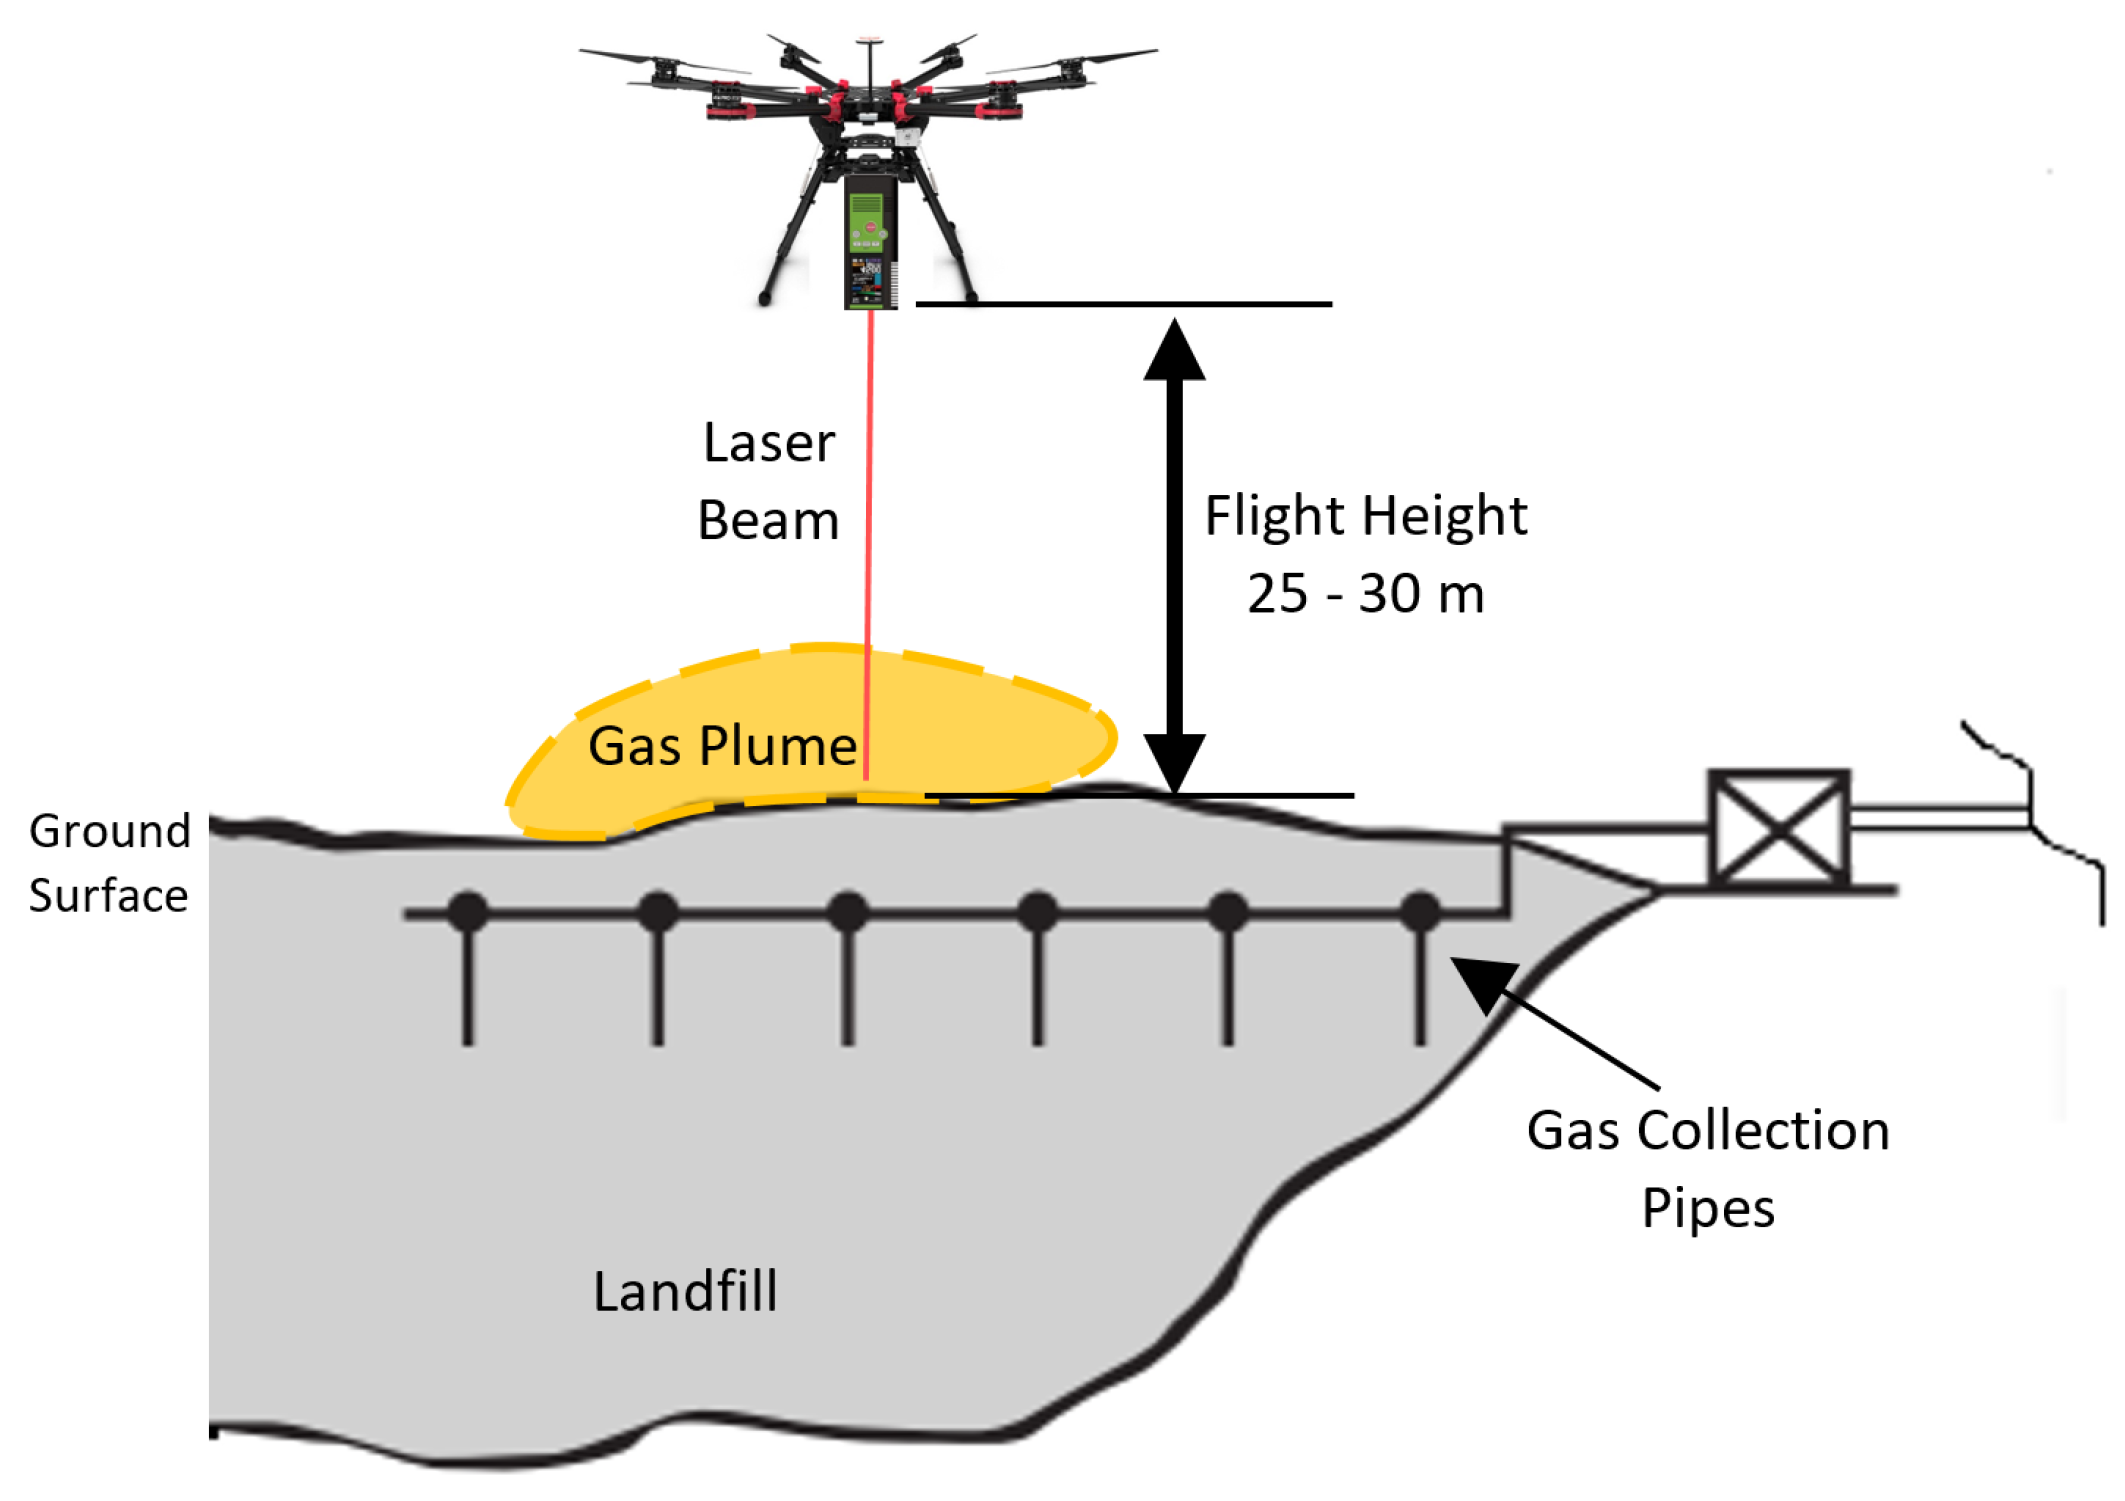
The UAV system shown in Figure 1 is a remote sensing device that measures methane concentration in vertical columns of air that can be mapped on a geographical map or an aerial image using GPS coordinates. Figure 2 is a schematic of the inspection process. The UAV is programmed to fly a predefined path to cover an area of interest autonomously and to collect methane concentration data during the flight using the methane detector.
2.1. UAV System
Due to their payload capacity and rapid vertical takeoff and landing, hexacopters have been increasingly used as a preferred UAV platform for outdoor applications. A hexacopter consists of a multi-rotor frame with six symmetrical arms. This symmetry allows for centralization of payload and control systems. However, their dynamic control system is highly nonlinear and very complicated and requires a highly sophisticated control techniques to control it [39,40]. Each arm contains an actuator with a fixed-pitch propeller, and its airflow goes downwards to provide lift. The system is controlled by changing the speed of the six rotors to reach and maintain a desired altitude and attitude. The six actuators allow the UAV to navigate easily in a 6 degrees-of-freedom (DOF) configuration space and achieve trajectory tracking.
In this project, we used an EVO Arm F800-R hexacopter with retractable landing skid. The system can carry up to 4.8 kg payload for 30 min with a standard battery module. The UAV is equipped with a flight control system consist of a PIXHAWK autopilot, GPS, and telemetry system. APM Planner mission design software was used to configure the system and define the flight test missions with GPS way-points across the area of interest. The full specifications of the used UAV platform are shown in Table 3.
2.2. Methane Detector
The methane sensor used in our project is a Laser Methane mini-G (SA3C50A) manufactured by Pergam (Table 4). It is a handheld detector used in the natural gas industry. The detector relies on transmitting a laser beam with a frequency tuned to the absorption characteristics of methane gas. The laser beam is an eye-safe laser and works with a filter in a narrow bandwidth of frequencies where methane has a high absorption rate. The laser beam is directed vertically downward from the UAV to the ground surface, and a portion of the beam is back scattered to the detector. The concentration of methane in the air column that the beam travels through is calculated using proprietary software based on absorption by methane molecules of the transmitted and backscattered ray. The algorithm quantifies the methane concentration in parts per million of methane multiplied by the distance between the UAV and the ground (ppm·m). Measurements can be used to indicate areas with high gas emissions. The device along with mounting attachments weighs about 0.6 kg. The detector was set to measure methane concentrations at a rate of approximately 10 Hz. The sensor readings were transferred to an external device with an Android OS through a standard Bluetooth link. This feature allows the methane detector to be integrated into a wide range of UAVs.
2.3. On-Board Microprocessor
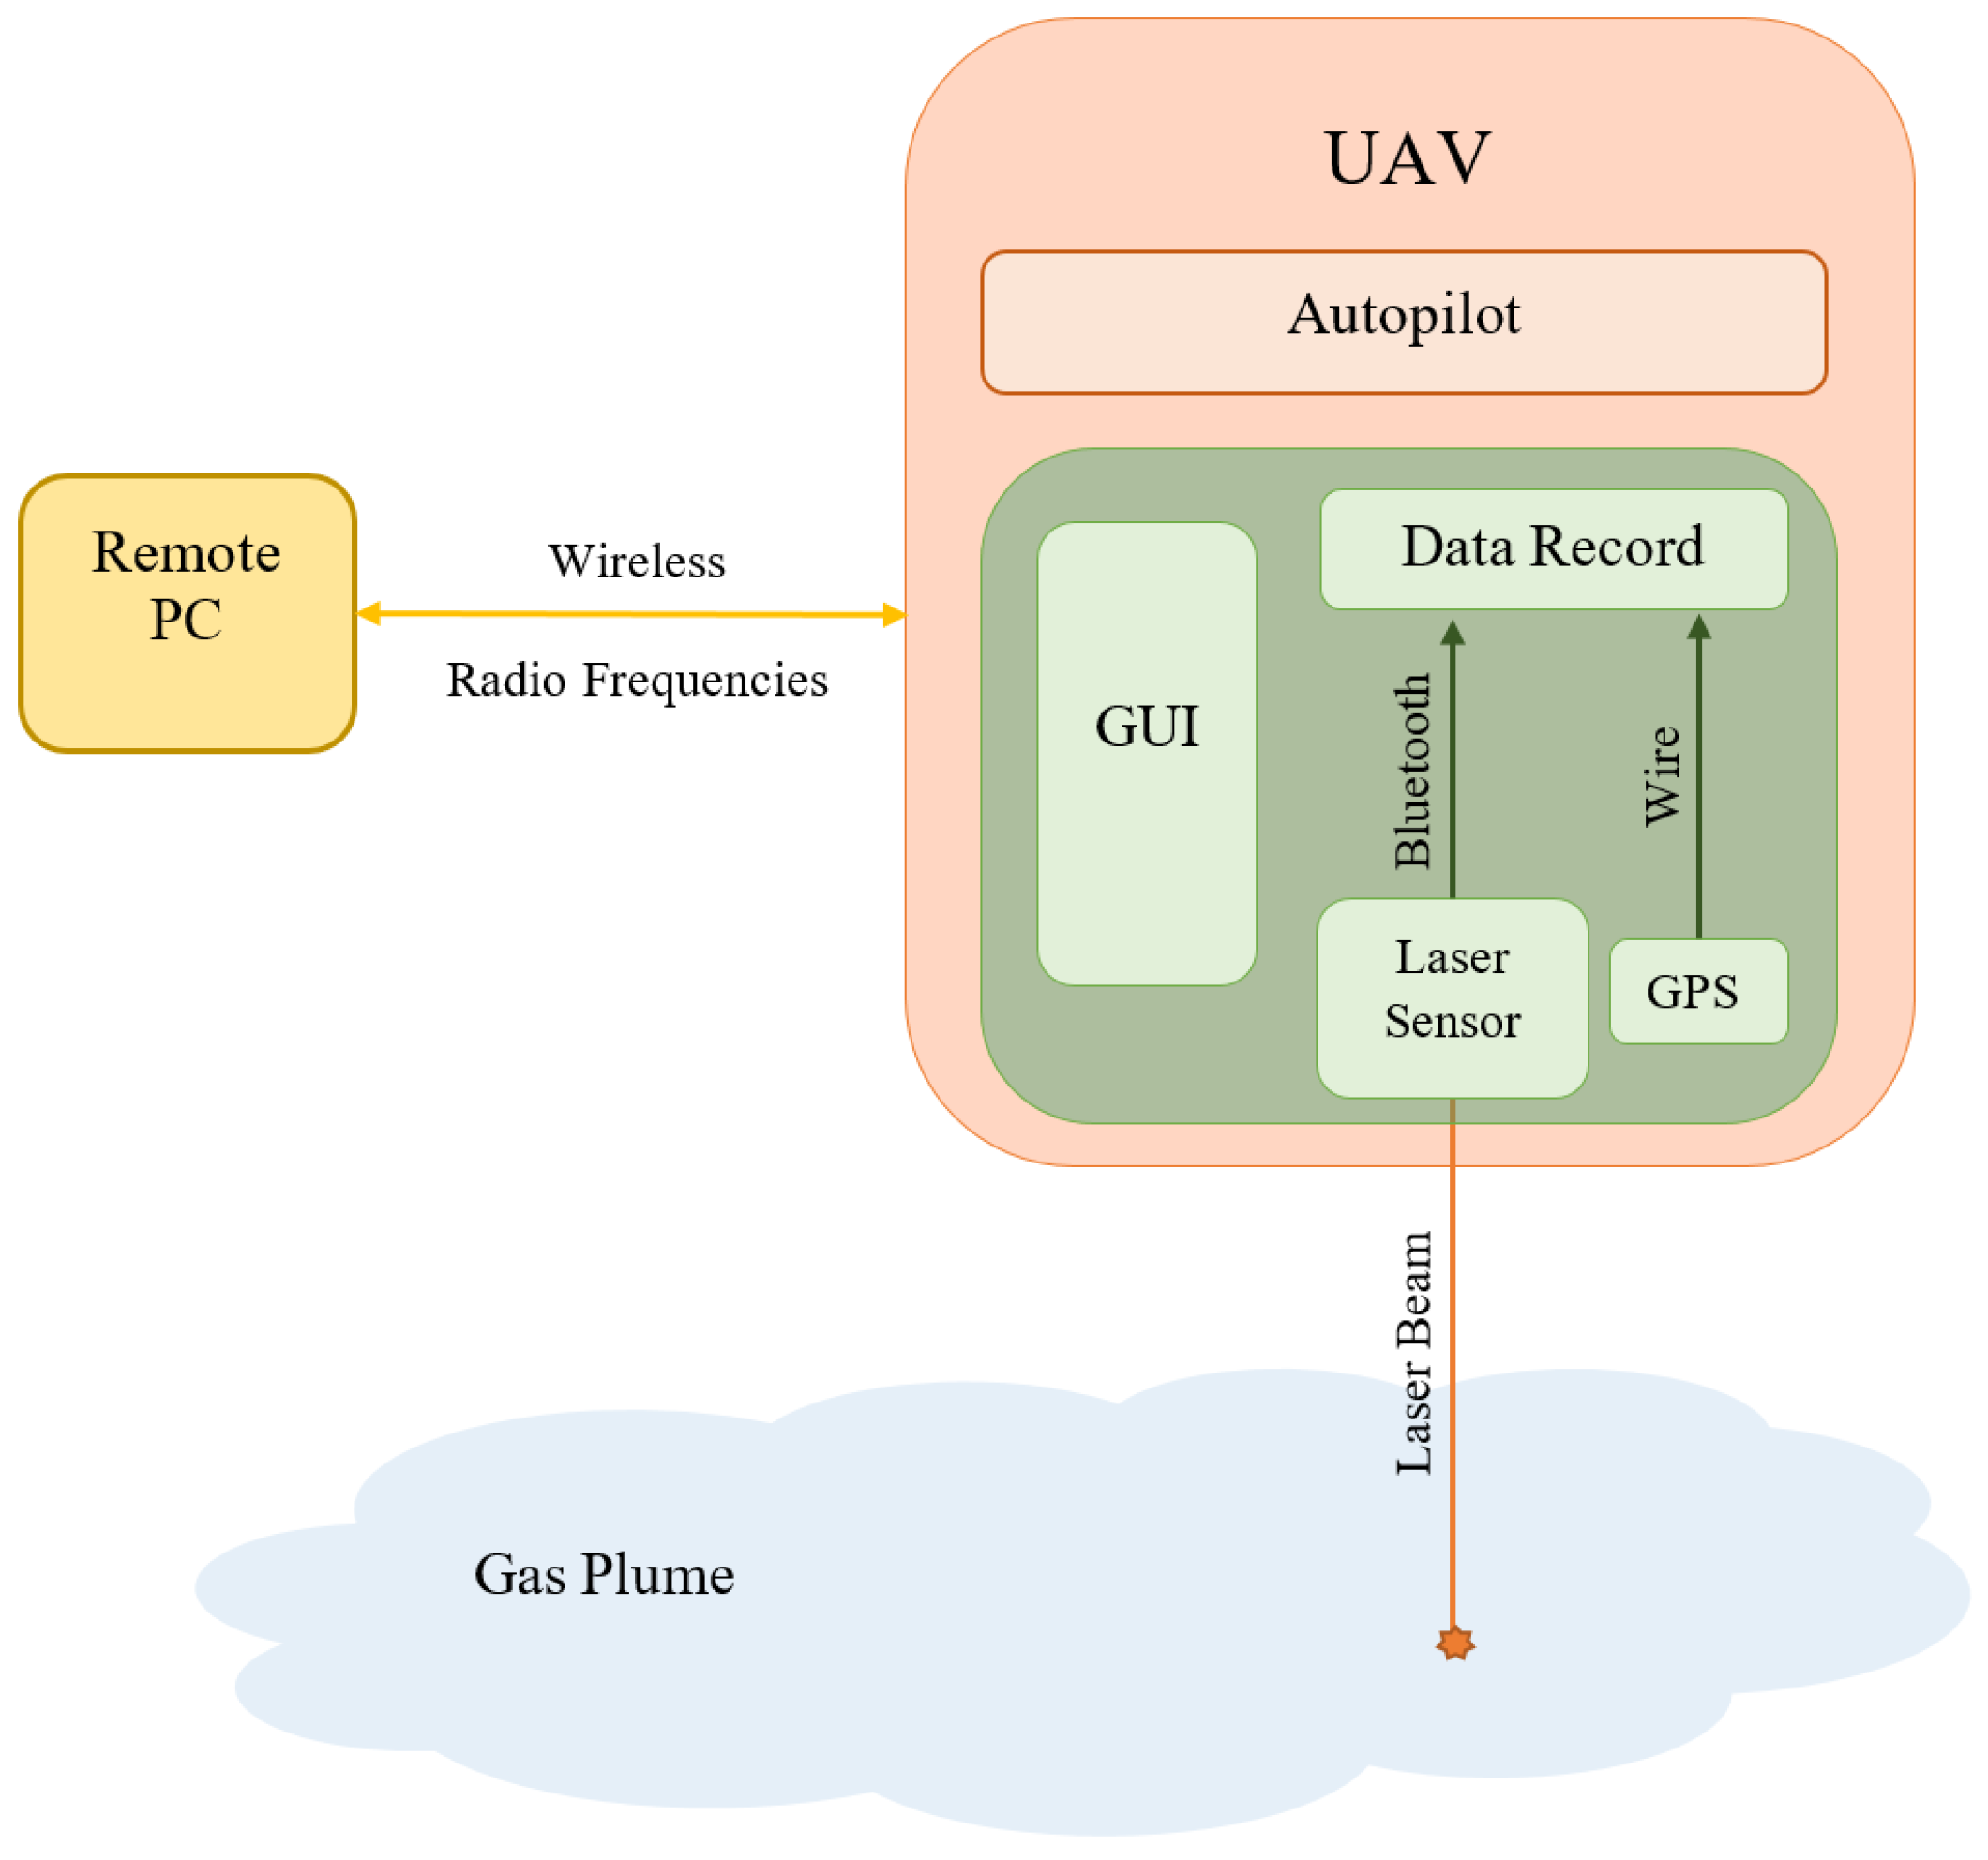
An on-board microprocessor synchronizes the flight path with the methane concentration reading. The system uses the on-board GPS sensor to tag each reading with a GPS location, and then stores the measurements on-board. When the flight is completed, the methane concentration data recorded by the on-board microprocessor along with its GPS location are available to the user. The collected data can be transferred into most commercially available Geographic Information System (GIS) software programs for display purposes. We used Google Earth to display the results of the field measurements. The user can easily spot areas of high methane concentration referenced by their GPS coordinates, or relative to natural landmarks on the map. The general system architecture is shown in Figure 3. It shows the UAV and its on-board devices including autopilot, the laser sensor, data recorder, GPS sensor, and a microprocessor. The blue area represents the possible methane plume in the area of interest. Using the graphical user interface (GUI), the user can transmit the recorded data to a remote PC for further analysis, during the flight or after it finishes, through a radio frequency (RF) transmitter or using a microSD card.
3. Field Test at a Landfill
The system was tested at the Glenmore Landfill operated by the City of Kelowna. The landfill uses a methane collection system to recover some methane. It is captured through a network of underground perforated pipes kept at a negative pressure to gather methane that is being generated by decomposition of waste materials in the landfill. However, there are still fugitive emissions of methane. The Glenmore Landfill allowed us to test our system to detect potential locations where methane gas may be escaping from the landfill. Our successful field test at the landfill verified the practically of the proposed UAV-based methane detector for fugitive methane emission mapping. This proof of concept was the first stage for testing the system for complete landfill monitoring and pipeline inspections.
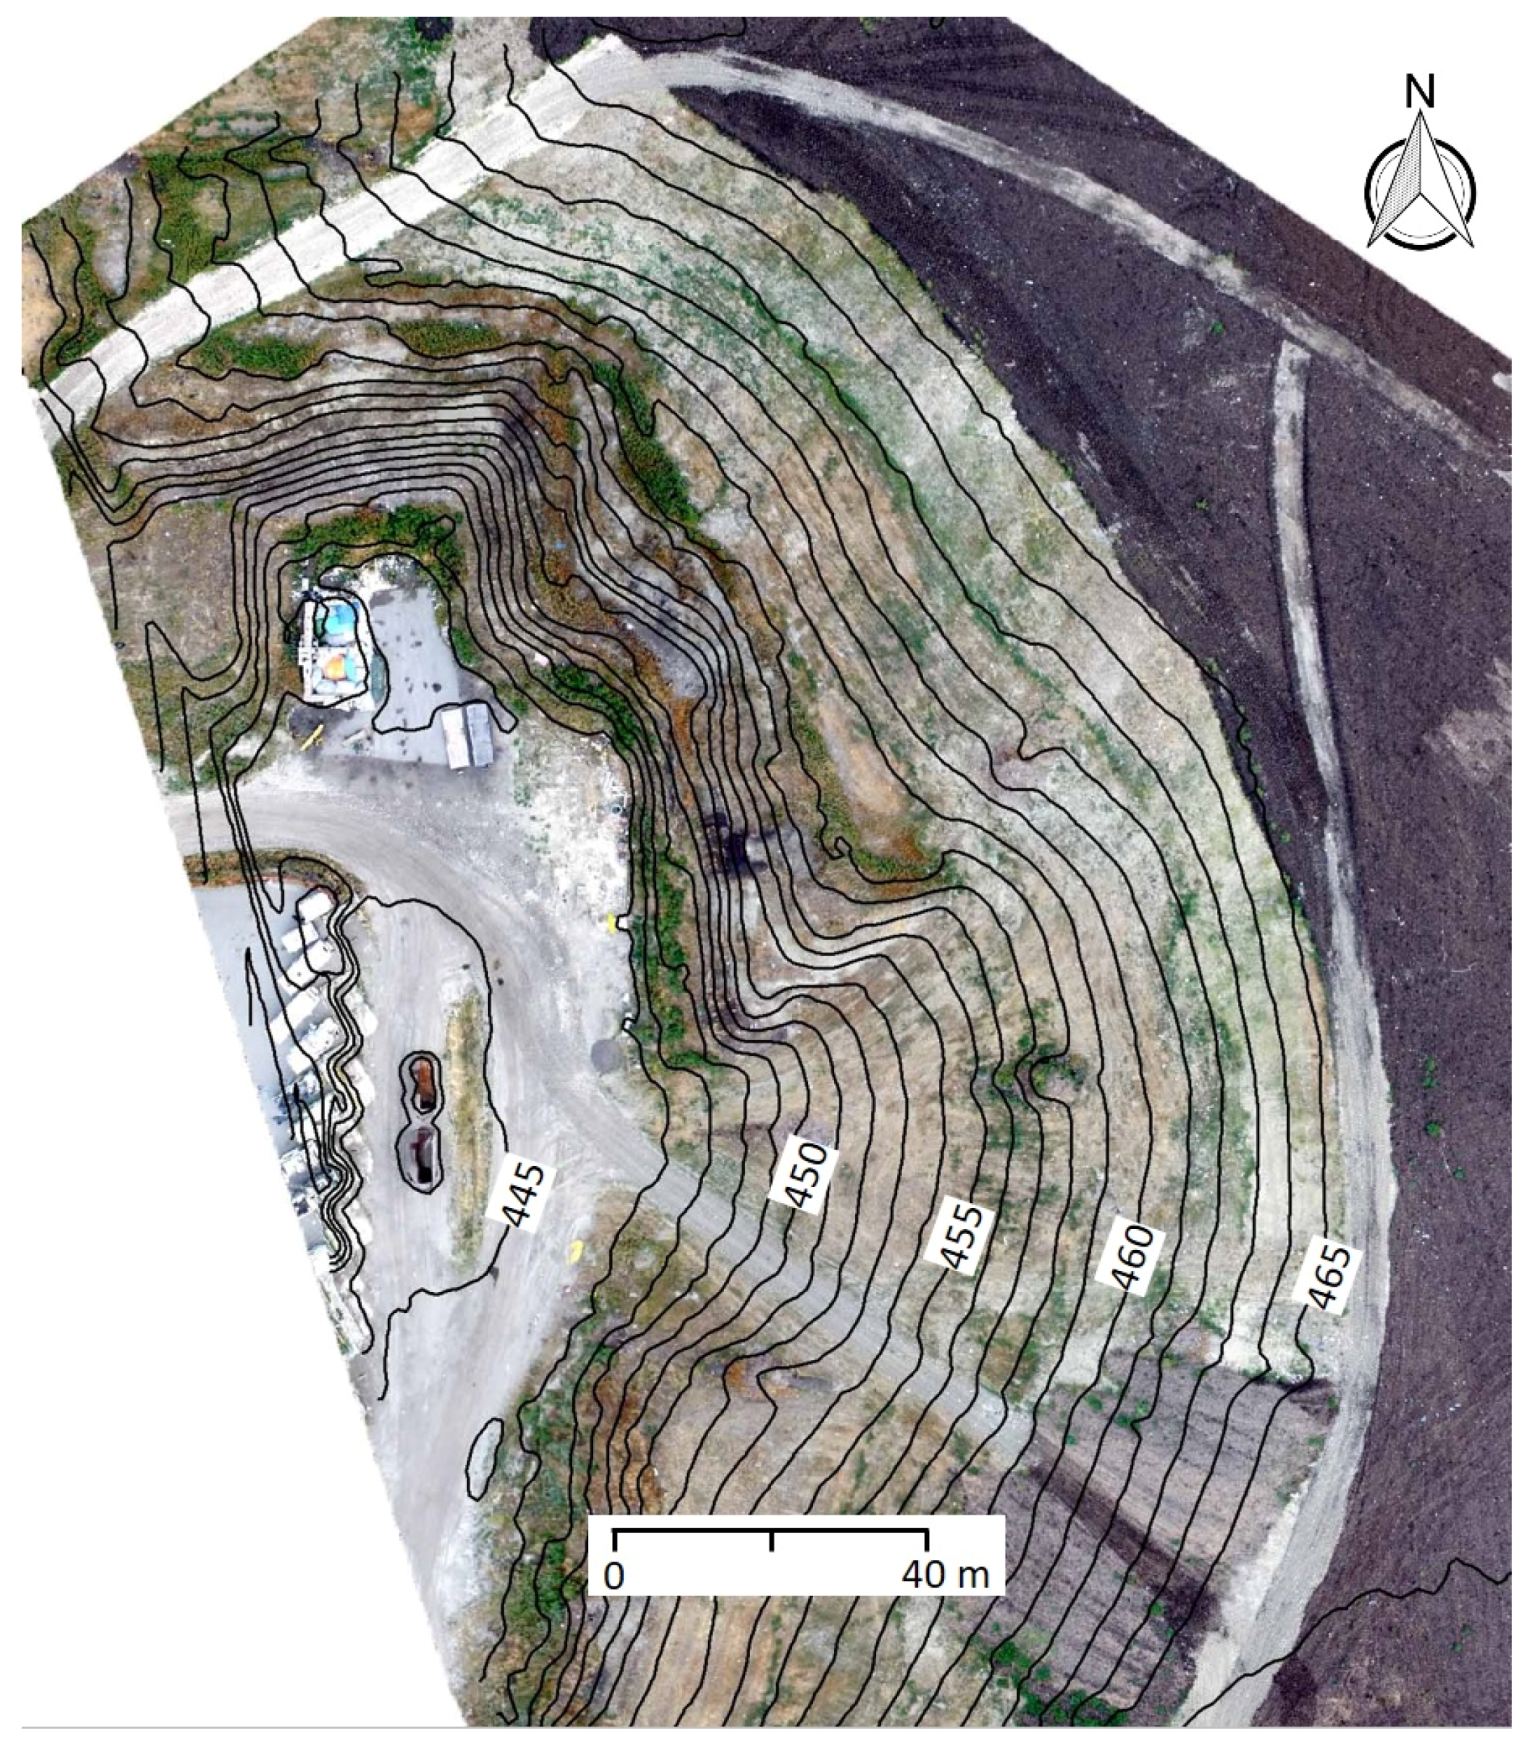
The location that was selected for testing within the large landfill had challenging topography. There was a 20 m difference in elevation over a relatively small area of 100 m by 150 m that was covered by the test flights. Figure 4 shows a topographic map of the area that was created using photogrammetric processing of a sequence of vertical aerial photographs that were also taken by a UAV flying over the area prior to flying the UAV carrying the methane detector. This topographic map was used to design the flight plan for the UAV carrying the methane sensor.
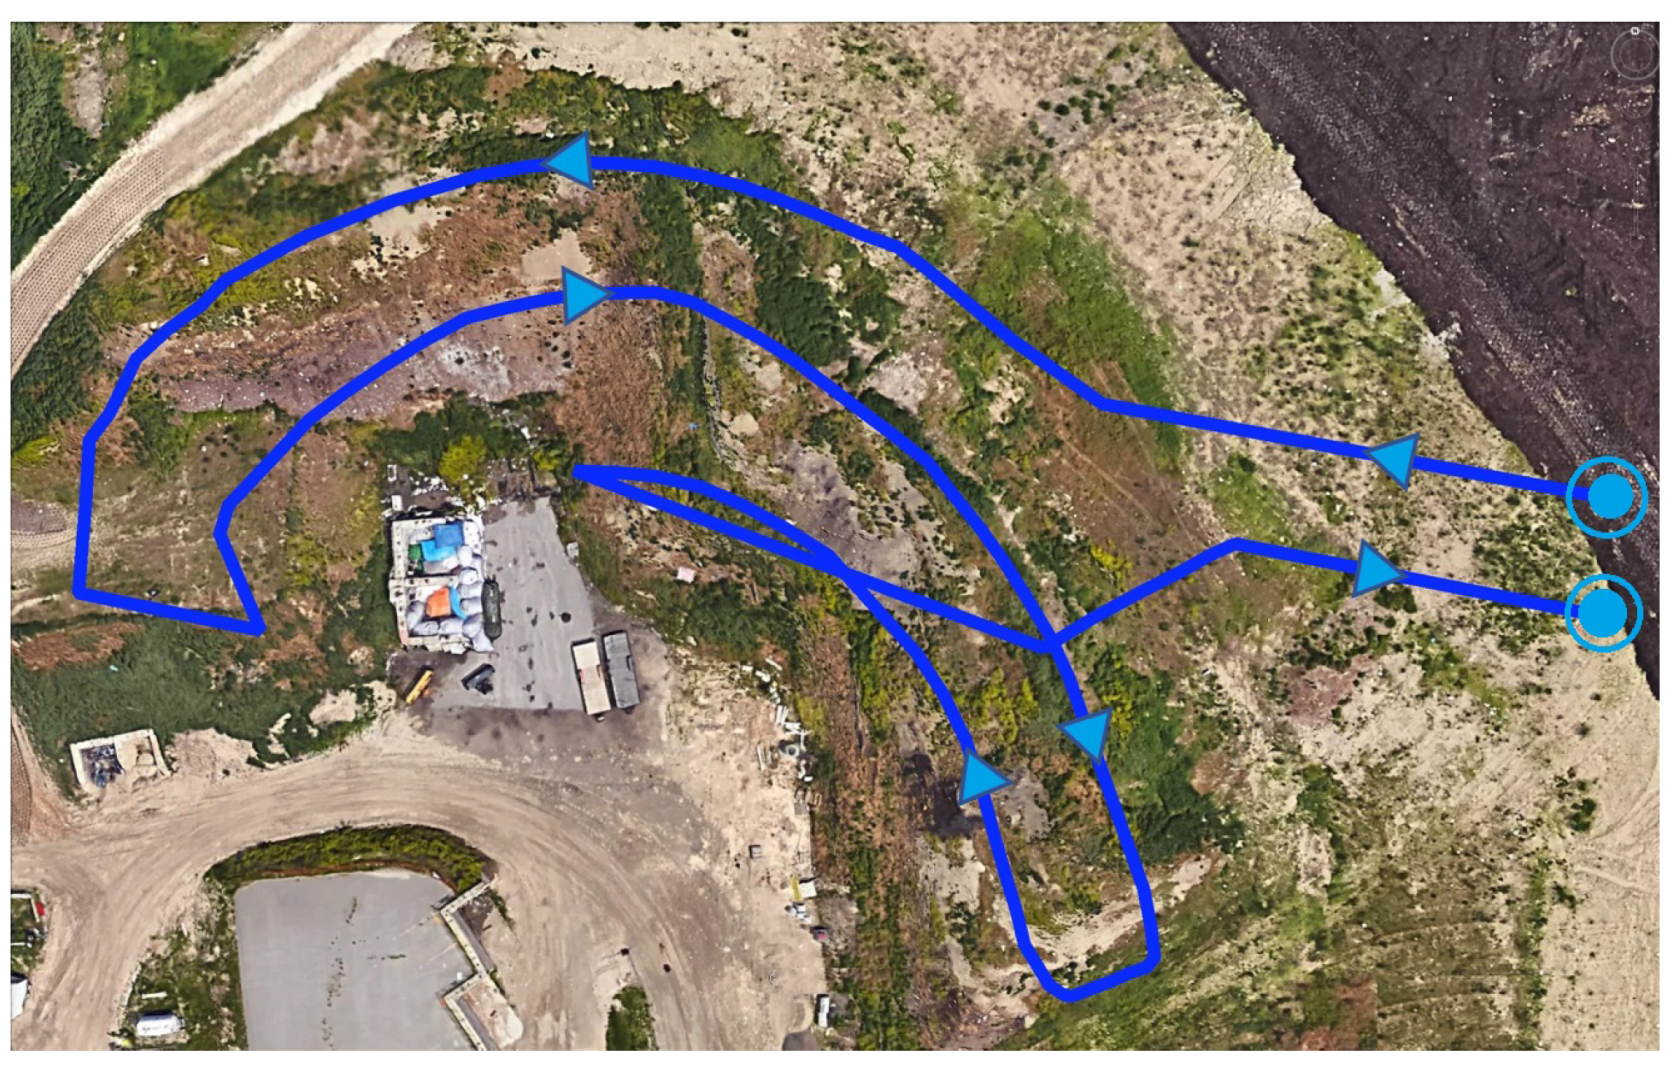
The flight path selected for the field trial was set-up as a series of arcs such that the UAV could fly at a roughly constant elevation above the ground. Different flight tests were carried out to analyze and compare their results. All the flight tests had the same complex flight path but were conducted at different elevations above the ground. Flight 1 had a 30 m elevation while Flight 2 was flown at 25 m above the ground. Both flights were conducted on a day with low wind velocities and they occurred with a roughly 5-min time lapse between end of Flight 1 and the start of Flight 2. The flights occurred in the morning. The flight control software was easily configured to handle the complex flight path. Figure 5 shows the selected flight path overlaid on an ortho-photo of the area of interest.
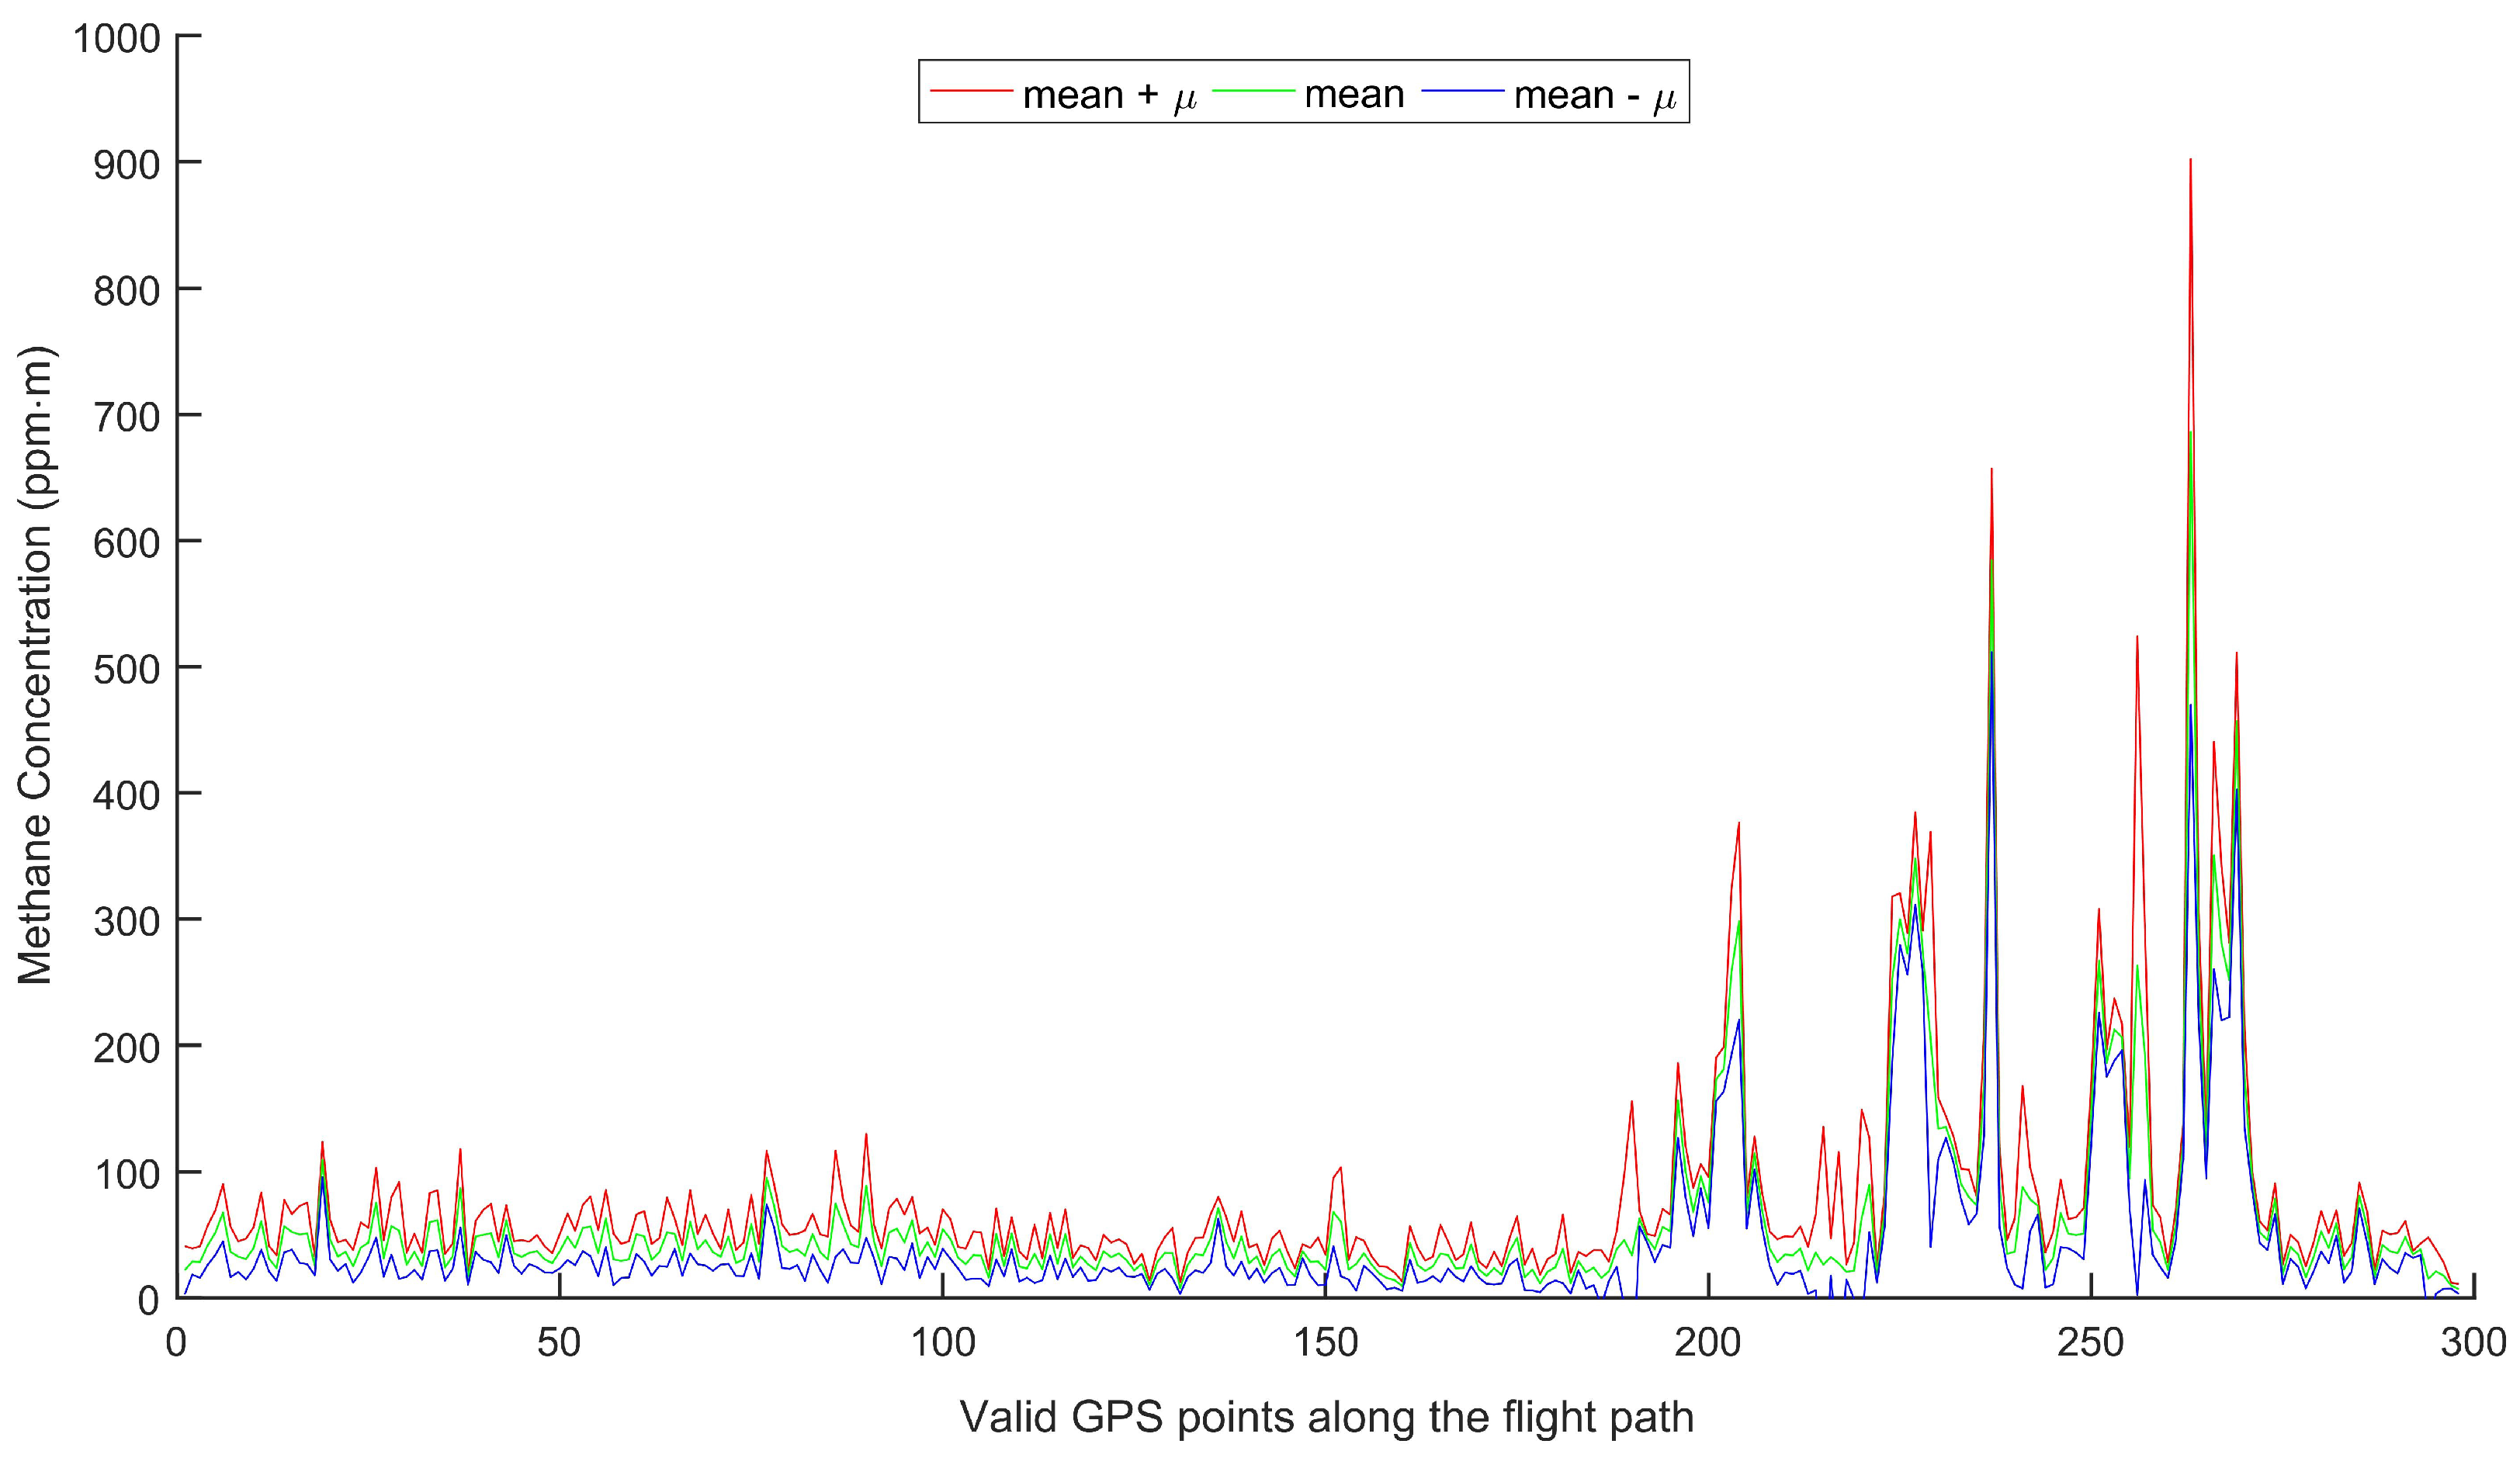
The methane detector measures the gas concentration at a sampling rate much higher than the GPS sensor. Thus, for each GPS point, the system records typically 10 concentration measurements. However, the number of useful measurements varies for each corresponding GPS point due to occasional errors, such as miscommunications, measurement errors, and device errors. After the UAV landed and data were downloaded, a MATLAB code was used to filter out all measurements specified by the methane sensor as containing error codes. As an example, for Flight 1, approximately 8% of the 4380 recorded measurements were removed from the data set. The code also selects all concentration measurements associated with the same GPS location and calculates the mean value and standard deviation assuming the data follows a t-distribution. The t-distribution was chosen due to the small number of concentration measurements for each GPS point. Figure 6 shows the data from Flight 1. Finally, the code generates a KML file for visualization of concentration levels in GIS software. This file makes it easier to visualize the spatial distribution of the methane levels. For mapping purposes, a set of thresholds was used to color code the measured concentrations at four levels as shown in Table 5.
Figure 7 shows the results obtained from the two test flights. The colored symbols indicate the level of the methane concentration at various locations along the flight path. The two flights gave repetitive measurements of higher methane concentrations in the air above a few specific locations in the landfill. The red symbols indicate a high relative methane concentration. Mid and low levels of methane concentration are represented by the yellow and green symbols respectively. The two figures show some differences in the methane concentrations for similar GPS locations. This discrepancy may be due to the measurement error, noise or actual variation of the gas concentration in response to changing weather conditions.
A heat map was generated using the combined methane concentration of both flight tests as shown in Figure 8. The heat map was build using QGIS software. The map takes into consideration not only the methane concentration at each valid GPS point but also the neighboring points within a 5 m radius. The result illustrates the relative gas concentration density around the area of interest. The figure shows likely sources for methane leakage coming from the hillside of the landfill cover. This location is where some of gas collection pipes and valves are located and it is known by the landfill operator that some that these were damaged and leaking.
4. Discussion
The reasons for measuring methane gas vary according to the end application. For instance, the objectives for landfill applications are mainly on controlling and quantifying gas emissions, which are necessary for regulatory purposes and for improving gas collection systems. However, in pipeline applications, the objectives are to detect, locate, and control gas leaks which are critical for maintaining the system’s functionality, reducing losses, and preventing explosions. In this work, we were focusing on detecting methane emissions and generating a methane concentration map for a small section of a landfill.
Detecting and monitoring gas emission from a landfill quickly and accurately is not an easy task. Payloads that are based on the integration of easy to operate and cost-effective methane detectors are preferred for routine monitoring compared to expensive and complex ones. One way to improve the monitoring is by enhancing the quality and the quantity of the collected data. Integrating information from more than one sensor can improve the measurement process and overcome the sensor’s disadvantages. For example, the main disadvantage of laser-based sensors comes from their small sampling area comparing to other sensors. Thus, integrating two or more laser sensors can improve redundancy and increase the sampling coverage, as has been done for pipeline leak detection [36]. Another technique to overcome this disadvantage is by using an actively controlled gimbal. Integrating data from different types of sensors can improve the process and provide extra information. For example, an optical camera with an image processing algorithm to detect possible gas emission sources such as valves and pipelines can be used to modify the flight path during the mission to further inspect the detected features [31]. Alternatively, the optical camera can be replaced by a mid-wave infrared cameras (MWIR), which captures the thermal radiation of an object. Using a MWIR camera, methane gas can be detected qualitatively and infrastructure, such as valves and pipelines, can be easily spotted and distinguished from the background. However, this type of camera is usually costly and heavy, and the use of such sensors is often not possible due to the payload weight limitation of targeted UAVs [41].
The purpose of this paper is to document our proof of concept of using an off-the-shelf methane sensor and a UAV to map methane concentrations. While other researchers have used far more sophisticated and expensive systems for mapping methane [35], the routine implementation of these systems for monitoring has not occurred. To make meaningful progress on identification and quantification of methane emissions from landfills and natural gas infrastructure, monitoring systems that are easier and less expensive to deploy are needed. Laser-based sensors are considered a good choice for similar UAV applications. Their advanced technology makes them compact, light, and easily integrated. The selected detector was simple to integrate with the UAV. During the flight start-up, a self-check on the methane detector was used to ensure its reliability and consistent performance. This procedure includes an automatic calibration supported by the device, which removes the need for regular calibration. The selected flight path was designed for the UAV to operate at an airspeed of 2 m/s with a total flight duration of approximately 10 min. In addition, the flight elevation was designed to be 25–30 m to reduce the interference of the rotors’ downwash with potential methane plumes near the ground. Furthermore, the wind effects on the methane concentration map were minimized by choosing a day with calm winds to fly and by also flying in the morning when wind speeds are typically the lowest. This explains the good repetition of methane concentration measurements for the two consecutive test flights illustrated in Figure 7.
The measurements of the methane concentration found in this work were in the range of 0–900 (ppm·m) which coincides with measurements for typical landfill methane concentrations [33]. In addition, the test flights illustrated how a UAV could be used to map the spatial distribution of the methane even in areas of complex topography. Our next task is to evaluate the system for inspection of gas pipelines. By simplifying the software work-flow and performing real-time data analysis on-board, we aim to have the methane sensor readings ready for visualization upon landing and on the fly. Provision of additional sensors such as infrared cameras, to gain further insight into any potential leaks, is also underway. We anticipate that our demonstration of this innovative, safe, and efficient method for detecting methane leaks will benefit the operators of landfills and natural gas infrastructure.
5. Conclusions
Inspection and monitoring of methane leaks are important components of safe operations of landfills and natural gas infrastructure. An efficient and cost-effective method to detect methane leaks was presented in this paper. The proposed method involves mounting a hand-held methane detector beneath a small UAV to measure methane concentration in a column of air below the UAV. The UAV autonomously follows a predefined path in an area of interest using the UAV’s mission planner software. The detector measures methane concentration at various locations and registers the measurements with respect to GPS readings marking the UAV location. When the flight is complete, the data recorded by the on-board microprocessor along with the corresponding GPS locations are available to the user to analyze and display. Our successful test at municipal landfill served to prove our system for methane detection and mapping in the field.
Acknowledgments
We acknowledge the financial support from MITACS and BC Oil & Gas Commission for this project. We would also like to thank Hetek Solutions Inc. for providing us with the methane detector, and Glenmore Landfill for allowing us to carry out our field test.
Author Contributions
All authors have made major contributions including designing the research and analyzing the result; Bara J. Emran integrated the system, conducted the flights, processed the data and wrote the manuscript; Dwayne D. Tannant processed the topographic map. Dwayne D. Tannant and Homayoun Najjaran were key in the data analysis process and revising the manuscript.
Conflicts of Interest
The authors declare no conflict of interest. The funding sponsors had no role in the design of the study; in the collection, analyses, or interpretation of data; in the writing of the manuscript, and in the decision to publish the results.
References
- Allen, G.; Gallagher, M.; Hollingsworth, P.; Illingworth, S.; Kabbabe, K.; Percival, C. Feasibility of Aerial Measurements of Methane Emissions from Landfills; Technical Report; Environmental Agency: Rotherham, UK, 2014. [Google Scholar]
- Konersmann, R.; Kühl, C.; Jörg, L. On the Risks of Transporting Liquid and Gaseous Fuels in Pipelines; Technical Report; BAM Federal Institute for Materials Research and Testing: Berlin, Germany, 2009. [Google Scholar]
- Woelk, M. The Future of Natural Gas Leak Detection. Available online: http://www.oilgasmonitor.com/the-future-of-natural-gas-leak-detection/5400/ (accessed on 26 July 2017).
- Peischl, J.; Ryerson, T.B.; Brioude, J.; Aikin, K.C.; Andrews, A.E.; Atlas, E.; Blake, D.; Daube, B.C.; De Gouw, J.A.; Dlugokencky, E.; et al. Quantifying sources of methane using light alkanes in the Los Angeles basin, California. J. Geophys. Res. Atmos. 2013, 118, 4974–4990. [Google Scholar] [CrossRef]
- Murvay, P.S.; Silea, I. A survey on gas leak detection and localization techniques. J. Loss Prev. Process Ind. 2012, 25, 966–973. [Google Scholar] [CrossRef]
- Batzias, F.A.; Siontorou, C.G.; Spanidis, P.M.P. Designing a reliable leak bio-detection system for natural gas pipelines. J. Hazard. Mater. 2011, 186, 35–58. [Google Scholar] [CrossRef] [PubMed]
- Zhang, L.B.; Qin, X.Y.; Wang, Z.h.; Liang, W. Designing a reliable leak detection system for West Products Pipeline. J. Loss Prev. Process Ind. 2009, 22, 981–989. [Google Scholar] [CrossRef]
- Scott, S.; Barrufet, M. Worldwide Assessment of Industry Leak Detection Capabilities for Single & Multiphase Pipelines; Technical Report; Department of Petroleum Engineering, Texas A&M University: Austin, TX, USA, 2003. [Google Scholar]
- Zhang, X. Statistical leak detection in gas and liquid pipelines. Pipes Pipelines Int. 1993, 38, 26–29. [Google Scholar]
- Quaife, L.; Acker, D. Pipeline leak location technique using a novel test fluid and trained dogs. In Proceedings of the Pipeline Pigging and Integrity Monitoring Conference, Houston, TX, USA, 1–4 February 1993. [Google Scholar]
- Liu, J.; Yao, J.; Gallaher, M.; Coburn, J.; Fernandez, R. Study on Methane Emission Reduction Potential in China’s Oil and Natural Gas Industry; Technical Report; Research Triangle Park: North Carolina, NC, USA, 2008. [Google Scholar]
- Minato, A.; Joarder, M.M.A.; Ozawa, S.; Kadoya, M.; Sugimoto, N. Development of a lidar system for measuring methane using a gas correlation method. Jpn. J. Appl. Phys. 1999, 38, 3610–3613. [Google Scholar] [CrossRef]
- Lowry, W.; Dunn, S.; Walsh, R.; Merewether, D.; Rao, D. Method and System to Locate Leaks in Subsurface Containment Structures Using Tracer Gases; Technical Report; Science & Engineering Associates, Inc.: Albuquerque, NM, USA, 2009. [Google Scholar]
- Sperl, J. System pinpoints leaks on Point Arguello offshore line. Oil Gas J. 1991, 89, 47–52. [Google Scholar]
- Bloom, D. Non-intrusive system detects leaks using mass measurement. Pipeline Gas J. 2004, 231, 20–21. [Google Scholar]
- Rougier, J. Probabilistic leak detection in pipelines using the mass imbalance approach. J. Hydraul. Res. 2005, 43, 556–566. [Google Scholar] [CrossRef]
- Liou, J. Leak detection by mass balance effective for Norman wells line. Oil Gas J. 1996, 94, 69–75. [Google Scholar]
- Hauge, E.; Aamo, O.M.; Godhavn, J.M. Model-based monitoring and leak detection in oil and gas pipelines. SPE Proj. Facil. Constr. 2009, 4, 53–60. [Google Scholar] [CrossRef]
- Verde, C.; Visairo, N. Bank of nonlinear observers for the detection of multiple leaks in a pipeline. In Proceedings of the 2001 IEEE International Conference on Control Applications, Mexico, 5–7 September 2001; pp. 714–719. [Google Scholar]
- El-Shiekh, T.M. Leak detection methods in transmission pipelines. Energy Sources 2010, 32, 715–726. [Google Scholar] [CrossRef]
- Souza de Joode, A.; Hoffman, A. Pipeline leak detection and theft detection using rarefaction waves. In Proceedings of the 6th Pipeline Technology Conference, Hannover, Germany, 4–5 April 2011. [Google Scholar]
- Farmer, E.J. Long-term field tests completed on pipe leak detector program. Offsh. Inc. Oilman 1991, 51, 86–90. [Google Scholar]
- Bergamaschi, P.; Frankenberg, C.; Meirink, J.F.; Krol, M.; Villani, M.G.; Houweling, S.; Dentener, F.; Dlugokencky, E.J.; Miller, J.B.; Gatti, L.V.; et al. Inverse modeling of global and regional CH 4 emissions using SCIAMACHY satellite retrievals. J. Geophys. Res. 2009, 114. [Google Scholar] [CrossRef]
- Gentry, S.; Walsh, P. The influence of high methane concentrations on the stability of catalytic flammable-gas sensing elements. Sens. Actuators 1984, 5, 229–238. [Google Scholar] [CrossRef]
- Kim, S.; Lee, D.W.; Lee, J.Y.; Eom, H.J.; Lee, H.J.; Cho, I.H.; Lee, K.Y. Catalytic combustion of methane in simulated PSA offgas over Mn-substituted La–Sr-hexaaluminate (La_xSr_1-x, MnAl_11O_19). J. Mol. Catal. A 2011, 335, 60–64. [Google Scholar] [CrossRef]
- Shin, W.; Imai, K.; Izu, N.; Murayama, N. Thermoelectric thick-film hydrogen gas sensor operating at room temperature. Jpn. J. Appl. Phys. 2001, 40, L1232–L1234. [Google Scholar] [CrossRef]
- Alarcon, M.; Ito, H.; Inaba, H. All-optical remote sensing of city gas through CH 4 gas absorption employing a low-loss optical fiber link and an InGaAsP light-emitting diode in the near-infrared region. Appl. Phys. B 1987, 43, 79–83. [Google Scholar] [CrossRef]
- Noda, K.; Takahashi, M.; Ohba, R.; Kakuma, S. Measurement of methane gas concentration by detecting absorption at 1300 nm using a laser diode wavelength-sweep technique. Opt. Eng. 2005, 44, 014301–014306. [Google Scholar]
- Mahony, R.; Kumar, V.; Corke, P. Multirotor aerial vehicles: Modeling, estimation, and control of quadrotor. IEEE Robot. Autom. Mag. 2012, 19, 20–32. [Google Scholar] [CrossRef]
- Hua, M.D.; Hamel, T.; Morin, P.; Samson, C. Introduction to feedback control of underactuated VTOLvehicles: A review of basic control design ideas and principles. IEEE Control Syst. 2013, 33, 61–75. [Google Scholar]
- Hausamann, D.; Zirnig, W.; Schreier, G.; Strobl, P.; Hausamann, D.; Zirnig, W. Monitoring of gas pipelines—A civil UAV application. Aircr. Eng. Aerosp. Technol. 2005, 77, 352–360. [Google Scholar] [CrossRef]
- Krishnamurthy, K. Alaska Uses Drones to Inspect Oil and Gas Pipelines at a Fraction Of the Cost. Available online: http://www.rawstory.com/2013/06/alaska-uses-drones-to-inspect-oil-and-gas-pipelines-at-a-fraction-of-the-cost/ (accessed on 26 July 2017).
- Frish, M.B.; Wainner, R.T.; Laderer, M.C.; Allen, M.G.; Rutherford, J.; Wehnert, P.; Dey, S.; Gilchrist, J.; Corbi, R.; Picciaia, D.; et al. Low-cost lightweight airborne laser-based sensors for pipeline leak detection and reporting. Proc. SPIE 2013, 8726, 87260–87269. [Google Scholar]
- Banica, A.; Kohn, J.; Tolton, B. RealSens airborne pipeline leak detection field operations results. In Proceedings of the Pipeline Technology Conference, Hannover Congress Centrum, Hannover, Germany, 18–20 March 2013; pp. 2–11. [Google Scholar]
- Tratt, D.M.; Buckland, K.N.; Hall, J.L.; Johnson, P.D.; Keim, E.R.; Leifer, I.; Westberg, K.; Young, S.J. Airborne visualization and quantification of discrete methane sources in the environment. Remote Sens. Environ. 2014, 154, 74–88. [Google Scholar] [CrossRef]
- Bretschneider, T.R.; Shetti, K. Uav-Based Gas Pipeline Leak Detection. Available online: https://www.researchgate.net/profile/Timo_Bretschneider/publication/275035983_UAV-based_gas_pipeline_leak_detection/links/553068770cf20ea0a06f7ea1.pdf (accessed on 26 July 2017).
- Lehmann, J.R.; Münchberger, W.; Knoth, C.; Blodau, C.; Nieberding, F.; Prinz, T.; Pancotto, V.A.; Kleinebecker, T. High-Resolution Classification of South Patagonian Peat Bog Microforms Reveals Potential Gaps in Up-Scaled CH4 Fluxes by use of Unmanned Aerial System (UAS) and CIR Imagery. Remote Sens. 2016, 8, 173. [Google Scholar] [CrossRef] [Green Version]
- Khan, A.; Schaefer, D.; Tao, L.; Miller, D.J.; Sun, K.; Zondlo, M.A.; Harrison, W.A.; Roscoe, B.; Lary, D.J. Low power greenhouse gas sensors for unmanned aerial vehicles. Remote Sens. 2012, 4, 1355–1368. [Google Scholar] [CrossRef]
- Alaimo, A.; Artale, V.; Milazzo, C.L.R.; Ricciardello, A. PID controller applied to hexacopter flight. J. Intell. Robot. Syst. 2014, 73, 261–270. [Google Scholar] [CrossRef]
- Omari, S.; Hua, M.D.; Ducard, G.; Hamel, T. Hardware and software architecture for nonlinear control of multirotor helicopters. IEEE/ASME Trans. Mechatron. 2013, 18, 1724–1736. [Google Scholar] [CrossRef]
- Heath, M.W. Leak Detection Practices & Demonstration of Optical Imaging; Technical Report; Global Methane Initiatve: Jakarta, Indonesia, 2011. [Google Scholar]
Figure 1.
Hexacopter UAV with a laser-based methane detector in the orange box.

Figure 2.
Methane detector mounted to the UAV collects gas concentration data.

Figure 3.
Hardware system architecture.

Figure 4.
Contour map (1 m contour intervals) of the monitored location within the landfill.

Figure 5.
Flight path around area of interest.

Figure 6.
Methane concentration at each GPS location for Flight 1 using a t-distribution with 95% confidence on the values for ±1 standard deviation.
Figure 6.
Methane concentration at each GPS location for Flight 1 using a t-distribution with 95% confidence on the values for ±1 standard deviation.

Figure 7.
Spatial locations of methane concentration measurements at the landfill for Flights 1 and 2. The color code thresholds is shown in Table 5.
Figure 7.
Spatial locations of methane concentration measurements at the landfill for Flights 1 and 2. The color code thresholds is shown in Table 5.
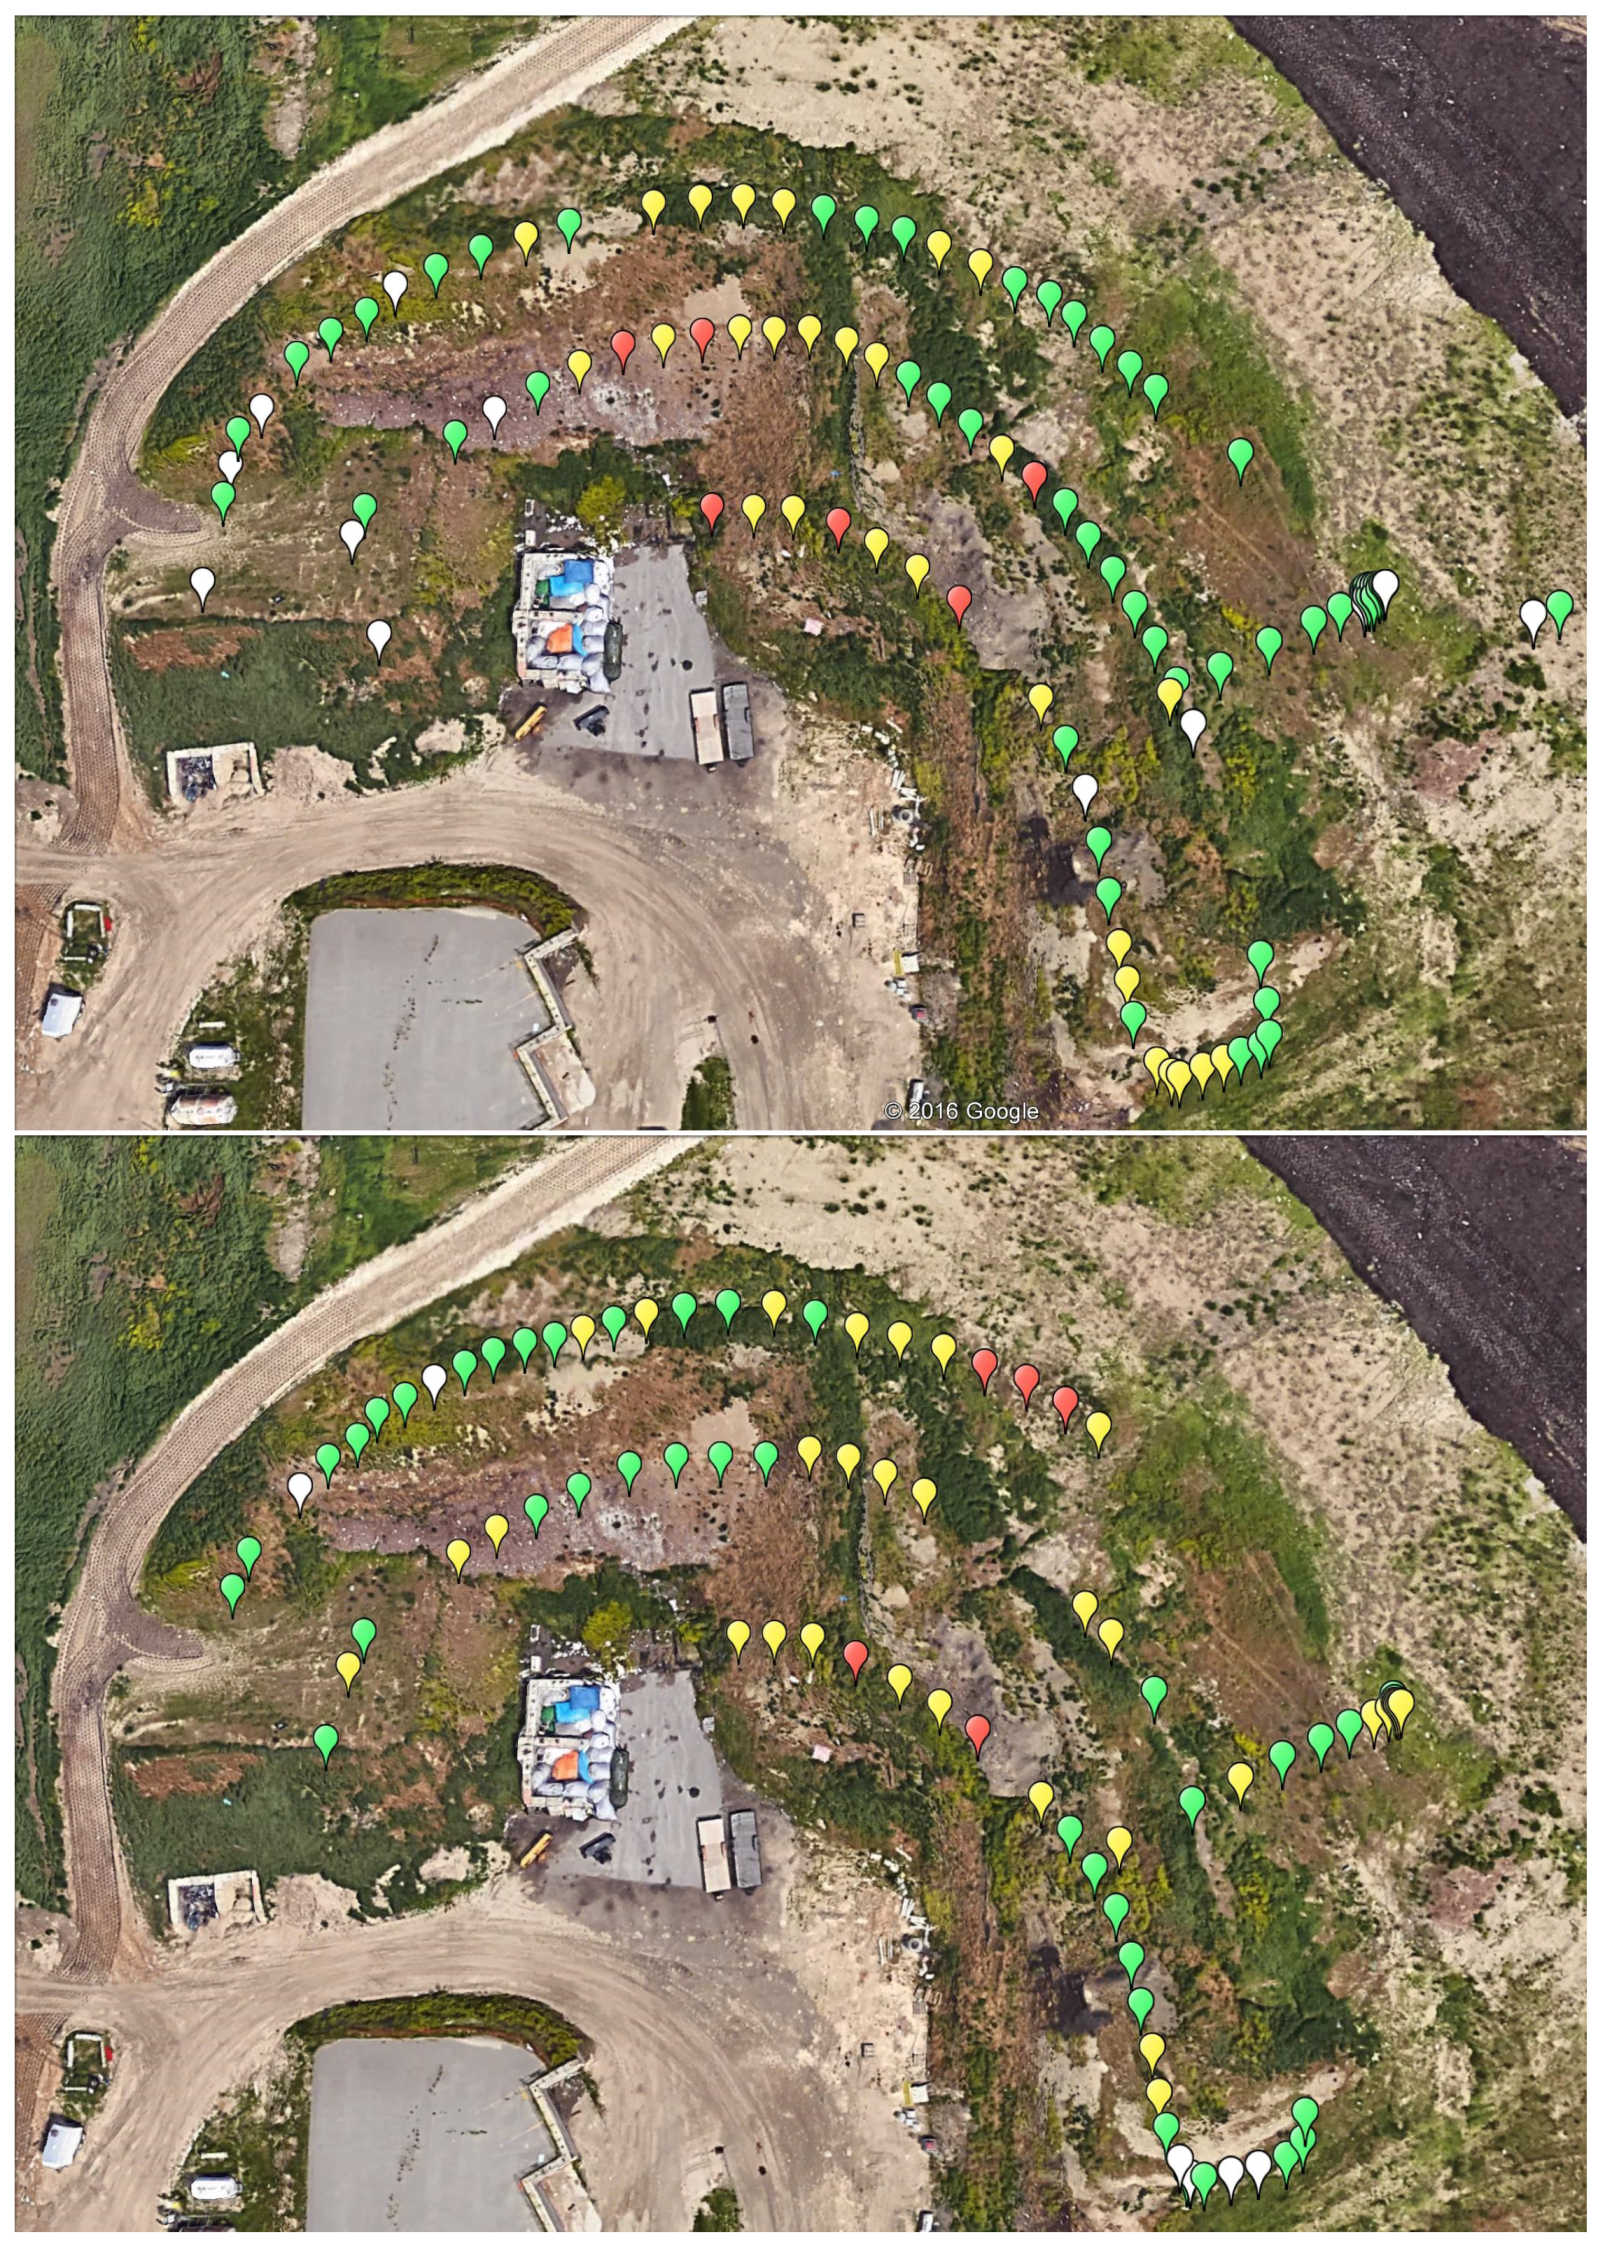
Figure 8.
Map showing areas of higher methane concentration.


Table 1.
Examples of leak detection methods often used, with a summary advantages and disadvantages.
Table 1.
Examples of leak detection methods often used, with a summary advantages and disadvantages.
| Method | Based Category Example | Advantages | Disadvantages |
|---|---|---|---|
| Non-technical | Trained dogs [10] | Straightforward | Effectiveness and accuracy |
| affected by fatigue | |||
| Soap bubble screening [11] | Low-cost | Require accessibility | |
| Immediate localization | experience | ||
| Hardware-based | Optical methods [12] | High sensitivity | Expensive |
| Remote sensing | Short system lifetime | ||
| Soil monitoring [13] | Low false alarm rate | Expensive | |
| High sensitive | |||
| Vapor sampling [14] | Determine location and | Slow response time | |
| size of a leak | Applicable for pipelines | ||
| Ultrasonic flow meters [15] | Good accuracy | Difficulties in implementation | |
| Software based | Mass/volume balance [16,17] | Low-cost | Case false alarm |
| Easily installed | Depends on leak size | ||
| Real-time transient modeling [18,19] | Ability to detect small | Expensive - Requires | |
| leaks | extensive instrumentation | ||
| Negative pressure wave [20,21] | Accurate | Applicable for short pipelines | |
| Pressure point analysis [22] | Accurate | Works for static flow | |
| Works in harsh environments |
Table 2.
A comparison between different inspection processes.
| Inspection using | Advantages | Disadvantages |
|---|---|---|
| Foot patrol | Low cost | Slow |
| Straightforward | Cover Small segments | |
| Land vehicle | Moderate speed | Require extra infrastructure |
| Cover large segments | ||
| Helicopter | Fast | Accessibility limited |
| Cover large segments | High cost and maintenance | |
| UAV | Low cost | Short flight duration |
| High accessibility | ||
| Cover large segments |
Table 3.
UAV specifications.
| Technical Specifications | |
| Type | EVO Arm F800-R hexacopter |
| Power | Two 11.1v lipo-batteries |
| Weight | 5 kg |
| Propeller | 15” Carbon Fiber |
| Dimension | 800 mm diagonally |
| On-board sensors | IMU, magnetometer, |
| GPS, telemetry, barometer | |
| System Features | |
| Payload | 2.8 kg |
| Flight speed | 2 m/s (through the test) |
| Flight endurance | 30 min |
| Flight Control | |
| Software | Mission planner software (APM) |
| Autopilot | PIXHAWK |
| Flight mode | Two modes: radio control and |
| autonomous (waypoint navigation) | |
Table 4.
Main Specifications of Laser Methane mini-G.
| Item | Specifications |
|---|---|
| Weight | 530 g |
| Operating time | Approx. 5 h |
| Detection limits | 1 ∼ 50,000 ppm·m |
| Detection distance | 0.5 m ∼ 30 m |
| Laser output level | 10 mW (Class 1) |
| Accuracy of detection | ± 10 % |
| Operating temperature | −17 ∼ 50 °C |
| Measurement frequency | 10 Hz |
| Laser output wavelength | 1653 nm |
| Communication method | Bluetooth Ver.2.1 |
Table 5.
Methane concentration thresholds.
| Concentration Level | Concentration Range (ppm·m) | Color |
|---|---|---|
| Insignificant | < 25 | White |
| Low | 25–75 | Green |
| Medium | 75–150 | Yellow |
| High | >150 | Red |
© 2017 by the authors. Licensee MDPI, Basel, Switzerland. This article is an open access article distributed under the terms and conditions of the Creative Commons Attribution (CC BY) license (http://creativecommons.org/licenses/by/4.0/).
Share and Cite
MDPI and ACS Style
Emran, B.J.; Tannant, D.D.; Najjaran, H. Low-Altitude Aerial Methane Concentration Mapping. Remote Sens. 2017, 9, 823. https://doi.org/10.3390/rs9080823
AMA Style
Emran BJ, Tannant DD, Najjaran H. Low-Altitude Aerial Methane Concentration Mapping. Remote Sensing. 2017; 9(8):823. https://doi.org/10.3390/rs9080823
Chicago/Turabian StyleEmran, Bara J., Dwayne D. Tannant, and Homayoun Najjaran. 2017. "Low-Altitude Aerial Methane Concentration Mapping" Remote Sensing 9, no. 8: 823. https://doi.org/10.3390/rs9080823
Note that from the first issue of 2016, this journal uses article numbers instead of page numbers. See further details here.