
Mapping of the Invasive Species Hakea sericea Using Unmanned Aerial Vehicle (UAV) and WorldView-2 Imagery and an Object-Oriented Approach


Abstract
:
1. Introduction
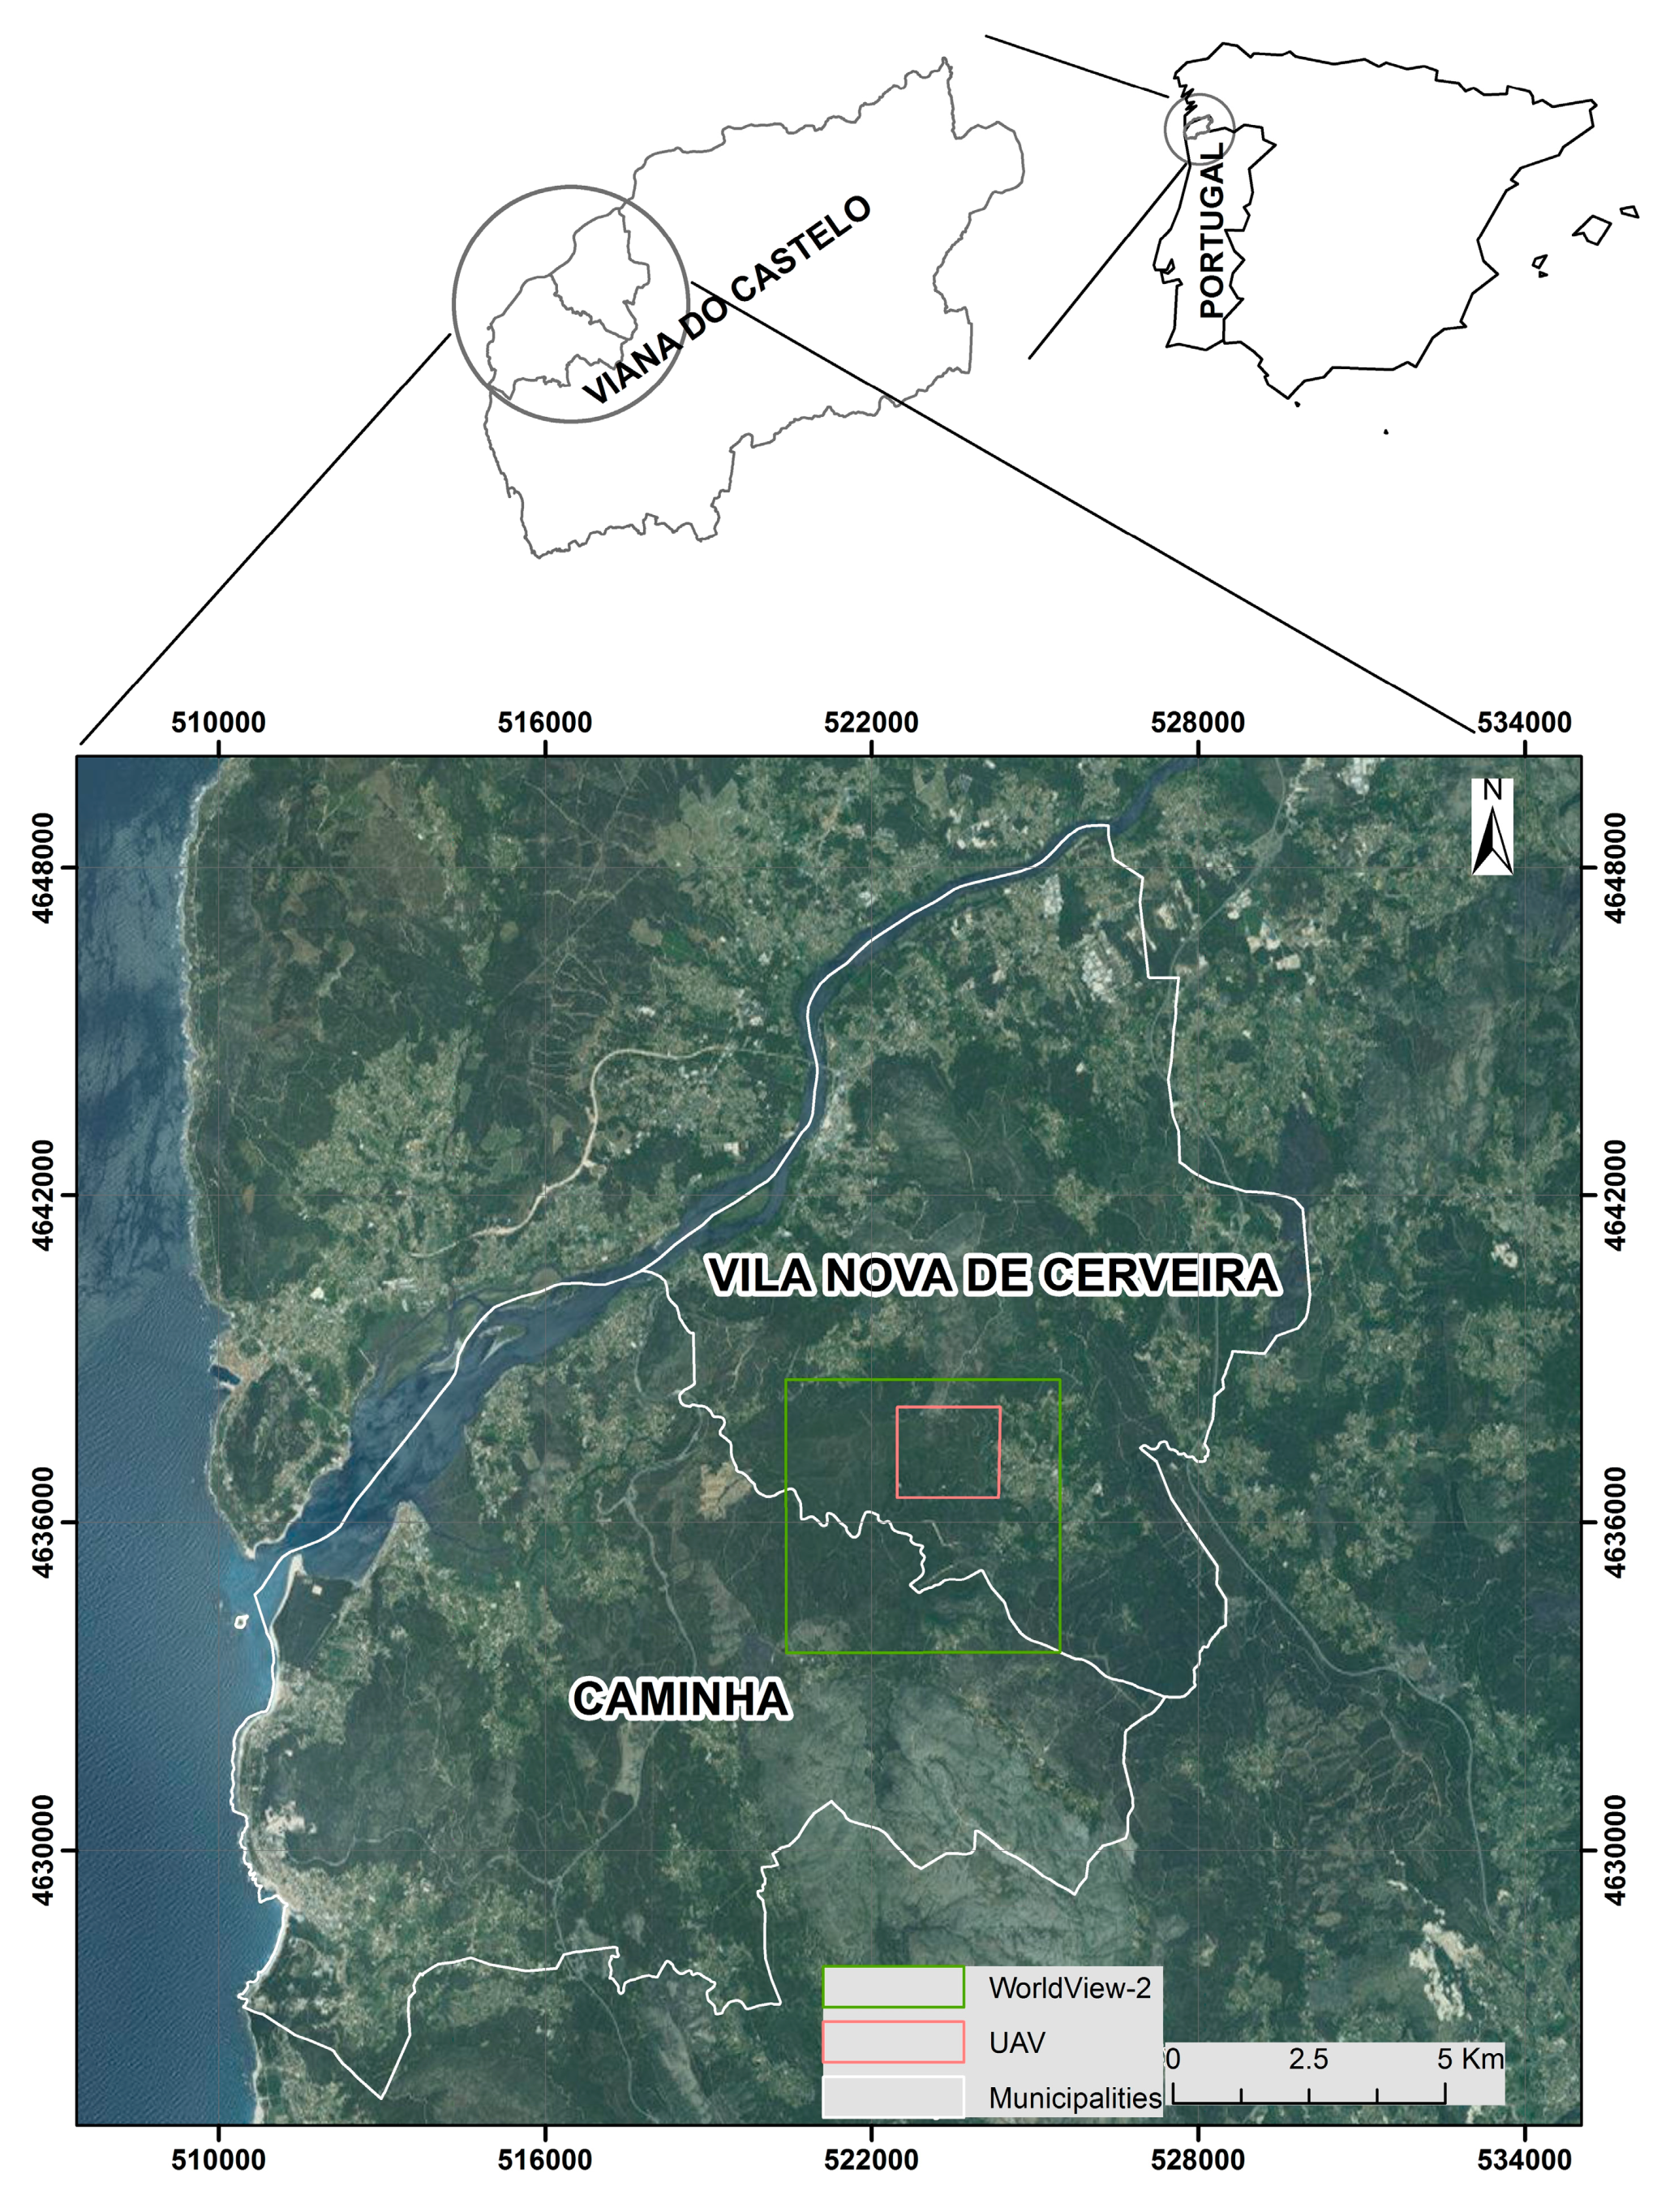
2. Study Area
3. Materials and Methods
3.1. Data
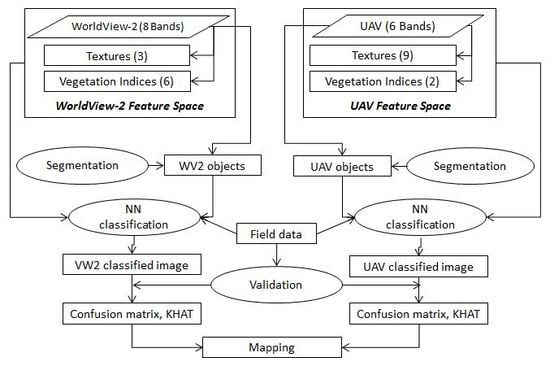
3.2. Methods
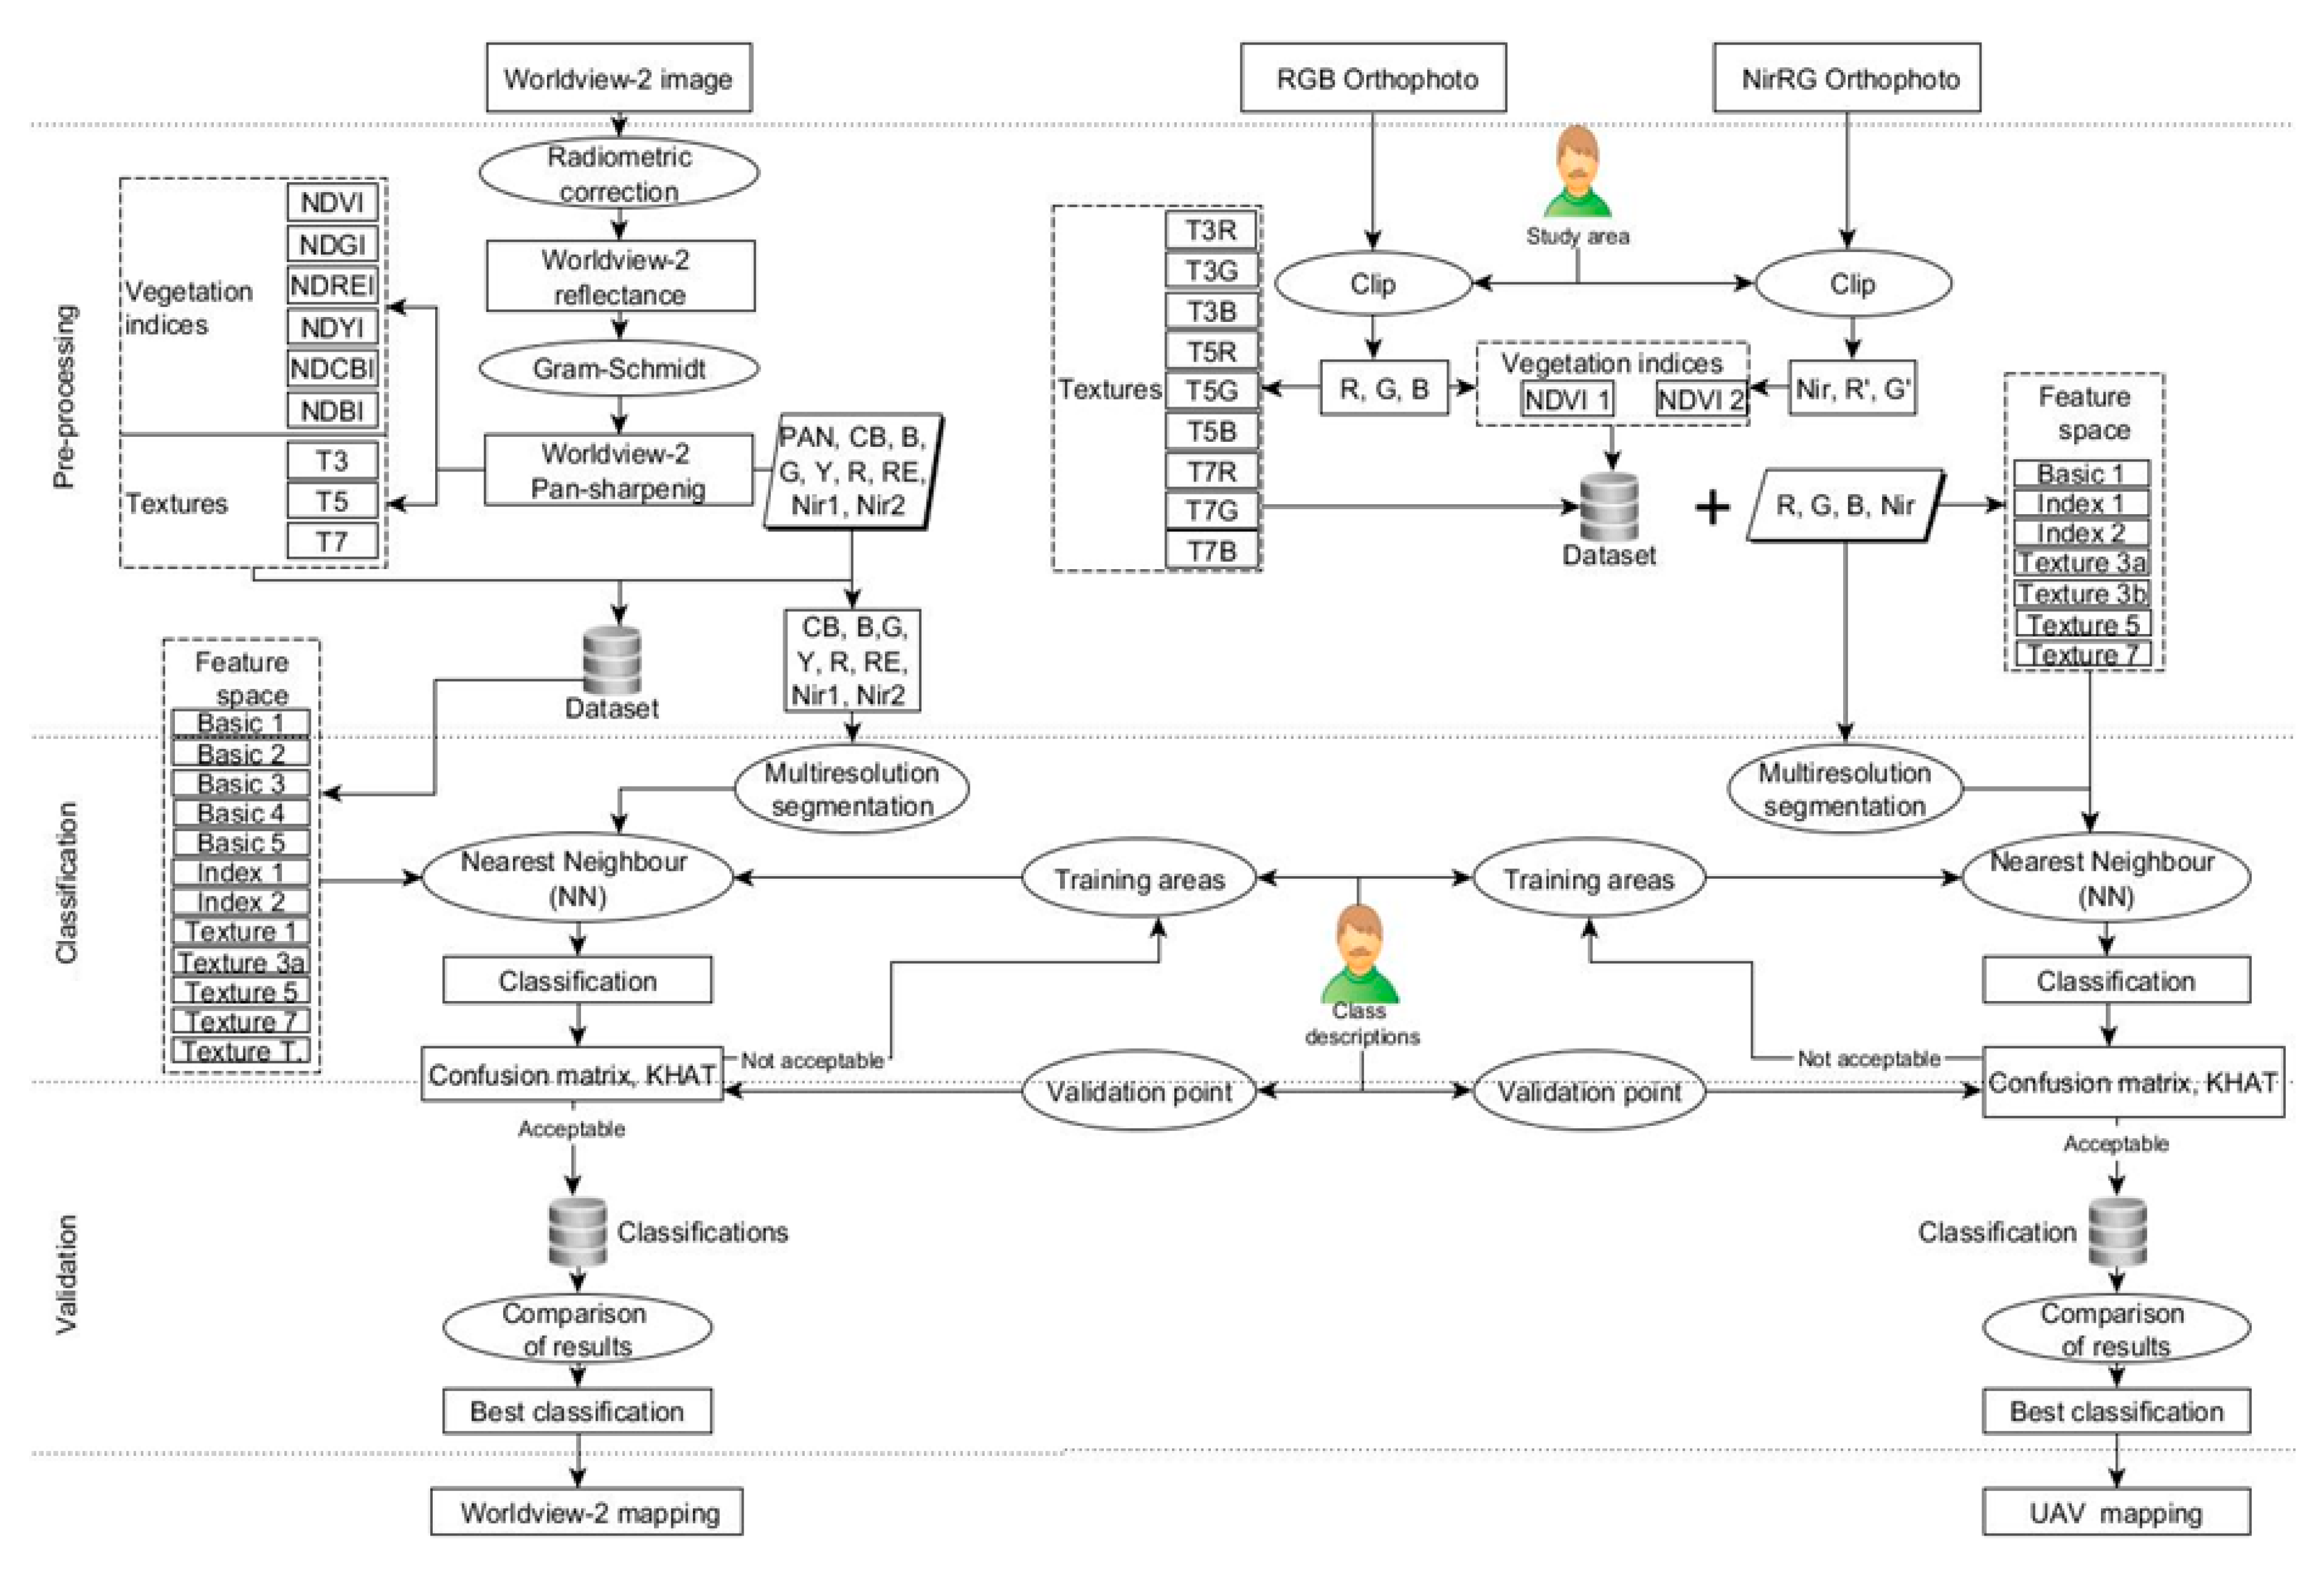
3.2.1. Preprocessing
3.2.2. Processing and Analysis (Classification)
3.2.3. Validation
3.2.4. Feature Space Selection
- The highest KHAT for the Hakea sericea class (with a statistically significant difference; p < 0.05).
- The highest producer’s accuracy the Hakea sericea class (lowest omission error). The classifications will be used to locate Hakea sericea with the aim of eliminating them; therefore it is more important to minimize the omission error than the commission error.
- The highest user’s accuracy for the Hakea sericea class (lowest commission error).
- Minimum volume and complexity of the input data (i.e., feature space, need of derived data like indices), because of their contribution to the processing time.
- The highest overall KHAT (with a statistically significant difference; p < 0.05).
- The highest overall accuracy of the classification.
4. Results
4.1. WorldView-2
4.2. UAV
4.3. Feature Space Selection
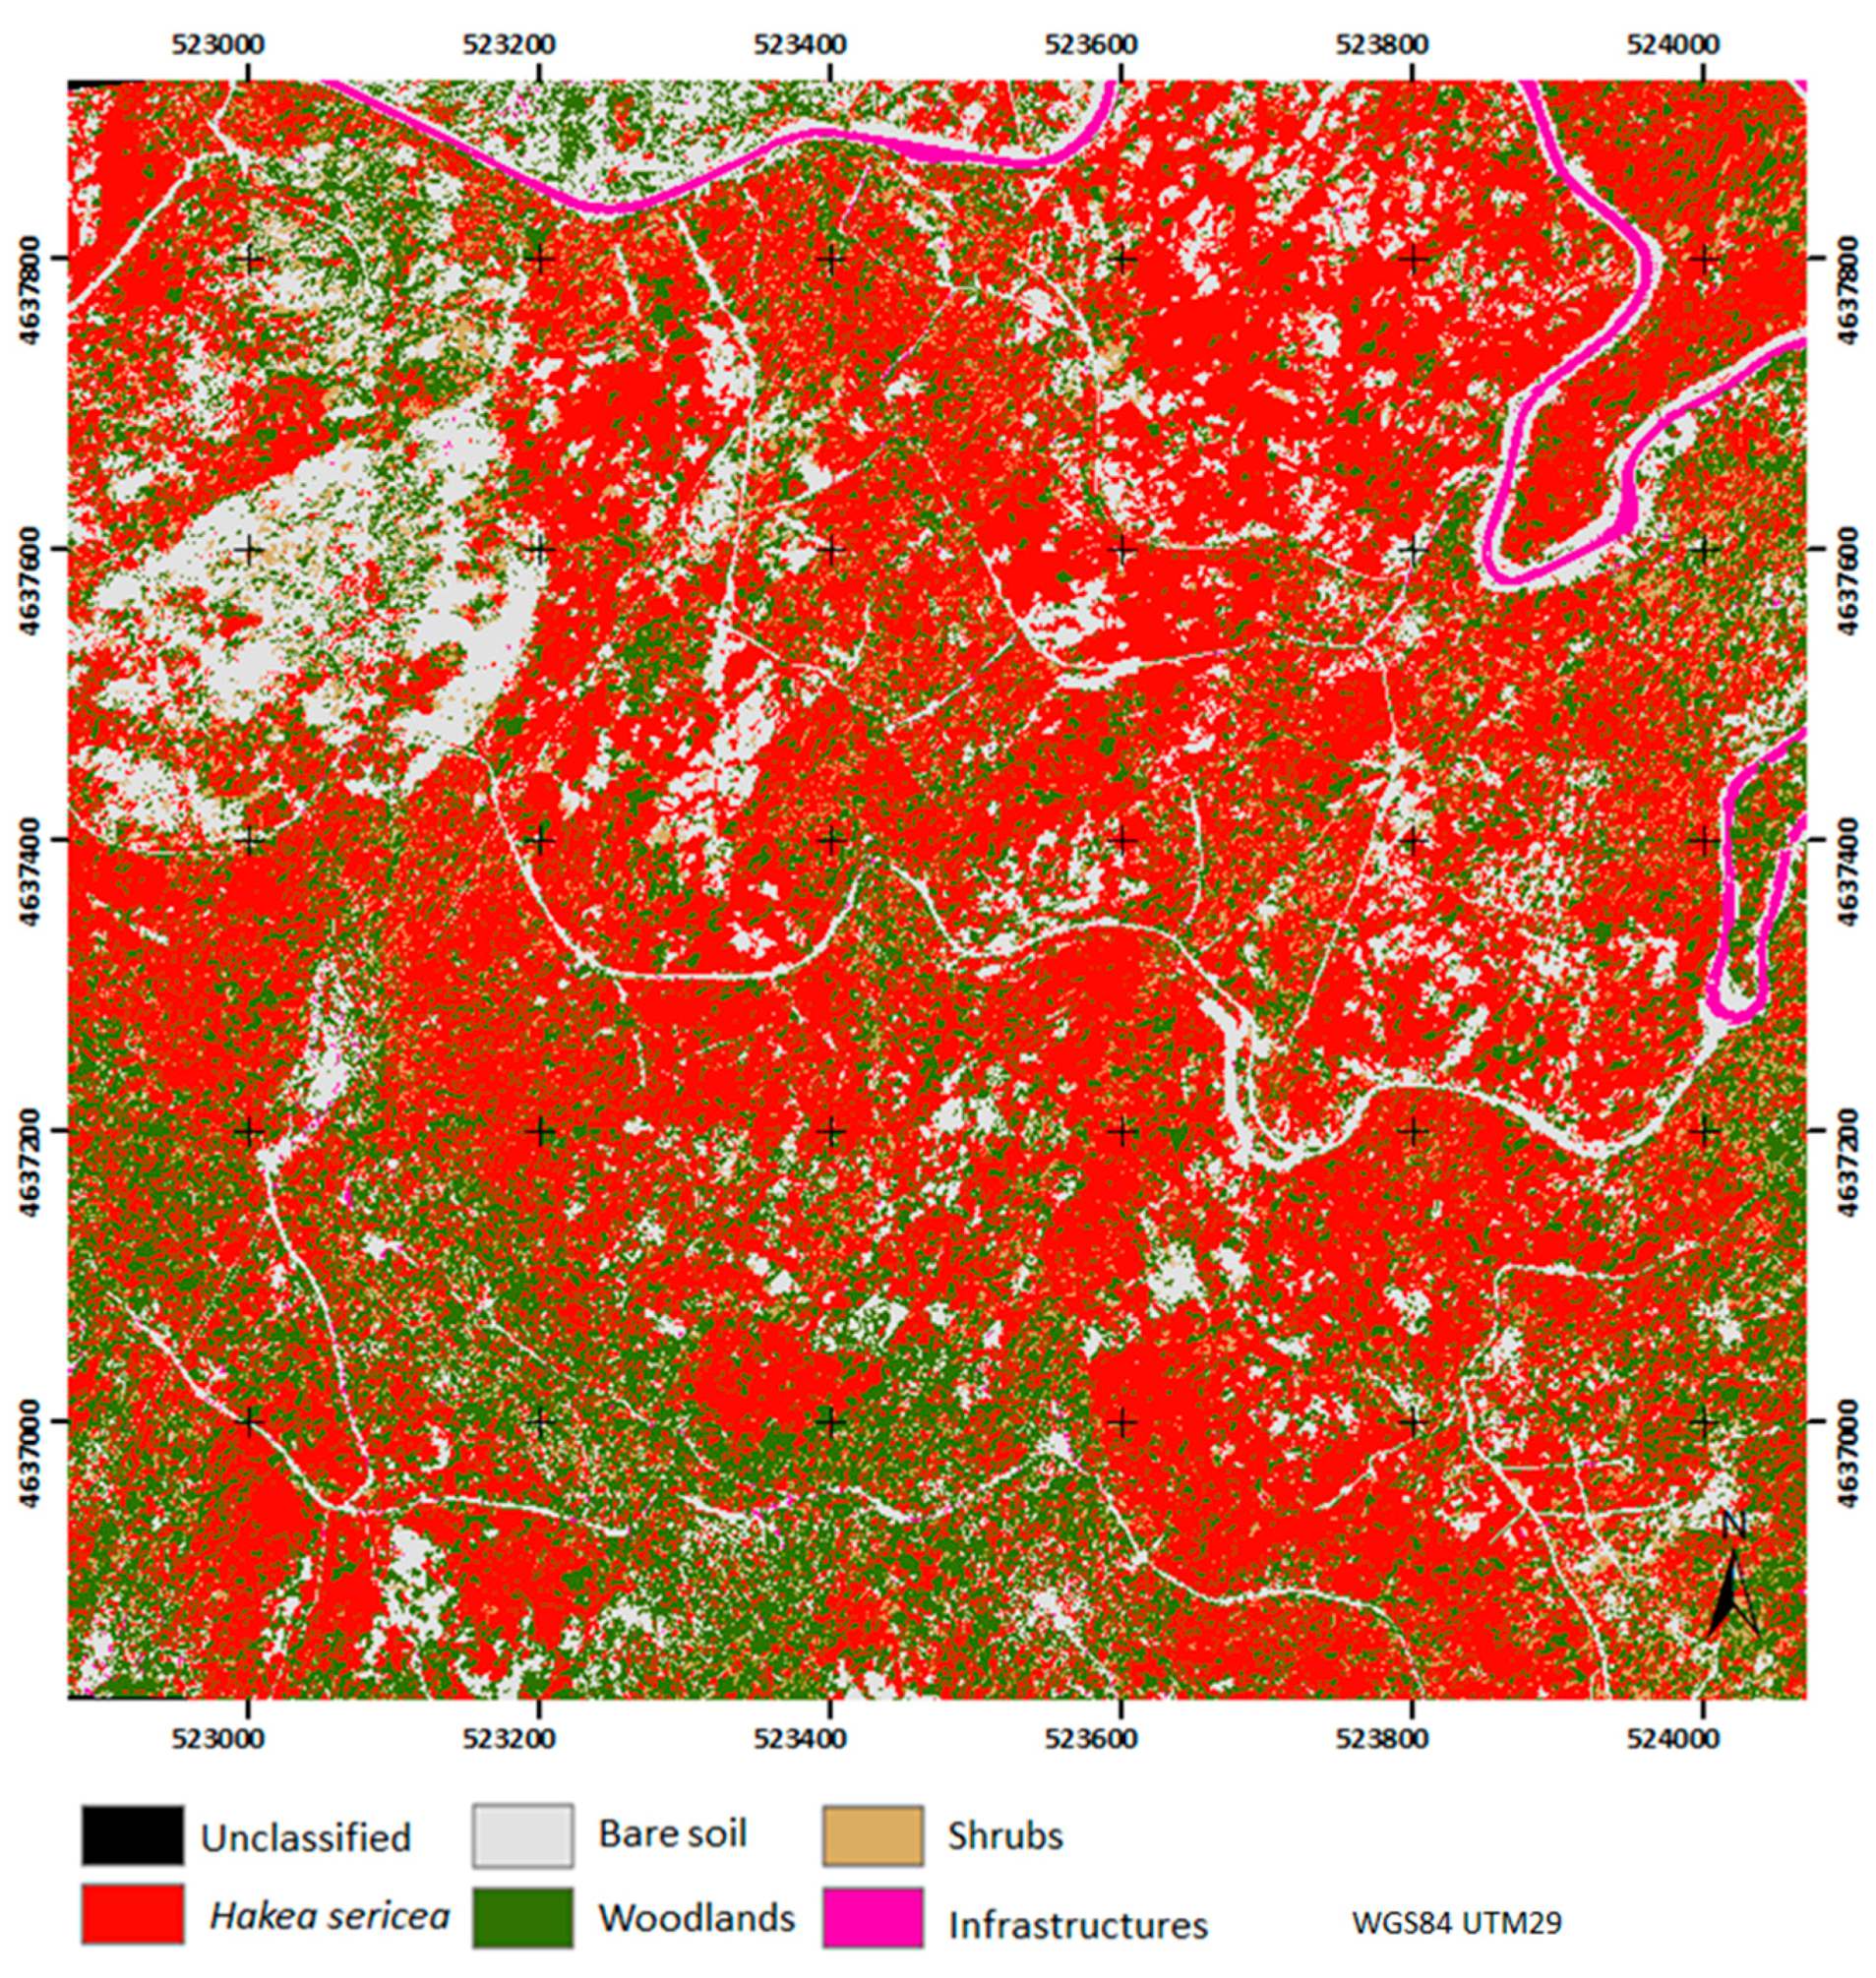
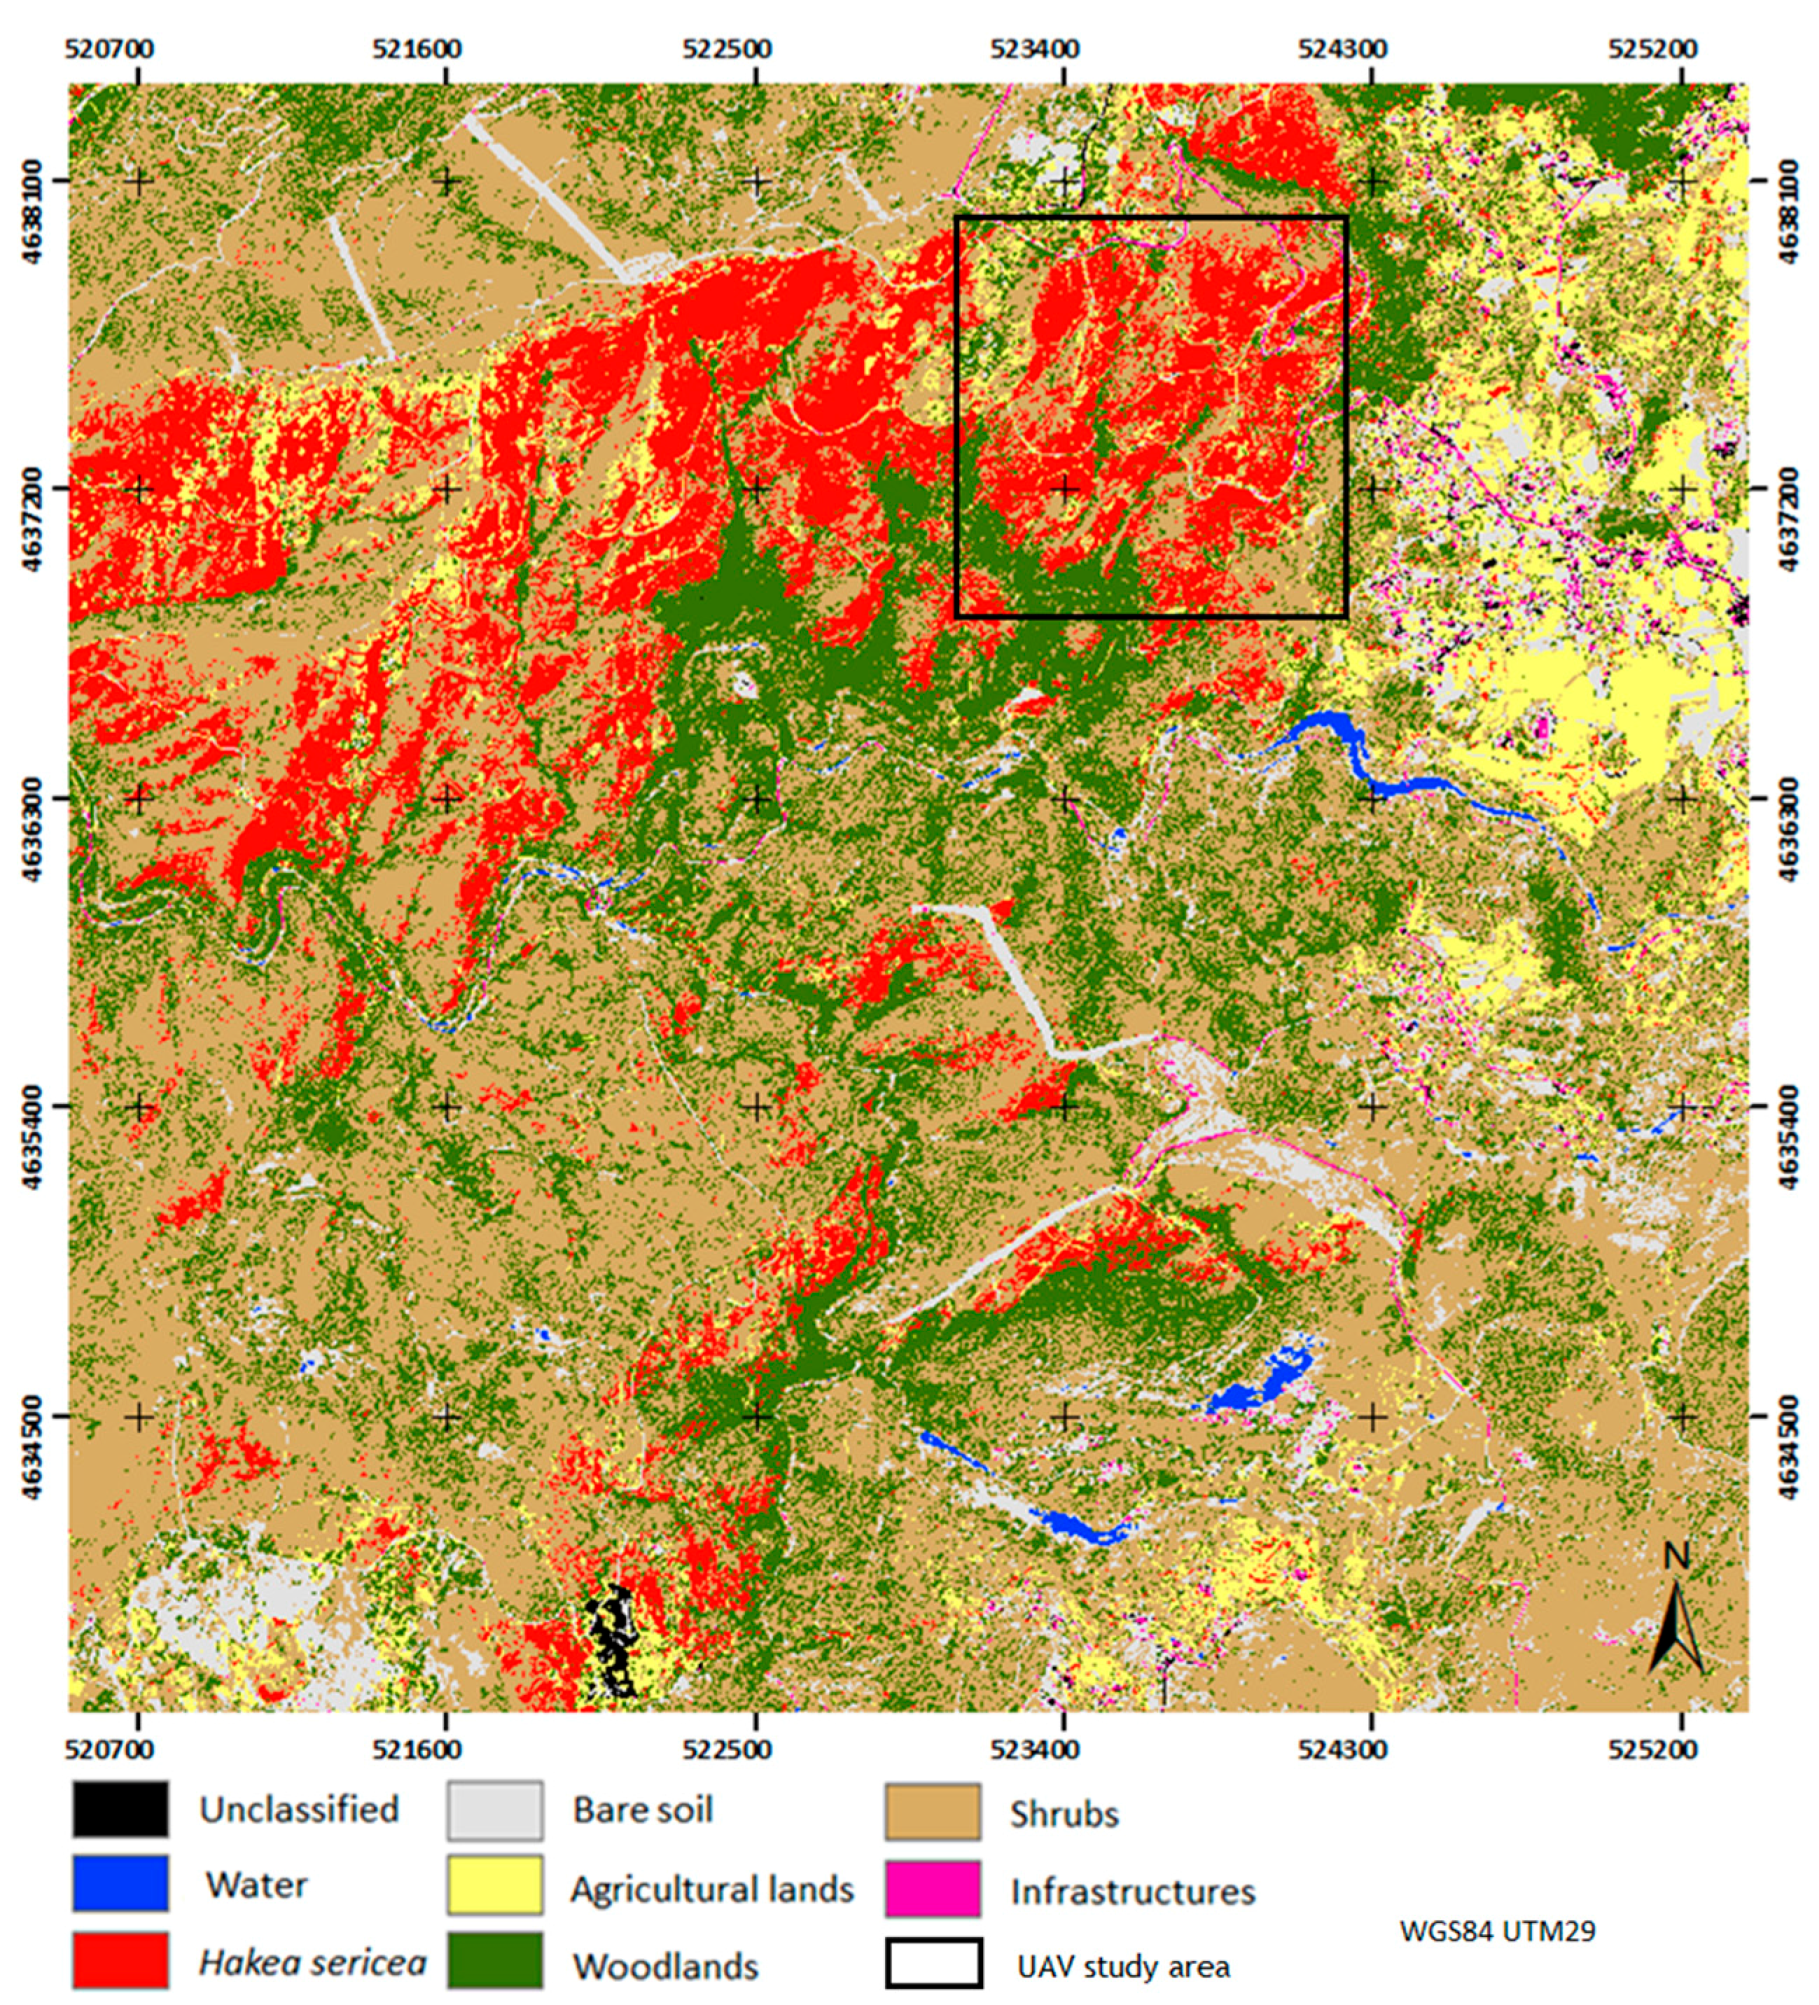
4.4. Area Colonized by the Hakea sericea in the Study Area
5. Discussion
- (i)
- identify the areas where invasive Hakea sericea is already installed;
- (ii)
- develop a working protocol in a procedural framework for quick and easy monitoring of the species;
- (iii)
- identify the key areas that need to be controlled for intervention and eradication of the species;
- (iv)
- after controlling the species, promote the recovery or installation of mixed forests in the area, when possible;
- (v)
- maintain and manage the new forest.
6. Conclusions
Acknowledgments
Author Contributions
Conflicts of Interest
References
- Morais, M.; Marchante, E.; Marchante, H. Big troubles are already here: Risk assessment protocol shows high risk of many alien plants present in Portugal. J. Nat. Conserv. 2017, 35, 1–12. [Google Scholar] [CrossRef]
- Richardson, D.M.; Van Wilgen, B.; Mitchell, D.T. Aspects of the reproductive ecology of four Australian Hakea species (Proteaceae) in South Africa. Oecologia 1987, 71, 1432–1939. [Google Scholar] [CrossRef] [PubMed]
- European Commission. Executive Summary of the Impact Assessment on the Prevention and Management of the Introduction and Spread of Invasive Species; European Commission: Brussels, Belgium, 2013. [Google Scholar]
- Almeida, J.D.; Freitas, H. Exotic naturalized flora of Continental Portugal—A new assessment. Bocconea 2012, 24, 231–237. [Google Scholar]
- Marchante, H.; Marchante, E.; Freitas, H. Invasive plant species in Portugal: An overview. In Proceedings of the International Workshop on Invasive Plants in Mediterranean Type Regions of the World, Mèze, France, 25–27 May 2005; Council of Europe Publishing: Strasbourg, France, 2007; pp. 99–103. [Google Scholar]
- Ministério do Ambiente. Decreto-Lei n° (565/99 de 21 de Dezembro. In Diário da República—I Série—A; Ministério do Ambiente: Lisbon, Portugal, 1999; Volume 295, pp. 9100–9114. [Google Scholar]
- Marchante, H.; Morais, M.; Freitas, H.; Marchante, E. Guia Prático Para a Identificacão de Plantas Invasoras em Portugal; Imprensa daUniversidade de Coimbra: Coimbra, Portugal, 2014. [Google Scholar]
- Esler, K.J.; van Wilgen, B.W.; Roller, K.S.T.; Wood, A.R.; van der Merwe, J.H. A landscape-scale assessment of the long-term integrated control of an invasive shrub in South Africa. Biol. Invasions 2010, 12, 211–218. [Google Scholar] [CrossRef] [Green Version]
- Forsyth, G.G.; Le Maitre, D.C.; O’Farrell, P.J.; Van Wilgen, B.W. The prioritisation of invasive alien plant control projects using a multi-criteria decision model informed by stakeholder input and spatial data. J. Environ. Manag. 2012, 103, 51–57. [Google Scholar] [CrossRef] [PubMed]
- Roura-Pascual, N.; Richardson, D.M.; Krug, R.M.; Brown, A.; Chapman, R.A.; Forsyth, G.G.; Le Maitre, D.C.; Robertson, M.P.; Stafford, L.; Van Wilgen, B.W.; et al. Ecology and management of alien plant invasions in South African fynbos: Accommodating key complexities in objective decision making. Biol. Conserv. 2009, 1595–1604. [Google Scholar] [CrossRef]
- Baard, J.A.; Kraaij, T. Alien flora of the Garden Route National Park, South Africa. J. Bot. 2014, 94, 51–63. [Google Scholar] [CrossRef]
- Bradley, B.A. Remote Detection of Invasive Plants: A Review of Spectral, Textural and Phenological Approaches. Biol. Invasions 2014, 16, 1411–1425. [Google Scholar] [CrossRef]
- Van Wilgen, B.W.; Richardson, D.M. The effects of alien shrub invasions on vegetation structure and fire behaviour in South African fynbos shrublands: A simulation study. J. Appl. Ecol. 1985, 22, 955–966. [Google Scholar] [CrossRef]
- Sousa, M.F.; Façanha, A.R.; Tavares, R.M.; Lino-Neto, T.; Gerós, H. Phosphate transport by proteoid roots of Hakea sericea. Plant Sci. 2007, 173, 550–558. [Google Scholar] [CrossRef]
- Mateus, P.; Fernandes, P.M. Forest Fires in Portugal: Dynamics, Causes and Policies. In Forest Context and Policies in Portugal; Reboredo, F., Ed.; Springer: Berlin, Germany, 2014; Volume 19, pp. 97–115. [Google Scholar]
- Fernandes, P.M.; Luz, A.; Loureiro, C. Changes in wildfire severity from maritime pine woodland to contiguous forest types in the mountains of northwestern Portugal. For. Ecol. Manag. 2010, 260, 883–892. [Google Scholar] [CrossRef]
- Rego, F.C.; Silva, J.S. Wildfires and landscape dynamics in Portugal: A regional assessment and global implications. In Forest Landscapes and Global Change; Azevedo, J.C., Perera, A.H., Pinto, M.A., Eds.; Springer: New York, NY, USA, 2014; pp. 51–73. [Google Scholar]
- Hulme, P.E. Biological Invasions: Winning the Science Battles but Losing the Conservation War? Oryx 2003, 37, 178–193. [Google Scholar] [CrossRef]
- Huang, C.; Asner, G.P. Applications of Remote Sensing to Alien Invasive Plant Studies. Sensors 2009, 9, 4869–4889. [Google Scholar] [CrossRef] [PubMed]
- Große-Stoltenberg, A.; Hellmann, C.; Werner, C.; Oldeland, J.; Thiele, J. Evaluation of Continuous VNIR-SWIR Spectra versus Narrowband Hyperspectral Indices to Discriminate the Invasive Acacia longifolia within a Mediterranean Dune Ecosystem. Remote Sens. 2016, 8, 334. [Google Scholar] [CrossRef]
- Wallace, C.S.A.; Walker, J.J.; Skirvin, S.M.; Patrick-Birdwell, C.; Weltzin, J.F.; Raichle, H. Mapping Presence and Predicting Phenological Status of Invasive Buffelgrass in Southern Arizona Using MODIS, Climate and Citizen Science Observation Data. Remote Sens. 2016, 8, 524. [Google Scholar] [CrossRef]
- West, A.M.; Evangelista, P.H.; Jarnevich, C.S.; Kumar, S.; Swallow, A.; Luizza, M.W.; Chignell, S.M. Using multi-date satellite imagery to monitor invasive grass species distribution in post-wildfire landscapes: An iterative, adaptable approach that employs open-source data and software. Int. J. Appl. Earth Obs. Geoinf. 2017, 59, 135–146. [Google Scholar] [CrossRef]
- Liu, M.; Li, M.; Li, L.; Man, W.; Jia, M.; Wang, Z.; Lu, C. Monitoring the Invasion of Spartina alterniflora Using Multi-source High-resolution Imagery in the Zhangjiang Estuary, China. Remote Sens. 2017, 9, 539. [Google Scholar] [CrossRef]
- Ng, W.T.; Rima, P.; Einzmann, K.; Immitzer, M.; Atzberger, C.; Eckert, S. Assessing the Potential of Sentinel-2 and Pléiades Data for the Detection of Prosopis and Vachellia spp. in Kenya. Remote Sens. 2017, 9. [Google Scholar] [CrossRef]
- Bustamante, J.; Aragonés, D.; Afán, I.; Luque, C.J.; Pérez-Vázquez, A.; Castellanos, E.M.; Díaz-Delgado, R. Hyperspectral Sensors as a Management Tool to Prevent the Invasion of the Exotic Cordgrass Spartina densiflora in the Doñana Wetlands. Remote Sens. 2016, 8, 1001. [Google Scholar] [CrossRef]
- Chance, C.M. Mapping the Distributions of Two Invasive Plant Species in Urban Areas with Advanced Remote Sensing Data. Ph.D. Thesis, University of British Columbia, Vancouver, BC, Canada, 2016. Available online: https://open.library.ubc.ca/cIRcle/collections/24/items/1.0305687 (accessed on 5 August 2016).
- Jones, D.; Pike, S.; Thomas, M.; Murphy, D. Object-Based Image Analysis for Detection of Japanese Knotweed s.l. taxa (Polygonaceae) in Wales (UK). Remote Sens. 2011, 3, 319–342. [Google Scholar] [CrossRef]
- Aragonés, D.; Fernández-Zamudio, R.; Bustamante, J.; García-Murillo, P.; Díaz-Delgado, R.; Cirujano, S. Cartografía de la superficie invadida por Azolla filiculolides en el parque nacional de Doñana mediante imágenes Landsat. In Proceedings of the XIII Conference of the Spanish Association of Remote Sensing, Calatayud, Spain, 23–26 September 2009; pp. 97–100. [Google Scholar]
- Ounuan, M.A. Utilização das Imagens de Satélite na Classificação e Distribuição de Invasoras Lenhosas. Master’s Thesis, Escola Superior Agrária de Ponte de Lima do Instituto Politécnico de Viana do Castelo, Ponte de Lima, Portugal, 2008. [Google Scholar]
- Müllerová, J.; Brůna, J.; Bartaloš, T.; Dvořák, P.; Vítková, M.; Pyšek, P. Timing Is Important: Unmanned Aircraft vs. Satellite Imagery in Plant Invasion Monitoring. Front. Plant Sci. 2017, 8, 887. [Google Scholar] [CrossRef] [PubMed]
- Boelman, N.T.; Asner, G.P.; Hart, P.J.; Martin, R.E. Multi-trophic invasion resistance in Hawaii: Bioacoustics, field surveys, and airborne remote sensing. Ecol. Appl. 2007, 17, 2137–2144. [Google Scholar] [CrossRef] [PubMed]
- Zuo, P.; Zhao, S.H.; Liu, C.A.; Wang, C.H.; Liang, Y.B. Distribution of Spartina spp. along China‘s coast. Ecol. Eng. 2012, 40, 160–166. [Google Scholar] [CrossRef]
- Huang, H.M.; Zhang, L.Q. A study of the population dynamics of Spartina alterniflora at Jiuduansha shoals, Shanghai, China. Ecol. Eng. 2007, 29, 164–172. [Google Scholar] [CrossRef]
- Wang, A.Q.; Chen, J.D.; Jing, C.W.; Ye, G.Q.; Wu, J.P.; Huang, Z.X.; Zhou, C.S. Monitoring the Invasion of Spartina alterniflora from 1993 to 2014 with Landsat TM and SPOT 6 Satellite Data in Yueqing Bay, China. PLoS ONE 2015, 10, e0135538. [Google Scholar] [CrossRef] [PubMed]
- Groeneveld, D.P.; Watson, R.P. Near-infrared discrimination of leafless saltcedar in wintertime Landsat TM. Int. J. Remote Sens. 2008, 29, 3577–3588. [Google Scholar] [CrossRef]
- Cirujano, S.; García-Murillo, P.; Fernandez-Zamudio, R.; Espinar, J.M.; Rubio, A.; Meco, A.; Lopéz-Bravo, I.; Sanchez-Andrés, R.; Sanchez-Carrillo, S.; Moreno, M.; et al. Estudio Y Control del Helecho Acuático Invasor Azolla Filiculoides en los Humedales del Parque Nacional de Doñana 2005–2008; Technical Report; Royal Botanic Garden of Madrid (CSIC): Madrid, Spain, 2008. [Google Scholar]
- Fuller, D.O. Remote detection of invasive Melaleuca trees (Melaleuca quinquenervia) in South Florida with multispectral IKONOS imagery. Int. J. Remote Sens. 2005, 26, 1057–1063. [Google Scholar] [CrossRef]
- Van Der Sande, C.J.; De Jong, S.M.; De Roo, A.P.J. A segmentation and classification approach of IKONOS-2 imagery for land cover mapping to assist flood risk and flood damage assessment. Int. J. Appl. Earth Obs. Geoinf. 2003, 4, 217–229. [Google Scholar] [CrossRef]
- Perea, A.J.; Meroño, J.E.; Aguilera, M.J. Clasificación orientada a objetos en fotografías aéreas digitales para la discriminación de usos del suelo. Interciencia 2009, 34, 612–616. [Google Scholar]
- Blaschke, T. Object based image analysis for remote sensing. ISPRS J. Photogramm. Remote Sens. 2010, 65, 2–16. [Google Scholar] [CrossRef]
- Fernandez-Luque, I.; Aguilar, F.J.; Álvarez, M.F.; Aguilar, M.A. Non-Parametric Object-Based Approaches to Carry Out ISA Classification From Archival Aerial Orthoimages. IEEE J. Sel. Top. Appl. Earth Obs. Remote Sens. 2013, 6, 2058–2071. [Google Scholar] [CrossRef]
- Fernandez-Luque, I.; Aguilar, F.J.; Aguilar, M.A.; Álvarez, M.F. Extraction of impervious surface areas from GeoEye-1 and WorldView-2 VHR satellite imagery using an object-based approach. J. Sel. Top. Appl. Earth Obs. Remote Sens. 2014, 7, 4681–4691. [Google Scholar] [CrossRef]
- Shamsoddini, A.; Trinder, J.C.; Turner, R. Pine plantation structure mapping using WorldView-2 multispectral image. Int. J. Remote Sens. 2013, 34, 3986–4007. [Google Scholar] [CrossRef]
- Tsai, F.; Chou, M.-J. Texture augmented analysis of high resolution satellite imagery in detecting invasive plant species. J. Chin. Inst. Eng. 2006, 29, 581–592. [Google Scholar] [CrossRef]
- Updike, T.; Comp, C. Radiometric Use of WorldView-2 Imagery. Technical Note. Available online: https://dg-cms-uploads-production.s3.amazonaws.com/uploads/document/file/104/Radiometric_Use_of_WorldView-2_Imagery.pdf (accessed on 17 July 2017).
- Laben, C.A.; Brower, B.V. Process for Enhancing the Spatial Resolution of Multispectral Imagery Using Pan-Sharpening. US Patent 6,011,875, 4 January 2000. [Google Scholar]
- Jensen, J.R. Introductory to Digital Image Processing: A Remote Sensing Perspective, 3rd ed.; Prentice Hall: Upper Saddle River, NJ, USA, 2005. [Google Scholar]
- Benz, U.C.; Hofmann, P.; Willhauck, G.; Lingenfelder, I.; Heynen, M. Multi-resolution, object-oriented fuzzy analysis of remote sensing data for GIS-ready information. ISPRS J. Photogramm. Remote Sens. 2004, 58, 239–258. [Google Scholar] [CrossRef]
- Definiens Imaging. eCognition 8.9 Reference Book; eCognition Document Version 1.2.1; Definiens Imaging: Munich, Germany, 2010. [Google Scholar]
- Keller, J.M.; Gray, M.R.; Givens, J.A. Fuzzy k-nearest neighbor algorithm. IEEE Trans. Syst. Man Cybern. 1985, SMC-15, 580–585. [Google Scholar] [CrossRef]
- Duda, R.O.; Hart, P.E. Pattern Classification and Scene Analysis; Wiley and Sons: New York, NY, USA, 1973. [Google Scholar]
- Mallinis, G.; Koutsias, N.; Tsakiri-Strati, M.; Karteris, M. Object-based classification using Quickbird imagery for delineating forest vegetation polygons in a Mediterranean test site. ISPRS J. Photogramm. Remote Sens. 2008, 63, 237–250. [Google Scholar] [CrossRef]
- Baatz, M.; Hoffmann, C.; Willhauck, G. Progressing from object-based to object-oriented image analysis. In Object Based Image Analysis; Blaschke, T., Lang, S., Hay, G.J., Eds.; Springer: New York, NY, USA, 2008; pp. 29–42. [Google Scholar]
- Congalton, R.G.; Green, K. Assessing the Accuracy of Remotely Sensed Data, 2nd ed.; CRC Press: Boca Raton, FL, USA, 2009. [Google Scholar]
- Sauro, J.; Lewis, J.R. Estimating completion rates from small samples using binomial confidence intervals: Comparison and recommendations. Proc. Human Factor Ergon. Soc. 2005, 49, 2100–2104. [Google Scholar] [CrossRef]
- Congalton, R.G. A review of assessing the accuracy of classifications of remotely sensed data. Remote Sens. Environ. 1991, 37, 35–46. [Google Scholar] [CrossRef]
- Jones, H.G.; Vaughan, R.A. Remote Sensing of Vegetation: Principles, Techniques, and Applications; Oxford University Press: Oxford, UK, 2010. [Google Scholar]
- Sanchez-Flores, E.; Rodriguez-Gallegos, H.; Yool, S.R. Plant invasions in dynamic desert landscapes. A field and remote sensing assessment of predictive and change modeling. J. Arid Environ. 2008, 72, 189–206. [Google Scholar] [CrossRef]
- Laba, M.; Downs, R.; Smith, S.; Welsh, S.; Neider, C.; White, S.; Richmond, M.; Philpot, W.; Baveye, P. Mapping invasive wetland plants in the Hudson River National Estuarine Research Reserve using QuickBird satellite imagery. Remote Sens. Environ. 2008, 112, 286–300. [Google Scholar] [CrossRef]
- Everitt, J.H.; Anderson, G.L.; Escobar, D.E.; Davis, M.R.; Spencer, N.R.; Andrascik, R.J. Use of remote sensing for detecting and mapping leafy spurge (Euphorbia esula). Weed Technol. 1995, 9, 599–609. [Google Scholar]
- Everitt, J.H.; Escobar, D.E.; Alaniz, M.A.; Davis, M.R.; Richerson, J.V. Using spatial information technologies to map Chinese tamarisk (Tamarix chinensis) infestations. Weed Sci. 1996, 44, 194–201. [Google Scholar]
- Müllerová, J.; Pyšek, P.; Jarošík, V.; Pergl, J. Aerial photographs as a tool for assessing the regional dynamics of the invasive plant species Heracleum mantegazzianum. J. Appl. Ecol. 2005, 42, 1042–1053. [Google Scholar] [CrossRef]
- Somodi, I.; Čarni, A.; Ribeiro, D.; Podobnikar, T. Recognition of the invasive species Robinia pseudacacia from combined remote sensing and GIS sources. Biol. Conserv. 2012, 150, 59–67. [Google Scholar] [CrossRef]
- Müllerová, J.; Pergl, J.; Pyšek, P. Remote sensing as a tool for monitoring plant invasions: Testing the effects of data resolution and image classification approach on the detection of a model plant species Heracleum mantegazzianum (giant hogweed). Int. J. Appl. Earth Obs. Geoinf. 2013, 25, 55–65. [Google Scholar] [CrossRef]
- Dorigo, W.; Lucieer, A.; Podobnikar, T.; Čarni, A. Mapping invasive Fallopia japonica by combined spectral, spatial, and temporal analysis of digital orthophotos. Int. J. Appl. Earth Obs. Geoinf. 2012, 19, 185–195. [Google Scholar] [CrossRef]
- Franklin, S.E.; Hall, R.J.; Moskal, L.M.; Maudie, A.J.; Lavigne, M.B. Incorporating texture into classification of forest species composition from airborne multispectral images. Int. J. Remote Sens. 2000, 21, 61–79. [Google Scholar] [CrossRef]
- Marceau, D.J.; Howarth, P.J.; Dubois, J.-M.M.; Gratton, D.J. Evaluation of the grey-level co-occurrence matrix method for land-cover classification using SPOT imagery. IEEE Trans. Geosci. Remote Sens. 1990, 28, 513–519. [Google Scholar] [CrossRef]
- Verhegghen, A.; Eva, H.; Ceccherini, G.; Achard, F.; Gond, V.; Gourlet-Fleury, S.; Cerutti, O.P. The Potential of Sentinel Satellites for Burnt Area Mapping and Monitoring in the Congo Basin Forests. Remote Sens. 2016, 8, 986. [Google Scholar] [CrossRef]
- Mallinis, G.; Mitsopoulos, I.; Chrysafi, I. Evaluating and comparing Sentinel 2A and Landsat-8 Operational Land Imager (OLI) spectral indices for estimating fire severity in a Mediterranean pine ecosystem of Greece. GISci. Remote Sens. 2017, 1–18. [Google Scholar] [CrossRef]
- Wu, Z.; Middleton, B.R.; Hetzler, R.; Vogel, J.M.; Dye, D.G. Vegetation burn severity mapping using Landsat-8 and WorldView-2. Photogramm. Eng. Remote Sens. 2015, 2, 143–154. [Google Scholar] [CrossRef]


| Class | WorldView-2 | UAV | ||
|---|---|---|---|---|
| Training Areas | Validation Points | Training Areas | Validation Points | |
| Forest | 208 | 101 | 111 | 30 |
| Hakea sericea | 95 | 76 | 54 | 50 |
| Shrubs | 83 | 86 | 17 | 31 |
| Infrastructures | 288 | 43 | 12 | 47 |
| Bare soil | 98 | 51 | 32 | 54 |
| Agriculture | 98 | 46 | - | - |
| Water | 6 | 8 | - | - |
| Total | 876 | 411 | 226 | 212 |
| FS | UAV Orthoimages | WorldView-2 |
|---|---|---|
| Basic 1 | R + G + B + Nir | R + G + B + Nir1 |
| Basic 2 | - | R + G + B + Nir1 + PAN |
| Basic 3 | - | R + G + B + Nir1 + CB + Y + RE + Nir2 |
| Basic 4 | - | Basic 3 + PAN |
| Basic 5 | - | Nir1 + Nir2 + RE + R |
| Index 1 | Basic 1 + NDVI-1 | NDVI + NDGI + NDYI + NDREI + NDCBI + NDBI |
| Index 2 | Basic 1 + NDVI-2 | Basic 1 + Index 1 |
| Texture 1 | Basic 1 + (T3R +T3G + T3B )+ (T5R + T5G + T5B) + (T7R + T7G + T7B) | Basic 3 + T3PAN + T5PAN + T7PAN |
| Texture 3a | Index 1 + T3R + T3G + T3B | Index 2 + T3PAN |
| Texture 3b | Basic 1 + T3R + T3G + T3B | - |
| Texture 5 | Index 1 + T5R + T5G + T5B | Index 2 + T5PAN |
| Texture 7 | Index 1+ T7R + T7G + T7B | Index 2 + T7PAN |
| Texture A | - | Index 2 + T3PAN + T5PAN + T7PAN |
| Feature Space | All Classes | Hakea sericea | |||
|---|---|---|---|---|---|
| OA (%) | KHAT | PA (%) | UA (%) | KHAT | |
| Basic 1 (B1) | 75.61 | 0.70 a | 76.92 (66.97–85.63) | 89.55 (80.96–96.03) | 0.88 ab |
| Basic 2 (B2) | 79.02 | 0.74 ab | 89.74 (81.92–95.74) | 92.11 (84.79–97.43) | 0.91 ab |
| Basic 3 (B3) | 80.98 | 0.77 b | 93.59 (86.84–98.33) | 94.81 (88.42–99.17) | 0.95 b |
| Basic 4 (B4) | 81.22 | 0.77 b | 93.59 (86.84–98.33) | 93.59 (86.84–98.33) | 0.93 b |
| Basic 5 (B5) | 78.05 | 0.73 ab | 89.74 (78.05–93.17) | 88.61 (80.58–94.88) | 0.87 ab |
| Index 1 (I1) | 70.00 | 0.63 c | 51.28 (40.29–62.22) | 83.33 (71.46–92.74) | 0.81 a |
| Index 2 (I2) | 74.63 | 0.69 c | 76.92 (66.97–85.63) | 89.55 (80.96–96.03) | 0.88 ab |
| Texture1 (T1) | 82.20 | 0.78 b | 93.59 (86.84–98.33) | 93.59 (86.84–98.33) | 0.93 b |
| Texture3a (T3a) | 80.00 | 0.75 ab | 88.46 (80.34–94.81) | 93.24 (86.16–98.23) | 0.93 b |
| Texture5 (T5) | 80.00 | 0.75 ab | 89.74 (81.92–95.74) | 93.33 (86.33–98.26) | 0.93 b |
| Texture7 (T7) | 80.24 | 0.76 ab | 91.03 (83.52–96.64) | 93.42 (86.50–98.28) | 0.93 b |
| TextureAll (TA) | 81.46 | 0.77 b | 91.03 (83.52–96.64) | 94.67 (88.12–99.07) | 0.94 b |
| Feature Space | All Classes | Hakea sericea | |||
|---|---|---|---|---|---|
| OA (%) | KHAT | PA (%) | UA (%) | KHAT | |
| Basic 1 (B1) | 75.47 | 0.68 a | 76.92 (64.59–87.41) | 72.90 (60.44–83.87) | 0.51 |
| Index 1 (I1) | 75.00 | 0.68 a | 76.92 (64.59–87.41) | 72.90 (60.44–83.87) | 0.51 |
| Index 2 (I2) | 75.47 | 0.68 a | 76.92 (64.59–87.41) | 72.90 (60.44–83.87) | 0.51 |
| Texture1 (T1) | 66.98 | 0.57 bc | 80.77 (68.98–90.46) | 66.94 (55.44–77.75) | 0.43 |
| Texture3a (T3a) | 69.34 | 0.61 b | 76.92 (64.59–87.41) | 70.93 (58.68–81.96) | 0.48 |
| Texture3b (T3b) | 69.81 | 0.61 b | 76.92 (64.59–87.41) | 70.93(58.68–81.96) | 0.48 |
| Texture5 (T5) | 67.45 | 0.58 c | 71.15 (58.24–82.62) | 67.14 (54.85–78.61) | 0.43 |
| Texture7 (T7) | 65.57 | 0.56 c | 73.08 (60.33–84.24) | 71.66 (59.00–82.93) | 0.49 |
| Feature Space | WorldView-2 | UAV |
|---|---|---|
| Name | Basic 3 | Basic 1 |
| KHAT (Hakea sericea) | 0.95 | 0.51 |
| Producer’s accuracy (%) | 93.59 | 76.92 |
| User’s accuracy (%) | 94.81 | 72.90 |
| Bands | CB, B, G, Y, R, RE, Nir1, Nir2 | R, G, B, Nir |
| Overall accuracy (%) | 80.98 | 75.47 |
| KHAT (global) | 0.77 | 0.68 |
© 2017 by the authors. Licensee MDPI, Basel, Switzerland. This article is an open access article distributed under the terms and conditions of the Creative Commons Attribution (CC BY) license (http://creativecommons.org/licenses/by/4.0/).
Share and Cite
Alvarez-Taboada, F.; Paredes, C.; Julián-Pelaz, J. Mapping of the Invasive Species Hakea sericea Using Unmanned Aerial Vehicle (UAV) and WorldView-2 Imagery and an Object-Oriented Approach. Remote Sens. 2017, 9, 913. https://doi.org/10.3390/rs9090913
Alvarez-Taboada F, Paredes C, Julián-Pelaz J. Mapping of the Invasive Species Hakea sericea Using Unmanned Aerial Vehicle (UAV) and WorldView-2 Imagery and an Object-Oriented Approach. Remote Sensing. 2017; 9(9):913. https://doi.org/10.3390/rs9090913
Chicago/Turabian StyleAlvarez-Taboada, Flor, Claudio Paredes, and Julia Julián-Pelaz. 2017. "Mapping of the Invasive Species Hakea sericea Using Unmanned Aerial Vehicle (UAV) and WorldView-2 Imagery and an Object-Oriented Approach" Remote Sensing 9, no. 9: 913. https://doi.org/10.3390/rs9090913