Spatial and Temporal Variability in Winter Precipitation across the Western United States during the Satellite Era

1
Department of Geosciences and Environment, California State University, Los Angeles, CA 90032, USA
2
Jet Propulsion Laboratory, California Institute of Technology, Pasadena, CA 91109, USA
*
Author to whom correspondence should be addressed.
Remote Sens. 2017, 9(9), 928; https://doi.org/10.3390/rs9090928
Submission received: 31 May 2017
/
Revised: 2 August 2017
/
Accepted: 31 August 2017
/
Published: 7 September 2017
(This article belongs to the Special Issue Remote Sensing Precipitation Measurement, Validation, and Applications)
Abstract
:The western United States is known for its water shortages due to large seasonal and inter-annual variability of precipitation as well as increasing demand. Climate change will impact the availability of water in the western United States through the modification of precipitation characteristics. Satellite data presents the opportunity to study these changes at a fine, continuous spatial resolution—particularly in places where no traditional ground observations exist. Utilizing the Tropical Rainfall Measuring Mission (TRMM) 3B42 version 7 precipitation data, this study examines the spatio-temporal changes in precipitation characteristics over the western United States between 1998 and 2015, and their connections with the atmospheric total column water vapor and the El Niño Southern Oscillation during the winter season. The results show that precipitation frequency in the western United States has been decreasing in general, precipitation totals and mean daily intensity are increasing in northwestern United States, but decreasing in the southwest United States during the 18 years of the study time period. Additionally, results show a strong relationship between total column water vapor and the precipitation characteristics, specifically in the southwestern United States.

1. Introduction
Precipitation, a significant variable in the water cycle, is predicted to change with the changing climate. As the air temperature increases its moisture, holding capacity will increase exponentially according to the Clausius-Clapeyron (C-C) equation [1]. Thus, precipitation characteristics such as frequency, total, and mean daily intensity will change [2,3,4]. Studies have suggested that precipitation extremes and daily precipitation intensity have been increasing in general, despite decreases in precipitation total and frequency of precipitation events in some places [3,4,5,6]. Studies have also suggested that increasing precipitation intensity and extremes are associated with increased surface air temperature and atmospheric water vapor [5,6].
Precipitation has decreased over the southwestern United States, but increased over the Midwest and the Great Plains between 1991 and 2012 (relative to the 1901–1960 average) [7]. This seems to be consistent with a general drying trend over the western United States since the 1970s, especially in the southwest, where mild to extreme drought has persisted in the past 4 decades [8]. The number and the intensity of heavy precipitation events have been increasing significantly across the United States between 1991 to 2012, especially in the Northeast, Great Plains, Midwest, and Southeast United States [7,9]. Even though the recent increases in heavy precipitation in the Northwest and Southwest United States between 1958 and 2012 are not larger than natural variations [10], projections of future climate suggest that the trend of increased heavy precipitation events will continue, even in the southwestern United States where total precipitation has been shown to decrease [7,9,11,12,13].
Previous studies have mostly relied on surface gauge data, ground radar data, or model reanalysis products for climatological analysis on precipitation trends and teleconnections [14]. While surface gauge data can have over 100 years of records on an approximately daily timescale, the gauges are often spread far apart, and not placed in a consistent spatial pattern [15]. There are only 640 stations in the Global Historical Climatology Network-Daily (GHCN-D) over the western United States that have rain gauges reporting at least 90% of the time [15]. Given the large spatial and temporal variation of precipitation and the complex topographical features of the western United States, information may be missed over the regions where there is no rain gauge [16].
The NCEP Stage IV ground radar product is available hourly in a gridded 4 km spatial product commonly used for many hydrological applications [15]. While Stage IV has a more consistent spatial and temporal resolution compared to rain gauges, it is not recommended for use in mountainous areas such as the western United States due to poor coverage [15]. Reanalysis precipitation products, while on a consistent spatial and temporal scale, can have a large bias and thus are not suitable for studies in examining climate variability and trend analysis [17]. Using observational satellite records to study regional precipitation over an extended period of time would remove these barriers and provide a more complete analysis, especially in the topographically complex western United States. This study will use two notable satellite products: Tropical Rainfall Measuring Mission (TRMM) for precipitation estimates, and the Atmospheric Infrared Sounder (AIRS) for total column water vapor and surface temperature estimates.
Due to the nature of climate regimes over the western United States where a majority of precipitation occurs during the winter season, winter season precipitation is chosen for this study [18,19]. In northern California, extreme precipitation events contribute a large portion (30–50%) of annual precipitation [20], with 85% of the variance in annual precipitation resulting from the top 5% wettest days per year [21]. The high intensity winter season precipitation plays a primary role in water resource management and water supply across the western U.S. [20].
This study explores the possible changes in three major precipitation characteristics of winter season precipitation frequency, seasonal total, and mean daily intensity by examining the winter seasonal time series of these characteristics over the western United States. In addition, their possible connections to atmospheric water vapor, surface air temperature, and El Nino/Southern Oscillation are explored. This study will use fine scale remote sensing data to (1) calculate the winter season precipitation frequency, seasonal total, and mean daily intensity, (2) quantify the temporal changes in the winter season precipitation characteristics, and (3) explore the correlation between the winter season precipitation characteristics and atmospheric water vapor, surface air temperature, and ENSO for the most recent decades of the satellite era. Figure 1 shows the elevation of the study region, as well as the sub-regions that are used for the detailed analysis in Section 3.2.
2. Materials and Methods
2.1. Data
Three major data sources are used in this study, two of which are satellite based (Table 1). The TRMM 3B42v7 daily precipitation from the time period 1998 to 2015 are from NASA’s Goddard Earth Sciences (GES) Data and Information Services Center (DISC). TRMM utilizes a combination of sensors in order to improve the accuracy, coverage, and resolution of precipitation data at a 3-hourly time scale of 0.25° latitude by 0.25° longitude between 50°N to 50°S [22]. The availability of over 18-year records of the Tropical Rainfall Measuring Mission (TRMM) allows for a climatological study at a high spatio-temporal resolution on the most recent decades. The TRMM dataset has less biased precipitation over western United States than over the eastern US, despite underestimating the precipitation at higher elevations [19,23].
The quality and accuracy of TRMM 3B42v7 over the continental US has been assessed by multiple studies and determined to be realistic [28,29,30]. When evaluated against ground-based gauge measurements, TRMM 3B42v6 had reduced biases on longer timescales, and therefore was recommended for long-term, retrospective climatological studies [30]. Maggioni et al. (2016) found that as compared to other satellite precipitation products, TRMM 3B42v7 is superior with a significant reduction in bias from Version 6 [28]. Over the continental US, TRMM has been found to have the lowest biases when compared to other satellite precipitation products because of the incorporation of the rain gauge correction [29]. However, TRMM can often underestimate the precipitation over the continental United States, with a low probability of detection rate (less than ~50%) [28]. TRMM 3B42 also has difficulty with orographic precipitation in high elevations as well as the underestimation of snow measurements because of the poor ability of the IR sensors to distinguish between raining and non-raining clouds [23,28]. So, precipitation in topographically complex regions in this study may have been systematically underestimated. Overall, TRMM 3B42v7 is an appropriate product for a long-term climatological study over an expansive region such as the western United States.
The precipitable water vapor and surface air temperature data from the Atmospheric Infrared Sounder (AIRS) is also provided by NASA’s GES DISC [26]. The AIRS data products are derived from a hyperspectral infrared instrument (AIRS), and two multichannel microwave instruments (AMSU-A) [25]. The level 3 product has twice daily values at a spatial resolution of 1° × 1° [25]. Precipitable water vapor and air temperature products derived from the AIRS retrieval algorithm have been validated against numerous other sources, and have been used in many research studies [25].
The El Niño Southern Oscillation is represented by the multivariate El Niño Southern Oscillation (ENSO) index, provided by the National Oceanic and Atmospheric Administration (NOAA). The Multivariate ENSO Index (MEI) utilizes six variables (sea-level pressure, surface wind, sea surface and air temperature, and the total cloudiness fraction of the sky) and Principal Component Analysis to calculate an index that is used to determine El Niño and La Niña conditions [27]. Compared to other ENSO Indices, this index was chosen because it utilizes the full multivariate signal of ENSO, rather than a single ocean-atmospheric variable such as sea-surface temperature. An index that takes a multivariate approach is a more balanced and appropriate way to determine the ENSO state because ENSO is a multivariate phenomenon [27].
2.2. Methods
In order to calculate winter season precipitation frequency, seasonal total, and mean daily intensity over the western United States utilizing daily 3B42v7 TRMM data, some preprocessing was necessary. First, each year was temporally subset to the winter season, defined as 1 December to the end of February of the following year, or DJF. The study area of the western United States is defined as 30°N to 50°N and 110°W to 125°W. We define this region as the “western United States” since it falls roughly west of the continental divide. It encompasses the west coast, the great basin and range region, and is west of the Rocky Mountains. Then, an ocean mask was applied to remove analysis artifacts from the “bleeding” of coastal gauge information into adjacent waters. According to the TRMM update in 2014, coastal bleeding as far as 1° is seen [31].
Winter season precipitation frequency is the number of days where precipitation exceeds 0.1 mm within each winter season, a metric used as the standard for precipitation events in many studies [6,32,33]. The seasonal total is the sum of the daily precipitation values that occurred for all three months of the season. Mean daily intensity is the seasonal total divided by the seasonal frequency for each year, which results in millimeters per day [6,12,13]. The seasonal mean air temperature is the seasonal average of mean daily temperature, and the seasonal total column water vapor is the seasonal average of the daily total column water vapor, both averaged from two values of ascending and descending passes.
The rate of change for frequency, total, and mean daily intensity of precipitation was calculated via a simple linear regression. For each grid point, the slope of the frequency, total, or mean daily intensity of precipitation was calculated with regard to time, or y = mx + b. In this example, y is the dependent variable (frequency, total, or daily mean intensity), x is time (year), b is the y-intercept, and m is the slope, or the rate of change. The slope, or rate of change is then multiplied by the time period to derive total changes during the study period, and is displayed in the figures.
Pearson’s R correlation analysis is used to examine the relationships of total, frequency, and the intensity to the surface air temperatures and atmospheric total column water vapor. The significance of the relationship is based on a 95% confidence level.
The averaged anomalies of each type of precipitation characteristics corresponding to El Niño and La Niña events were analyzed. For each calendar month, if the MEI index is above 0.5, the month is considered as an El Niño month, and if the MEI index value is below −0.5, the month is considered as a La Niña month [27]. For example, the El Niño years between 1999 and 2016 are the winter seasons that finished on years 2003, 2004, 2007, 2010, and 2016 (see Figure 2). Meanwhile, the La Niña years between 1999 and 2016 are the winter seasons that finished on years 1999, 2000, 2001, 2008, 2009, 2011, and 2012. For month considered to be either El Niño or La Niña, the averages of the anomalies of each type of precipitation characteristic were analyzed.
3. Results
3.1. Changing Winter Precipitation Characteristics
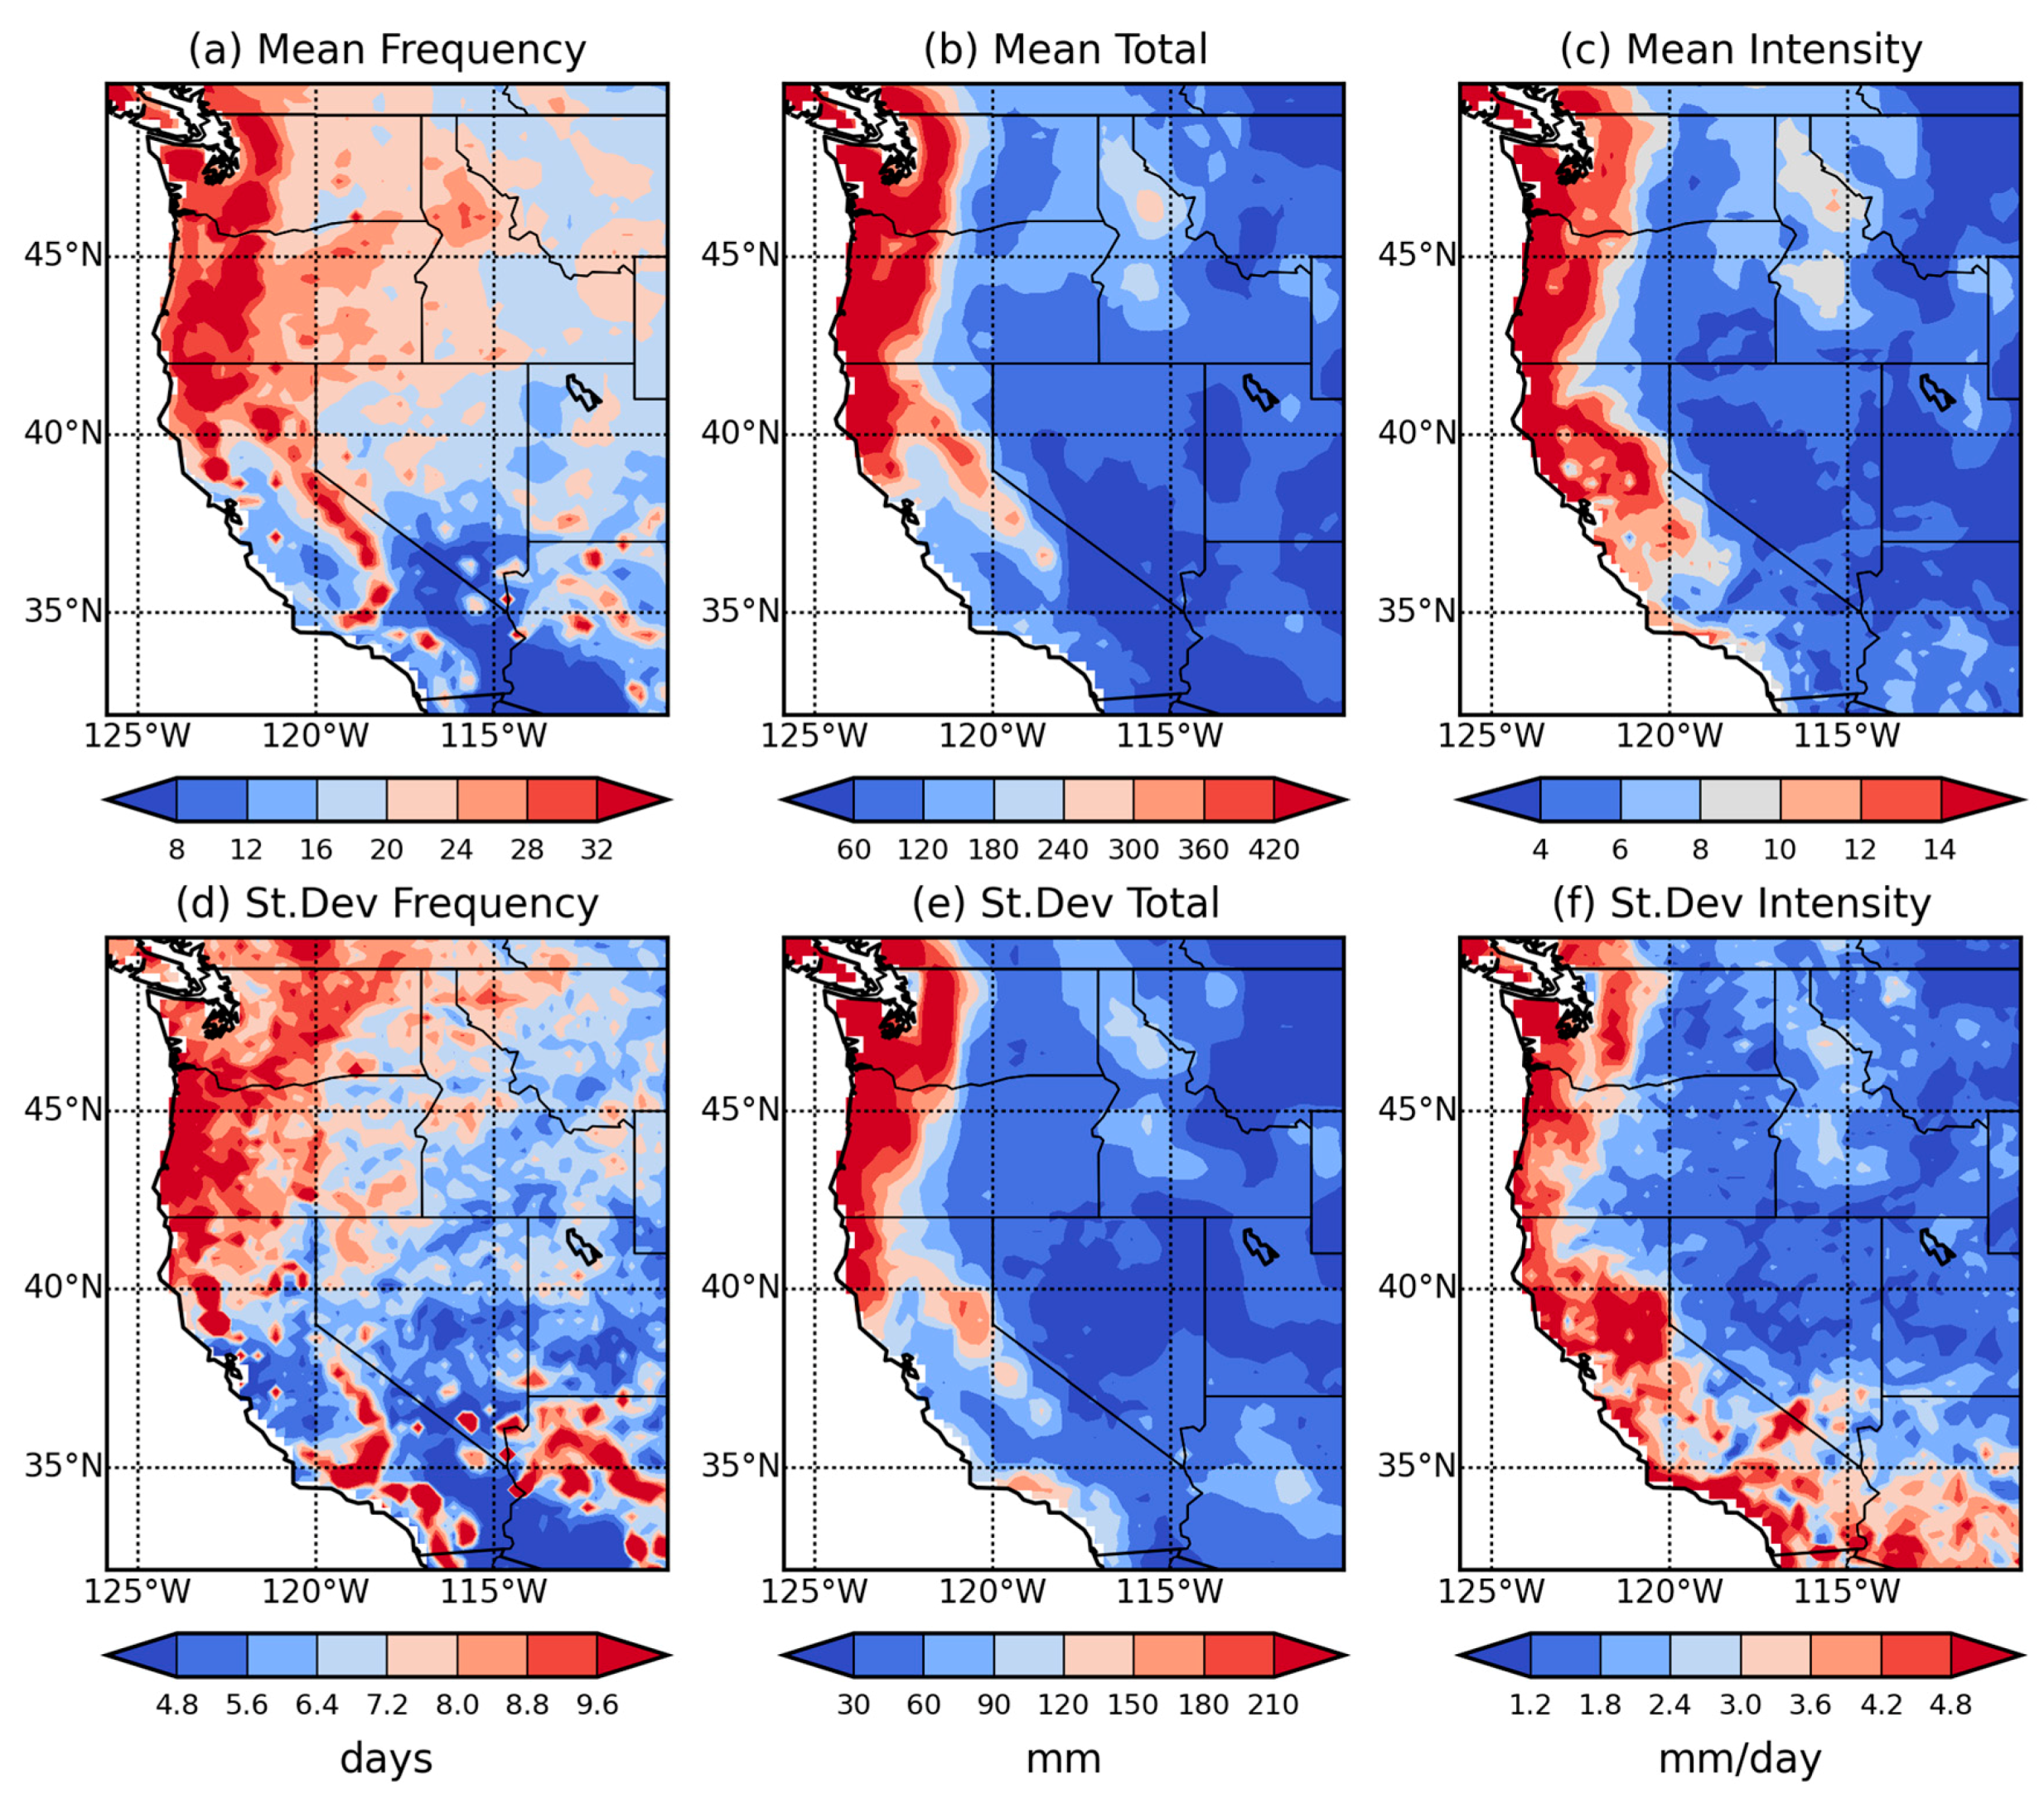
The geographical distribution of the 18-year mean winter precipitation frequency, total, and daily intensity are shown in Figure 3. The higher average frequency found along the coastal region is around 32 days per winter season, with a standard deviation of approximately 10 days (Figure 3a). Areas with the lowest frequency of precipitation occur in the Southwest, with an average frequency of 8 days per winter season with a standard deviation of 4 days.
The largest amount of precipitation occurred over the Pacific Northwest region with a maximum value of about 420 mm (Figure 3b). The mean standard deviation values over the study region is around 60 mm. In general, the coastal regions have the highest daily mean intensity, with average values falling between 4 to 14 mm per day (Figure 3c). The standard deviation for mean daily intensity ranges from 1.2 to 4.8 mm per day.
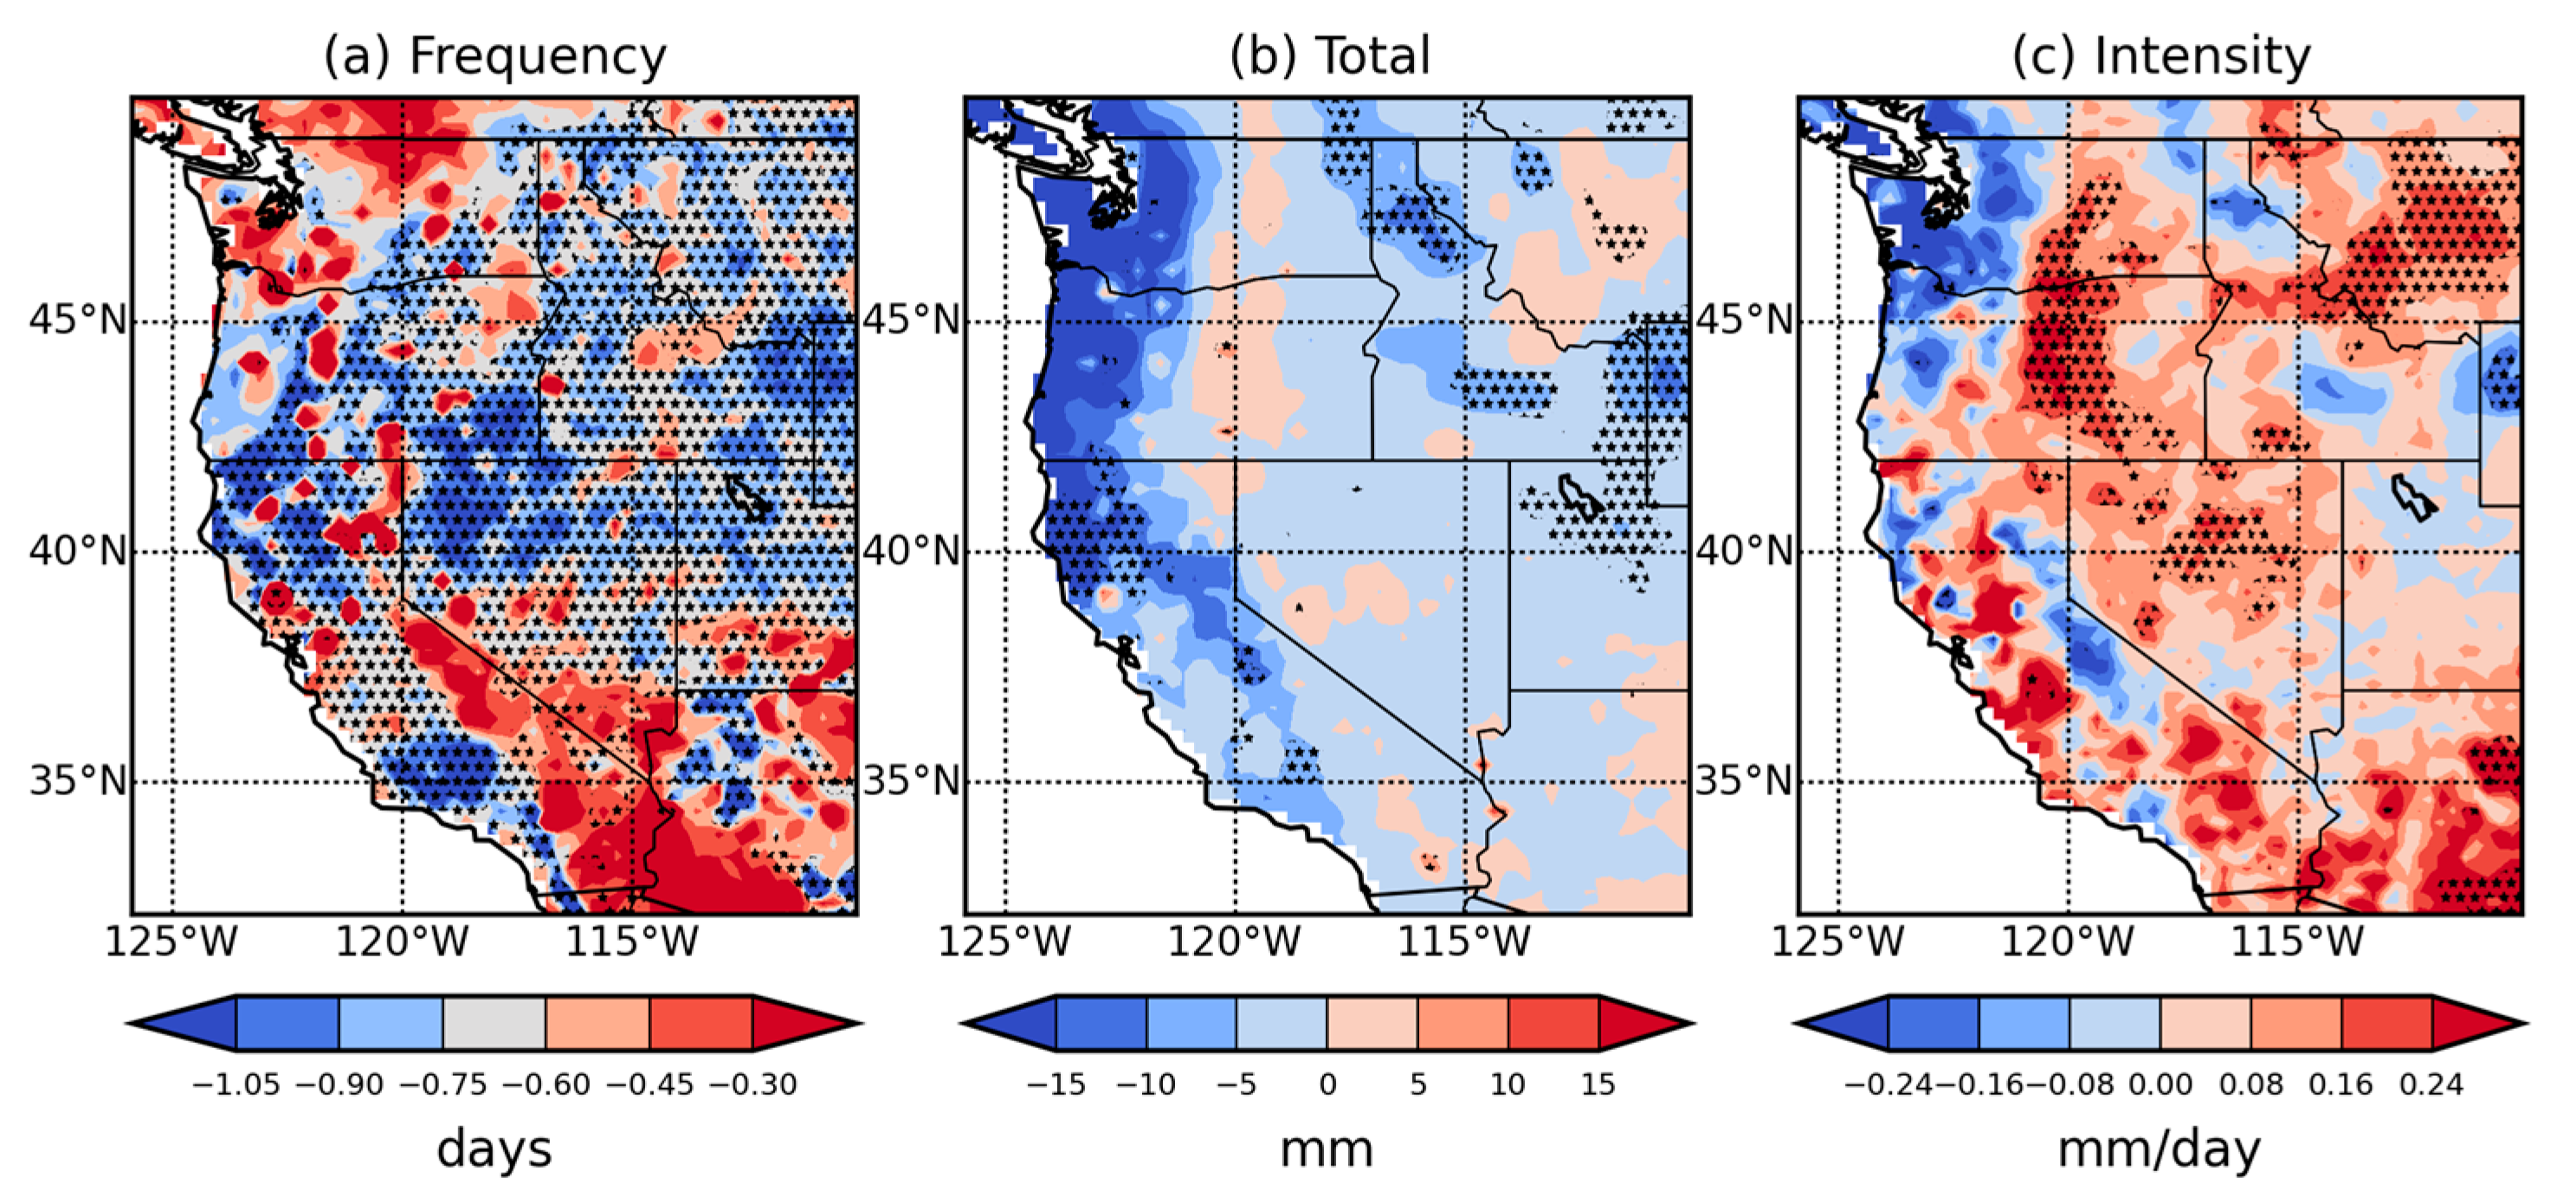
An overall decrease in precipitation frequency can be seen and is statistically significant across much of the study region (Figure 4a). In general, there has been about a half of a day decrease over the western United States. A larger decrease of approximately one day can be seen in the southern California region near Los Angeles (~35°N 119°W) during the study period of 1999–2016.
There is an overall general decrease in seasonal total precipitation over the western United States, with localized significant areas over the coastal northern California (~41°N 124°W), northern Idaho (~47°N 116°W), western edge of Wyoming, and northern Utah (between 40°N and 45°N, and 111°W) during 1999–2016. The values range between about −10 and −15 mm among these localized regions for the study period.
There is a statistically significant increase in precipitation mean daily intensity over the Great Basin Range region in central Washington and Oregon (between 42°N and 47°N and ~120°W), western Montana (between 45°N and 50°N and between 110°W and 115°W), northern Nevada (~40°N 116°W), and central Arizona (~32°N 111°W). The average change in precipitation mean daily intensity is approximately 0.24 mm/day, a relatively large increase for a dry region with about 4-10 mm/day average winter precipitation intensity (see Figure 3c). In general, there is also an increase in mean daily intensity over California, but only a few grid cells are statistically significant in the northeast corner of the state (~41°N 120°W).
3.2. Relationships to Surface Air Temperature and Atmospheric Water Vapor
Figure 5 shows that southern and coastal regions have warmer temperatures and more water vapor as compared to the northern inland regions of the western US, which have cooler temperatures and less water vapor. Coastal regions have a higher temperature with values of 282 to 285 K, as well as a higher water vapor content with values ranging from 8 to 11 mm. Inland, surface temperatures range from 268–276 K and water vapor content ranges from 5 to 8 mm.
The rate of change for surface air temperature and atmospheric water vapor are shown in Figure 6.
In the western United States, there is a general increase in surface temperature, especially over central California where changes range from 0.06 to 0.09 K and are statistically significant. There is an increase in water vapor in the northwest United States around 0.03 mm, while the southwest United States has decreased at about 0.03 mm.
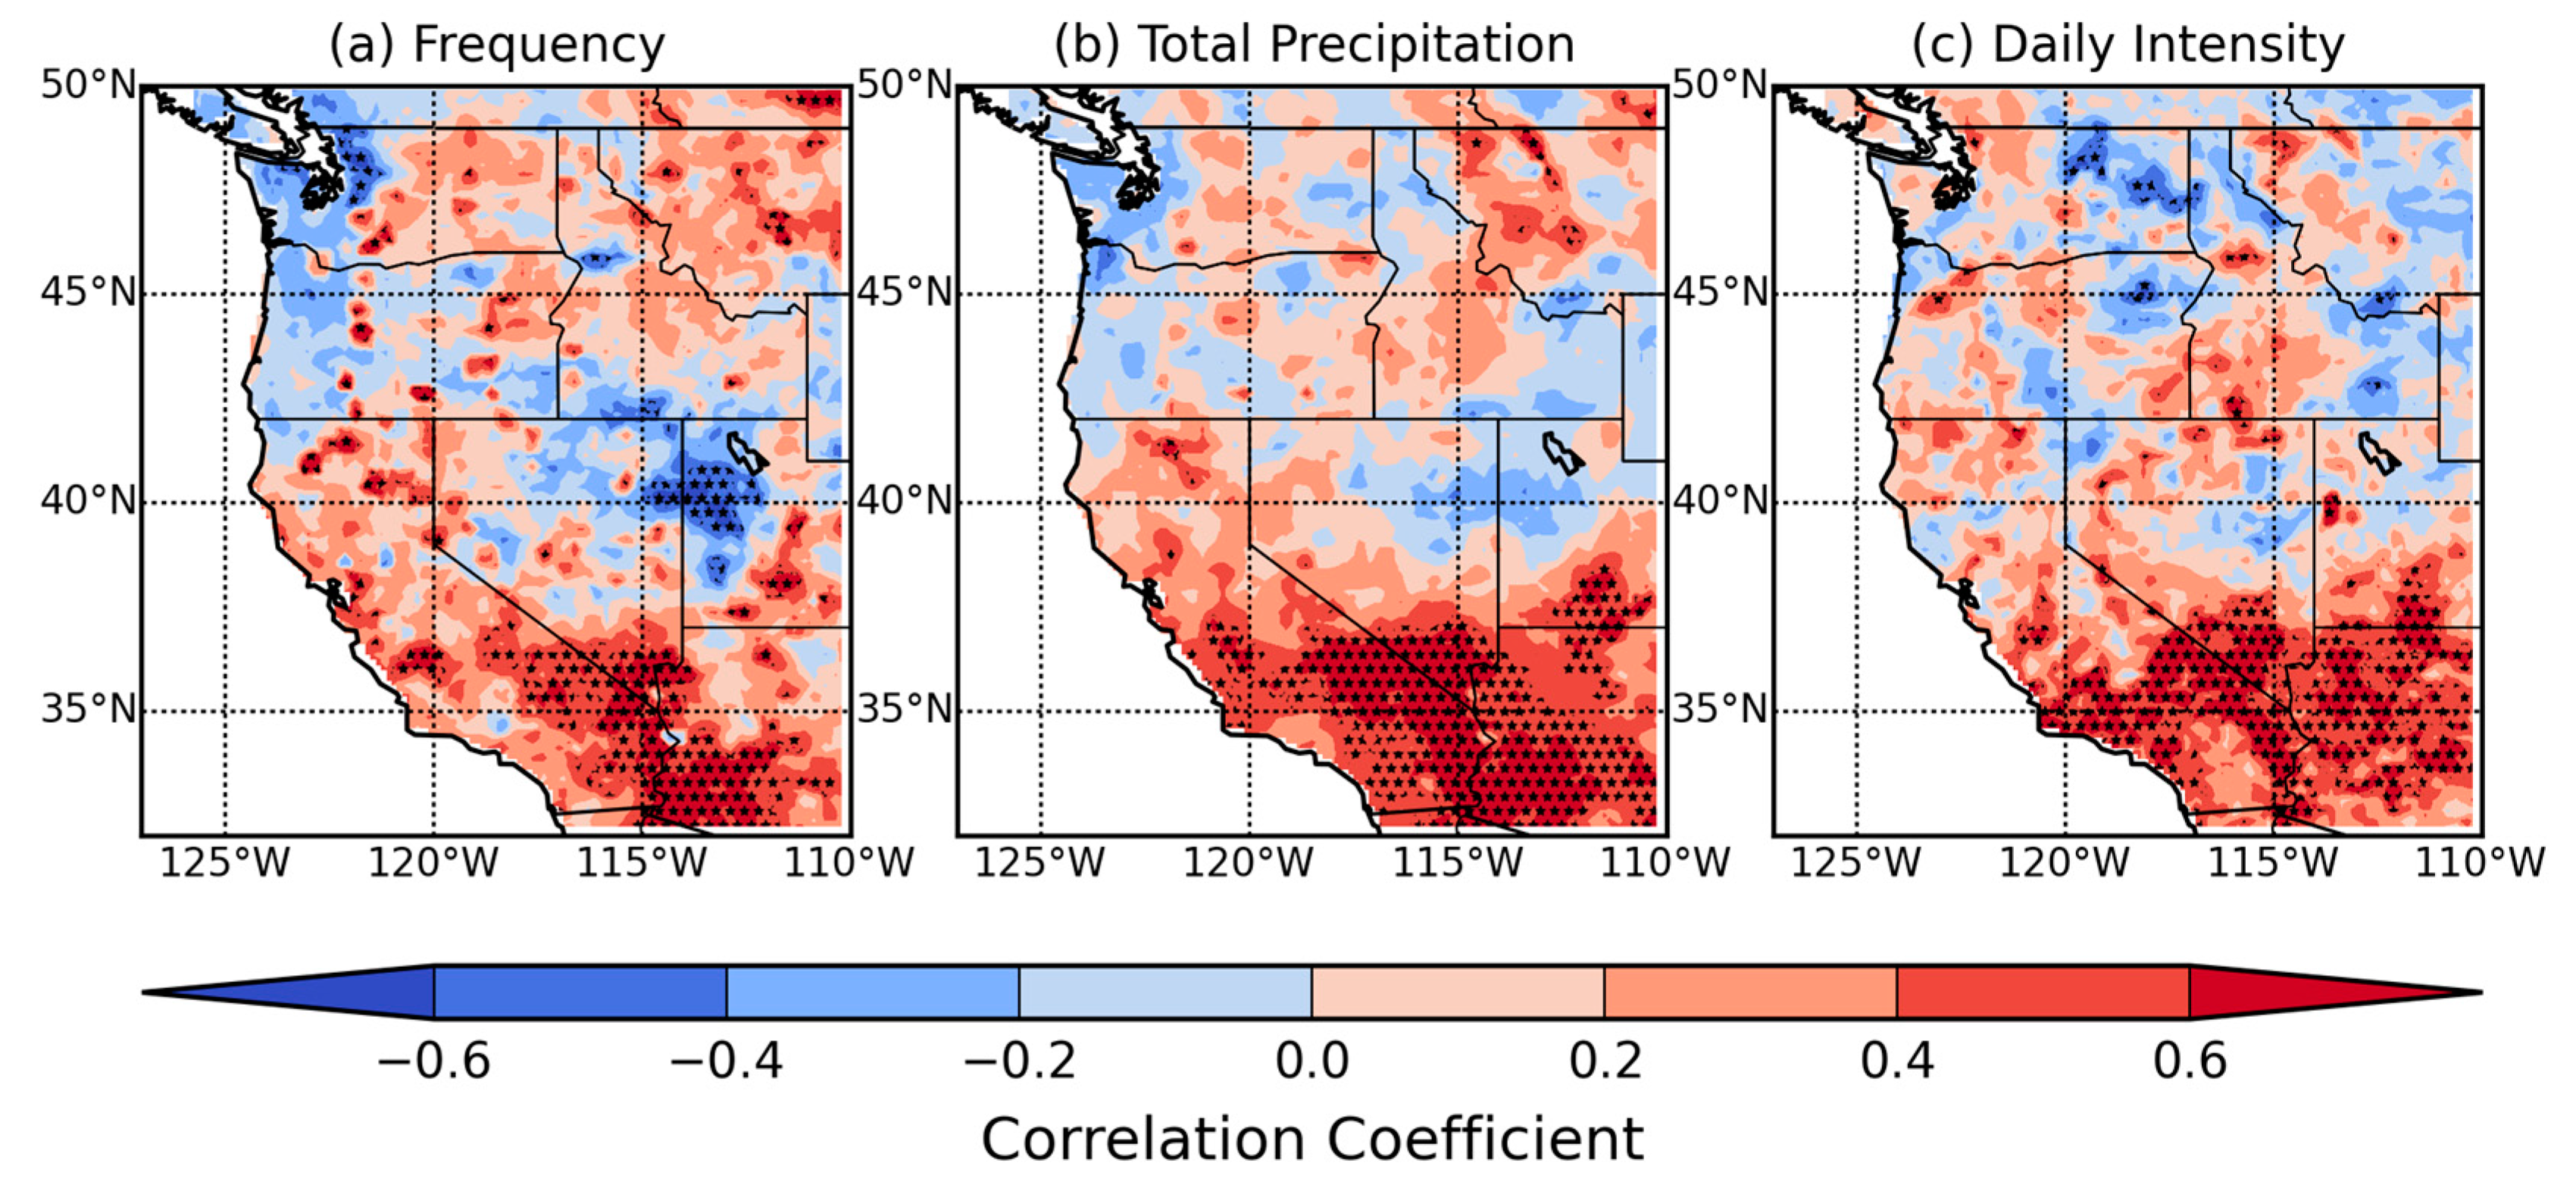
The correlation between total column water vapor and precipitation characteristics is shown in Figure 7. There is a statistically significant positive relationship between total column water vapor and all precipitation characteristics in the southwestern United States. It appears that the higher atmospheric water vapor is directly linked to higher precipitation frequency, total, and intensity over the southwestern United States in winter seasons. There is a small area in Northwest Arizona (Figure 7a) where a statistically significant negative relationship is found between total column water vapor and precipitation frequency. The relationship between the surface air temperature and precipitation frequency is mostly negative over central and southern western United States, with scattered areas of significance (Figure 8a). Over northern Montana, between 45°N and 50°N, and 110°W and 115°W, there are areas of with a significant positive relationship between temperature and precipitation frequency (Figure 8a). There is a small area in northeastern Nevada that has a statistically significant negative relationship between temperature and precipitation total, as well as a small area in Montana that has a statistically significant positive relationship (Figure 8b). Precipitation mean daily intensity and temperature have a statistically significant positive relationship in scattered areas of California (Figure 8c).
In order to visualize these changes on a temporal scale, time series were constructed for different sub-regions with regard to the overall change in winter season precipitation frequency, seasonal total, and mean daily intensity, as well as the changes in total column water vapor. The sub-regions, determined by areas of statistical significance in the regression analysis, are shown in Figure 1.
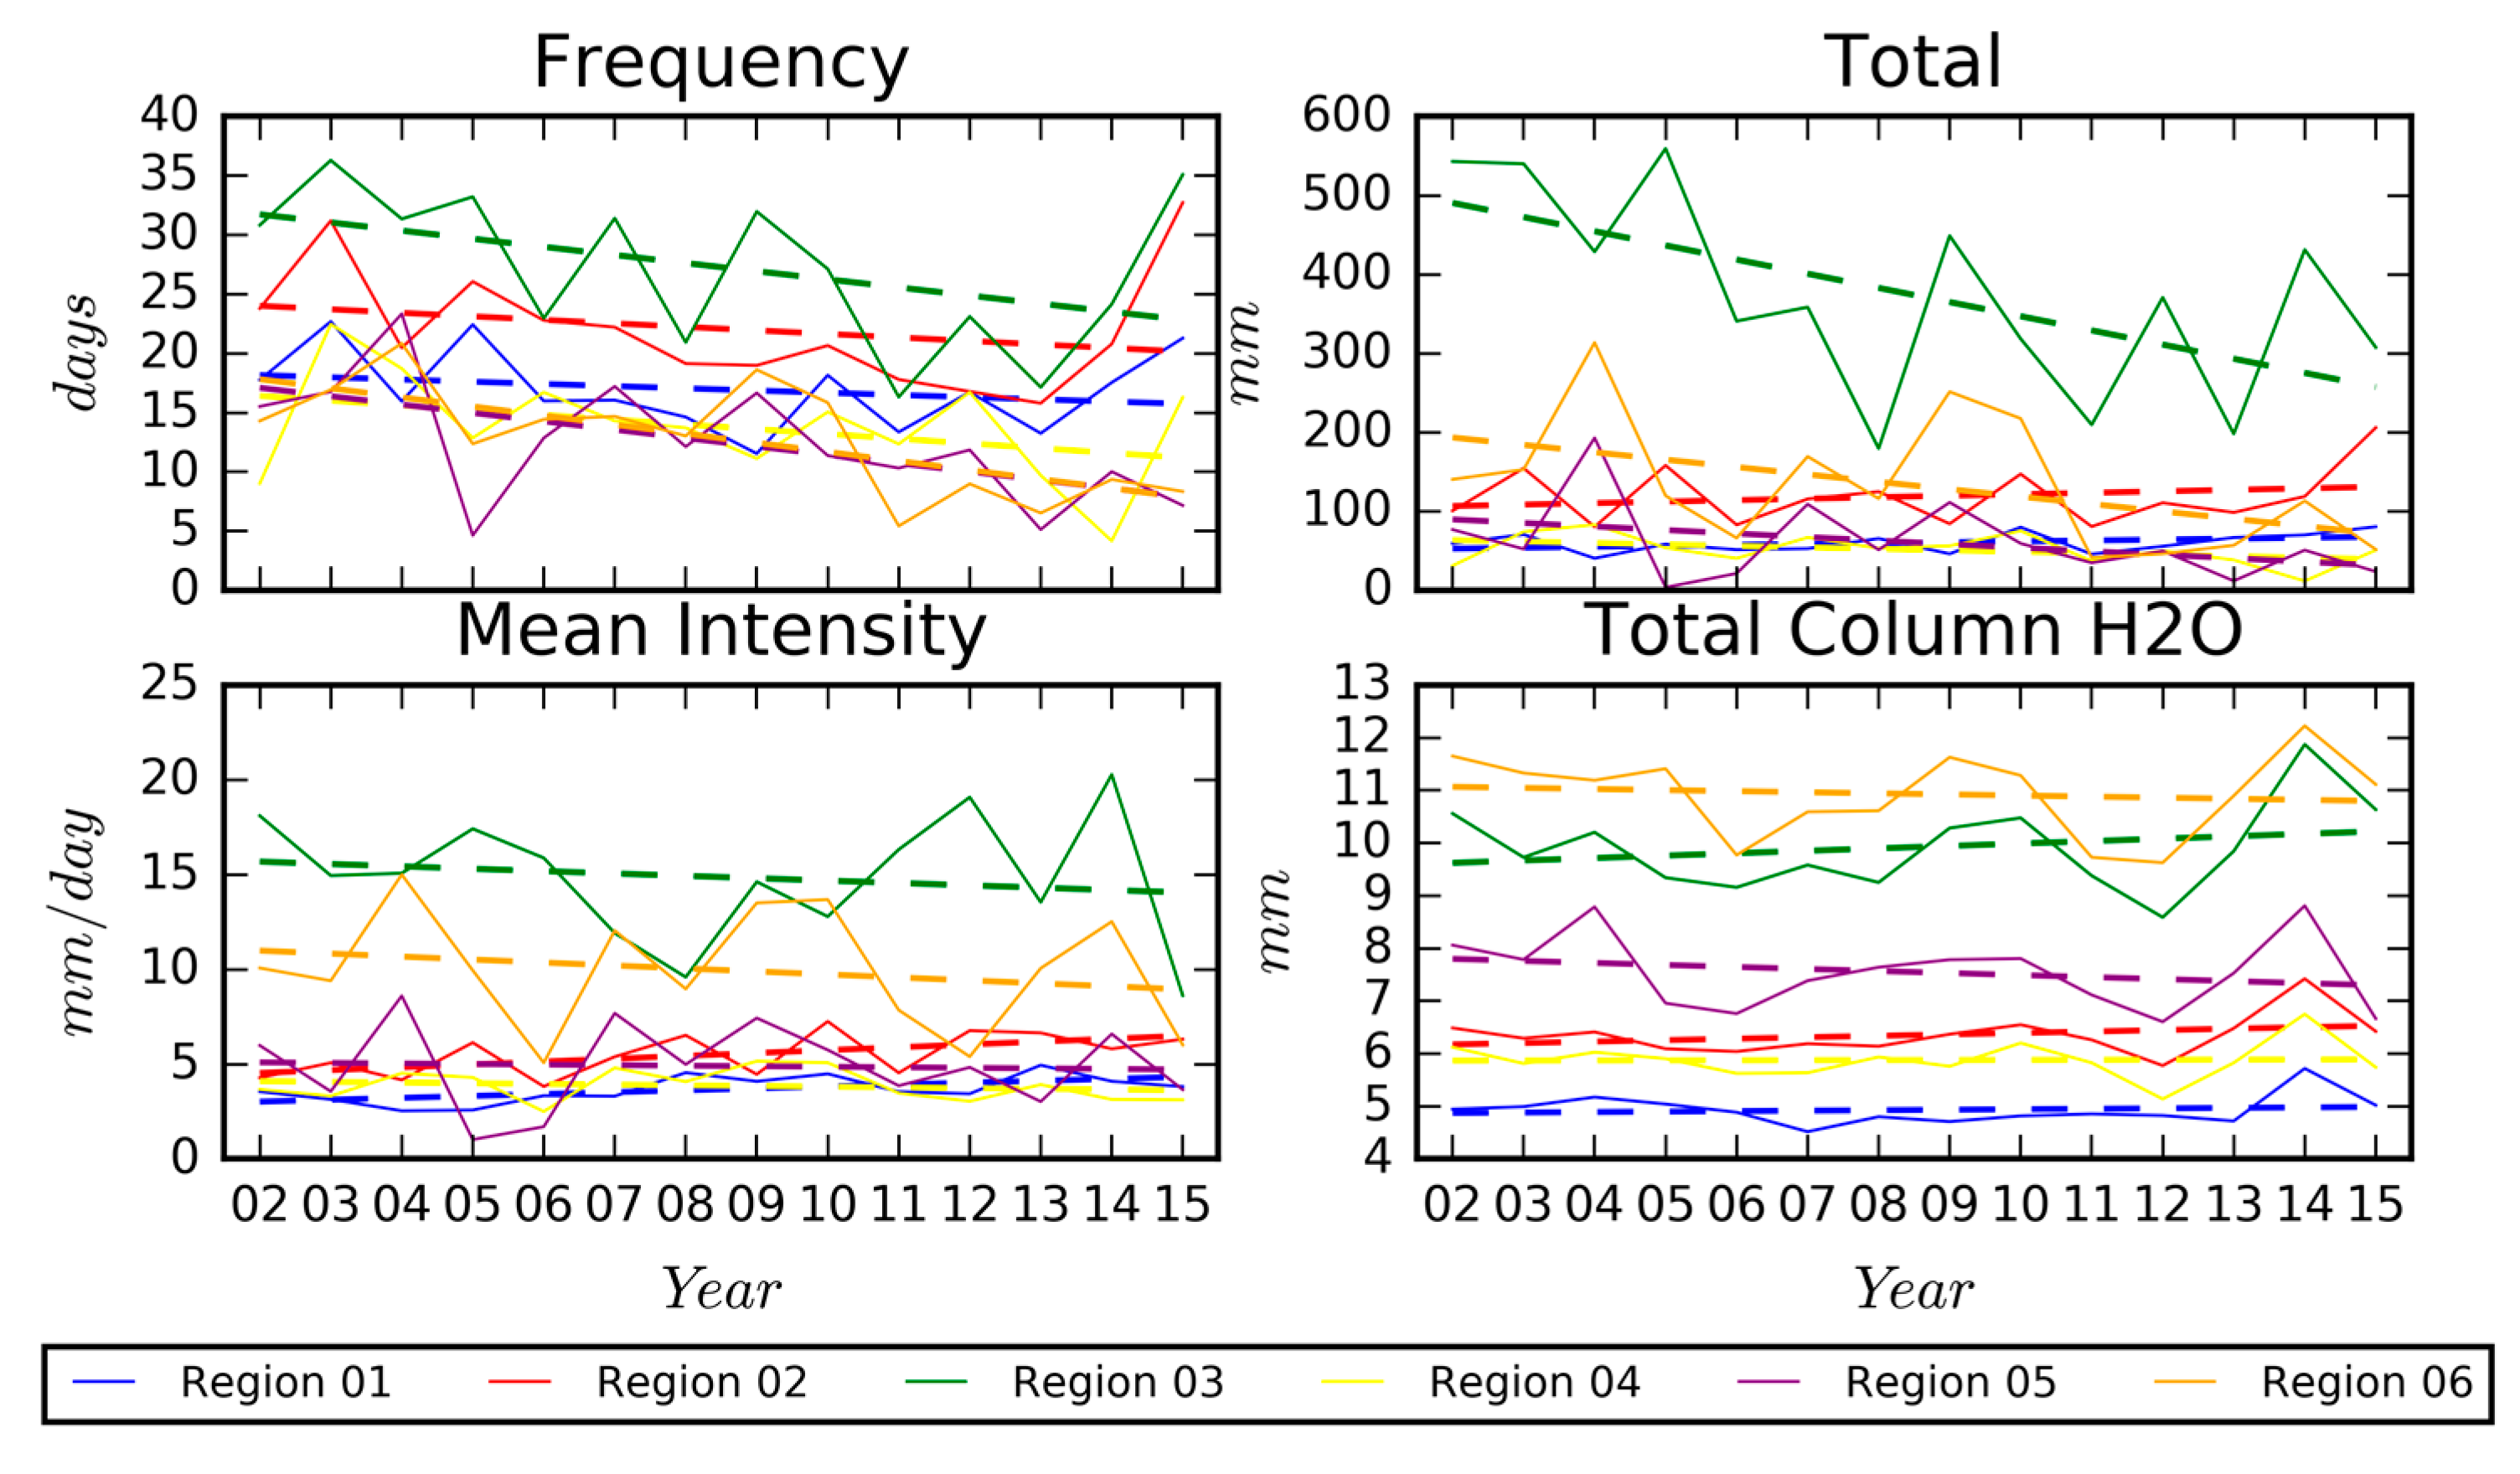
Figure 9 shows the mean time series of the precipitation frequency, total, and intensity, as well as the total column water vapor over each sub-region. The dashed lines show the slope of change based on simple linear regression analysis. For precipitation frequency, there is a decreasing trend in all regions, and are statistically significant in Regions 3–6. Precipitation total is showing a statistically significant decreasing trend in Regions 3–6, and is increasing in Regions 1 and 2. Interestingly, precipitation intensity is increasing in Regions 1 and 2 with statistical significance, despite precipitation frequency and total not having a strong signal in these regions. Frequency is decreasing in Regions 1 and 2 while precipitation totals are increasing. Overall, Figure 9 confirms the results of Figure 4.
For the correlation results between precipitation characteristics and total column water vapor (Figure 10), we see results consistent with those shown in Figure 6. Region 4 is showing a statistically significant negative relationship between frequency and water vapor (Figure 10a). Region 5 is showing a statistically significant positive relationship between all precipitation characteristics and water vapor. Region 6 shows a statistically significant positive relationship between precipitation totals and mean daily intensity and water vapor. Figure 10c shows the close relationship between water vapor and precipitation mean daily intensity at the inter-annual time scale, especially for regions 5 and 6. Water vapor is significantly correlated with the precipitation frequency (r = 0.502), totals (r = 0.615) and intensity (r = 0.670) in Region 5. In Region 6, water vapor is significantly correlated with precipitation totals (r = 0.499), and mean daily intensity (r = 0.663).
3.3. Relationship with ENSO
The composites of monthly anomalies of precipitation characteristics were compiled for the frequency, total, and intensity for months based on the Multivariate ENSO Index that indicated an El Niño month as well as La Niña months. The El Niño winters during the study period were 2003, 2004, 2007, 2010, and 2016. The La Niña winters during the study period were 1999, 2000, 2001, 2008, 2009, 2011, and 2012.
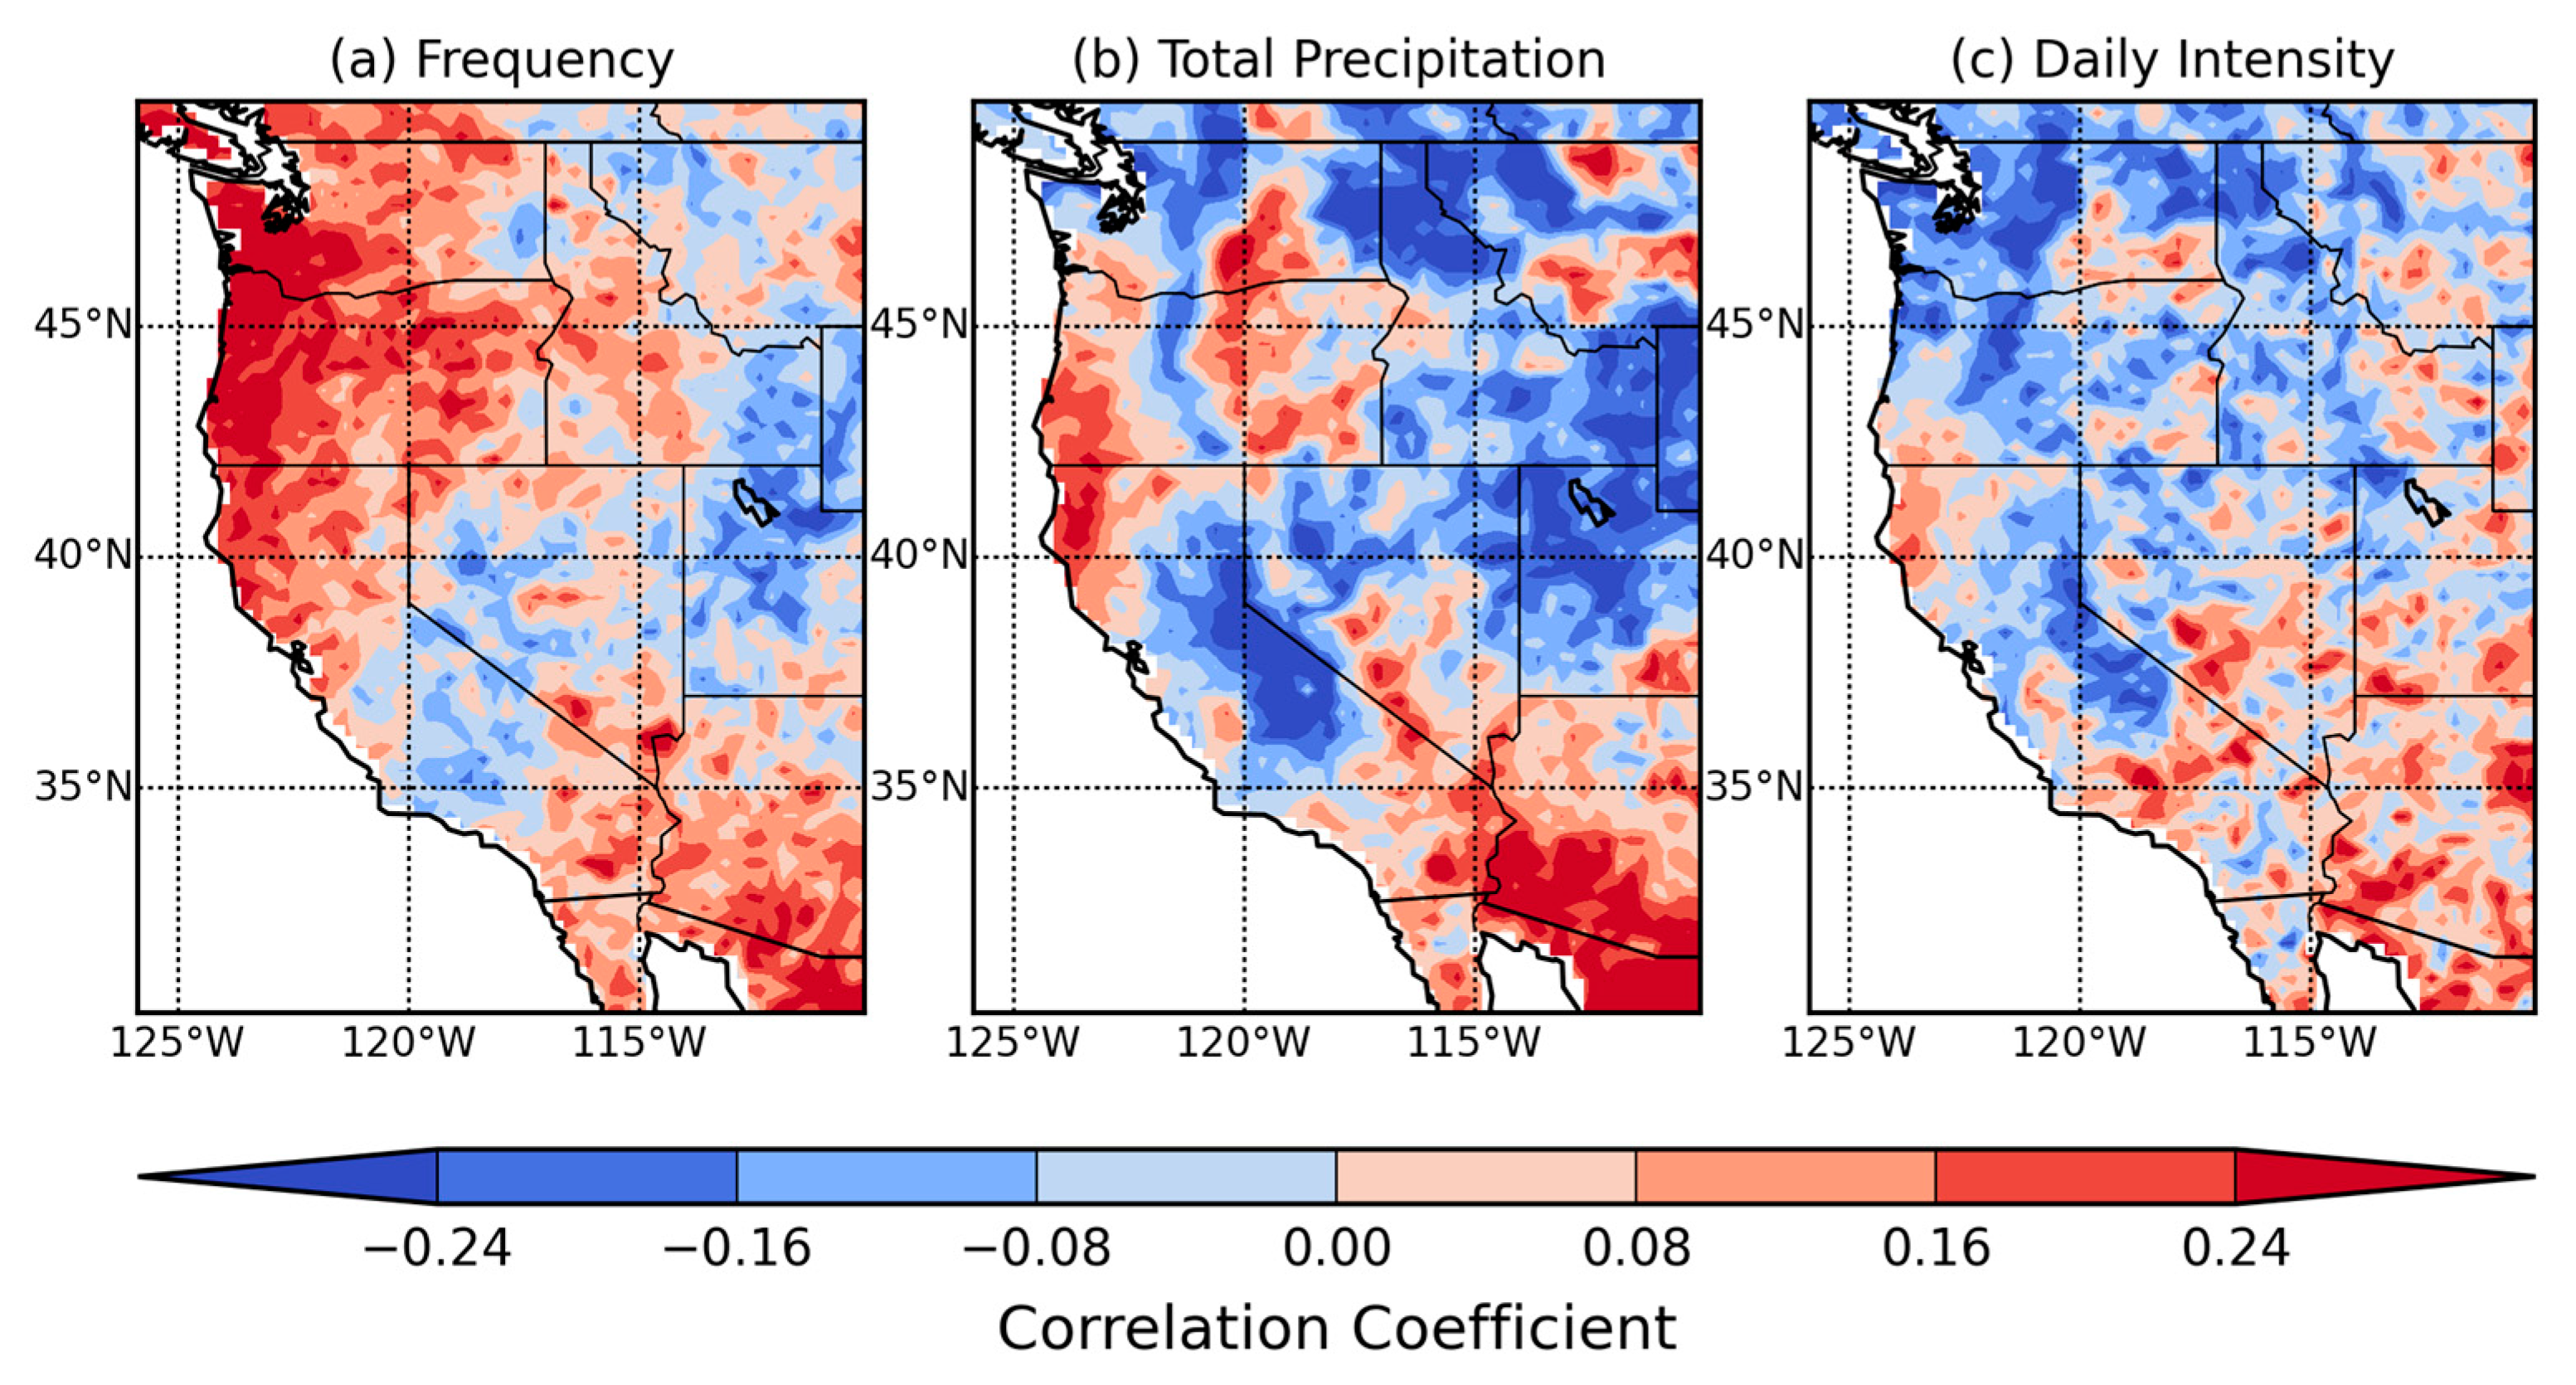
In comparing the El Niño precipitation anomalies to the La Niña anomalies, there appears to be an alternating pattern of positive and negative precipitation anomalies along the west coast (Figure 11). For example, the anomalies during El Niño events show that the frequency of precipitation is higher than average along the northwest coast (approximately +1.5 days between 40°N–50°N and 122°W–125°W), while the frequency is less than average (approximately −1 days) during La Niña events in the same region. In southern California, the precipitation frequency is higher than average (approximately +1 day) for La Niña events, especially in the Los Angeles area (~35°N 120°W). Similar patterns are apparent for total precipitation: the northwest coast sees higher amounts of precipitation during El Niño (~15 mm), and central and southern California see higher amounts of precipitation during La Niña (~9 mm). Interestingly, precipitation intensity is less than average for El Niño events, but higher than average during La Niña events in the Washington coastal areas. Specifically, western Washington experiences less than normal precipitation intensity during El Niño events (−1.8 mm/day) and higher than normal precipitation intensity during La Niña events (+1.2 mm/day). However, further south around southern Oregon and northern California, precipitation intensity is higher than normal during El Niño events (+1.8 mm/day) and lower for La Niña events (−1.2 mm/day). There is also a positive anomaly in precipitation intensity during El Niño events over southern California (+1.8 mm/day) that is typical of this region, with the exception of the 2015–2016 El Niño [34]. These results are consistent with other studies that show that precipitation intensity in the western United States is higher than average during El Niño events [35,36,37]. Despite these broad patterns, on a grid by grid basis, the relationship between ENSO and precipitation characteristics is not significant in any region (see Figure 12). In the Pacific Northwest, there is a positive correlation between the precipitation frequency and ENSO (r = 0.24). It is possible that no significant relationship was found because 18 years of data is not enough to reveal the correlation between ENSO and precipitation characteristics.
4. Discussion
Overall, the results of this research tell us that the precipitation total and frequency have been decreasing in general over the western United States during the past 18 years (Regions 3–6). However, there has been a statistically significant increase in the mean daily intensity, specifically in western Montana (Region 1) and central Oregon and Washington (Region 2). This suggests that precipitation has become less frequent but more intense over Regions 1 and 2 during the study period. These findings are consistent with the general trends revealed in the National Climate Assessment Report 2014 [7]. A strong positive relationship between the total column water vapor and the daily precipitation intensity found over the southwestern United States (Regions 5 and 6) is also supported by the findings in other parts of the world including Europe and northern Eurasia using historical observational records, and at a global scale using reanalysis products [3,4,5,6].
This study has a variety of implications, particularly for Regions 1 and 2 where the mean daily intensity is seen to have been increasing while the number of precipitation days and precipitation totals have been decreasing over the past 18 years. A more in-depth study of this region’s climate and characteristics would be necessary to draw more specific conclusions, however, an increase in the mean daily intensity could increase flood risk and soil erosion, as well as decrease the predictability of water resources. An overall decrease in precipitation frequency and totals could cause a decline in water availability in the western United States where water is already scarce. These consequences should be examined more in depth to determine the breadth of impact on this particular region.
Another interesting result is the strong correlation between the atmospheric water vapor and the precipitation intensity in the southwestern United States (Regions 5 and 6). Since most of this region is considered a desert, increased precipitation intensity and decreased frequency have quite a few implications regarding floods, soil erosion, drought, and water resource management.
Another area of research related to precipitation intensity and the western United States is Atmospheric Rivers (ARs). ARs are long, narrow, water vapor rich regions of the atmosphere that transport water vapor from the tropics to the mid to high latitudes [38,39]. Much of AR research focuses on precipitation patterns across the coastal western United States [40]. Some studies show that the intensity of ARs are increasing with a warming climate—potentially increasing the intensity of precipitation overall in the western United States, more specifically in California, Oregon, and Washington [41,42,43].
5. Conclusions
This study examined the possible changes in three major precipitation characteristics of total, frequency, and daily intensity over the western United States during the winter season by using TRMM 3B42 version 7 gridded daily precipitation records during 1999–2016. In addition, their possible connections to atmospheric water vapor, surface air temperature, and El Nino/Southern Oscillation were explored.
Precipitation frequency, total, and mean daily intensity are decreasing in Regions 3–6. In Regions 1 and 2, precipitation frequency is decreasing, while precipitation totals are increasing, causing a significant increase in the mean daily precipitation intensity during the study period. Atmospheric water vapor is strongly positively correlated with the mean daily precipitation intensity in the southwestern United States (Regions 5 and 6). In addition, there is a positive correlation between atmospheric water vapor and precipitation frequency and total over the southwestern United States (Regions 5 and 6) for the winter seasons during the study period. There is a dramatic, alternating pattern of precipitation characteristics in response to El Nino/La Nino conditions, but they are not statistically significant during the study period. Considering the short time period of the availability of TRMM and AIRS data, some of these changes may be connected to various large-scale decadal variability. In future research, a longer dataset will be more appropriate to explore these connections.
Acknowledgments
This research was funded by the NASA MIRO grant #NNX15AQ06A at California State University Los Angeles and the first author is also partially supported by the Earth Sciences Division at the Jet Propulsion Laboratory in Pasadena, CA. Part of the work described in this paper was carried out at the Jet Propulsion Laboratory, California Institute of Technology, under a contract with the National Aeronautics and Space Administration.
Author Contributions
Deanna Nash and Hengchun Ye conceived and designed the experiments; Deanna Nash performed the experiments; Deanna Nash and Hengchun Ye analyzed the data; Deanna Nash wrote the paper; Hengchun Ye and Eric Fetzer assisted in the preparation of the manuscript.
Conflicts of Interest
The authors declare no conflicts of interest. The founding sponsors had no role in the design of the study; in the collection, analyses, or interpretation of data; in the writing of the manuscript, and in the decision to publish the results.
References
- Wallace, J.M.; Hobbs, P.V. Atmospheric Science: An Introductory Survey; Academic Press: Burlington, MA, USA, 2006. [Google Scholar]
- Allan, R.P.; Soden, B.J. Atmospheric warming and the amplification of precipitation extremes. Science 2008, 321, 1481–1484. [Google Scholar] [CrossRef] [PubMed]
- Berg, P.; Haerter, J.O.; Thejll, P.; Piani, C.; Hagemann, S.; Christensen, J.H. Seasonal characteristics of the relationship between daily precipitation intensity and surface temperature. J. Geophys. Res. 2009, 114, D18102. [Google Scholar] [CrossRef]
- Shui, C.; Liu, S.; Fu, C.; Dai, A.; Sun, Y. How much do precipitation extremes change in a warming climate? Geophys. Res. Lett. 2012, 39, L17707. [Google Scholar] [CrossRef]
- Ye, H.; Fetzer, E.J.; Wong, S.; Behrangi, A.; Yang, D.; Lambrigtson, B.H. Increasing atmospheric water vapor and higher daily precipitation intensity over Northern Eurasia. Geophys. Res. Lett. 2015, 42, 9404–9410. [Google Scholar] [CrossRef]
- Ye, H.; Fetzer, E.J.; Behrangi, A.; Wong, S.; Lambrigtsen, B.H.; Wang, C.Y.; Gamelin, B.L. Increasing daily precipitation intensity associated with warmer air temperatures over northern Eurasia. J. Clim. 2016, 29, 623–636. [Google Scholar] [CrossRef]
- U.S. Global Change Research Program. Climate Change Impacts in the United States: The Third National Climate Assessment. 2014. Available online: http://nca2014.globalchange.gov/report (accessed on 8 April 2016).
- Peterson, T.C.; Heim, R.R.; Hirsch, R.; Kaiser, D.P.; Brooks, H.; Diffenbaugh, N.S.; Dole, R.M.; Giovannettone, J.P.; Guirguis, K.; Wuebbles, D.; et al. Monitoring and understanding changes in heat waves, cold waves, floods, and droughts in the United States. BAMS 2013, 94, 821–834. [Google Scholar] [CrossRef]
- Kunkel, K.E.; Karl, T.R.; Brooks, H.; Kossin, J.; Lawrimore, J.H.; Arndt, D.; Bosart, L.; Changnon, D.; Cutter, L.S.; Wuebbles, D.; et al. Monitoring and understanding trends in extreme storms. BAMS 2013, 94, 499–514. [Google Scholar] [CrossRef]
- Global Climate Change Impacts in the United States; Karl, T.R.; Melillo, J.T.; Peterson, T.C. (Eds.) Cambridge University Press: New York, NY, USA, 2009. [Google Scholar]
- Lau, W.K.M.; Wu, H.T.; Kim, K.M. A canonical response of precipitation characteristics to global warming from CMIP5 models. Geophys. Res. Lett. 2013, 40, 3163–3169. [Google Scholar] [CrossRef]
- Meehl, G.A.; Arblaster, J.M.; Tebaldi, C. Understanding future patterns of increased precipitation intensity in climate model simulations. Geophys. Res. Lett. 2005, 32, L18719. [Google Scholar] [CrossRef]
- Tebaldi, C.; Hayhoe, K.; Arblaster, J.M.; Meehl, G.A. Going to the extremes. Clim. Chang. 2006, 79, 185–211. [Google Scholar] [CrossRef]
- Alder, R.F.; Huffman, G.J.; Chang, A.; Ferraro, R.; Xie, P.; Janowiak, J.; Rudolf, B.; Schneider, U.; Curtis, S.; Nelkin, E.; et al. The version-2 global precipitation climatology project (GPCP) monthly precipitation analysis (1979-present). J. Hydrometeorol. 2003, 4, 1147–1167. [Google Scholar] [CrossRef]
- Prat, O.P.; Nelson, B.R. Evaluation of precipitation estimates over CONUS derived from satellite, radar, and rain gauge data sets at daily to annual scales (2002–2012). Hydrol. Earth Syst. Sci. 2015, 19, 2037–2056. [Google Scholar] [CrossRef]
- Menne, M.J.; Durre, I.; Vose, R.S.; Gleason, B.E.; Houston, T.G. An overview of the global historical climatology network-daily database. J. Atmos. Ocean. Technol. 2012, 29, 897–910. [Google Scholar] [CrossRef]
- Rienecker, M.M.; Suarez, M.J.; Gelaro, R.; Todling, R.; Bacmeister, J.; Liu, E.; Bosilovich, M.G.; Schubert, S.D.; Takacs, L.; Woollen, J.; et al. MERRA: NASA’s modern-era retrospective analysis for research and applications. J. Clim. 2011, 24, 3624–3648. [Google Scholar] [CrossRef]
- Cayan, D.R.; Dettinger, M.D.; Diaz, H.F.; Graham, N.E. Decadal variability of precipitation over western North America. J. Clim. 1998, 11, 3148–3166. [Google Scholar] [CrossRef]
- Chen, S.; Hong, Y.; Gourley, J.J.; Huffman, G.J.; Tian, Y.; Cao, Q.; Yong, B.; Li, Z.; Hardy, J.; Xue, X.; et al. Evaluation of the successive V6 and V7 TRMM multisatellite precipitation analysis over the continental United States. Water Resour. Res. 2013, 49, 8174–8186. [Google Scholar] [CrossRef]
- Dettinger, M.D.; Ralph, F.M.; Das, T.; Neiman, P.J.; Cayan, D.R. Atmospheric Rivers, Floods, and the Water Resources of California. Water 2011, 3, 445–478. [Google Scholar] [CrossRef]
- Dettinger, M.D.; Cayan, D.R. Drought and the California delta—A matter of extremes. San Franc. Est. Watershed Sci. 2014, 12, 2–6. [Google Scholar] [CrossRef]
- Huffman, G.J.; Adler, R.F.; Bolvin, D.T.; Gu, G.; Nelkin, E.J.; Bowman, K.P.; Wolff, D.B.; Hong, Y.; Stocker, E.F. The TRMM multi-satellite precipitation analysis (TMPA): Quasi-global, multiyear, combined-sensor precipitation estimates at fine scales. J. Hydrometeorol. 2007, 8, 38–55. [Google Scholar] [CrossRef]
- Behrangi, A.; Guan, B.; Neiman, P.J.; Schreier, M.; Lambrigtsen, B. On the quantification of atmospheric rivers precipitation from space: Composite assessments and case studies over the eastern North Pacific Ocean and western United States. J. Hydrometeorol. 2016, 17, 369–382. [Google Scholar] [CrossRef]
- Tropical Rainfall Measurement Mission Project (TRMM). TRMM/TMPA 3B42RT Daily TRMM and Others Daily Rainfall Estimate V7, Version 7; Goddard Space Flight Center Distributed Active Archive Center (GSFC DAAC): Greenbelt, MD, USA, 2011. Available online: http://disc.sci.gsfc.nasa.gov/datacollection/TRMM_3B42RT_daily_V7.html (accessed on 2 March 2016).
- Olsen, E.T. AIRS/AMSU/HSB Version 6 Data Release User Guide; Jet Propulsion Laboratory, California Institute of Technology: Pasadena, CA, USA, 2013; pp. 1–67.
- AIRS Science Team; Texeira, J. AIRS/Aqua L3 Monthly Standard Physical Retrieval (AIRS-Only) 1 degree × 1 degree V006, Version 006; Goddard Earth Sciences Data and Information Services Center (GES DISC): Greenbelt, MD, USA, 2013.
- Wolter, K.; Timlin, M.S. Monitoring ENSO in COADS with a seasonally adjusted principal component index. In Proceedings of the 17th Climate Diagnostics Workshop, Norman, OK, USA, 18–23 October 1993. [Google Scholar]
- Maggioni, V.; Meyers, P.C.; Robinson, M.D. A review of merged high-resolution satellite precipitation product accuracy during the tropical rainfall measuring mission (TRMM) era. In Proceedings of the 7th International Precipitation Working Group (IPWG) Workshop, Tsukuba, Japan, 17–21 November 2014; pp. 1101–1116. [Google Scholar] [CrossRef]
- Sapiano, M.R.P.; Arkin, P.A. An intercomparison and validation of high-resolution satellite precipitation estimates with 3-hourly gauge data. J. Hydrometeorol. 2009, 10, 149–166. [Google Scholar] [CrossRef]
- Tian, Y.; Peters-Lidard, C.D.; Choudhury, B.J.; Garcia, M. Multitemporal analysis of TRMM-based satellite precipitation products for land data assimilation applications. J. Hydrometeorol. 2007, 8, 1165–1183. [Google Scholar] [CrossRef]
- Huffman, G.J.; Bolvin, D.T. TRMM and Other Data Precipitation Data Set Documentation; NASA GSFC: Greenbelt, MD, USA, 2014; pp. 1–42.
- Chou, C.; Chen, C.; Tan, P.; Chen, K.T. Mechanisms for global warming impacts on precipitation frequency and intensity. J. Clim. 2012, 25, 3291–3306. [Google Scholar] [CrossRef]
- Sun, Y.; Solomon, S.; Dai, A.; Portmann, R.W. How often will it rain? J. Clim. 2007, 20, 4801–4818. [Google Scholar] [CrossRef]
- Jacox, M.G.; Hazen, E.L.; Zaba, K.D.; Rudnick, D.L.; Edwards, C.A.; Moore, A.M.; Bograd, S.J. Impacts of the 2015-2016 El Niño on the California current system: Early assessment and comparison to past events. Geophys. Res. Lett. 2016, 43, 7072–7080. [Google Scholar] [CrossRef]
- Hoell, A.; Hoerling, M.; Eischeid, J.; Wolter, K.; Dole, R.; Perlwitz, J.; Xu, T.; Linyin, C. Does El Niño intensity matter for California precipitation? Geophys. Res. Lett. 2016, 43, 819–825. [Google Scholar] [CrossRef]
- Kumar, A.; Hoerling, M.P. Interpretaiton and implications of the observed inter-El Niño variability. J. Clim. 1997, 10, 83–91. [Google Scholar] [CrossRef]
- Zhang, T.; Perlwitz, J.; Hoerling, M.P. What is responsible for the strong observed asymmetry in teleconnections between El Niño and La Niña? Geophys. Res. Lett. 2014, 41, 1019–1025. [Google Scholar] [CrossRef]
- Zhu, Y.; Newell, R.E. Atmospheric Rivers and bombs. Geophys. Res. Lett. 1994, 21, 1999–2002. [Google Scholar] [CrossRef]
- Zhu, Y.; Newell, R.E. A proposed algorithm for moisture fluxes from atmospheric rivers. Mon. Weather Rev. 1998, 126, 725–735. [Google Scholar] [CrossRef]
- Gimeno, L.; Nieto, R.; Vásquez, M.; Lavers, D.A. Atmospheric rivers: A mini-review. Front. Earth Sci. 2014, 2, 1–6. [Google Scholar] [CrossRef]
- Dettinger, M.D. Climate change, atmospheric rivers, and floods in California: A multi-model analysis of storm frequency and magnitude changes. J. Am. Water Res. Assoc. 2011, 47, 514–523. [Google Scholar] [CrossRef]
- Lavers, D.A.; Allan, R.P.; Villarini, G.; Llyod-Hughes, B.; Brayshaw, D.J.; Wade, A.J. Future changes in atmospheric rivers and their implications for winter flooding in Britain. Environ. Res. Lett. 2013, 8, 1–8. [Google Scholar] [CrossRef]
- Kim, H.M.; Zhou, Y.; Alexander, M.A. Changes in atmospheric rivers and moisture transport over the Northeast Pacific and western North America in response to ENSO diversity. Clim. Dyn. 2017, 1–14. [Google Scholar] [CrossRef]
Figure 1.
The study area and the terrain represented at a 0.44° resolution where the numbered boxes with white boundaries indicate the sub-regions in which the area-mean time series are evaluated. Region 1 (R1) is western Montana, (R2) is central Oregon, (R3) is a portion of northern California, (R4) is a northern Utah/Nevada, (R5) is a small area near Los Angeles, and (R6) is Arizona, and a portion of southern California and Nevada.
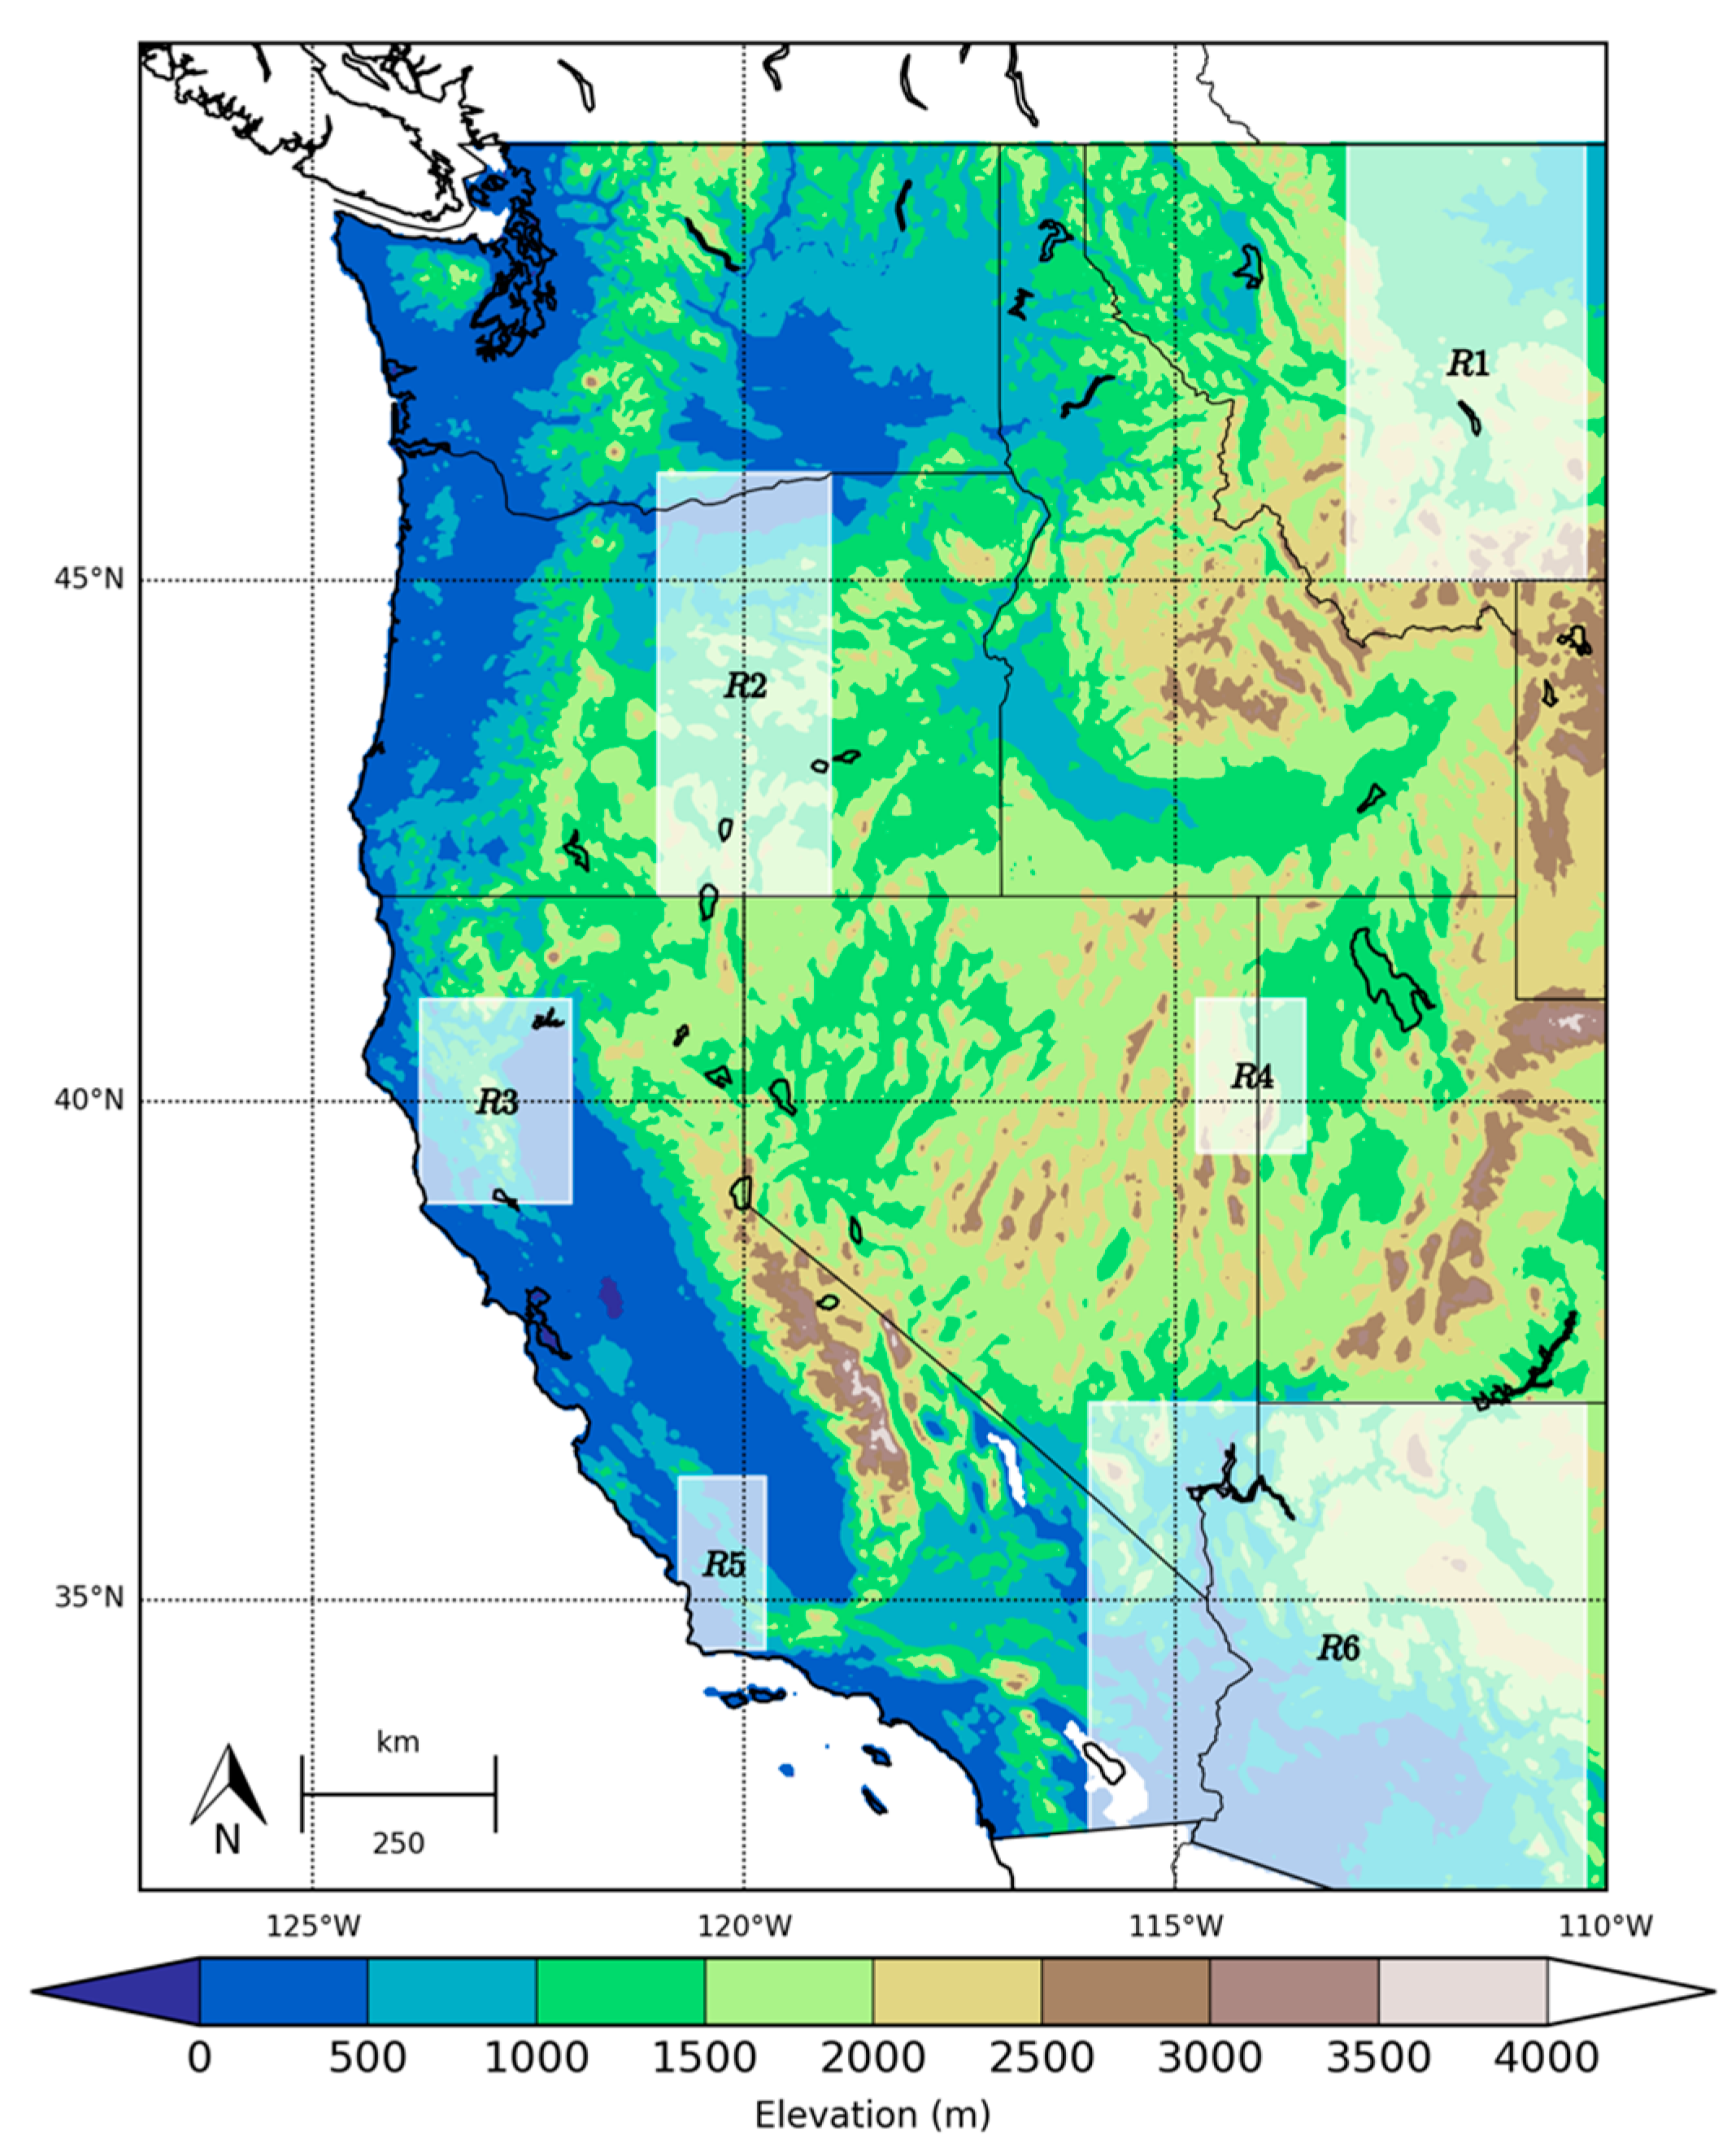
Figure 2.
The standardized departure of the Multivariate El Niño Southern Oscillation (ENSO) Index values between 1999 and 2016 [26]. The red values indicate months with El Niño conditions, and the blue values indicate months with La Niña conditions.
Figure 2.
The standardized departure of the Multivariate El Niño Southern Oscillation (ENSO) Index values between 1999 and 2016 [26]. The red values indicate months with El Niño conditions, and the blue values indicate months with La Niña conditions.
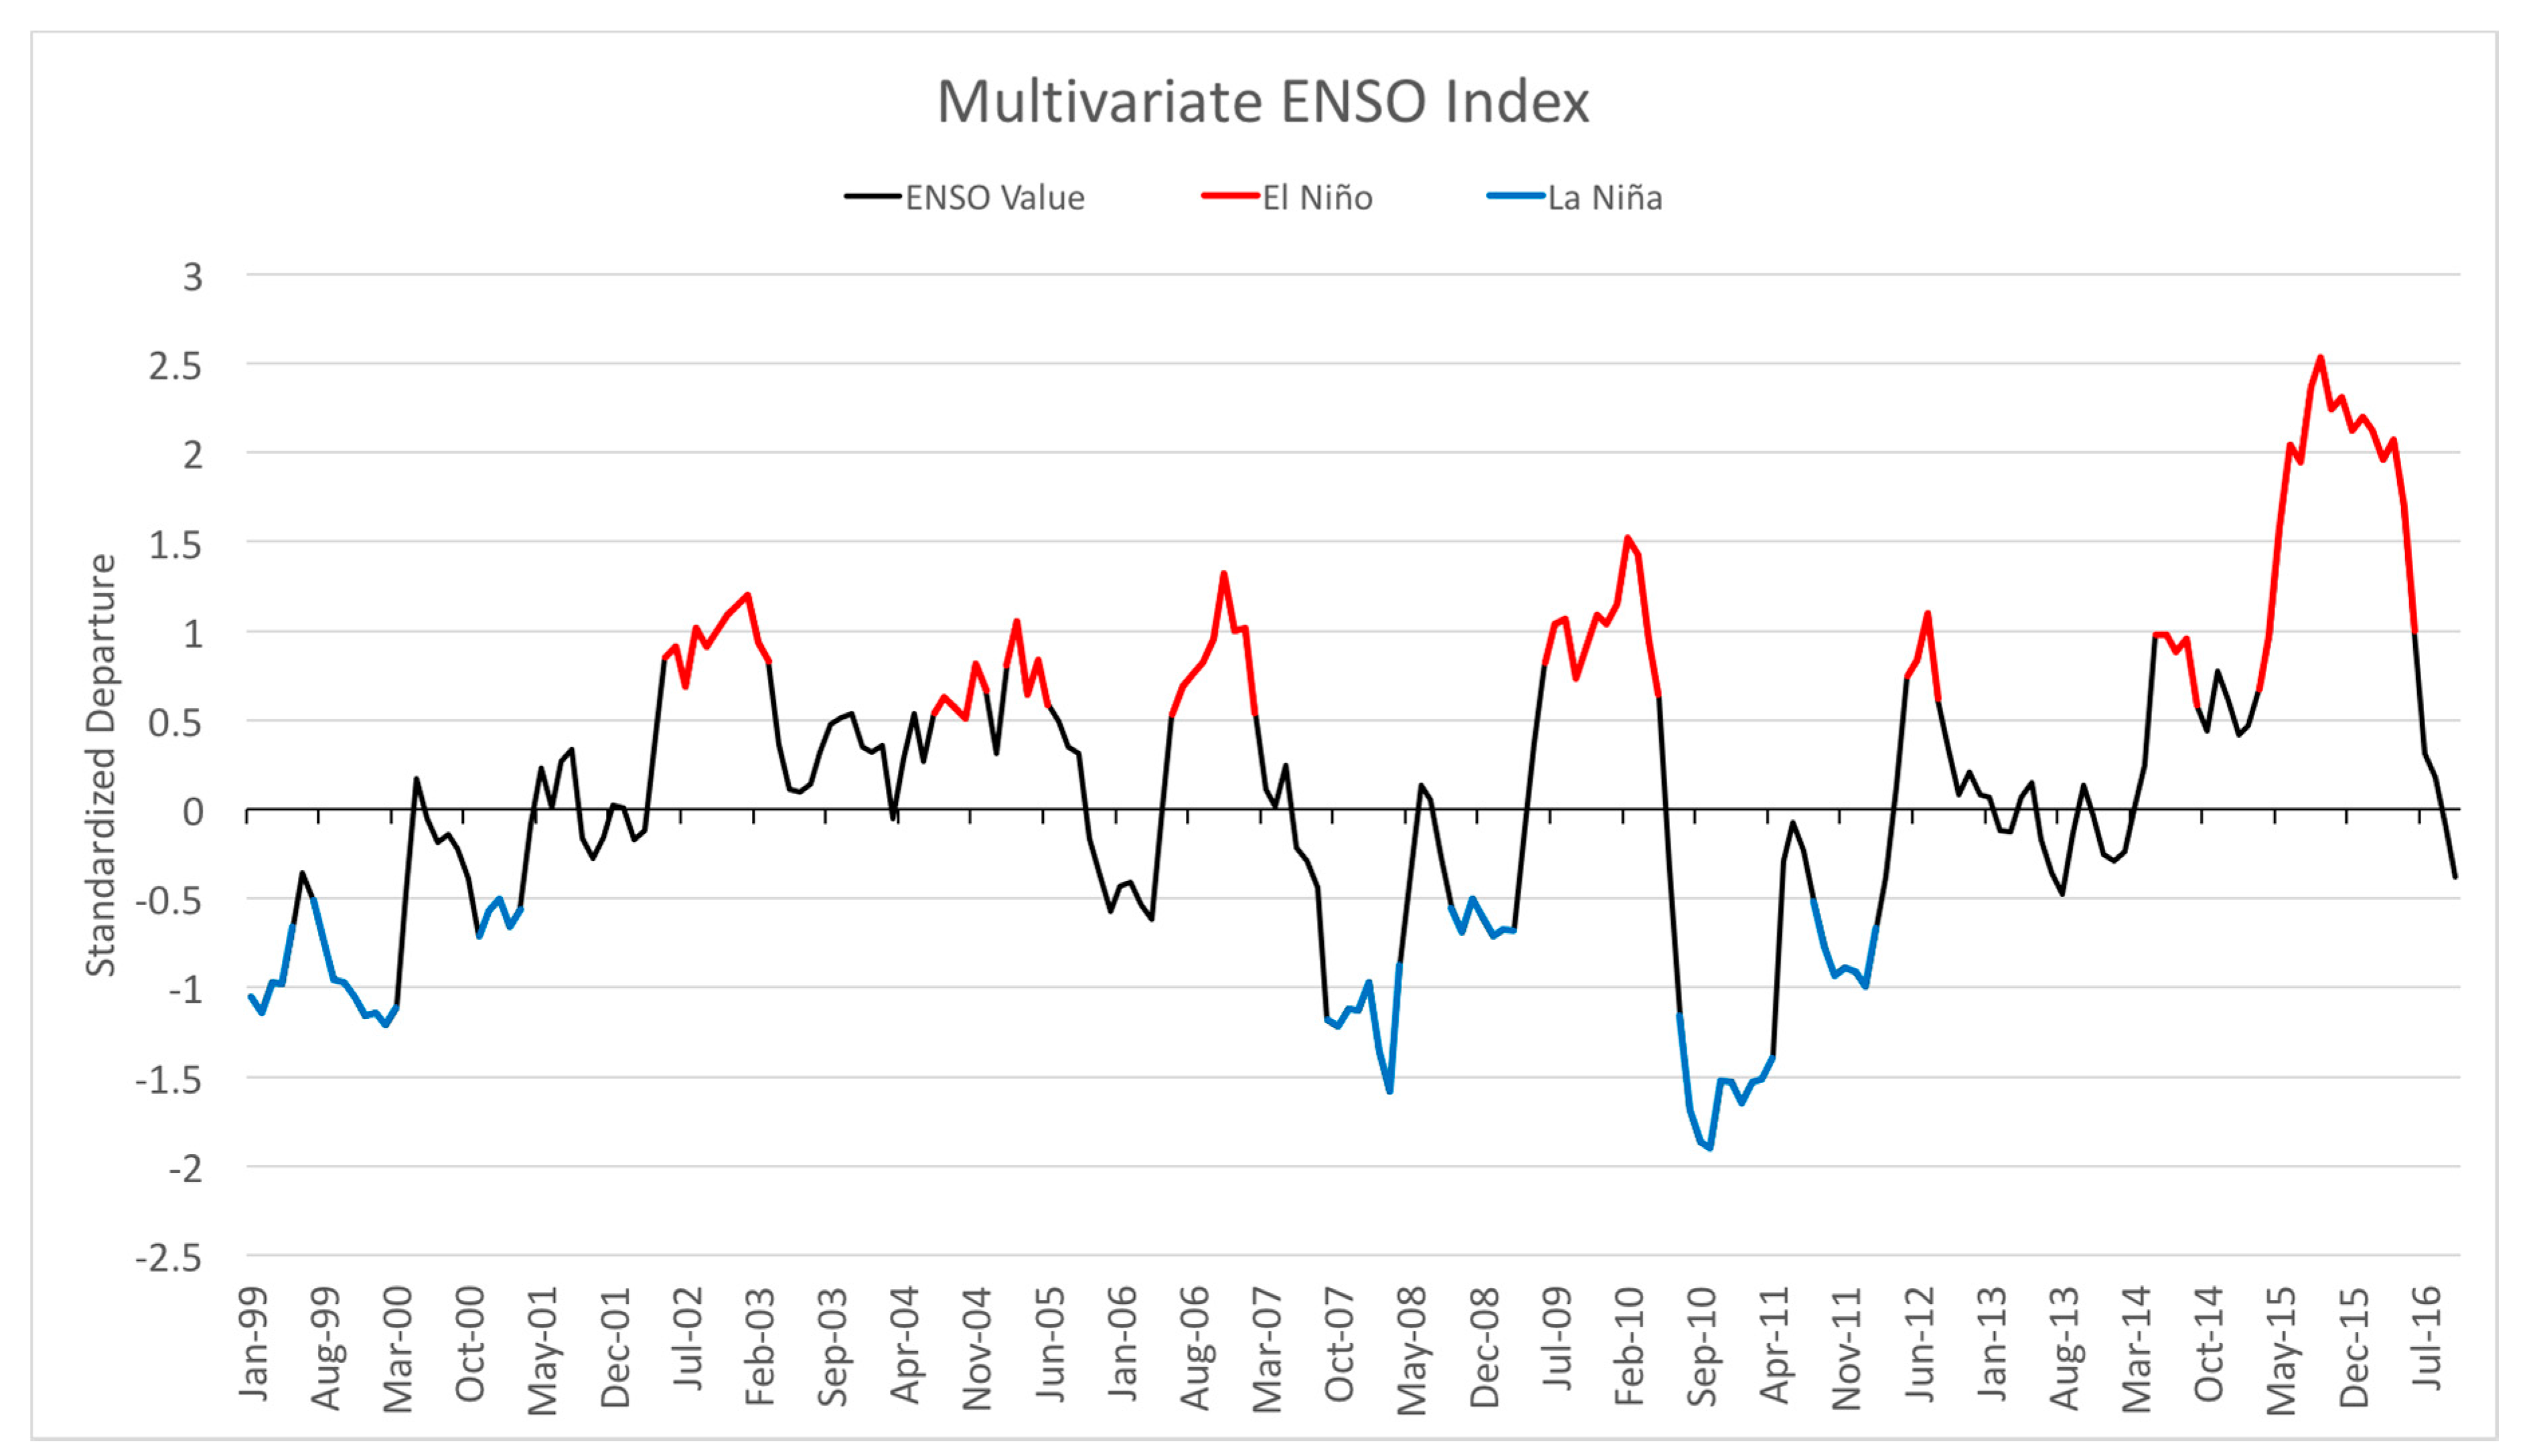
Figure 3.
The winter season precipitation (a) frequency, (b) seasonal total, and (c) mean daily intensity values with the corresponding standard deviation for the winter season precipitation (d) frequency, (e) seasonal total, and (f) mean daily intensity between 1999 and 2016.
Figure 3.
The winter season precipitation (a) frequency, (b) seasonal total, and (c) mean daily intensity values with the corresponding standard deviation for the winter season precipitation (d) frequency, (e) seasonal total, and (f) mean daily intensity between 1999 and 2016.

Figure 4.
The total change in the winter season precipitation (a) frequency, (b) seasonal total, and (c) mean daily intensity over the western United States between 1999 and 2016. The hatches indicate where the changes are statistically significant.
Figure 4.
The total change in the winter season precipitation (a) frequency, (b) seasonal total, and (c) mean daily intensity over the western United States between 1999 and 2016. The hatches indicate where the changes are statistically significant.

Figure 5.
The mean (a) surface temperature and (b) integrated water for the winter season between 2003 and 2016. The standard deviation from the mean for the (c) surface temperature and (d) integrated water vapor.
Figure 5.
The mean (a) surface temperature and (b) integrated water for the winter season between 2003 and 2016. The standard deviation from the mean for the (c) surface temperature and (d) integrated water vapor.
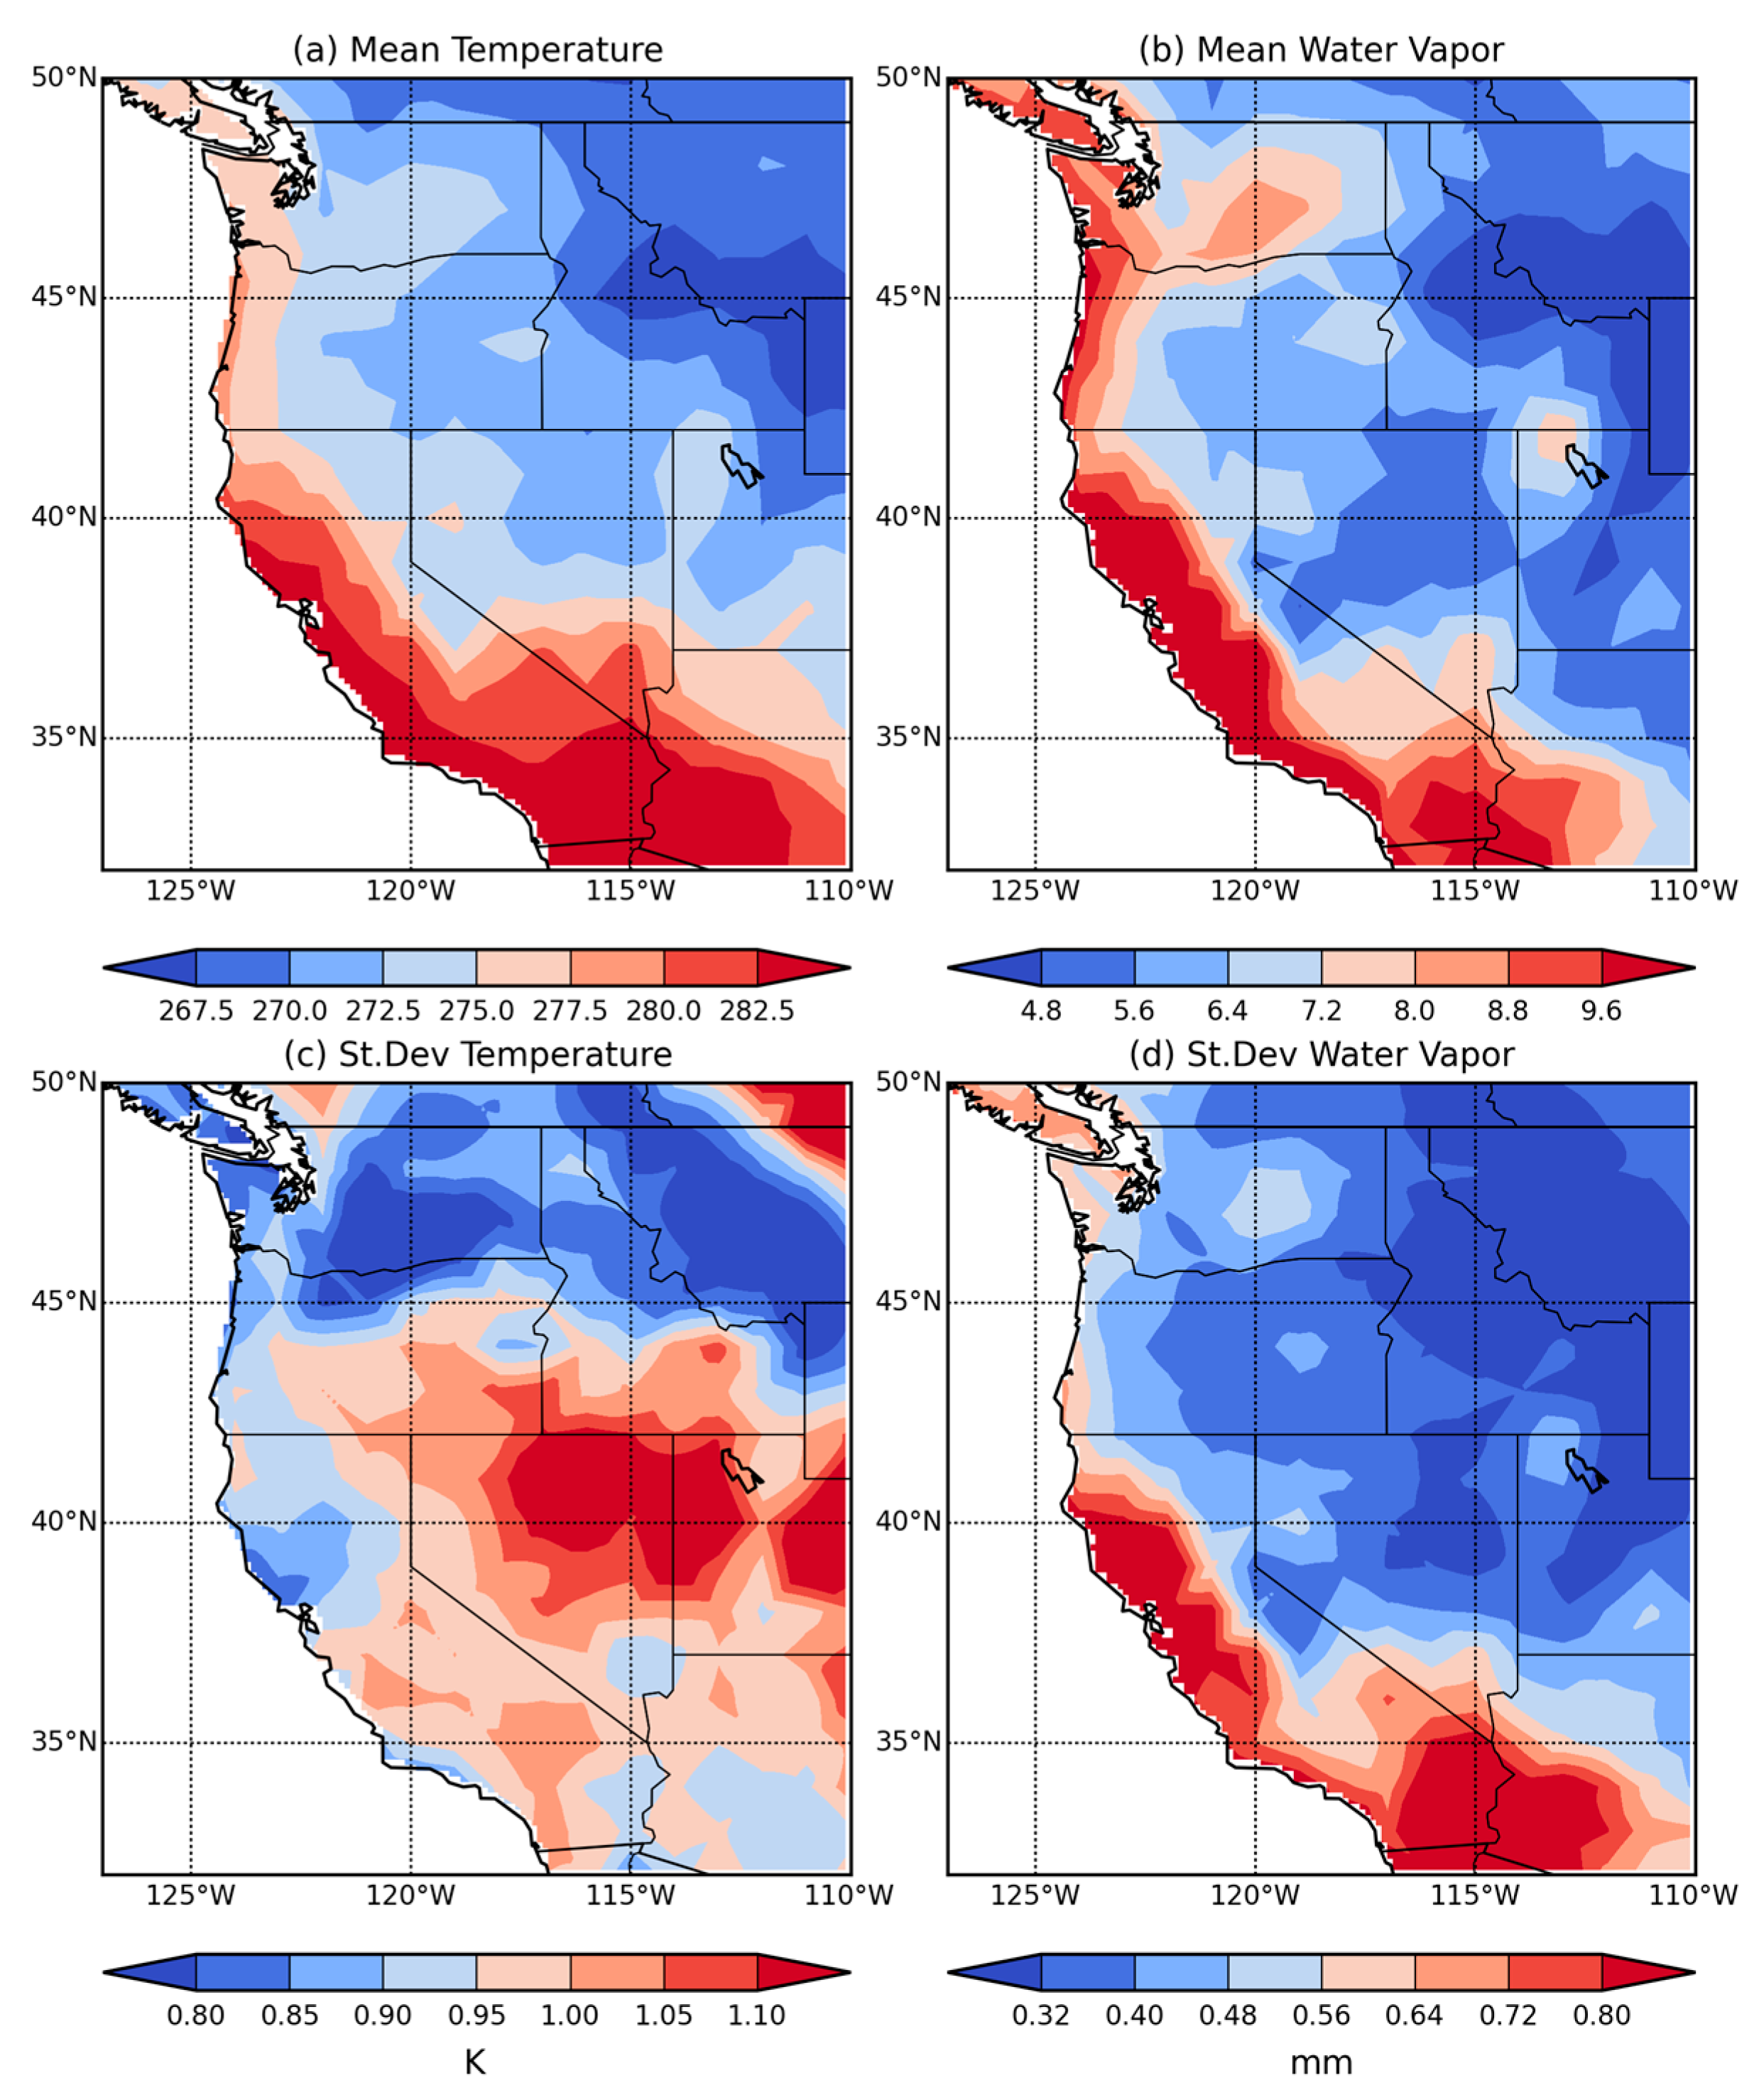
Figure 6.
The total change in winter (a) surface air temperature and (b) atmospheric water vapor over the western United States between 2003 and 2016. Hatching indicates where the changes are statistically significant.
Figure 6.
The total change in winter (a) surface air temperature and (b) atmospheric water vapor over the western United States between 2003 and 2016. Hatching indicates where the changes are statistically significant.
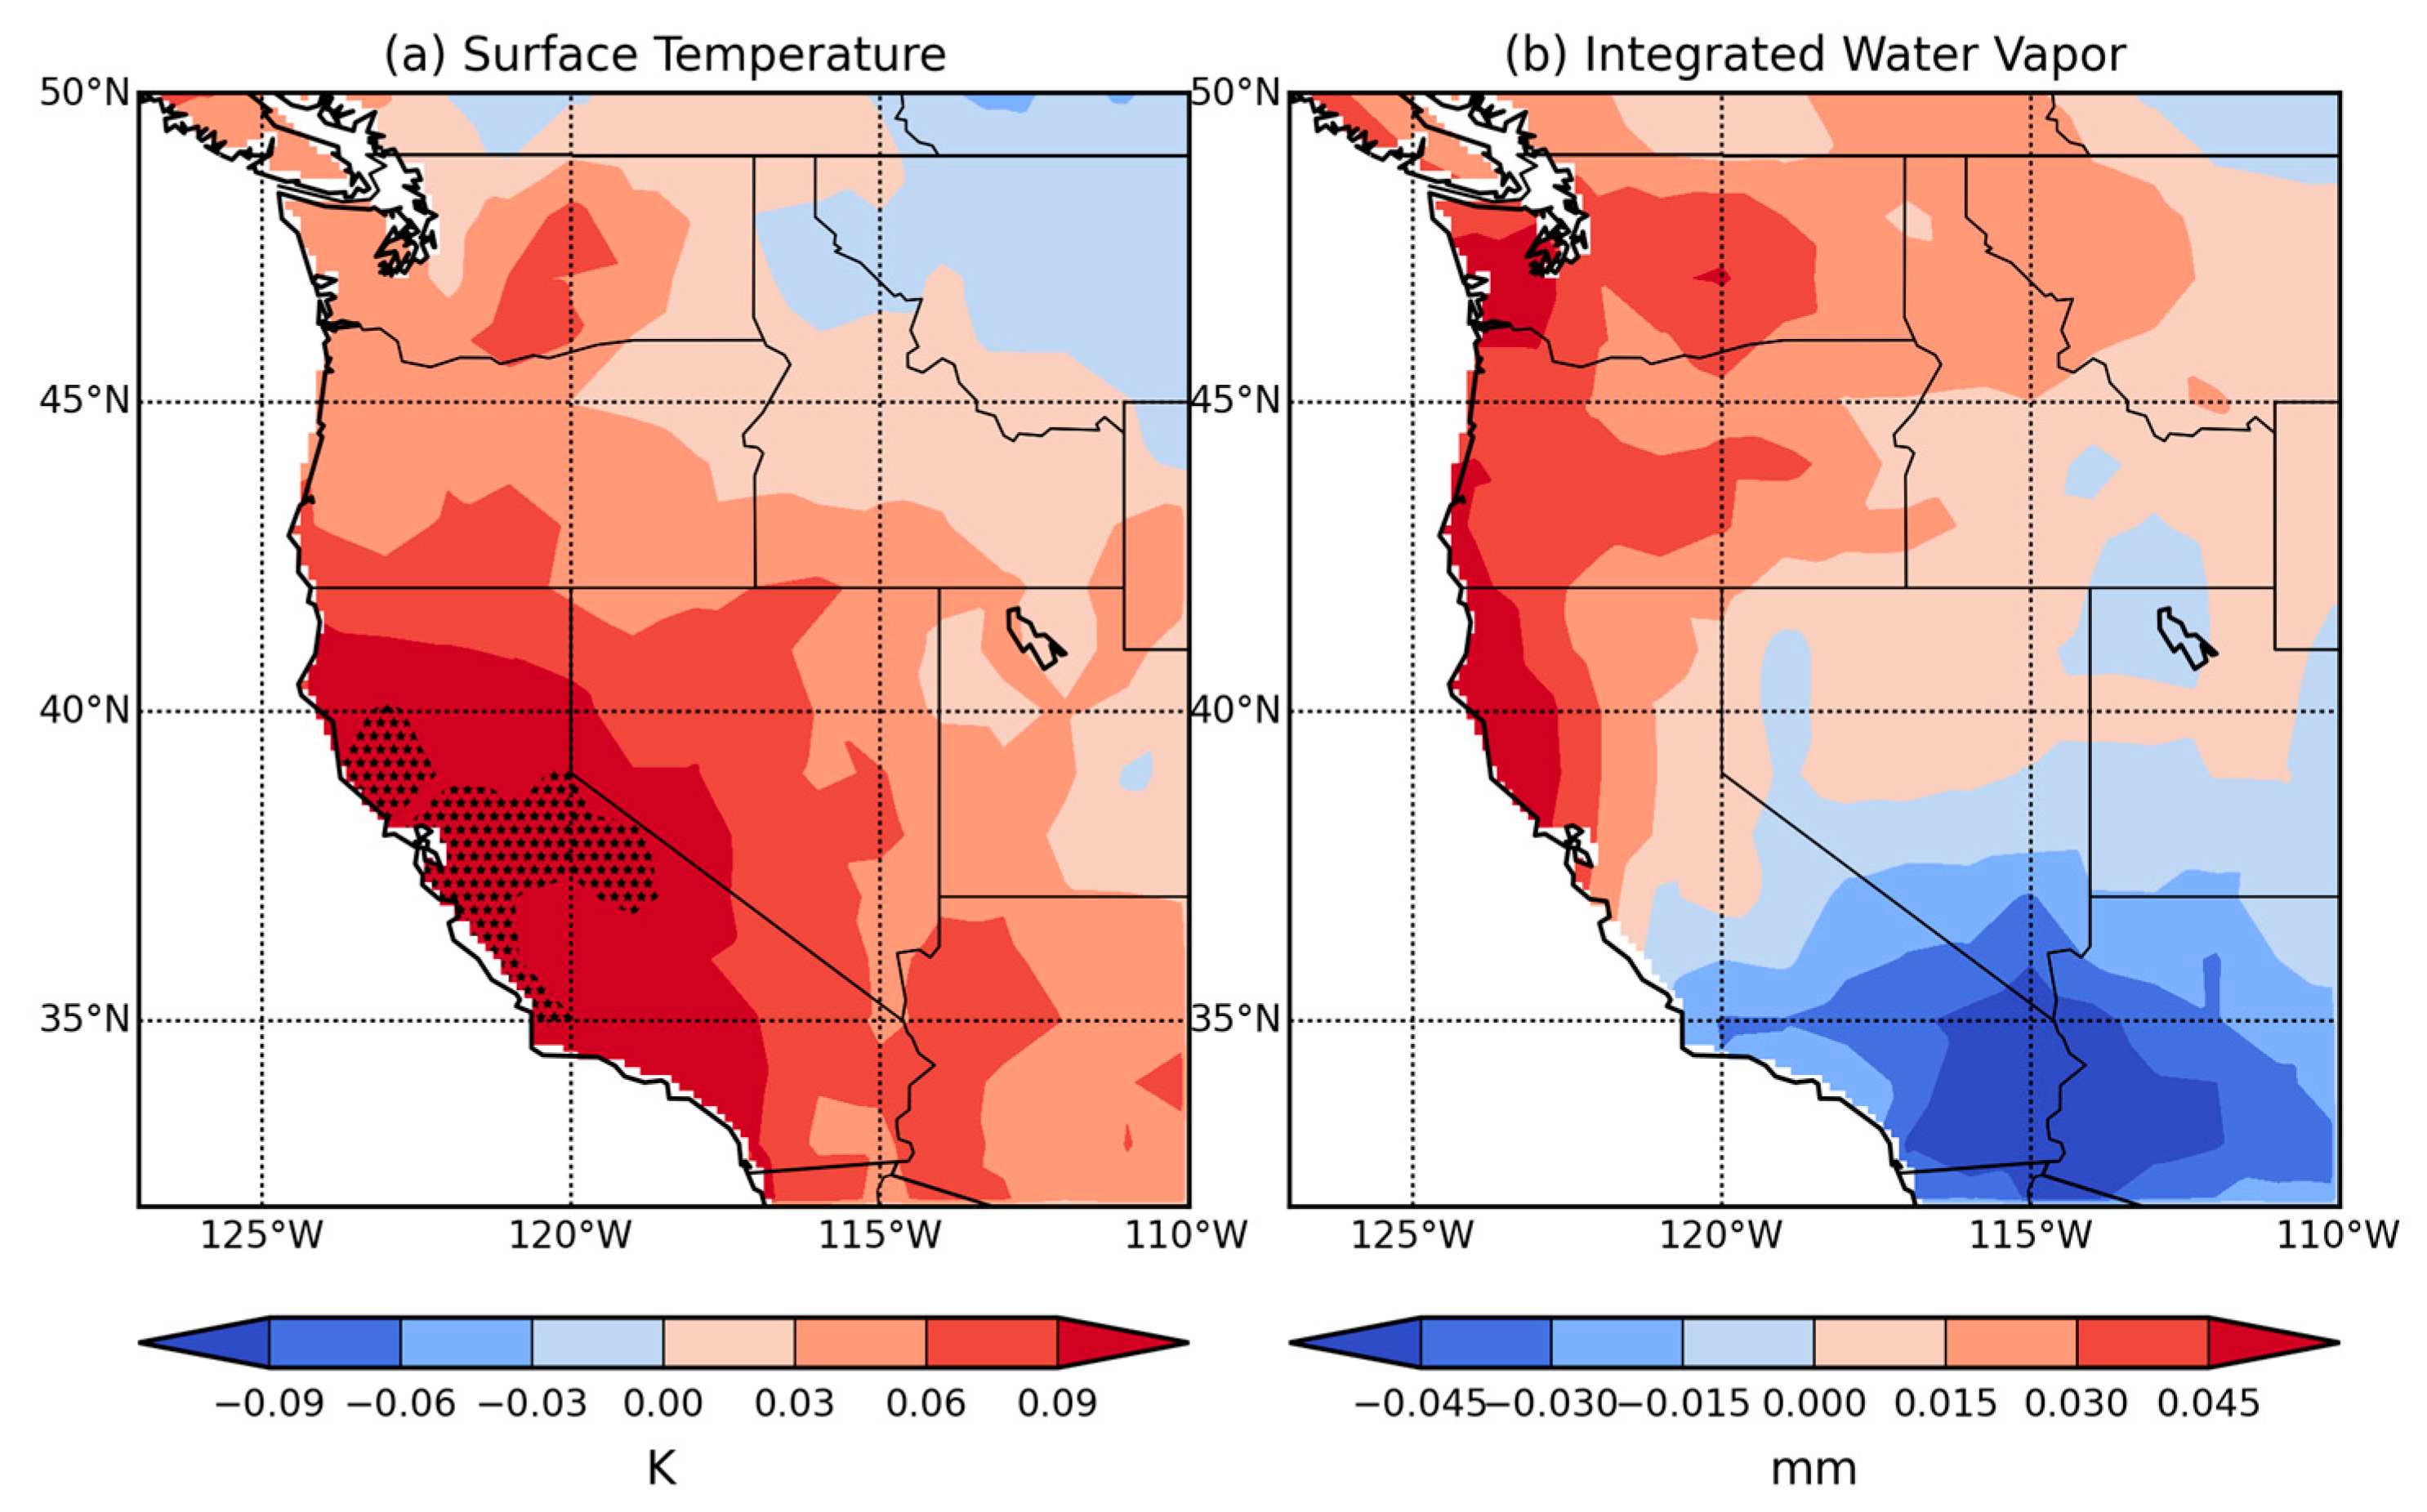
Figure 7.
The correlation coefficient between total column water vapor and winter season precipitation (a) frequency, (b) seasonal total, and (c) mean daily intensity over the western United States during winter season from 2003 to 2016. Hatching indicates areas of statistical significance.
Figure 7.
The correlation coefficient between total column water vapor and winter season precipitation (a) frequency, (b) seasonal total, and (c) mean daily intensity over the western United States during winter season from 2003 to 2016. Hatching indicates areas of statistical significance.

Figure 8.
The correlation coefficient between the surface temperature and winter season precipitation (a) frequency, (b) seasonal total, and (c) mean daily intensity over the western United States between December-January-February (DJF) 2003 and 2016. Hatching indicates areas of statistical significance.
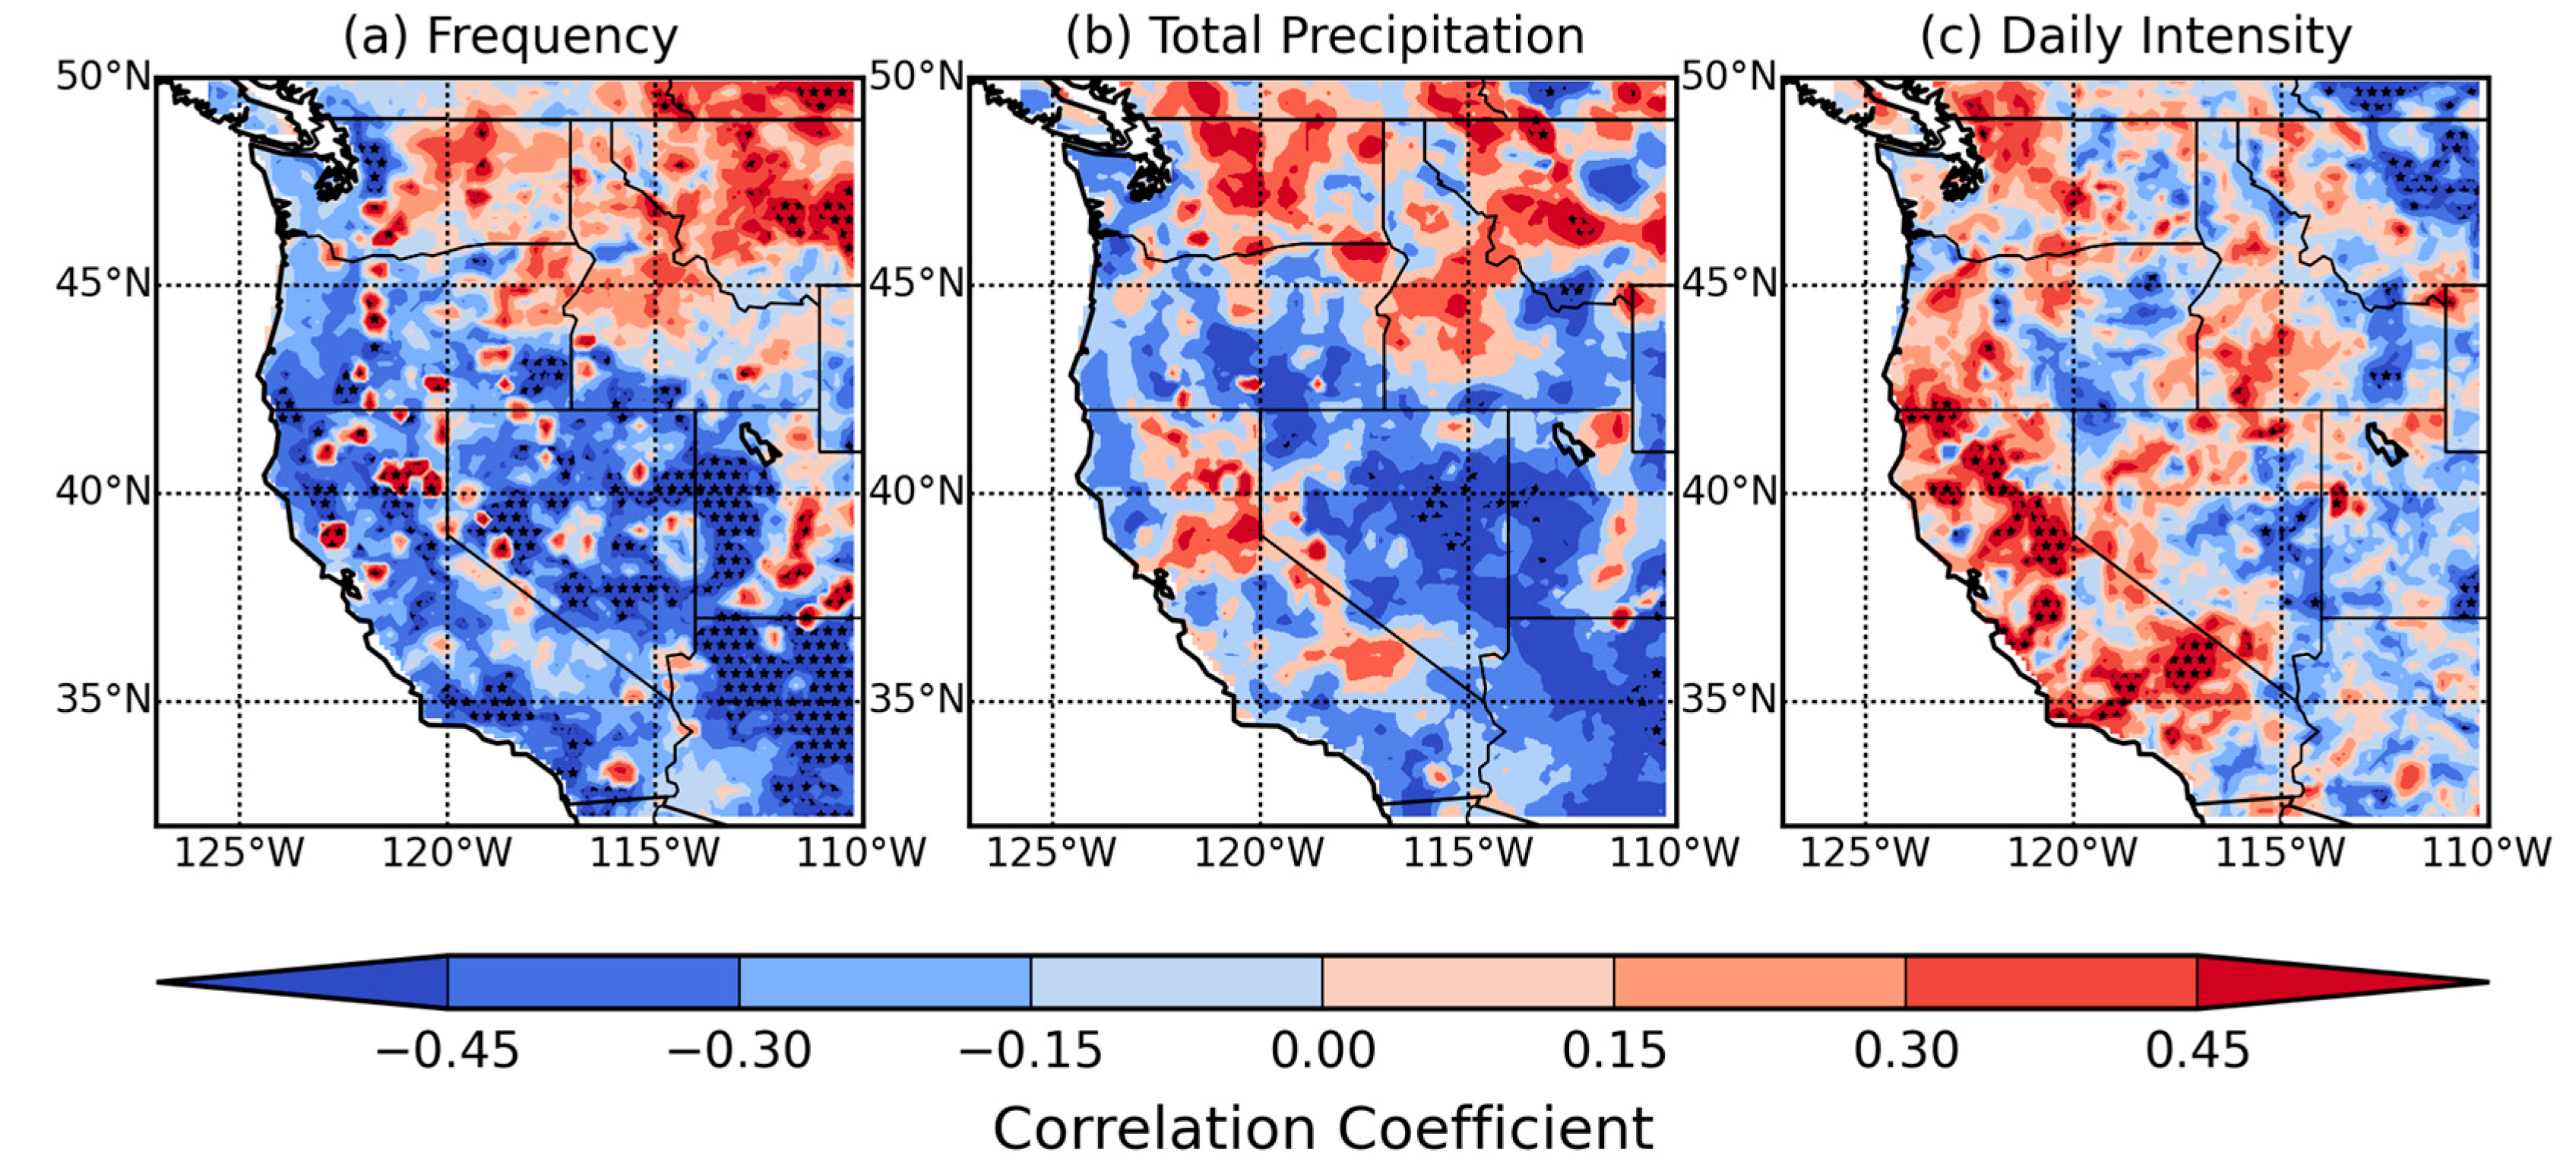
Figure 9.
The solid lines indicate the mean time series of frequency (number of days), totals (mm), mean daily intensity (mm/day), and total column water vapor (mm) within the sub-regions. Dashed lines are the slope of change based on linear regression analysis for the solid lines.
Figure 9.
The solid lines indicate the mean time series of frequency (number of days), totals (mm), mean daily intensity (mm/day), and total column water vapor (mm) within the sub-regions. Dashed lines are the slope of change based on linear regression analysis for the solid lines.

Figure 10.
The time series of (a) frequency in days (blue), (b) totals in mm (red), and (c) mean daily intensity in mm/day (green), with total column water vapor in mm (black) within the sub-regions 4–6.
Figure 10.
The time series of (a) frequency in days (blue), (b) totals in mm (red), and (c) mean daily intensity in mm/day (green), with total column water vapor in mm (black) within the sub-regions 4–6.
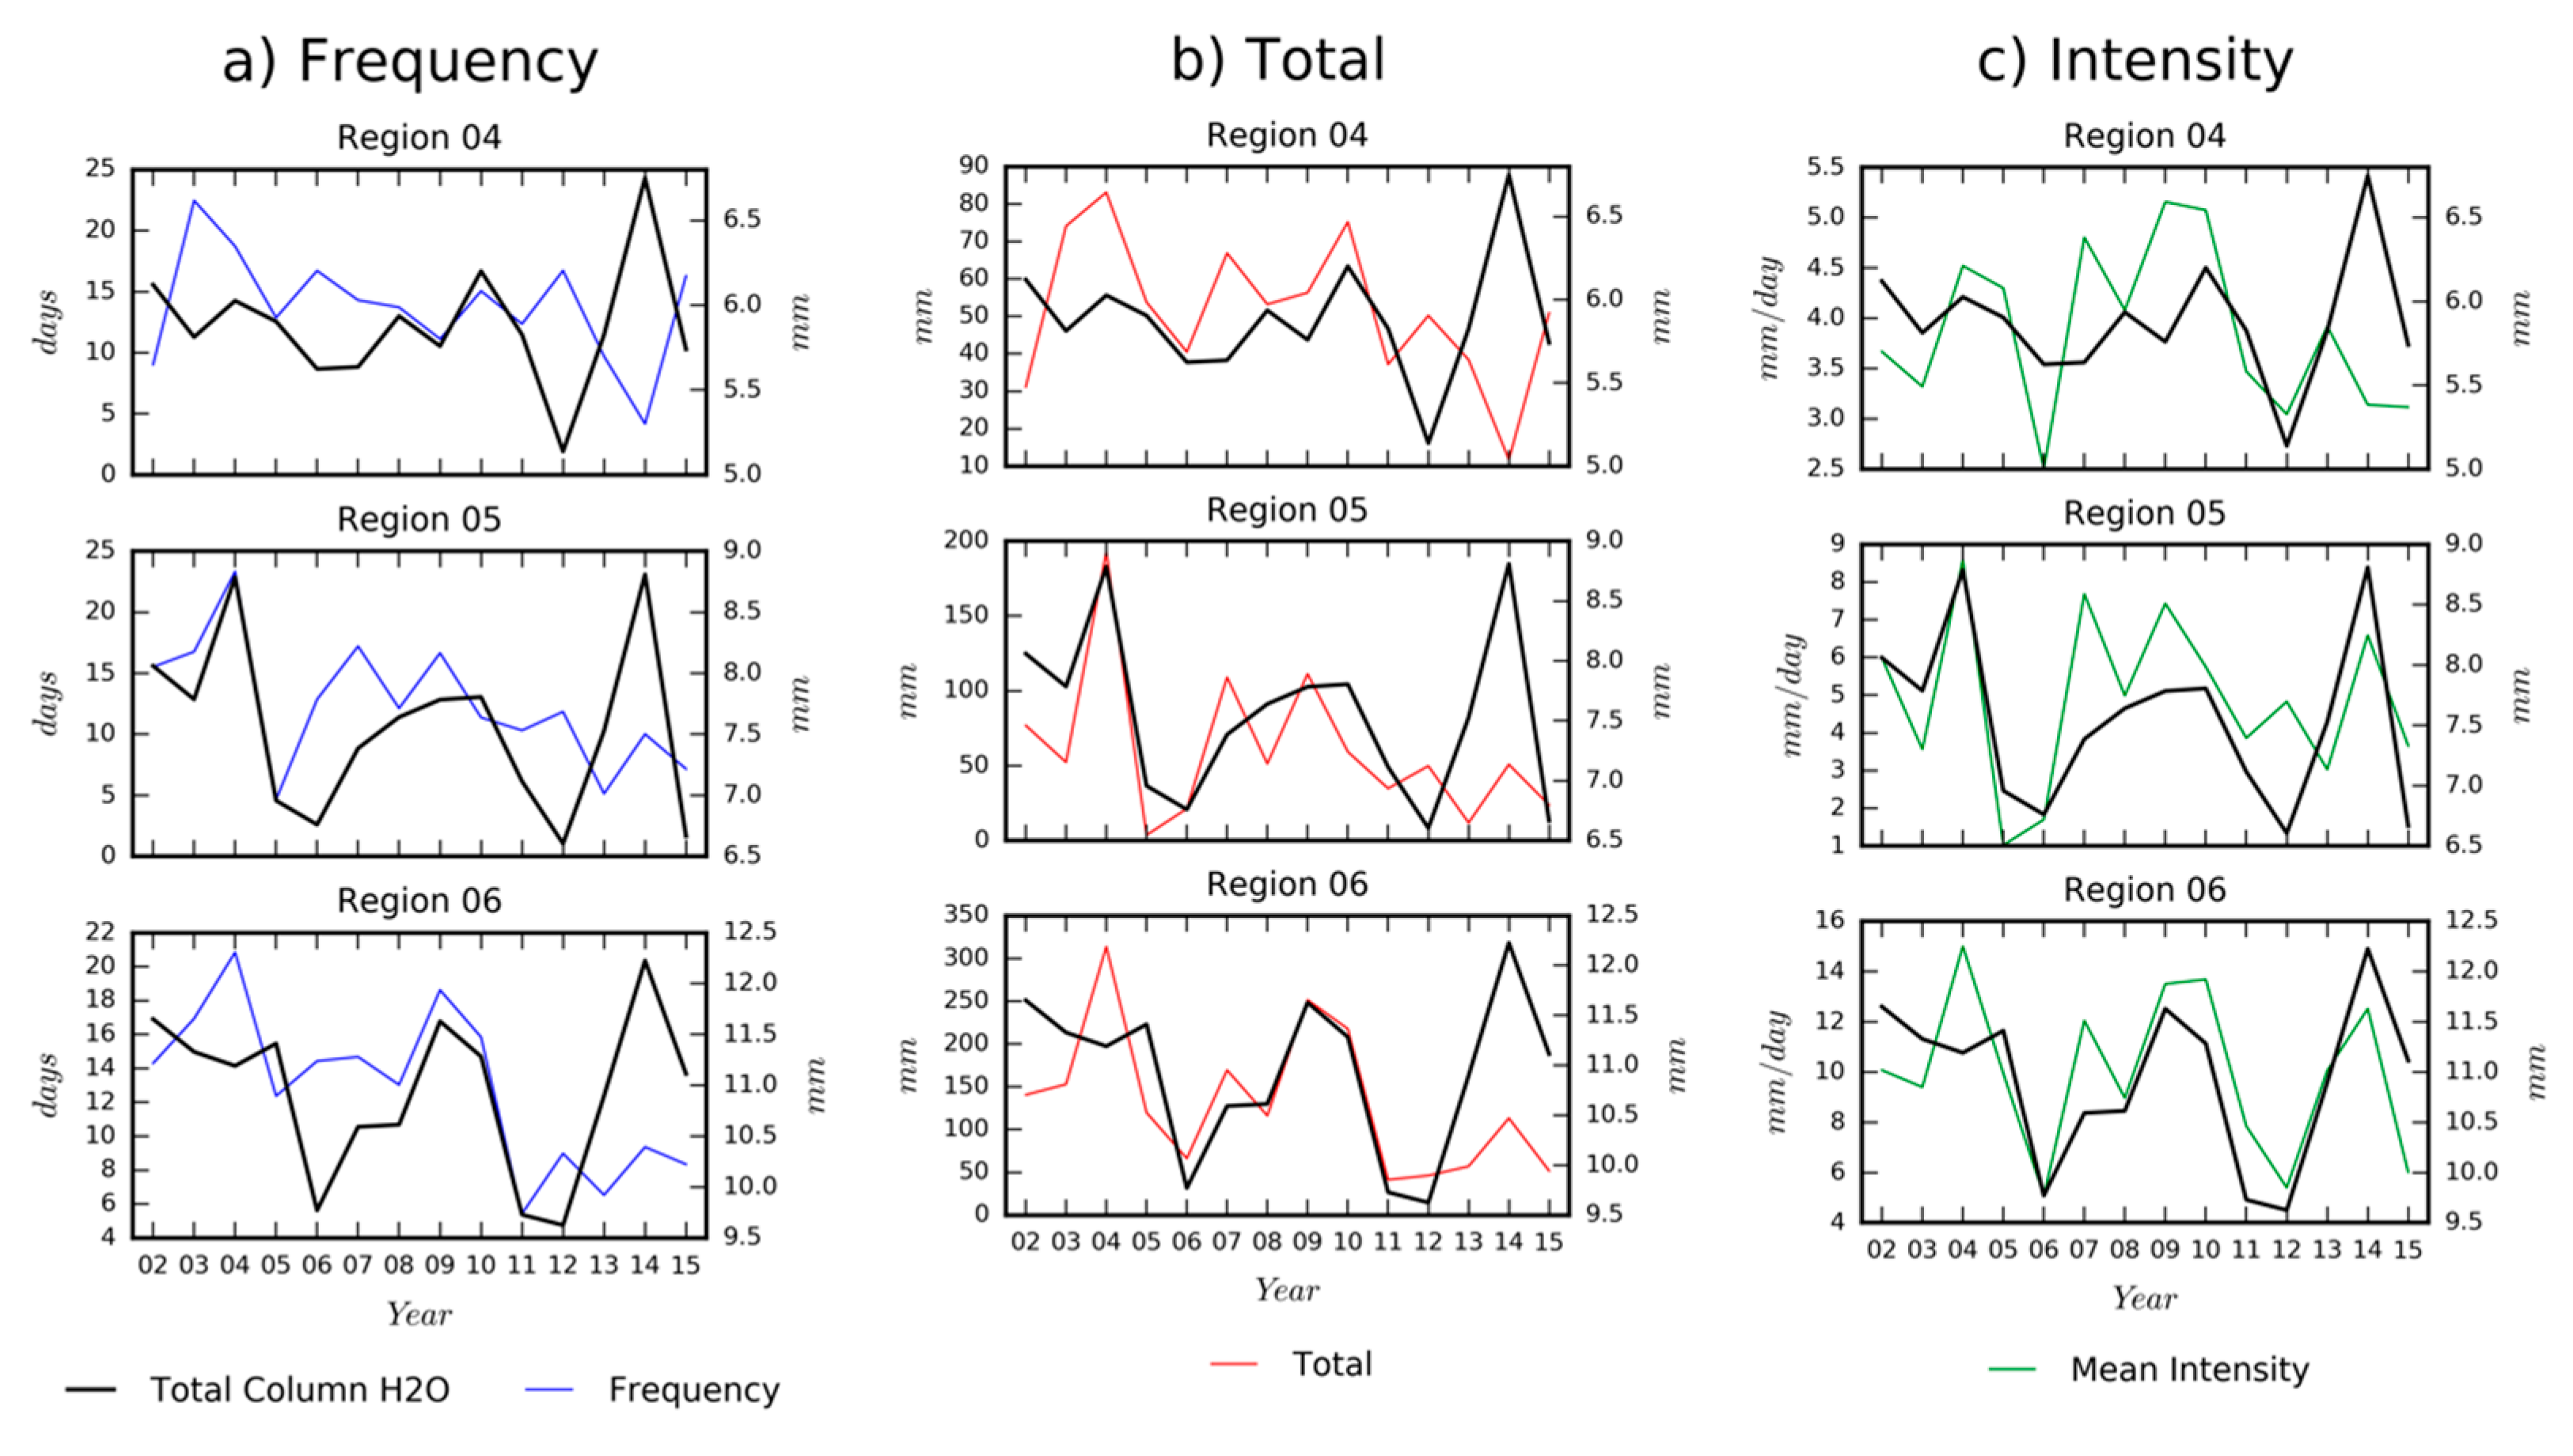
Figure 11.
The averaged anomalies for El Niño events (top) and La Niña events (bottom) for winter season precipitation (a) frequency, (b) seasonal total, and (c) mean daily intensity.
Figure 11.
The averaged anomalies for El Niño events (top) and La Niña events (bottom) for winter season precipitation (a) frequency, (b) seasonal total, and (c) mean daily intensity.
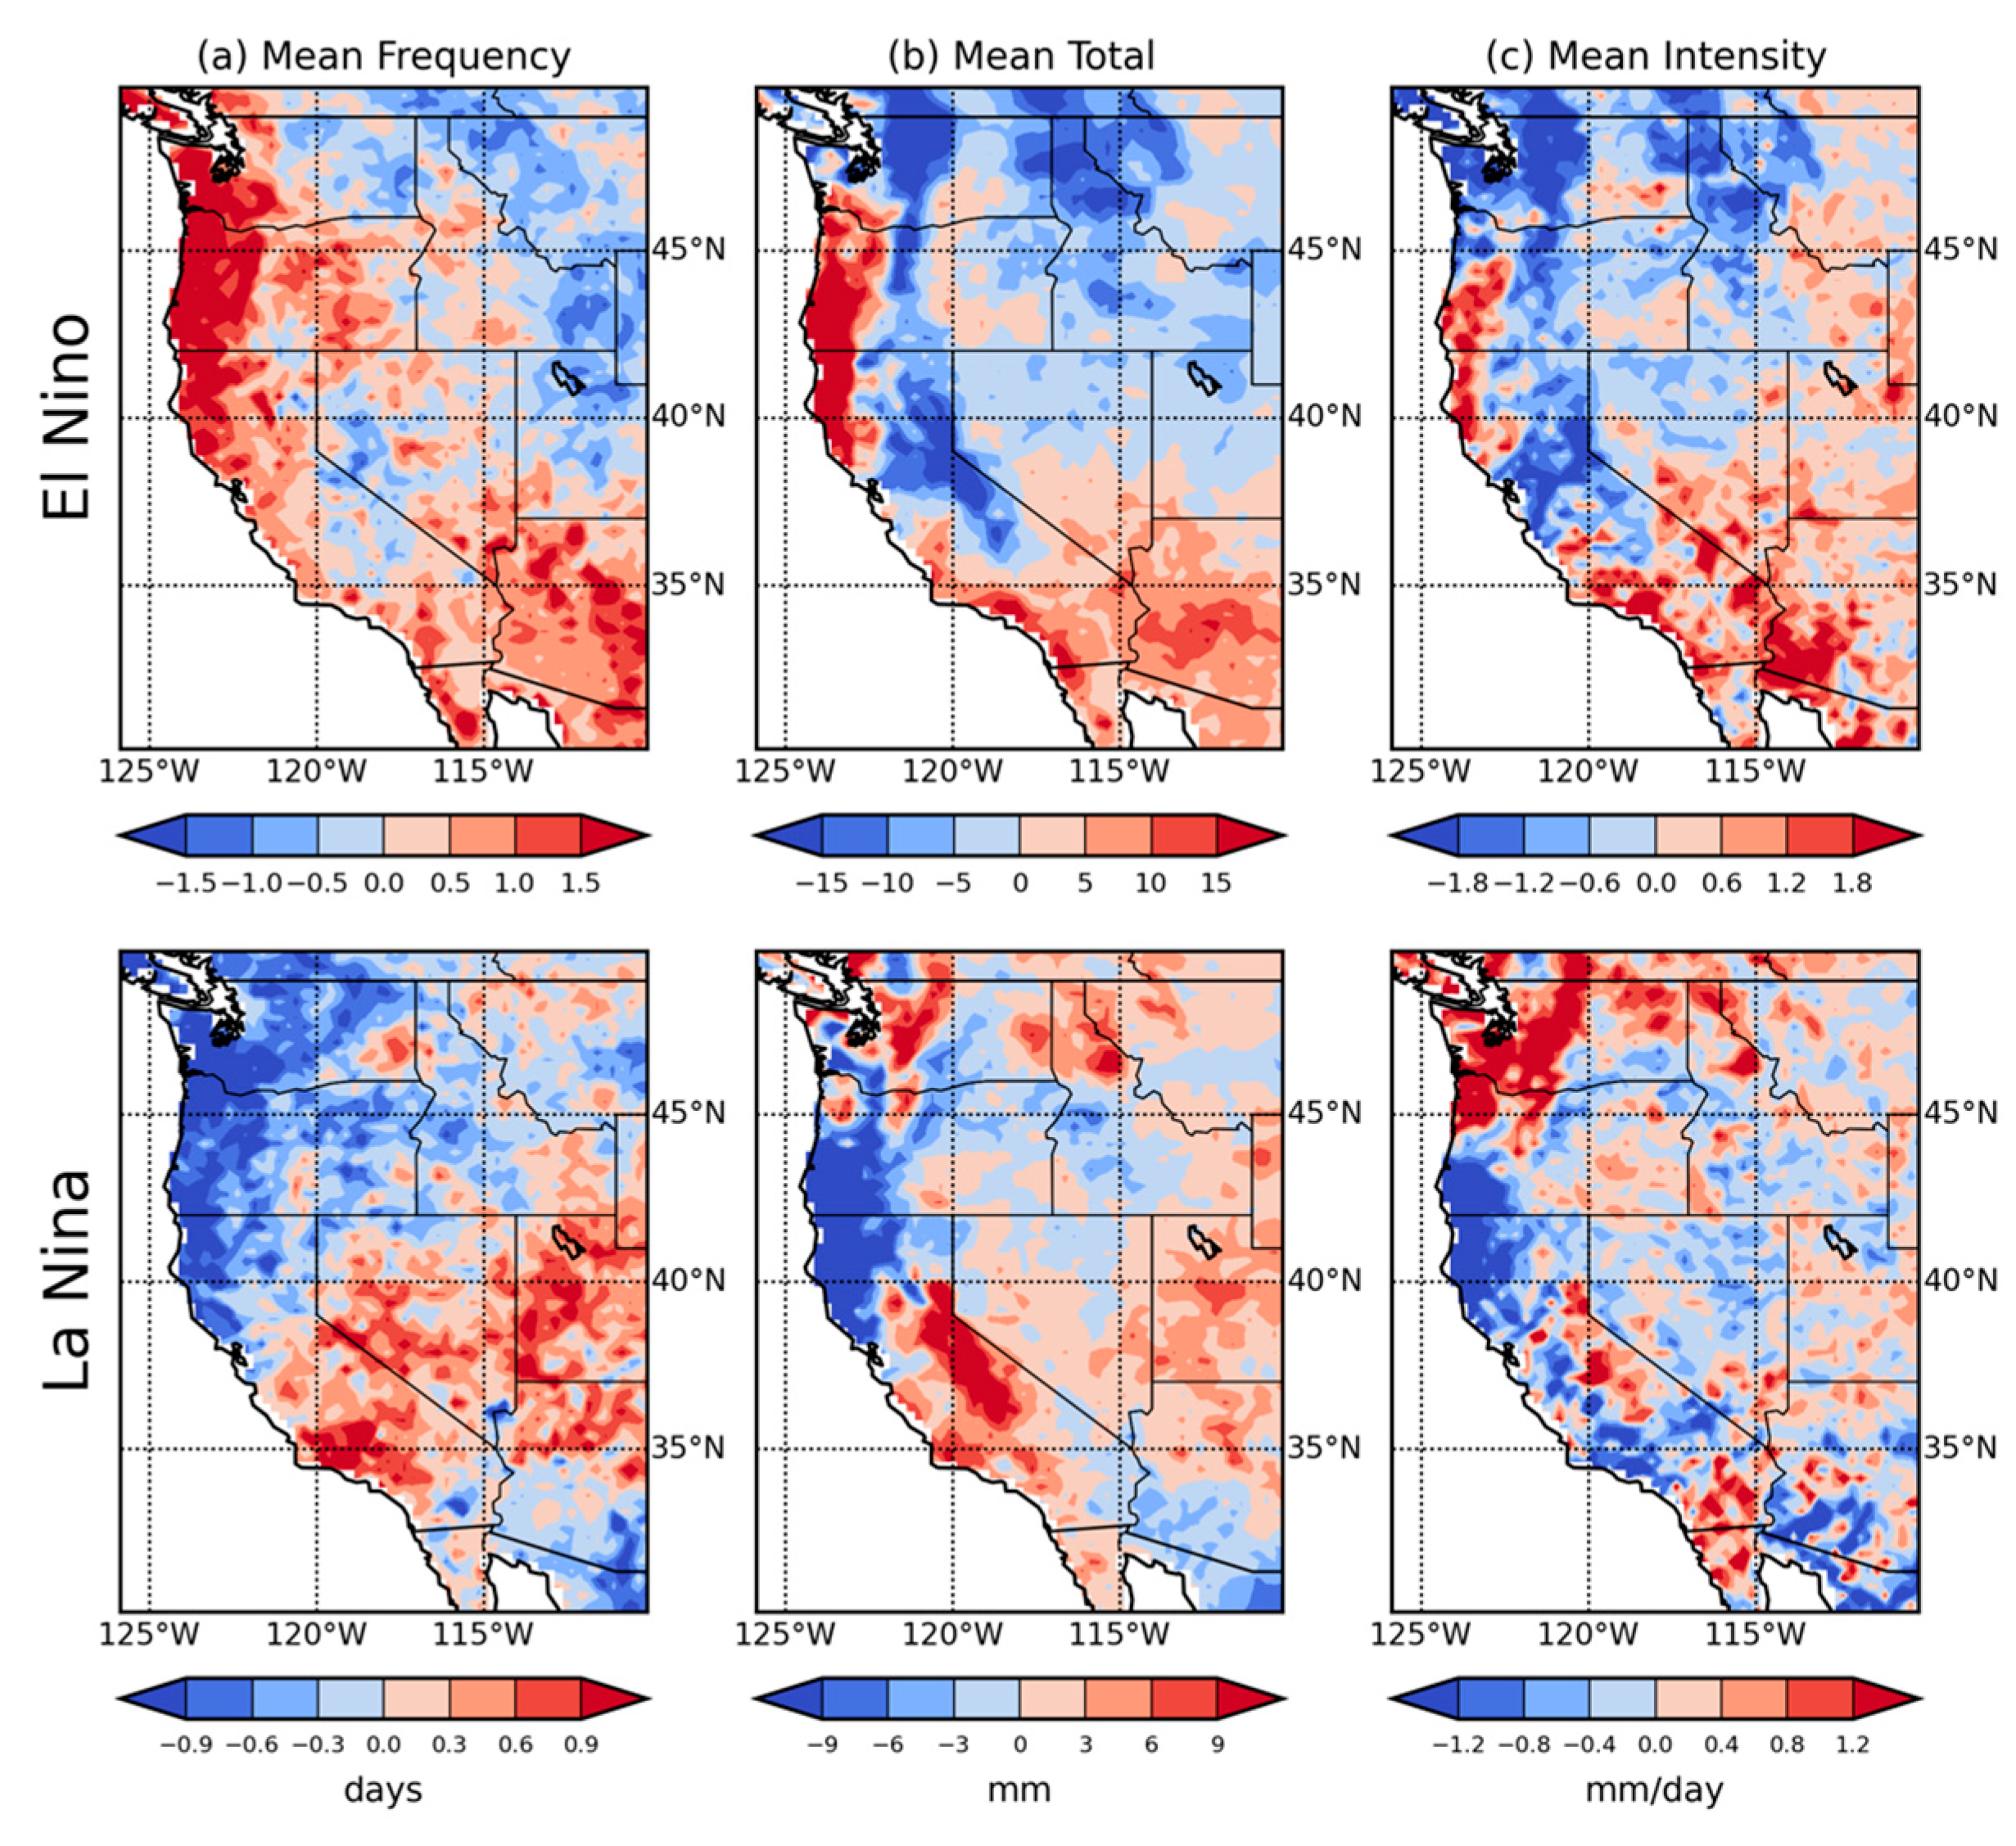
Figure 12.
The correlation coefficient between Multivariate ENSO Index (MEI) ENSO Index and winter season precipitation (a) frequency, (b) seasonal total, and (c) mean daily intensity over the western United States between DJF 1999 and 2016. The hatched areas indicate areas of statistical significance.

Table 1.
Sources of data used in this study.
| Dataset Name | Spatial | Temporal | Time Period | Parameter(s) | Reference |
|---|---|---|---|---|---|
| TRMM 3B42v7 | 0.25° × 0.25° | Daily | January 1998–present | Precipitation | [21,24] |
| AIRS v6L3 | 1° × 1° | Monthly | September 2002–present | Total Column Water Vapor, Surface Temperature | [25,26] |
| Multivariate ENSO Index | - | Monthly | January 1950–present | El Niño Oscillation Index | [27] |
© 2017 by the authors. Licensee MDPI, Basel, Switzerland. This article is an open access article distributed under the terms and conditions of the Creative Commons Attribution (CC BY) license (http://creativecommons.org/licenses/by/4.0/).
Share and Cite
MDPI and ACS Style
Nash, D.; Ye, H.; Fetzer, E. Spatial and Temporal Variability in Winter Precipitation across the Western United States during the Satellite Era. Remote Sens. 2017, 9, 928. https://doi.org/10.3390/rs9090928
AMA Style
Nash D, Ye H, Fetzer E. Spatial and Temporal Variability in Winter Precipitation across the Western United States during the Satellite Era. Remote Sensing. 2017; 9(9):928. https://doi.org/10.3390/rs9090928
Chicago/Turabian StyleNash, Deanna, Hengchun Ye, and Eric Fetzer. 2017. "Spatial and Temporal Variability in Winter Precipitation across the Western United States during the Satellite Era" Remote Sensing 9, no. 9: 928. https://doi.org/10.3390/rs9090928
Note that from the first issue of 2016, this journal uses article numbers instead of page numbers. See further details here.