Differential Absorption Lidar (DIAL) Measurements of Landfill Methane Emissions


National Physical Laboratory (NPL), Hampton Road, Middlesex, TW11 0LW Teddington, UK
*
Author to whom correspondence should be addressed.
Remote Sens. 2017, 9(9), 953; https://doi.org/10.3390/rs9090953
Submission received: 10 August 2017
/
Revised: 31 August 2017
/
Accepted: 11 September 2017
/
Published: 14 September 2017
(This article belongs to the Special Issue Remote Sensing of Greenhouse Gases)
Abstract
:Methane is one of the most important gaseous hydrocarbon species for both industrial and environmental reasons. Understanding and quantifying methane emissions to atmosphere is therefore an important element of climate change research. Range-resolved infrared differential absorption Lidar (DIAL) measurements provide the means to map and quantify a wide range of different methane sources. This paper describes the DIAL measurement technique and reports the application of an infrared DIAL system to field measurements of methane emissions from active and closed landfill sites. This paper shows how the capability of the DIAL to measure the spatial distribution of methane plumes enables DIAL vertical scans to spatially separate and independently quantify emissions from different sources. It also allows DIAL horizontal scans carried out above the surface to identify emission hot-spots. An overview of the landfill emission surveys carried out over the last decade by the National Physical Laboratory (NPL) DIAL system is presented. These surveys were part of research projects and commercial works aimed to validate the method and to provide reliable information on the methane emissions measuring the total site and area-specific emissions from active areas, capped areas, and gas engine stacks. This work showed that methane emissions are significantly higher for active sites than closed sites due to the methane emitted directly to air from the uncapped active areas. On active sites, the operational tipping areas generally have higher emission levels than the capped areas, although there is considerably variation in the emission from different capped areas. The information obtained with DIAL measurements allow site operators to identify significant fugitive emission sources and validate emissions estimates, and they allow the regulators to revise and update the emission inventories. Operators’ remediation actions driven by DIAL measurements have also been shown to considerably decreased total site methane emission.
1. Introduction
Landfills constitute one of the major anthropogenic sources of methane in many developed countries. Landfill gas emissions are a significant component of non-CO2 greenhouse gases releases and the Intergovernmental Panel on Climate Change (IPCC) has recently increased the 100 year CO2 equivalent for methane to 28 times that of CO2 [1]. The reported emissions from landfills for emission inventories are commonly estimated by using internationally agreed computer models such as GasSimTM [2]. This approach often involves large uncertainties due to inaccuracies of the input data and many assumptions in the estimation [3]. The IPCC guidelines indicate that measurement of methane emissions is necessary to validate emission models and to provide confidence in country specific model parameters which will provide the basis for further mitigation measures if required.
A landfill can be categorized as an operational site when waste is actively accepted on the site area known as the active area or as a closed site when all the different areas on site have been capped. Typically, an operational landfill also has several completed capped areas. The anaerobic degradation of organic waste produces biogas, mainly composed of methane, that can be emitted into the atmosphere by passing directly through the soil cap, through cracks in caps, through leaking boreholes, leaks in gas collection systems, or directly from uncapped operational areas of a landfill site. Most modern landfill sites have active gas extraction systems using vertical wells or horizontal collectors designed to actively collect the biogas generated within the landfill [3,4]. The methane produced and collected by waste facilities is combusted either in flares or in gas engines to produce electricity, therefore reducing methane emissions also carries an added economic value.
Regulators throughout the world are implementing waste management strategies, policies, and regulations aimed at reducing methane emission from landfills. Quantification of the methane emission directly from landfills is essential to determining the effectiveness of these reduction measures and to reducing the uncertainty in reported greenhouse gas emissions. Methane emissions at landfills can vary spatially and over time, measuring whole site methane emissions from landfills is therefore challenging. Typically, monitoring of landfill surface emissions is performed by means of flame ionization detector (FID) walkover and flux box survey that are labour intensive. FID walkover surveys do not provide emission rates and flux box surveys can estimate the whole site emission but only with high uncertainty [5].
Direct measurements of emissions are uncommon and, if conducted, are typically very sporadic. Remote sensing techniques are suited to the measurements of methane fugitive emissions as they have extended spatial coverage and generally do not have to make assumptions about the specific location of the emission sources. Several methods available to perform quantitative emissions measurement at landfill sites have been reviewed [5]. This review concluded that all the techniques have their limitations apart from the range-resolved infrared differential absorption Lidar (DIAL) method which could be used to fulfil almost any of the requirements of landfill emission monitoring.
DIAL is a powerful remote sensing technique that can be used to track and quantify plumes emitted from complex emission sources such as landfill sites, waste water treatment plants and petrochemical plants. By using Lidar (light detection and ranging—the optical equivalent of radar), the DIAL technique is able to make remote range-resolved single-ended measurements of the actual distribution of the targeted gas species in the atmosphere, in this case methane, with no disruption to normal site operational activities. DIAL provides 3D mapping of emission concentrations and, when combined with wind information, enables quantification of emission rates for a wide range of target species such as methane.
The National Physical Laboratory (NPL) DIAL facility, see Figure 1, includes both infrared (IR) and ultraviolet (UV) capabilities and has the capability to measure a wide range of species with high sensitivity. NPL DIAL systems have been used to carry out commercial industrial emission monitoring work for more than 25 years at over 70 industrial plants in eleven different countries.
Driven by the need for direct methane measurements from landfills, the NPL DIAL system has carried out landfill emission surveys at over 30 sites in the UK, France, and the USA, measuring the total site and area-specific emissions from e.g., active areas, capped areas, and gas engine stacks.
A comparison of five field-scale measurement methods, including DIAL, for measuring fugitive methane emissions has been conducted on a French landfill site [6]. The conclusion of this study states that “tracer gas and DIAL methods appear to be the most promising approaches for landfill fugitive methane measurement. Considering the quantification objectives, a global assessment can be easily derived with tracer gas, whereas a more comprehensive study of localized site specific performances can be undertaken with DIAL” [7].
The DIAL method was selected to measure methane emissions at a sample of landfills in England and Wales [8] and the calculated methane capture rates at each landfill site were presented by the UK Environment Agency at the Sardinia 2013 symposium [9].
Within this paper we give a description of the DIAL measurement technique and report the application of an infrared (IR) DIAL system built at NPL to field measurements of methane emissions from active and closed landfill sites. Section 2 outlines the DIAL method, Section 3 presents some example results from methane DIAL measurements at landfill sites, and the conclusions are given in Section 4.
2. Materials and Methods
DIAL is an optical remote sensing technique based on Lidar. The basic Lidar technique [10] uses a pulse of laser radiation, transmitted into atmosphere, and measures the light scattered by the atmosphere and returned to the system. DIAL is an extension of this using (at least) two laser pulses at different wavelengths.
The NPL DIAL laser source is operated alternately at two similar wavelengths. One of these, termed the ‘on-resonant wavelength’ (λON), is chosen to be at a wavelength which is absorbed by the targeted species. The other, the ‘off-resonant wavelength’ (λOFF), is chosen to be at a nearby wavelength which is not absorbed significantly by the targeted species. The two wavelengths are chosen to be close, so that the atmospheric scattering properties are the same for both wavelengths. They are also chosen so that any differential absorption due to other atmospheric species is minimized. Any measured difference in the returned signals is therefore due to absorption by the targeted species.
The basis of the DIAL technique is similar to most open-path optical spectroscopic techniques and follows the Beer–Lambert law [11] which relates the absorption of light passing through a gas to the integral concentration of the gas in the measurement path. The atmospheric return signal measured by a DIAL system is given by the Lidar equation, a simplified form of which is given in Equation (1). The signal at the detector, Sλ from range r, is
where Eλ is the transmitted energy, Dλ is a range independent system constant, Bλ is the backscatter coefficient for the atmosphere at wavelength λ, C(r) is the concentration of the target absorber with absorption coefficient αλ, and Aλ(r) is the absorption coefficient due to all other atmospheric absorption.
The equation has three basic components:
- Atmosphere terms relating to the backscatter (Bλ) and absorption (Aλ) of the scattering medium
- Parameters associated with the DIAL system (Eλ and Dλ)
- The measurement parameter giving the range (r) and absorption (αλC) due to the targeted species
Pairs of on and off-resonant Lidar signals are acquired and averaged separately until the required signal to noise ratio is achieved. The two wavelengths used are chosen such that the atmospheric terms Aλ(r) and Bλ(r) in the Lidar equation can be assumed to be the same for both wavelengths. These terms are then cancelled by taking the ratio of the two returned signals. See references [10,12,13] for a more detailed discussion about the Lidar equation.
The range-resolved path-integrated concentration (CL) may be derived by dividing the logarithm of the ratio of the signals by the differential absorption of the two wavelengths (Equation (2))
where N is the number of pulse pairs averaged, Δα = is the differential absorption coefficient for the targeted species and P represents the received signal after normalisation for the transmitted energies (Pλ = Sλ/Eλ).
This path-integrated concentration represents the total concentration of the targeted species in the atmosphere along the measured line-of-sight out to the range r. The range-resolved concentration can then easily be derived by differentiating the path-integrated concentration.
Figure 2 is a schematic of the NPL DIAL system showing the beam launch and detection system. The system has several integrated quality assurance procedures. The most important is the in-line calibration gas cell (see Figure 2) filled with known concentrations of the targeted species, obtained from NPL standard gas mixtures which are directly traceable to international standards. Every DIAL measurement is calibrated against the reference gas, this ensures that no assumptions need to be made about spectral performance or stability of the optical source. The scanner system directs the output beam and detection optics, giving hemispheric coverage in both the horizontal and vertical planes. For more information about the system, see Robinson et al. [14].
In the typical DIAL measurement configuration the mobile DIAL facility is positioned downwind of the area being investigated. The laser beam is then scanned in a vertical plane and the distribution of the targeted species in the measurement plane is mapped. Figure 3 shows how a typical vertical DIAL scan can be used to calculate emission rates. A series of range-resolved concentration measurements are made at different vertical elevation angles. These are then combined to provide the concentration distribution in the vertical measurement plane. The concentration distribution in the measurement plane is combined with the wind vectors through the measurement plane to determine the emissions distribution. This can then be integrated to give the overall emission rate through the plane [14]. A logarithmic wind profile is used to describe the vertical distribution of the wind vectors calculated using two to eight wind speeds measured at different heights. Two fixed meteorological masts can host four or two wind sensor packages at elevations of 11.9, 9.0, 6.2, and 3.4 m from the local ground. A 2.3 m high portable mast can be deployed near the DIAL truck or along the measurement line-of-sight. The DIAL truck is also equipped with an integral 12 m high meteorological mast. At landfill sites, the fixed meteorological masts are usually deployed at the highest site area, typically a hill shaped capped area, obtaining meteorological data at high elevations while the DIAL and portable sensors are used to measure the lower elevation local ground wind vector. Note that, in the case of methane measurements, the ambient background concentration is subtracted from the data prior to emission calculation.
The DIAL technique provides a direct measure of the spatial distribution of the targeted gas species rather than the path-averaged concentration given by most other optical remote sensing methods. This means that localised, high concentration plumes can be discriminated from broad, low concentration plumes, and that emissions from different sources within an area can be spatially separated and independently quantified. As an example, for measurements at a landfill site, the localised emission plume from an engine stack or flare can be separated from the extended emission of a capped area. Also, since the vertical distribution of an emission plume is referenced to a measured vertical wind profile (to calculate the emission rate) no assumptions about plume dispersion, lofting, or distribution have to be made. This removes one major source of uncertainty from emission results and means that DIAL can be used to measure emissions when source distribution, topography, or meteorological conditions would lead to unreliable dispersion modelling.
To measure the emission rate from a target area, the DIAL is located so that a series of downwind scans can be obtained and then moved to another position to monitor the upwind contribution to the emission rate. In some cases, upwind and downwind emission rates can be obtained from a single location. Emissions from other areas may be upwind of the measured sources, these sources can be excluded in two ways. If the upwind sources to be excluded are close to the measured sources, and produce localised plumes, these separate plumes can be discriminated spatially from the measured fluxes by selecting the section of the scanned region to integrate, in order to calculate the emission rate only from the area of interest. Conversely, if the upwind sources are further away and the emissions from them have been measured separately, the upwind emission rate can be subtracted from the total measured downwind emission rate.
The strength of the returning DIAL radiation depends on atmospheric conditions as the transmitted infrared radiation is returned by scattering from aerosol/dust particles in the atmosphere. The atmospheric conditions consequently affect the DIAL maximum scan range, it varies from day to day and can also change during the same day, but for methane the range is typically between 400 m and 1 km. The NPL DIAL has a theoretical range resolution of 3.75 m along the measurement beam, and a vertical and horizontal scan resolution which can be less than 1 m at 100 m (depending on the angular steps used between scan lines). However, the actual range resolution, determined by the signal averaging used, will depend on atmospheric conditions and the concentration of the targeted species and is typically of the order of 10 to 30 m.
From each location, DIAL scans can be carried out using different lines-of-sight in order to perform downwind and upwind measurements, to have different cuts through the area of interest or to measure different areas of interest. In general, at least three or four scans (individual sets of measurements) are made along each line-of-sight. The DIAL is usually configured to collect enough data (backscattered laser pulses) to determine the concentration profile along each scan, and to then step through the vertical scan lines to build up the matrix of concentration measurements. Typically, this will be a single measurement along one scan line of 1 to 2 min, which results in a vertical scan taking approximately 10 to 20 min with 10 to 15 angular steps that can range from 0.5° to 2°.
The validation of the infrared DIAL was carried out via a series of controlled field experiments including tests against controlled methane releases from a test stack, all showing agreements on the order of ±20% [14]. The uncertainty of the measurements reported in this paper was estimated based on the standard deviation of the individual emission rate measurements from which each mean emission rate value has been determined. The DIAL estimated uncertainty for a single measurement is about 20–30%, some of this uncertainty will be included in the reported standard deviation but it is not known how much. The uncertainty reported is therefore the variability of the measured results. As such, it encapsulates variability occurring during the measurements—such variability will include the measurement itself (random DIAL measurement uncertainty), variability in the source emissions, and variability of other factors such as the wind profile used since for each scan a different wind profile is calculated from the wind sensors data.
3. Results
The combination of wide area coverage and range-resolved measurements means that the DIAL method is well suited to carrying out detailed studies of emissions from complex area sources such as the emission of landfill gas from waste management sites. DIAL measurements can be made of hard to access areas at different elevations within the site without requiring any direct access, e.g., operational active areas and flares.
3.1. DIAL Vertical Measurement Scans
In a study commissioned by the UK Department for Environment Food & Rural Affairs (Defra) the aim was to quantify whole site emissions and identify the relative contribution of the different areas of the site to the overall emission [8]. In particular, at operational sites the aim was to differentiate between the active (uncapped) and permanently capped areas. A further aim was to quantify the emission from the gas engines so that this could be compared to the predicted methane emissions. Measurements were made at nine landfills of different ages, dimensions, operational stages, regulatory positions, and all with gas collection systems in place. All the measurements were carried out between late February and early May and all the sites were measured once during a week period. A logarithmic vertical wind field profile was used for the emission rate calculations and this was determined from the speeds measured from two wind sensor packages on a fixed mast sensors, at 11.9 m and 3.4 m local elevation. The wind direction measured from the fixed mast upper sensor was used for the emission rate measurements. The measurements successfully met the aims of the project [9].
In a follow up study commissioned by Defra [15], measurements were made at three operational landfill sites to investigate the complexity of the wind field and quantify the uncertainty in the methane emission that is introduced by the wind profile assumptions in order to assess whether the method used to calculate the wind profile is as representative as possible of the wind conditions at each site. This is important in ensuring that the uncertainty in the methane mass emission results is as small as possible. The use of several wind sensors (at multiple heights and multiple locations) helped to obtain a more accurate logarithmic wind profile fit. Nonetheless, the effect of this improved wind profile on the uncertainty in the calculated emission rate with respect to using a logarithmic wind profile based on measurements at only two heights was generally smaller than the variability (and therefore uncertainty) associated with the measurement itself. All the measurements were carried out between late February and March and all the sites were measured once over a two week period. The results from this study can be found in the report prepared for Defra [15] and will be the subject of a separate paper.
In a third study commissioned by Defra, DIAL measurements were carried out at one operational landfill site and one closed site. The aim of this project was to use the DIAL to obtain further data and to compare these results to other measurement techniques. The results of this study will be the subject of a separate paper.
As general observation on the results of DIAL measurements of landfills, methane emissions are significantly higher for active sites (192 to 720 kg/h) than closed sites (21 to 146 kg/h) due to the methane emitted directly to air from the uncapped active areas. On active sites, the operational tipping areas generally have higher emission levels than the closed (and capped) areas, although there is considerable variation in the emission from different sites and areas. Figure 4 and Figure 5 show example 3D plots of plumes measured from an active area and a closed area respectively with measured emission rates of 125 and 22 kg/h. The localised emissions from the gas engines were also measured specifically on several occasions. Figure 6 shows an example 3D plot of a plume from a compound with a total of eight gas engines and four stacks; two higher elevation stacks (each serving three engines) and two low stacks for two engines. The average emission rate per engine was about 6 kg/h and the calculated slippage rate from the gas engine flow rate was about 3%.
DIAL vertical scans not only give the operators mass quantification of the emission but also rich spatial information on the plumes, see Figure 4 and Figure 5, and therefore an indication of where the main emission sources are located. The operators can use this data to compare with emissions estimates, to report emission values to the authorities, and to calculate site average capture rates from their collection data. The results can also be used to efficiently target repair and remediation activities, thereby reducing site emissions and economic losses. For example, as part of commercial work carried out for a private operator, DIAL measurements at two active landfills were repeated after the remediation actions driven by the first set of DIAL measurements were completed. In the first case, the total emission from 10 capped areas, excluding the active uncapped area that was being filled, decreased from 664 ± 40 to 96 ± 7 kg/h. In the second case, the total emission from three capped areas (excluding the active uncapped area) decreased from 826 ± 23 to 168 ± 14 kg/h. It can be expected that methane emissions from a landfill vary over time and under different atmospheric conditions such as temperature and pressure. Although these two sets of measurements were conducted in two different periods of the year, June and September, under similar temperature conditions, it is unlikely that such decrease in the emission (80% and 86%) could be accounted only by possible temperature and pressure variations and it is reasonable to explain this reduction as result of the remediation activity.
DIAL measurements also provide emission values for different capped areas around a site giving the possibility to the operators to calculate the capture rate and the efficiency of each capped area. The authorities can also use this data to revise and update emission inventories. For example, in the first Defra study [8] the capture rates of the nine surveyed landfills ranged from 28% to 85% suggesting a wide range in the performance of landfill operators in collecting landfill gas across the surveyed landfills [9].
3.2. DIAL Horizontal Measurement Scans
In addition to the emission measurements using vertical DIAL scans, horizontal scans can be made over different areas of the landfill site when the site operator requires information of potential hot-spots in the emission distribution. Figure 7 shows a 3D plot of a horizontal scan above the surface of a landfill capped area that locates potential emission sources. Horizontal scan data is most useful under low wind speed conditions. Considerable care needs to be taken in the interpretation of horizontal scans when the wind speed is significant, since it is difficult to distinguish between local emission sources, i.e., close to where elevated concentration is observed, and upwind sources being blown into the measurement plane.
Horizontal scans cannot quantify the fugitive mass emission rate but can identify emission sources like faults in the capped surface, leaking wells, and methane migration between boundaries of capped areas. This is information can help site operators to plan remediation actions.
4. Discussion and Conclusions
This paper has presented a brief overview of the NPL DIAL system, describing its operation, and has presented examples of the use of the system for methane emission monitoring at waste facilities. It has been shown that the infrared DIAL technique is able to map and quantify fugitive methane emissions from all potential sources in a site including localised sources like gas engine stacks, specific site areas, and the total site emission rates.
Methane emissions measured by the DIAL at active sites are significantly higher than the emission measured at closed sites due to the methane emitted directly to air from the uncapped active areas. On operational sites, the active areas generally have higher emission levels than the capped areas, although there is considerable variation in the emission from different capped areas.
DIAL vertical scans not only give the operators mass quantification of the emission but also rich spatial information on the plumes and therefore an indication of where the main emission sources are located. The operators can use this data to compare with emissions estimates, to report emission values to the authorities and to calculate site average capture rate from their collection data. The results can also be used to efficiently target repair and remediation activities, thereby reducing site emissions and economic losses. Operators’ remediation actions driven by DIAL measurements have been shown to considerably decreased total site emission. In the case of two landfills that were measured by the DIAL for a second time after the remediation work was completed, the total methane emission from the same capped areas was found to be 80% and 86% lower.
The authorities can use DIAL data to revise and update the emission inventories, to assist them in implementing waste management strategies, policies, and regulations aimed at reducing methane emission from landfills and to understand the effectiveness of these reduction measures.
The history of emissions measurements made with DIAL at landfill sites over the last decade are testament to the maturity of the technique that can be deployed as reference tool by the waste industry.
Acknowledgments
The NPL DIAL has been developed over a period of more than 25 years, with support from a number of industrial partners including BP, Shell, British Gas, and Siemens, with underpinning support from the UK National Measurement System. We would also like to thank Defra and Environment Agency of England (EA) for funding and supporting some of the landfill measurement projects. The help and co-operation of the landfill site operators during the studies is gratefully acknowledged. The authors would also like to acknowledge past and present NPL staff who developed and worked with the DIAL system over the years.
Author Contributions
All the authors carried out the experiments and contributed to the data analysis; F.I. wrote the paper that was revised by R.R. and T.G.
Conflicts of Interest
The authors declare no conflict of interest.
References
- Working Group I Contribution to the Fifth Assessment Report of the Intergovernmental Panel on Climate Change. Chapter 8: Anthropogenic and Natural Radiative Forcing. In IPCC, 2013: Climate Change 2013: The Physical Science Basis; Cambridge University Press: Cambridge, UK; New York, NY, USA, 2014; pp. 659–740. [Google Scholar]
- GasSim Home. Available online: http://www.gassim.co.uk/ (accessed on 4 August 2017).
- Bogner, J.; Matthews, E. Global methane emissions from landfills: New methodology and annual estimates 1980–1996. Glob. Biogeochem. Cycles 2003, 17, 1065. [Google Scholar] [CrossRef]
- Barlaz, M.A.; Chanton, J.P.; Green, R.B. Controls on Landfill Gas Collection Efficiency: Instantaneous and Lifetime Performance. J. Air Waste Manag. Assoc. 2009, 59, 1399–1404. [Google Scholar] [CrossRef] [PubMed]
- Armstrong, K.; Gregory, R. Review of Landfill Surface Emissions Monitoring—WR0604; Report Prepared for Defra by Golder Associates (UK) Limited; Defra: London, UK, 2007; p. 69.
- Babilotte, A.; Lagier, T.; Fiani, E.; Taramini, V. Fugitive Methane Emissions from Landfills: Field Comparison of Five Methods on a French Landfill. J. Environ. Eng. Asce 2010, 136, 777–784. [Google Scholar] [CrossRef]
- Field Intercomparisons of Methods to Measure Fugitive Methane Emissions. Available online: https://erefdn.org/field-intercomparisons-of-methods-to-measure-fugitive-methane-emissions/ (accessed on 29 June 2017).
- Innocenti, F.; Robinson, R.A.; Gardiner, T.D.; Tompkins, J.; Smith, S.; Lowry, D.; Fisher, R. Measurements of Methane Emissions and Surface Methane Oxidation at Landfills—WR1125; Report Prepared for Defra by NPL; Defra: London, UK, 2013; p. 89.
- Bourn, M.; Browell, D. Methane capture rates at UK landfills. In Proceedings of the Fourteenth International Waste Management and Landfill Symposium, Sardinia, Italy, 30 September–4 October 2013. [Google Scholar]
- Measures, R.M. Laser Remote Sensing: Fundamentals and Applications; Wiley: New York, NY, USA, 1984; ISBN 978-0-471-08193-7. [Google Scholar]
- Houghton, J.T. The Physics of Atmospheres, 2nd ed.; Cambridge University Press: Cambridge, UK; New York, NY, USA, 1986; ISBN 978-0-521-32731-2. [Google Scholar]
- Byer, R.L.; Garbuny, M. Pollutant Detection by Absorption Using Mie Scattering and Topographic Targets as Retroreflectors. Appl. Opt. 1973, 12, 1496–1505. [Google Scholar] [CrossRef] [PubMed]
- Schotland, R.M. Errors in the Lidar Measurement of Atmospheric Gases by Differential Absorption. J. Appl. Meteorol. 1974, 13, 71–77. [Google Scholar] [CrossRef]
- Robinson, R.; Gardiner, T.; Innocenti, F.; Woods, P.; Coleman, M. Infrared differential absorption Lidar (DIAL) measurements of hydrocarbon emissions. J. Environ. Monit. 2011, 13, 2213–2220. [Google Scholar] [CrossRef] [PubMed]
- Innocenti, F.; Robinson, R.A.; Gardiner, T.D.; Finlayson, A.J.; Connor, A.; Lowry, D.; Fisher, R. Supplementary DIAL Survey of Methane Emissions and Surface Methane Oxidation at Landfills—WR1906; Report Prepared for Defra by NPL; Defra: London, UK, 2015; p. 42.
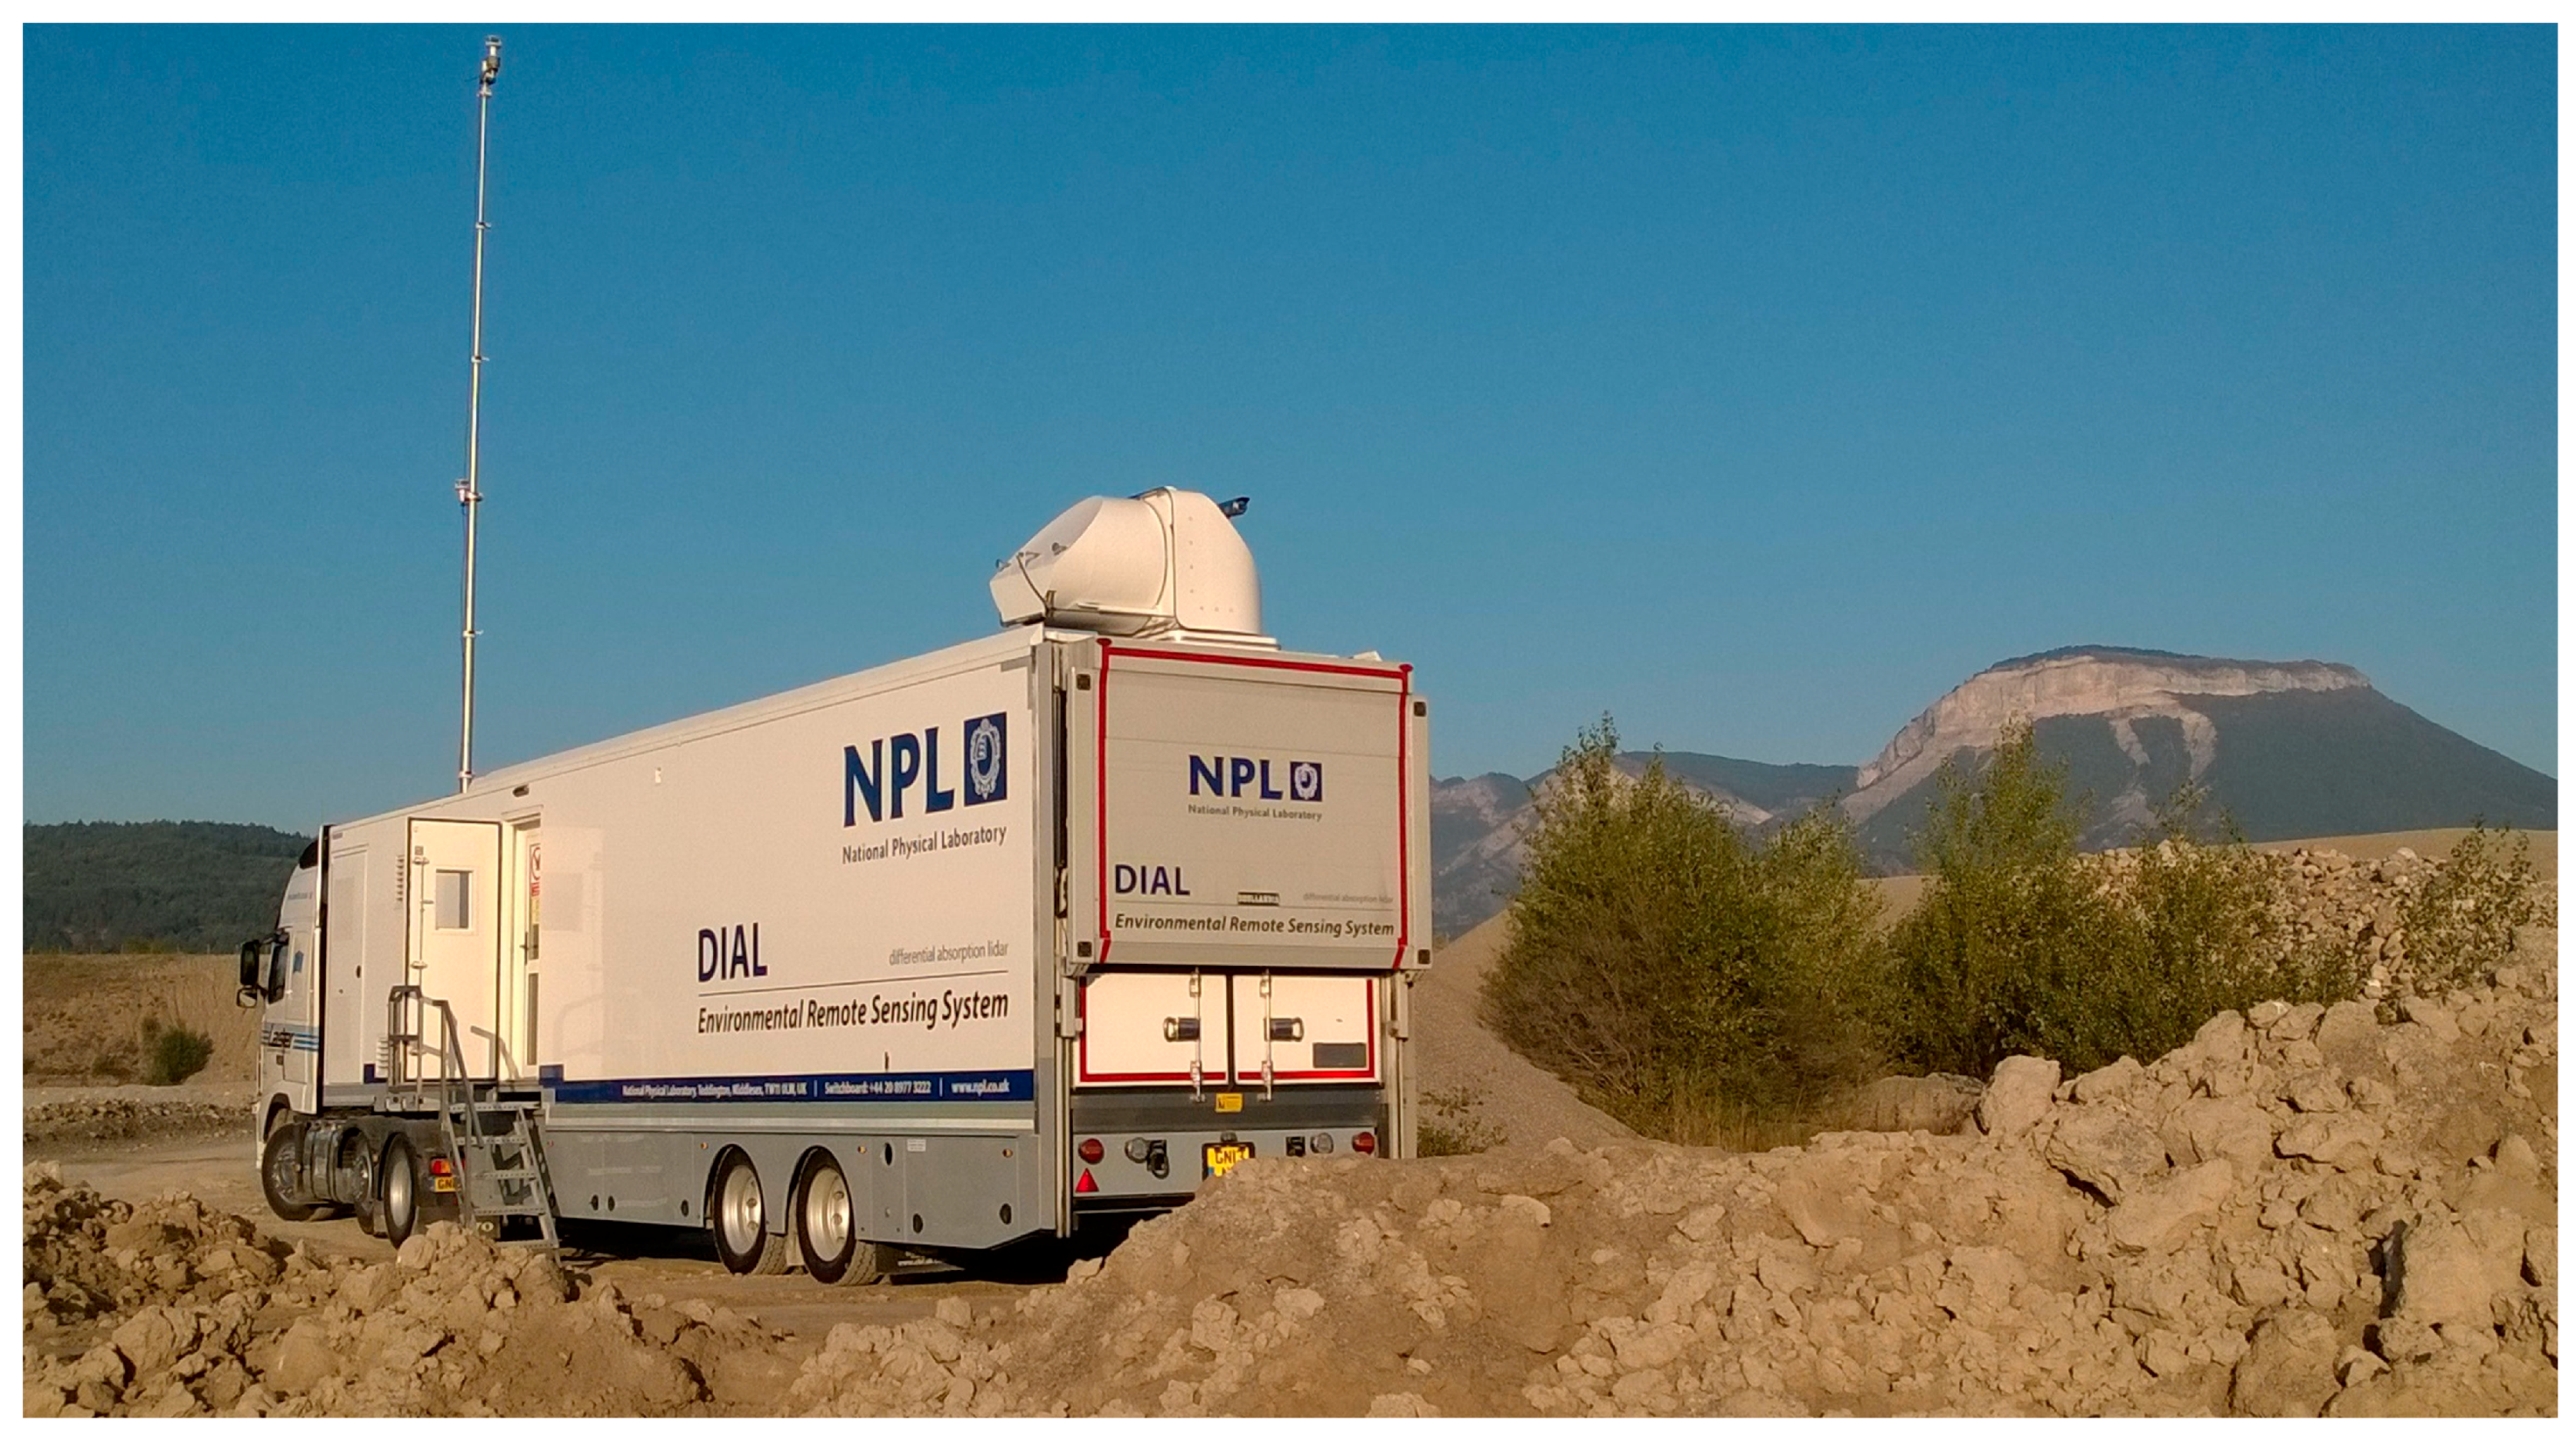
Figure 1.
NPL DIAL system in operation at a landfill site.

Figure 2.
DIAL system diagram.
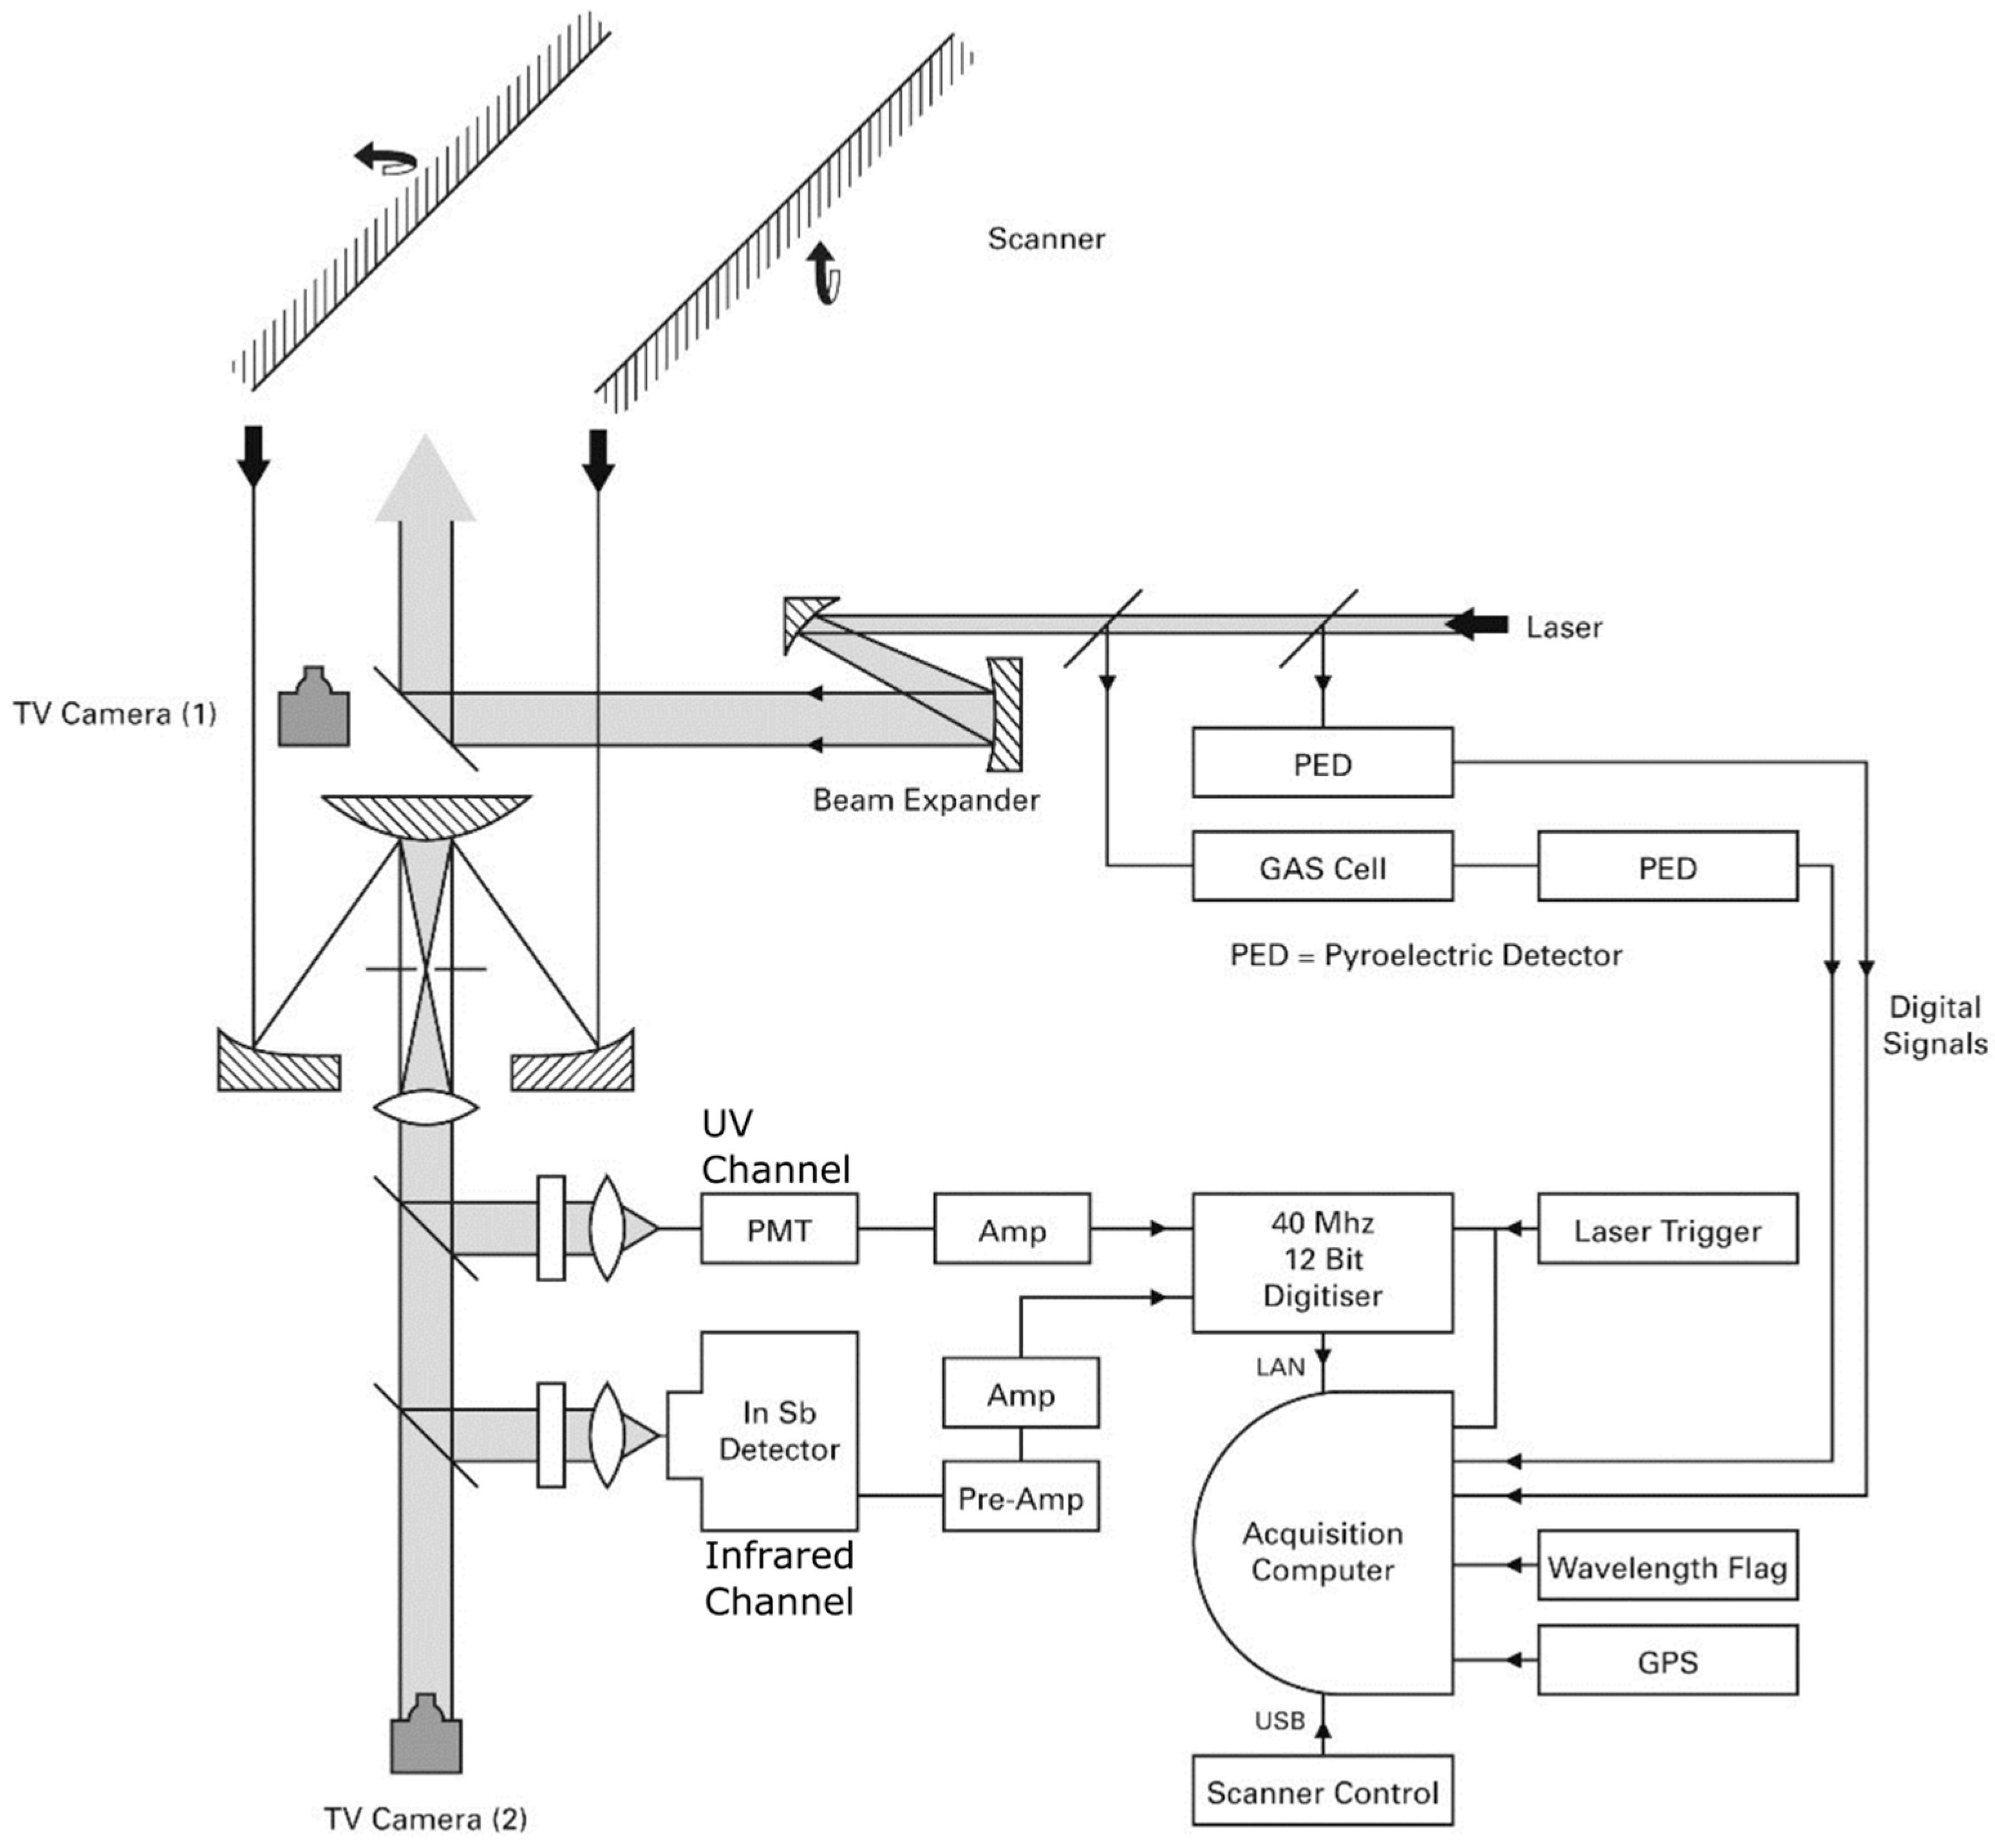
Figure 3.
(a) Schematic showing how the emission rate is calculated combining DIAL concentration and wind vector measurements; (b) example of the fixed meteorological mast used to measure wind conditions at different heights.
Figure 3.
(a) Schematic showing how the emission rate is calculated combining DIAL concentration and wind vector measurements; (b) example of the fixed meteorological mast used to measure wind conditions at different heights.
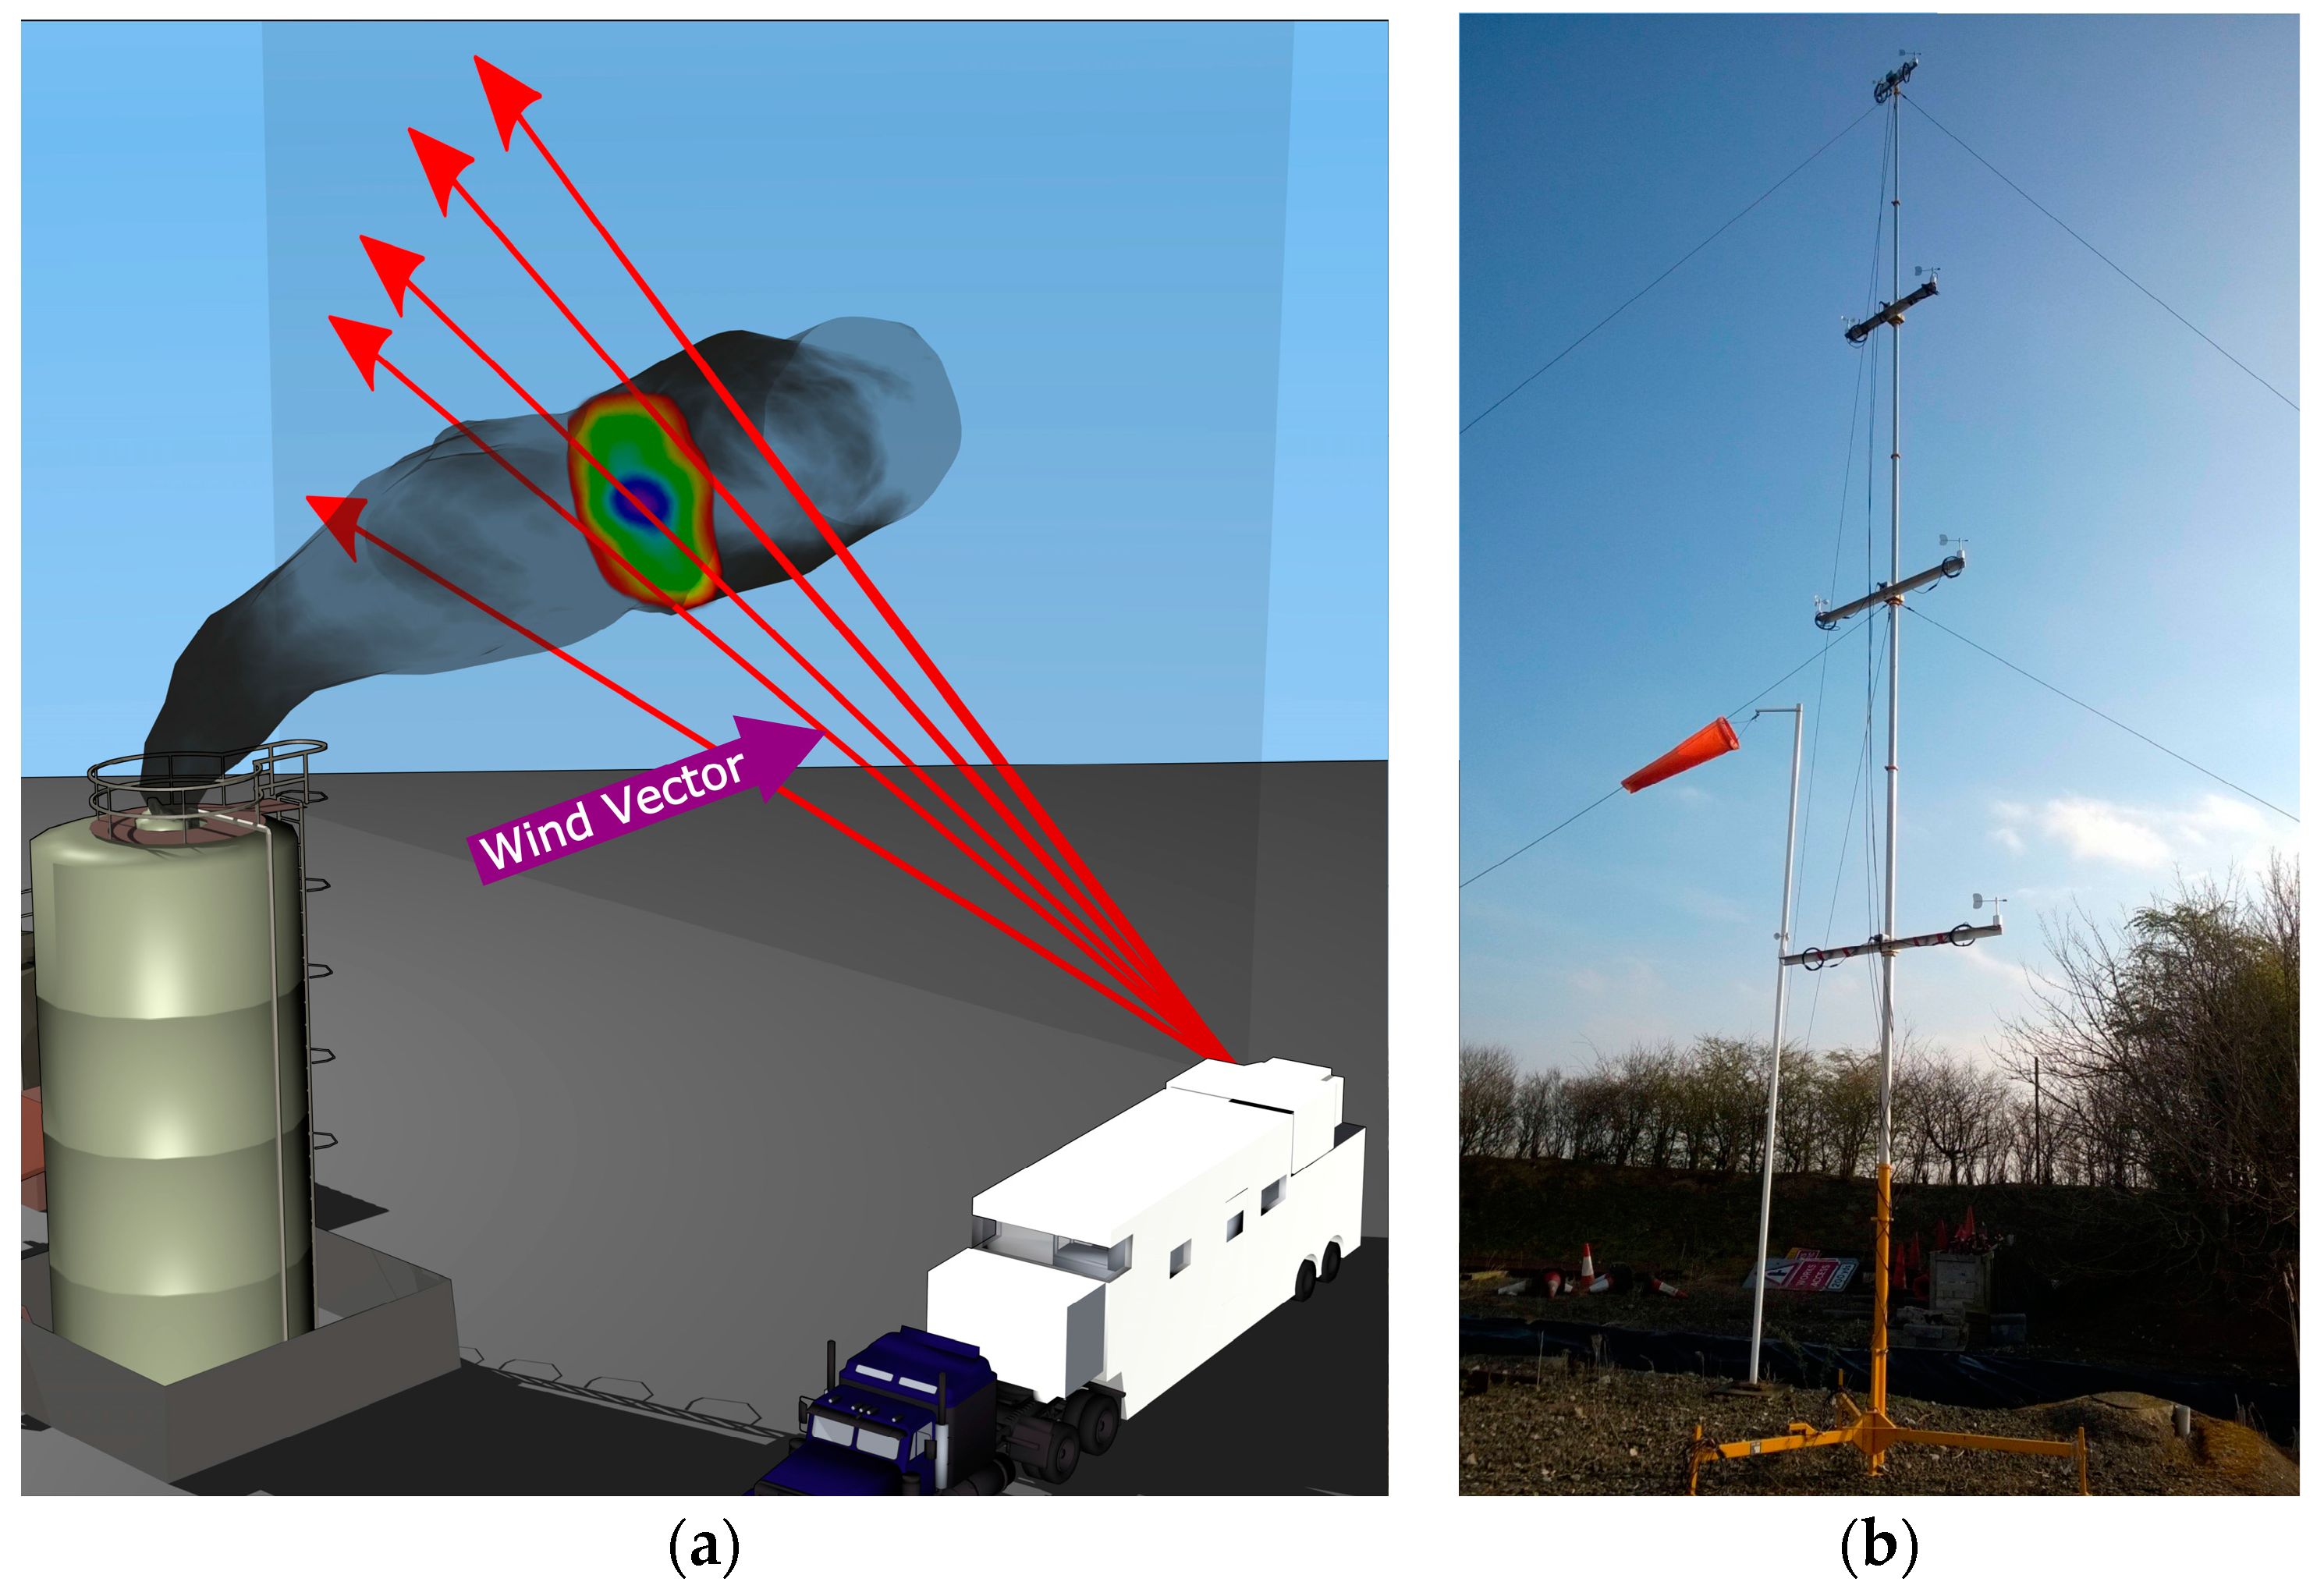
Figure 4.
Vertical DIAL scan showing methane emission plume from an active area.
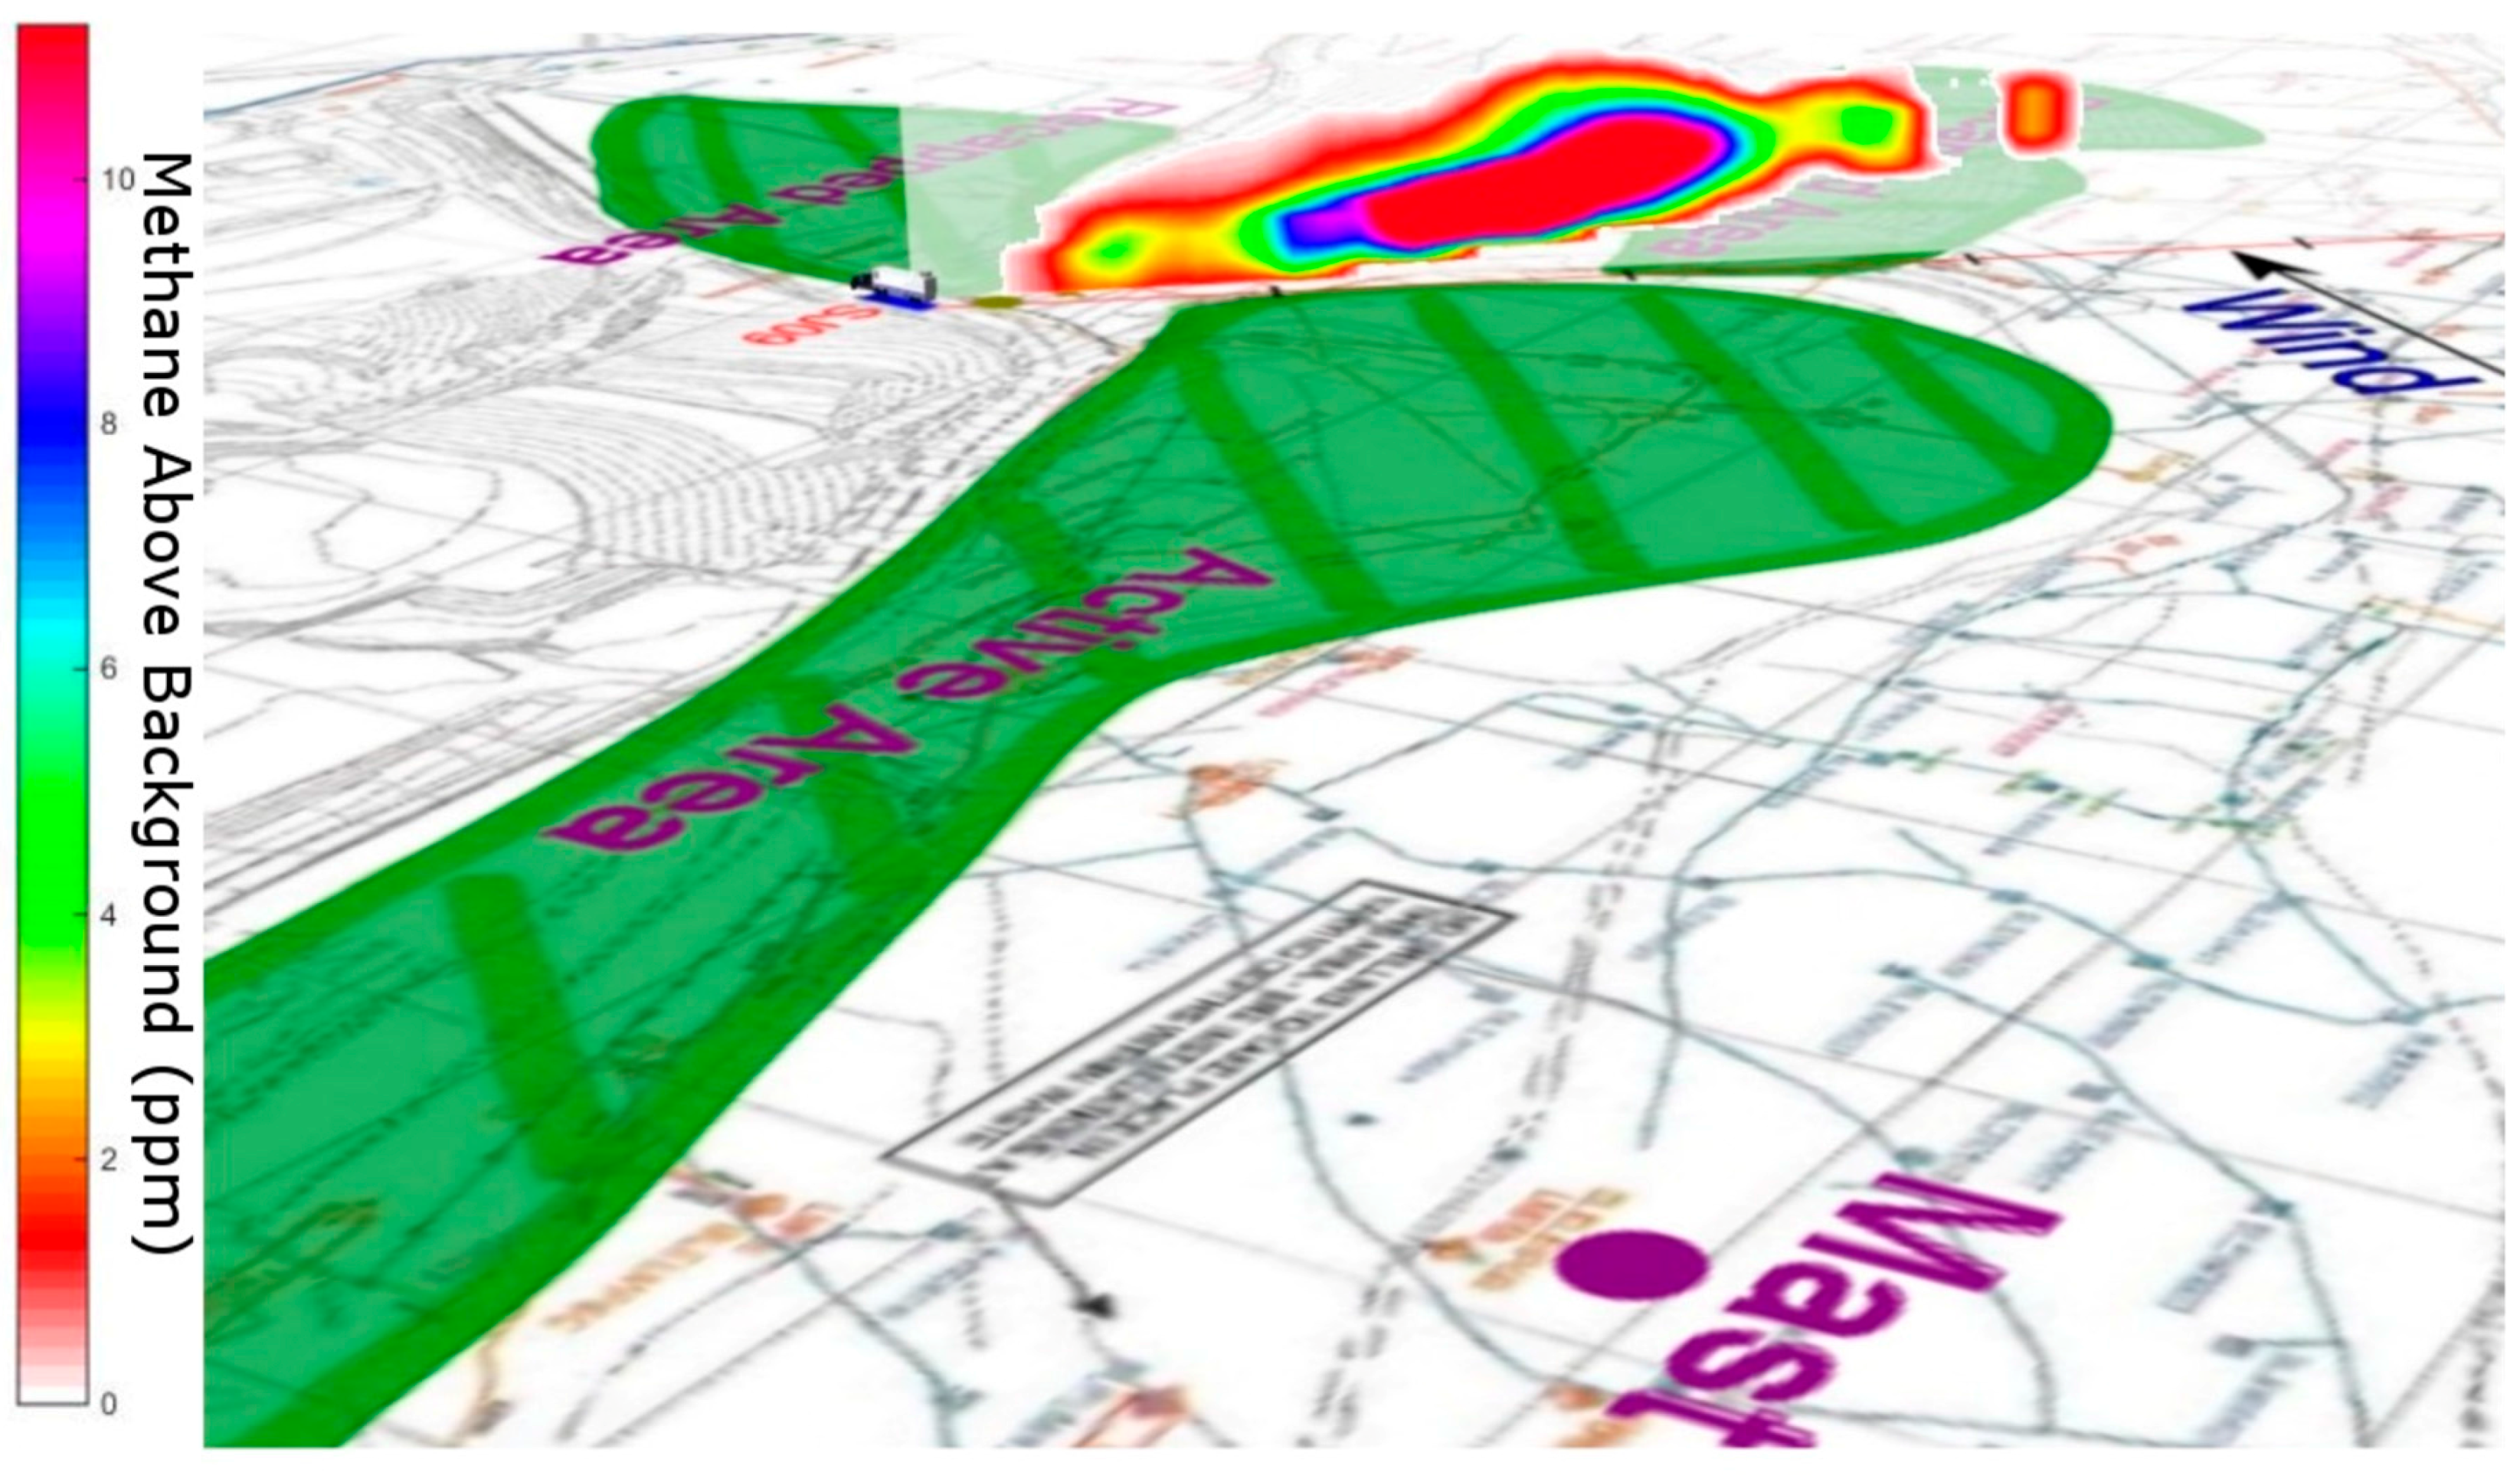
Figure 5.
Vertical DIAL scan showing methane emission plume from a capped area.
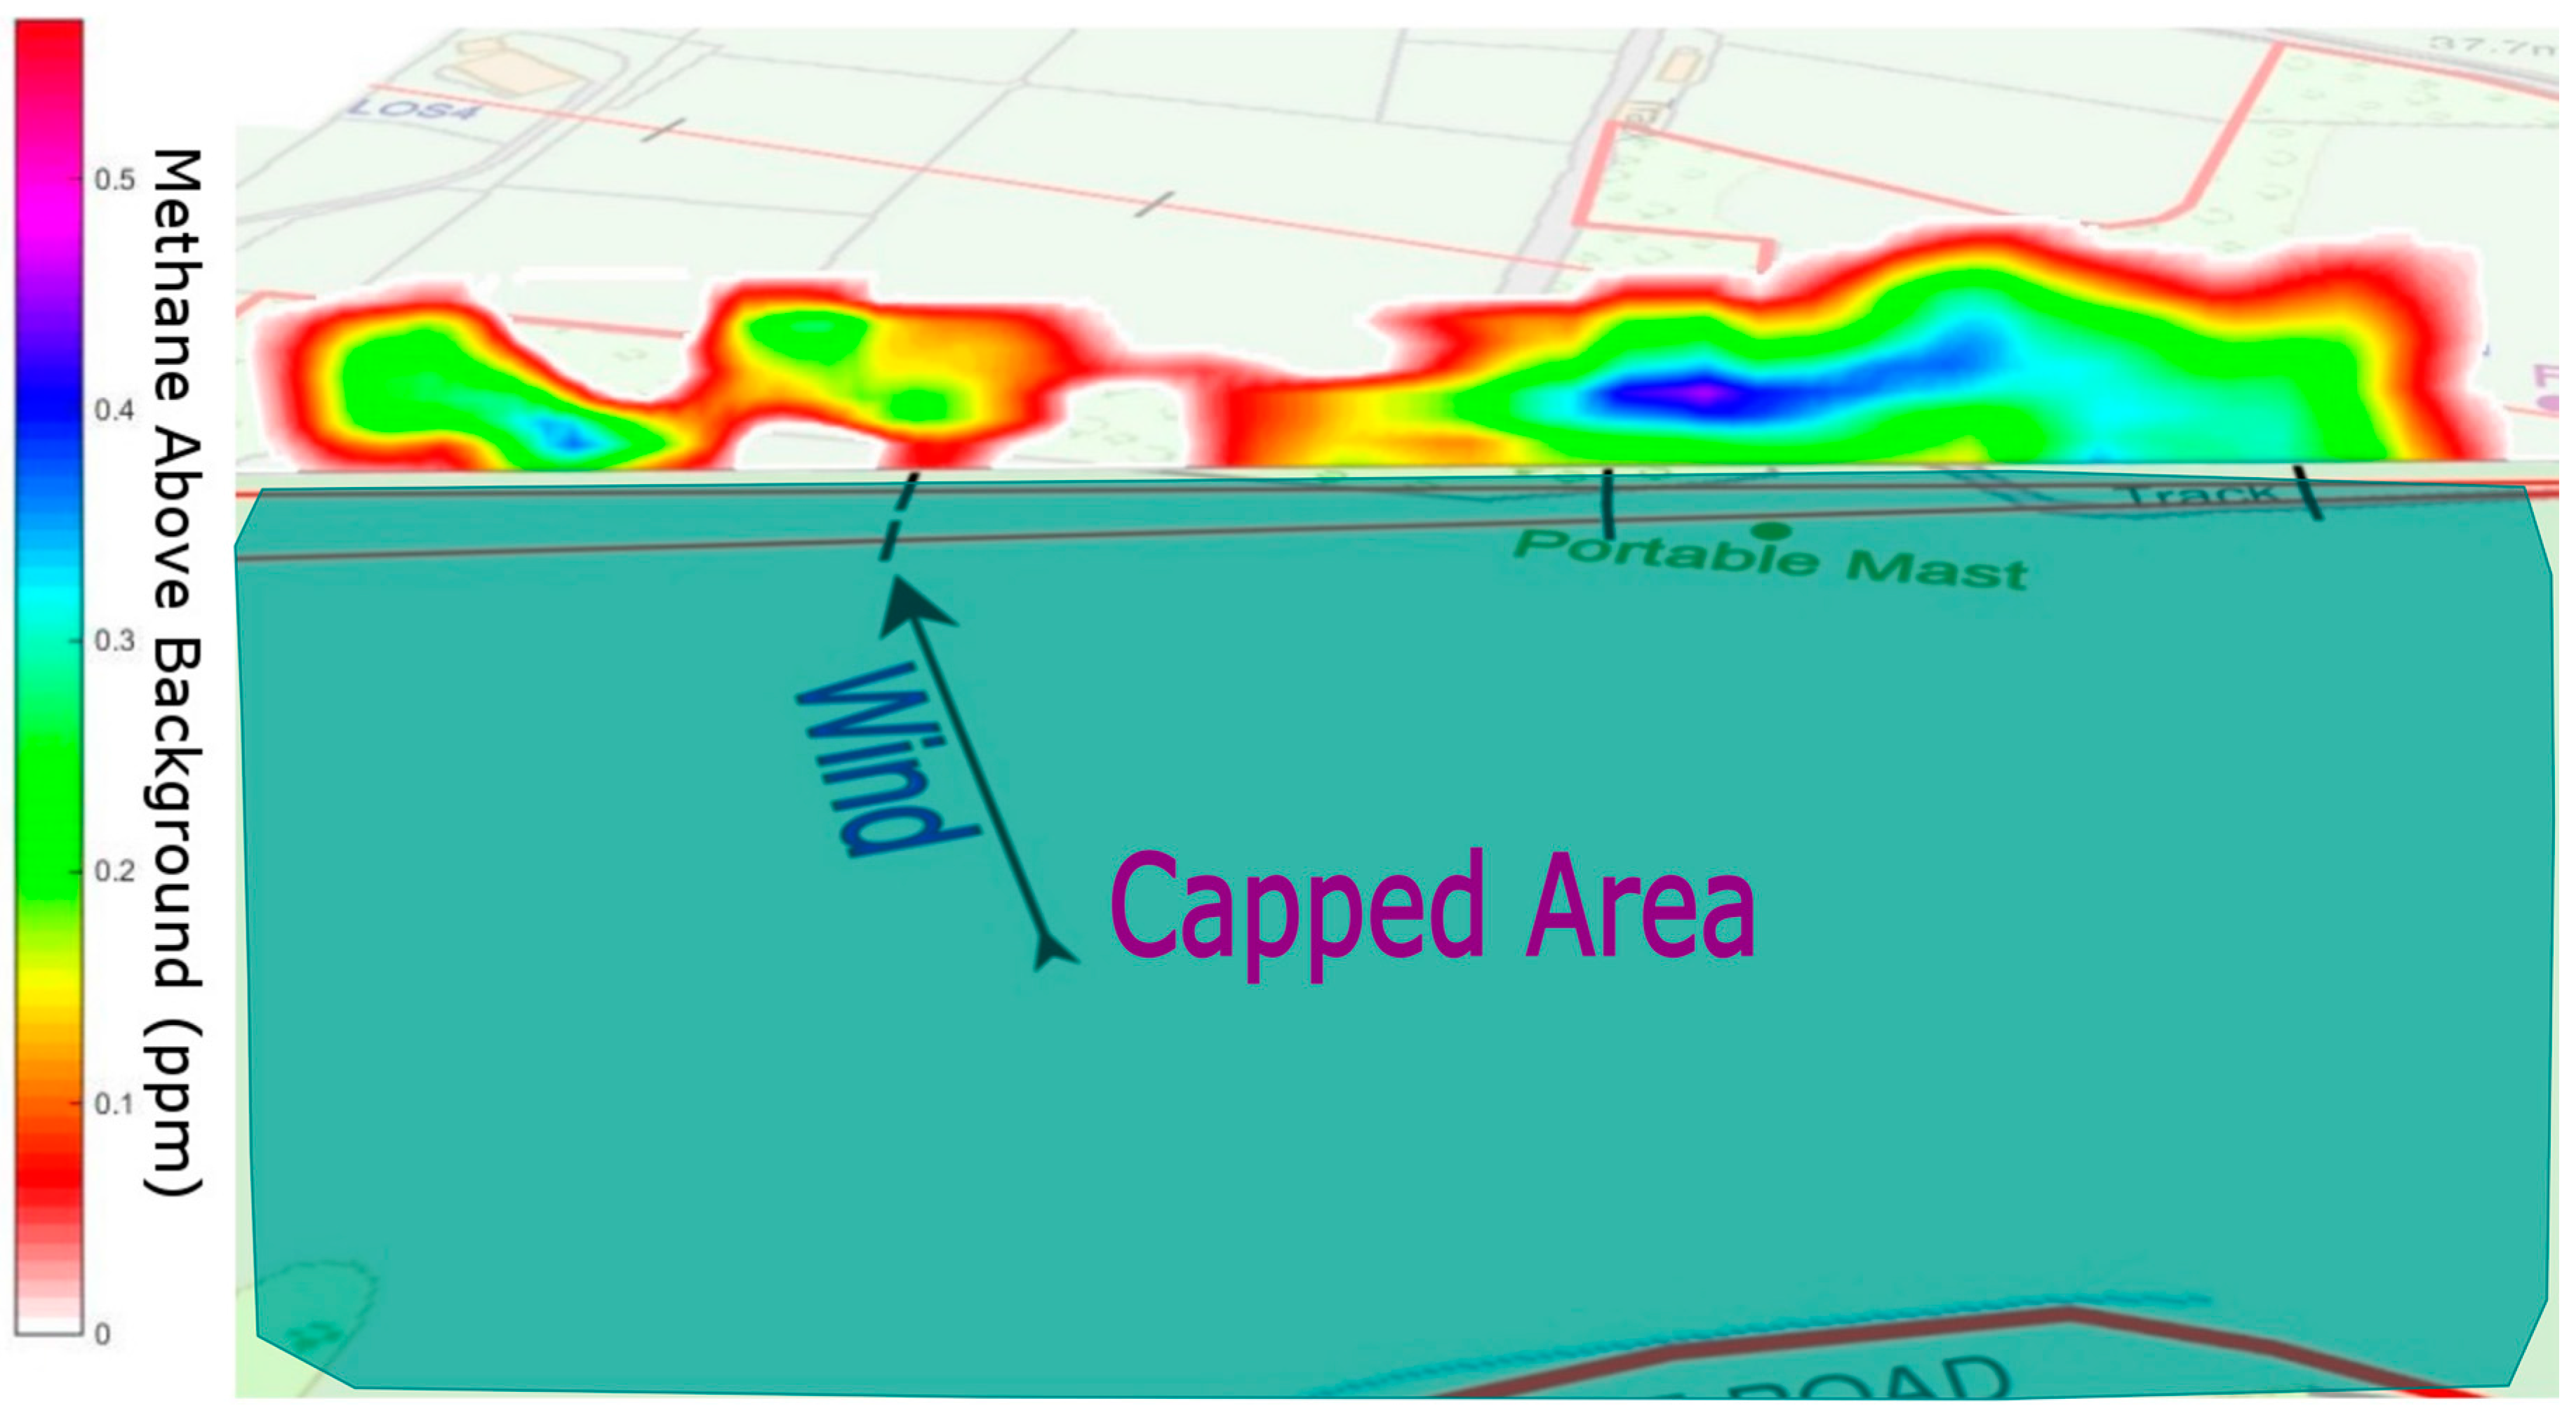
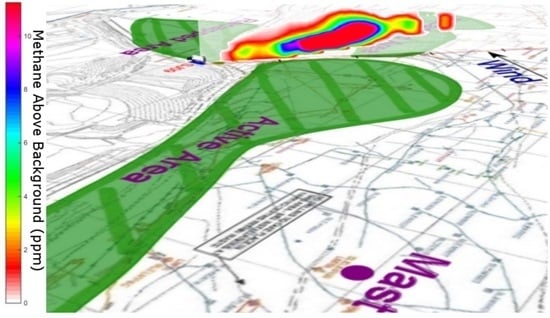
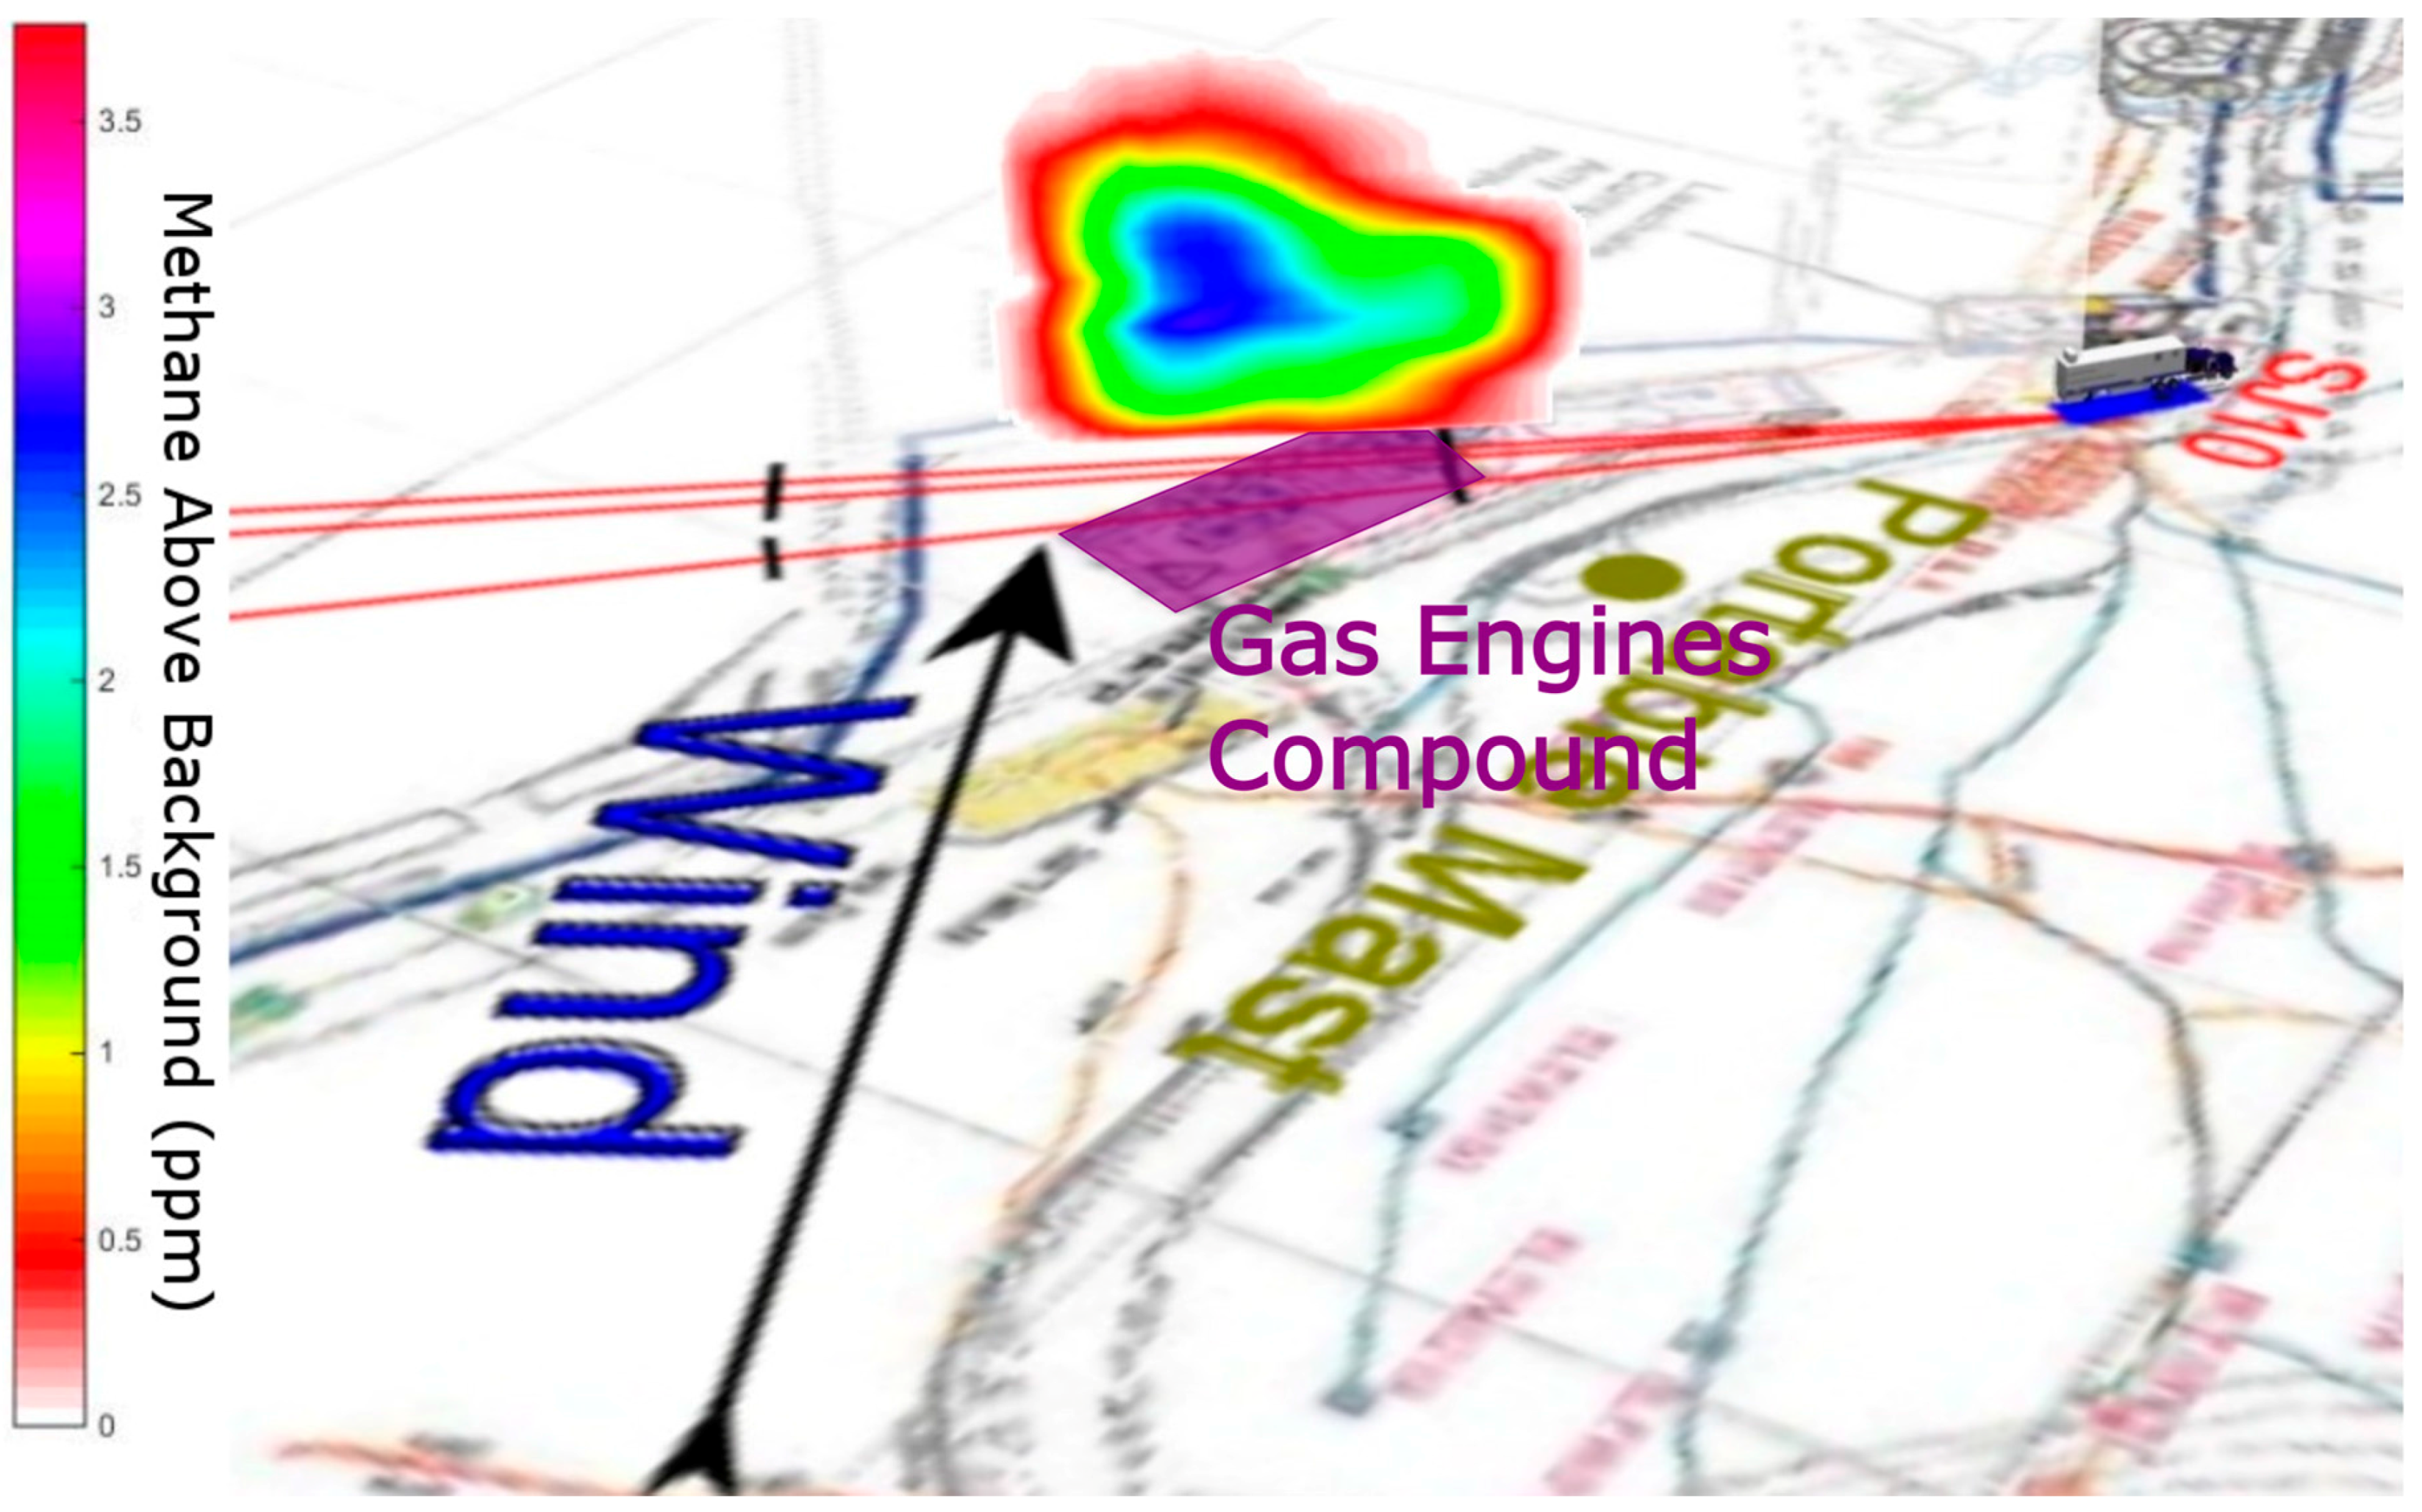
Figure 6.
Vertical DIAL scan showing methane emission plume from gas engine stacks.

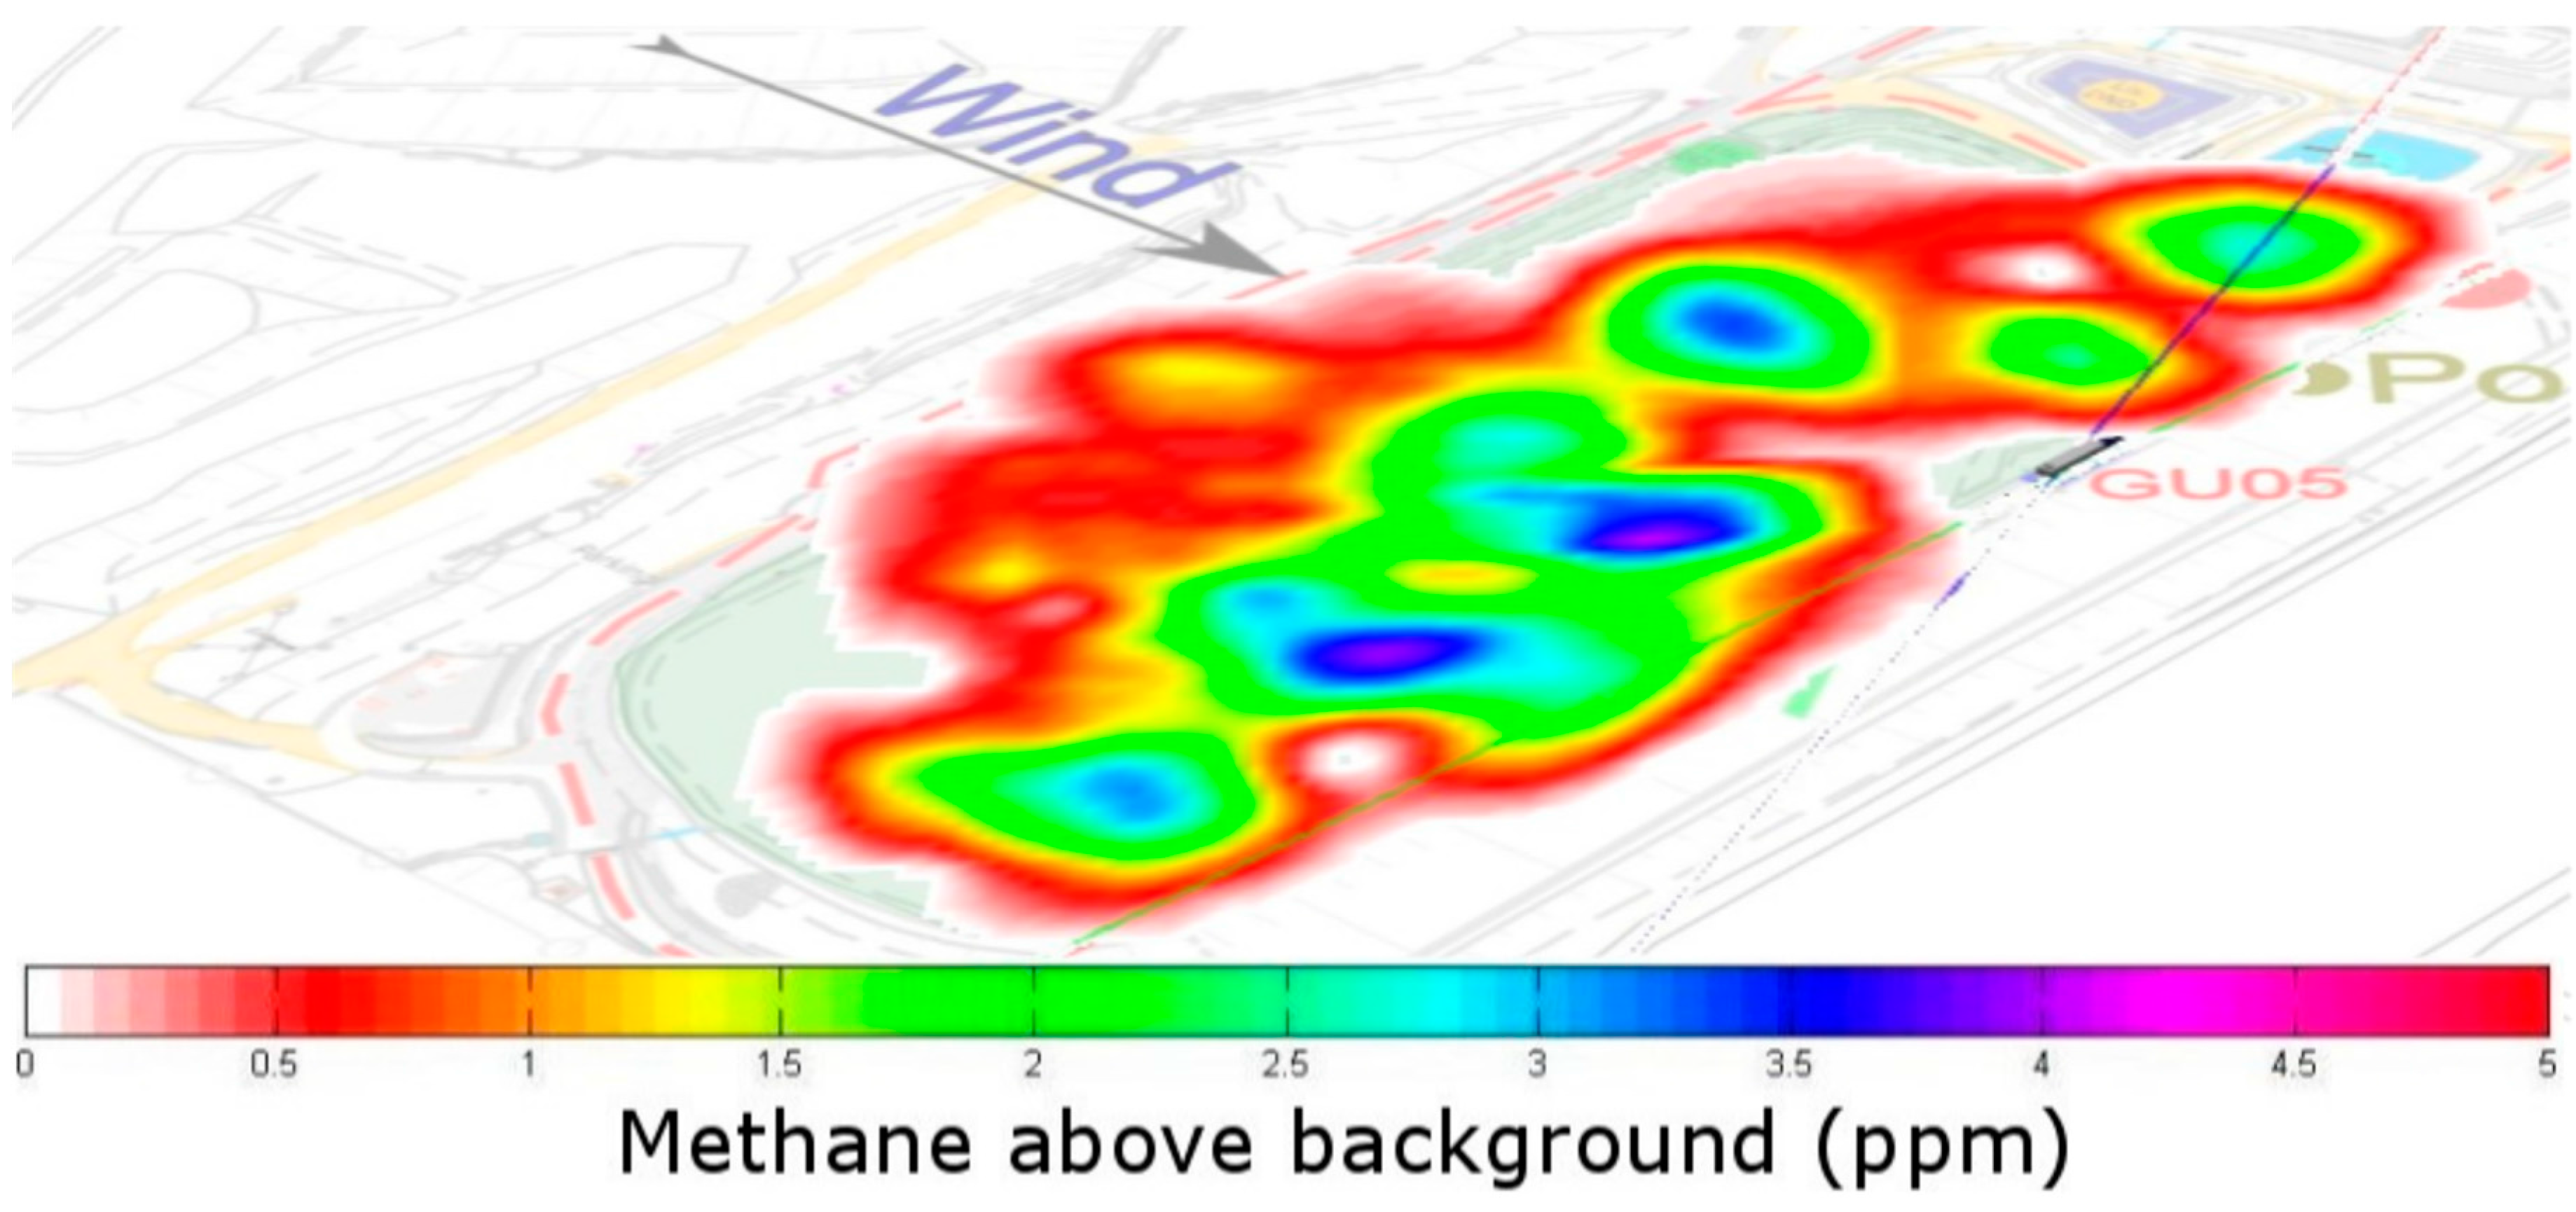
Figure 7.
Horizontal DIAL scan showing the emitted methane concentration distribution over a landfill capped area.
Figure 7.
Horizontal DIAL scan showing the emitted methane concentration distribution over a landfill capped area.

© 2017 by the authors. Licensee MDPI, Basel, Switzerland. This article is an open access article distributed under the terms and conditions of the Creative Commons Attribution (CC BY) license (http://creativecommons.org/licenses/by/4.0/).
Share and Cite
MDPI and ACS Style
Innocenti, F.; Robinson, R.; Gardiner, T.; Finlayson, A.; Connor, A. Differential Absorption Lidar (DIAL) Measurements of Landfill Methane Emissions. Remote Sens. 2017, 9, 953. https://doi.org/10.3390/rs9090953
AMA Style
Innocenti F, Robinson R, Gardiner T, Finlayson A, Connor A. Differential Absorption Lidar (DIAL) Measurements of Landfill Methane Emissions. Remote Sensing. 2017; 9(9):953. https://doi.org/10.3390/rs9090953
Chicago/Turabian StyleInnocenti, Fabrizio, Rod Robinson, Tom Gardiner, Andrew Finlayson, and Andy Connor. 2017. "Differential Absorption Lidar (DIAL) Measurements of Landfill Methane Emissions" Remote Sensing 9, no. 9: 953. https://doi.org/10.3390/rs9090953
Note that from the first issue of 2016, this journal uses article numbers instead of page numbers. See further details here.