High Resolution Multispectral and Thermal Remote Sensing-Based Water Stress Assessment in Subsurface Irrigated Grapevines

1
Department of Biological System Engineering, Washington State University, Pullman, WA 99164-6120, USA
2
Center for Precision and Automated Agricultural Systems, Washington State University, Prosser, WA 99350-8694, USA
3
Department of Crop and Soil Science, Washington State University, Pullman, WA 99164-6420, USA
*
Author to whom correspondence should be addressed.
Remote Sens. 2017, 9(9), 961; https://doi.org/10.3390/rs9090961
Submission received: 8 June 2017
/
Revised: 17 August 2017
/
Accepted: 5 September 2017
/
Published: 16 September 2017
(This article belongs to the Section Remote Sensing in Agriculture and Vegetation)
Abstract
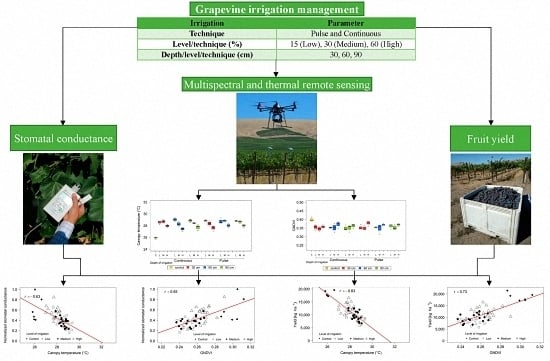
:Precision irrigation management is based on the accuracy and feasibility of sensor data assessing the plant water status. Multispectral and thermal infrared images acquired from an unmanned aerial vehicle (UAV) were analyzed to evaluate the applicability of the data in the assessment of variants of subsurface irrigation configurations. The study was carried out in a Cabernet Sauvignon orchard located near Benton City, Washington. Plants were subsurface irrigated at a 30, 60, and 90 cm depth, with 15%, 30%, and 60% irrigation of the standard irrigation level as determined by the grower in commercial production management. Half of the plots were irrigated using pulse irrigation and the other half using continuous irrigation techniques. The treatments were compared to the control plots that received standard surface irrigation at a continuous rate. The results showed differences in fruit yield when the control was compared to deficit irrigated treatments (15%, 30%, 60% of standard irrigation), while no differences were found for comparisons of the techniques (pulse, continuous) or depths of irrigation (30, 60, 90 cm). Leaf stomatal conductance of control and 60% irrigation treatments were statistically different compared to treatments receiving 30% and 15% irrigation. The normalized difference vegetation index (NDVI), green normalized difference vegetation index (GNDVI), and canopy temperature were correlated to fruit yield and leaf stomatal conductance. Significant correlations (p < 0.01) were observed between NDVI, GNDVI, and canopy temperature with fruit yield (Pearson’s correlation coefficient, r = 0.68, 0.73, and −0.83, respectively), and with leaf stomatal conductance (r = 0.56, 0.65, and −0.63, respectively) at 44 days before harvest. This study demonstrates the potential of using low-altitude multispectral and thermal imagery data in the assessment of irrigation techniques and relative degree of plant water stress. In addition, results provide a feasibility analysis of our hypothesis that thermal infrared images can be used as a rapid tool to estimate leaf stomatal conductance, indicative of the spatial variation in the vineyard. This is critically important, as such data will provide a near real-time crop stress assessment for better irrigation management/scheduling in wine grape production.
1. Introduction
Water management is an important aspect in the wine industry. Grapevine water status can affect berry parameters critical to production of premium quality red wines such as the phenolic composition [1]. In the grape wine industry, deficit irrigation is often used to stress vines in order to produce high quality berries. However, this plant stress should be regulated to preserve grape quality and production. Emerging precision agriculture techniques can be utilized for both, in order to maintain a crop need-based irrigation schedule while avoiding the adverse effects of typical irrigation management.
Precision agriculture techniques rely on temporal and spatial crop responses in order to develop production management practices [2]. The application of crop and environmental sensing techniques is often utilized to achieve this goal. Remote sensing techniques can be applied to measure visible-near infrared spectral changes associated with plant physiological conditions. Such plant changes can be attributed to biotic or abiotic stress. In agriculture, the remote and proximal sensing systems have been used for multiple purposes such as crop disease detection [3], crop water status estimations [4], crop nutrient content determination [5], or weed identification [6]. Such information can be applied to develop crop and site-specific management decisions.
Baluja et al. [4] used a multispectral sensor integrated with an unmanned aerial vehicle (UAV) to assess the spatial variability of water status in Tempranillo vineyards. The results showed the normalized difference vegetation index (NDVI), and the ratio between the transformed chlorophyll absorption in reflectance (TCARI) and the optimized soil-adjusted vegetation index (OSAVI) as indices highly correlated to stomatal conductance (gs, R2 = 0.84, p < 0.05) and stem water potential (Ψstem, R2 = 0.68, p < 0.05). A significant correlation was also found between thermal images and the aforementioned physiological parameters (R2 = 0.68, p < 0.01 for gs and R2 = 0.50, p < 0.05 for Ψstem). Meanwhile, thermal data was identified as a good short-term indicator of water stress; while, NDVI and TCARI/OSAVI were identified as good long-term water stress indicators [4]. Rodríguez et al. [7] measured reflectance using a spectrometer to determine the water status of a Pinot noir vineyard. The results showed that water stressed plants were more easily detected at 970 nm. Most of the vegetation indices (VIs) tested showed correlations with plant water stress levels. The study proposed the use of the water index (WI) to assess the plant hydric condition in a vineyard. Similarly, canopy temperature information has been used in vineyards to characterize grapevine water status. In this regard, several authors have calculated the crop water stress index (CWSI) [4,8,9]. The index normalizes the canopy temperature data based on the atmospheric conditions [10]. Bellvert et al. [8] assessed the spatial variability in water stress Pinot Noir grape vines using CWSI. This index was highly correlated to leaf water potential (ΨL) where leaf-level temperature data was acquired using an infrared thermometer (R2 = 0.83, p < 0.0001) and a thermal infrared sensor integrated with a small UAV (R2 = 0.71, p < 0.0001). Similarly, Mӧller et al. [9] investigated the use of a thermal infrared sensor to monitor the effects of water deficit in grape vines. The obtained results showed a high correlation between CWSI and gs (R2 = 0.91, p < 0.0001).
The use of optical sensors mounted on UAVs allows data collection with high temporal and spatial resolution to evaluate the crop water status. In this sense, different studies have been carried out in grapevines for water status characterization [4,8,9]. Nevertheless, the local conditions, vine cultivar, irrigation technique, and management practices can greatly influence the applicability of sensing systems for water status evaluations. Therefore, in this study, a UAV integrated sensing system was tested to assess the grapevine responses under different subsurface irrigation regimes and sensing (multispectral and thermal infrared sensors) data was compared with crop responses (stomatal conductance and fruit yield).
2. Materials and Methods
2.1. Site Location and Experimental Design
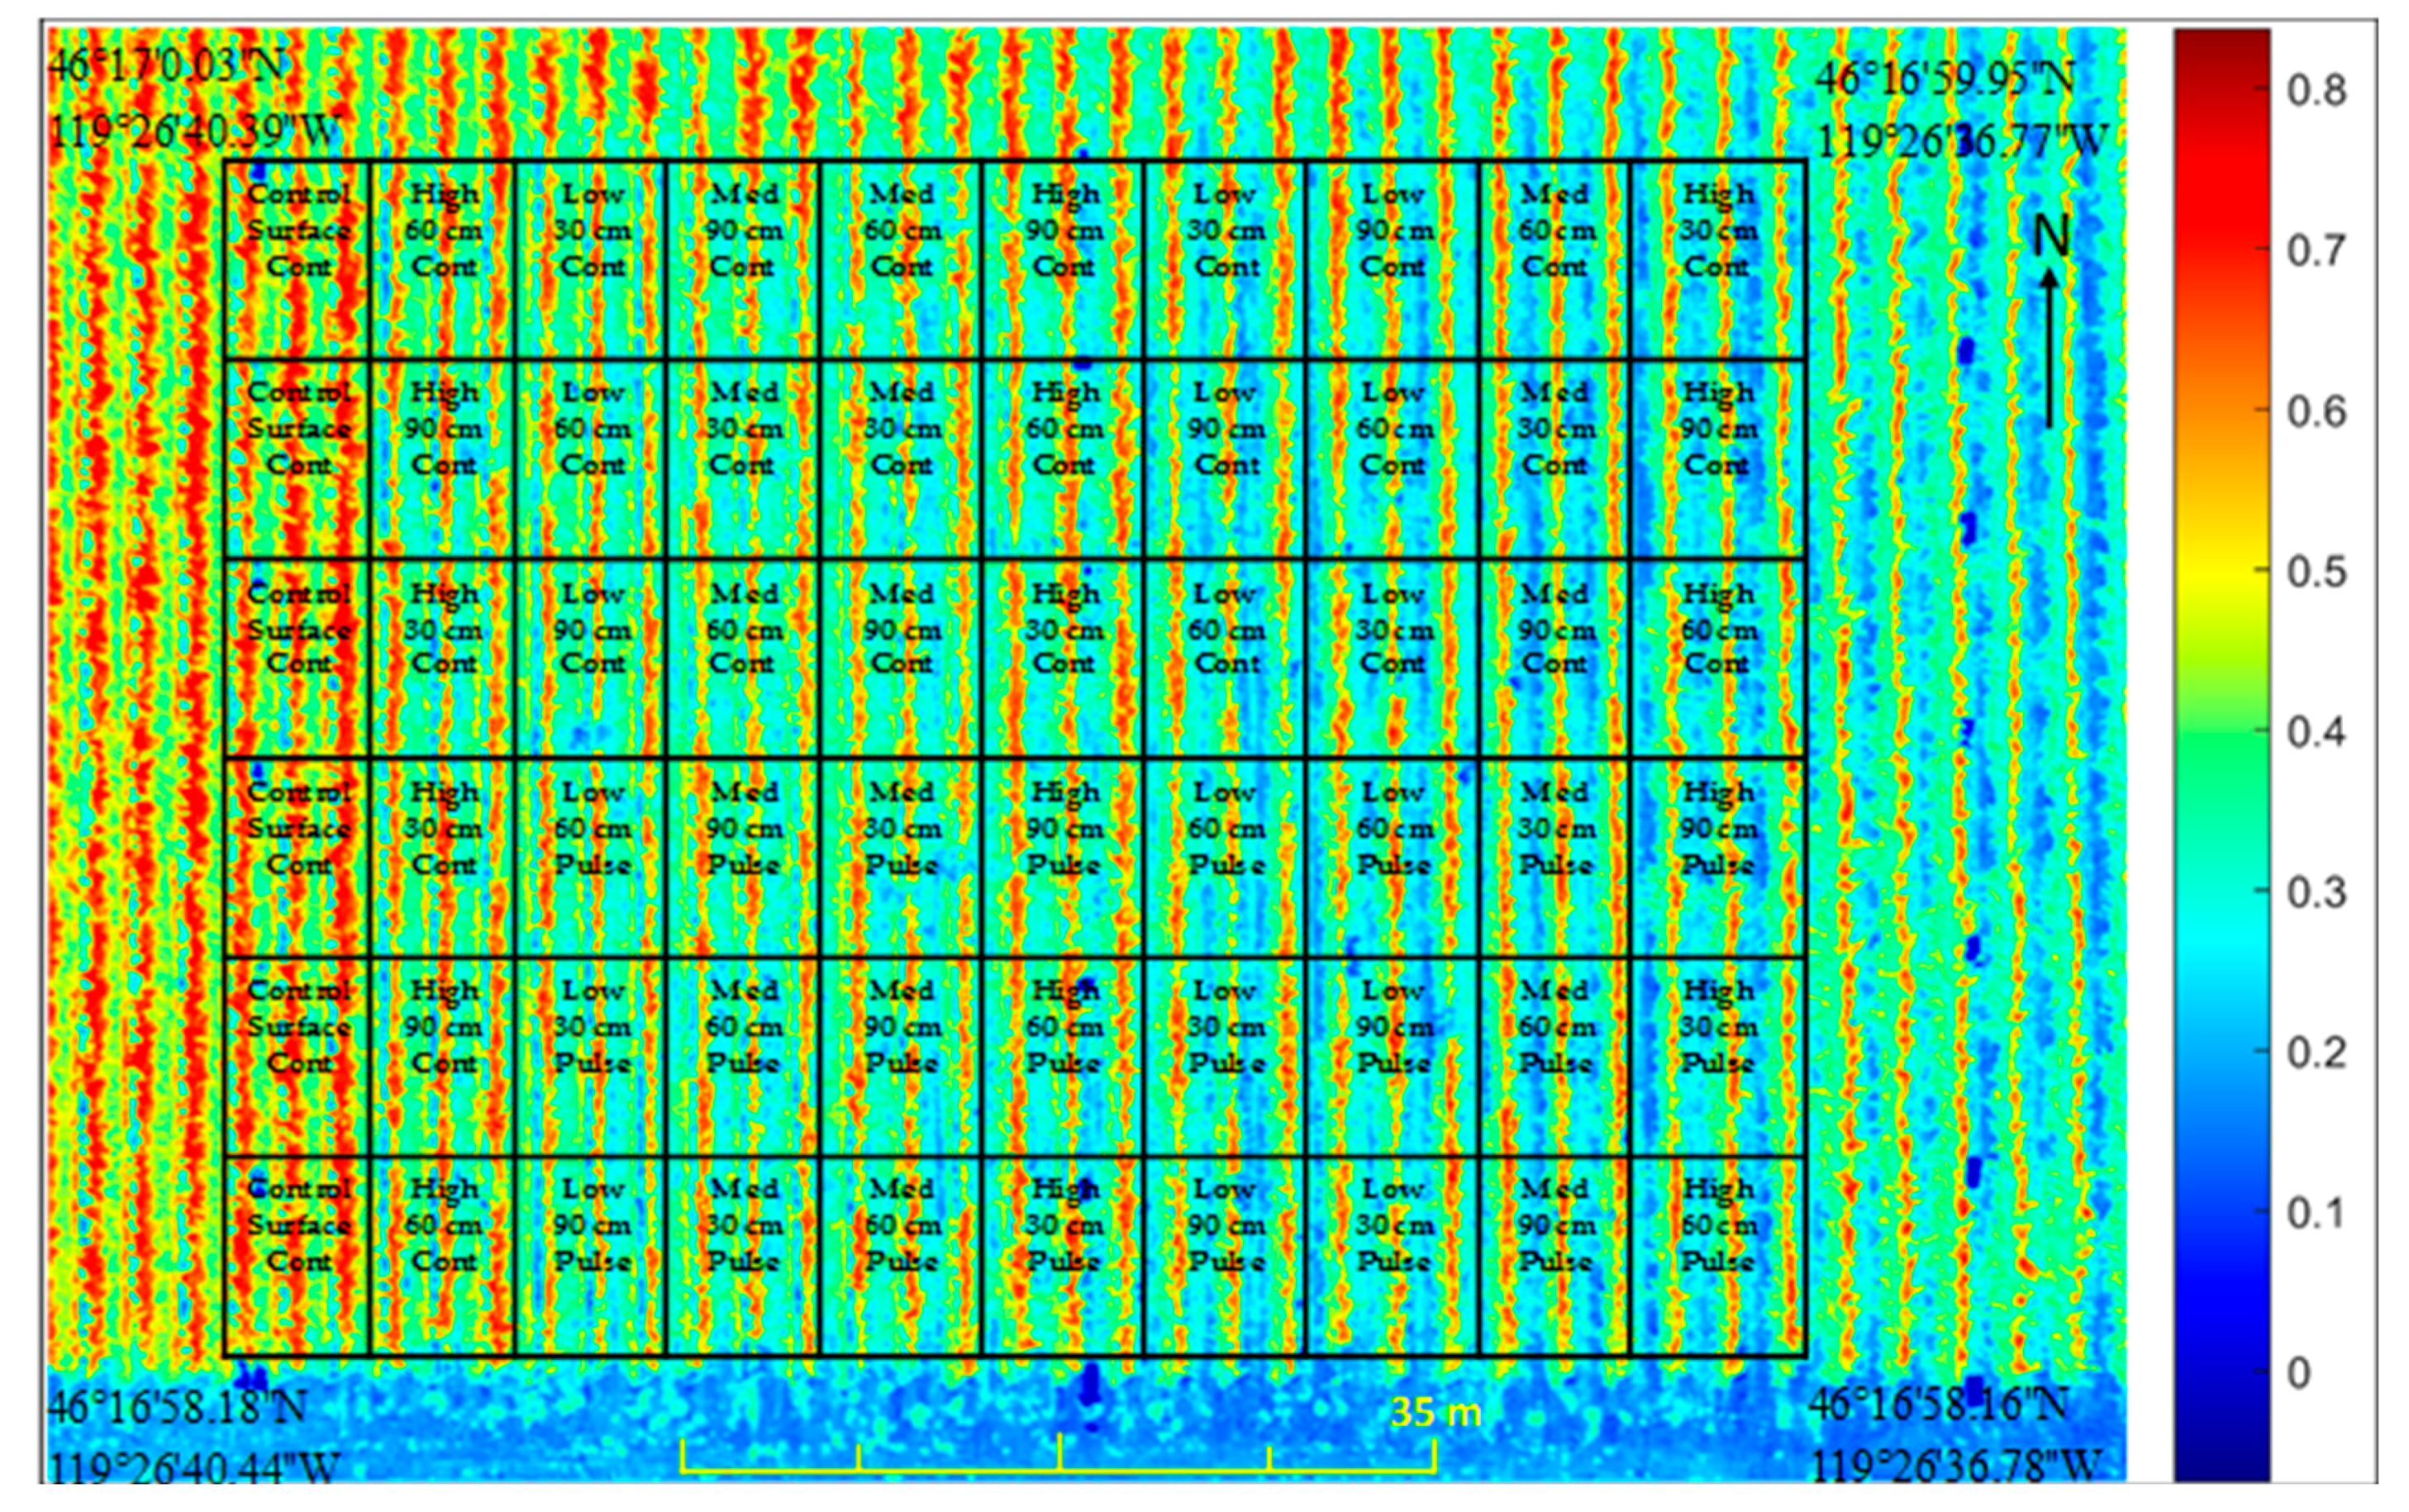
The study was conducted during the 2016 growing season in the commercial Kiona vineyards of Red Mountain in Benton City, Washington (46°16′59.1″N, 119°26′31.9″W). The experimental site area was 0.44 ha of Cabernet Sauvignon (Vitis vinifera L.) grown on a Hazel loamy fine sand soil. The average temperature in the growing season (April to September, 2016) and the annual rainfall in the region was 20 °C and 202 mm, respectively. Irrigation water was obtained from a reservoir connected to a well. The annual reference evapotranspiration was 1346 mm [11]. Vines were trained in double cordon. Spacing of the vines was 1.8 m within the row and 2.4 m between the rows (Figure 1).
The experimental design considered was a split-split-plot (Figure 1). The main plot was the irrigation technique, which included continuous and pulse irrigation. In each irrigation technique, the plants received an equal amount of water within a certain time-period with the difference in the delivery mechanism. In the pulse irrigation technique, water was intermittently delivered every two hours. Each irrigation technique was subdivided by irrigation level, which differed in the amount of water with respect to the standard irrigation rate in the commercial vineyard. The irrigation rate was determined by the grower through a visual inspection of the plants, neutron probe readings, and a soil evaluation. Treatments were labeled based on the percentage of water applied. Consequently, the treatments were 100% (control, standard irrigation rate), 60% (high), 30% (medium), and 15% (low) irrigation rates with respect to control.
Each subplot was split between irrigation depth, in which water was delivered at 30, 60, and 90 cm (Table 1). Each split plot was triplicated with 60 plots in total. Each split-split-plot had three rows and five plants per row. Flowmeters measured the amount of water applied in each treatment throughout the season. The reference evapotranspiration (ETr) from budburst until harvest for the field site was 839 mm [11] and the total water applied during this time period was 416 mm in the control treatement plots. Therefore, an average seasonal crop coefficient of 0.5 was used by the grower in deciding irrigation rates. A similar average crop coefficient has been used by Keller et al. [12] and Shellie et al. [13]. For measurement purposes, the central three vines from the central treatment row were considered as representative treatment vines (Figure 1 and Table 1).
2.2. Data Acquisition and Processing
An unmanned aerial vehicle was used to collect high resolution multispectral and thermal images of the field site. The UAV (ARF OktoXL 6S12, HiSystems GmbH, Moormerland, Germany) is a remote controlled and unmanned small-size octocopter with a total payload of up to 4 kg and flight time of up to 36 min. The UAV system was powered with a 6500 mAh Lithium-ion polymer battery pack. A radio transmitter (MX20 Hott, Graupner, Stuttgart, Germany) with a range of up to 4 km was used to remotely control the UAV. A thermal infrared camera (Tau 2 640, FLIR® Systems, Wilsonville, OR, USA) and a modified multispectral digital camera (NiteCanon ELPH110, LDP LLC, Carlstadt, NJ, USA) with red (R), green (G), and near infrared (NIR, 800–900 nm) bands were used for aerial imaging. The sensors were mounted onto a gimbal underneath the UAV that is capable of automatically adjusting the pitch and roll shifts to the pre-set level during the flight. Sensor firmware was enabled to acquire geo-referenced interval imaging every 5 s. In case of the thermal infrared sensor, 8-bit JPG images with 32,000 pixels (640 × 512) per image were acquired. The captured multispectral images were of 16.1 megapixels (4608 × 3456) resolution. The spatial resolution was 9.0 and 2.6 cm/pixel for the thermal infrared and multispectral images collected in this study, respectively. A reference panel (CSTM-SRT-99-100, Spectralon Reflectance Target, Spectra Vista Cooperation, New York, NY, USA) was used for radiometric calibration. Images were stored on an on-board the secure digital card. Multispectral and thermal infrared images were acquired at 80 and 44 days before harvest (DBH), representing two critical growth stages in grapevine production, i.e. bunch closure and seven-days post-veraison (onset of ripening). In addition, data was acquired at 100 DBH that confirmed the absence of treatment effects at the start of the season.
2.3. Response Variables
Stomatal conductance was measured using a leaf porometer (SC-1, Decagon devices, Pullman, WA, USA). Mature and sun exposed leaves were selected for data collection from reference vines in each plot at both 80 and 44 DBH. All measurements were collected between 10 a.m. to 2 p.m., a period known for stable stomatal conductance in vines [8]. Moreover, fruits from each reference vine within a treatment plot were harvested and weighed at commercial maturity. This data was used as a production variable.
2.4. Image Processing and Statistical Analysis
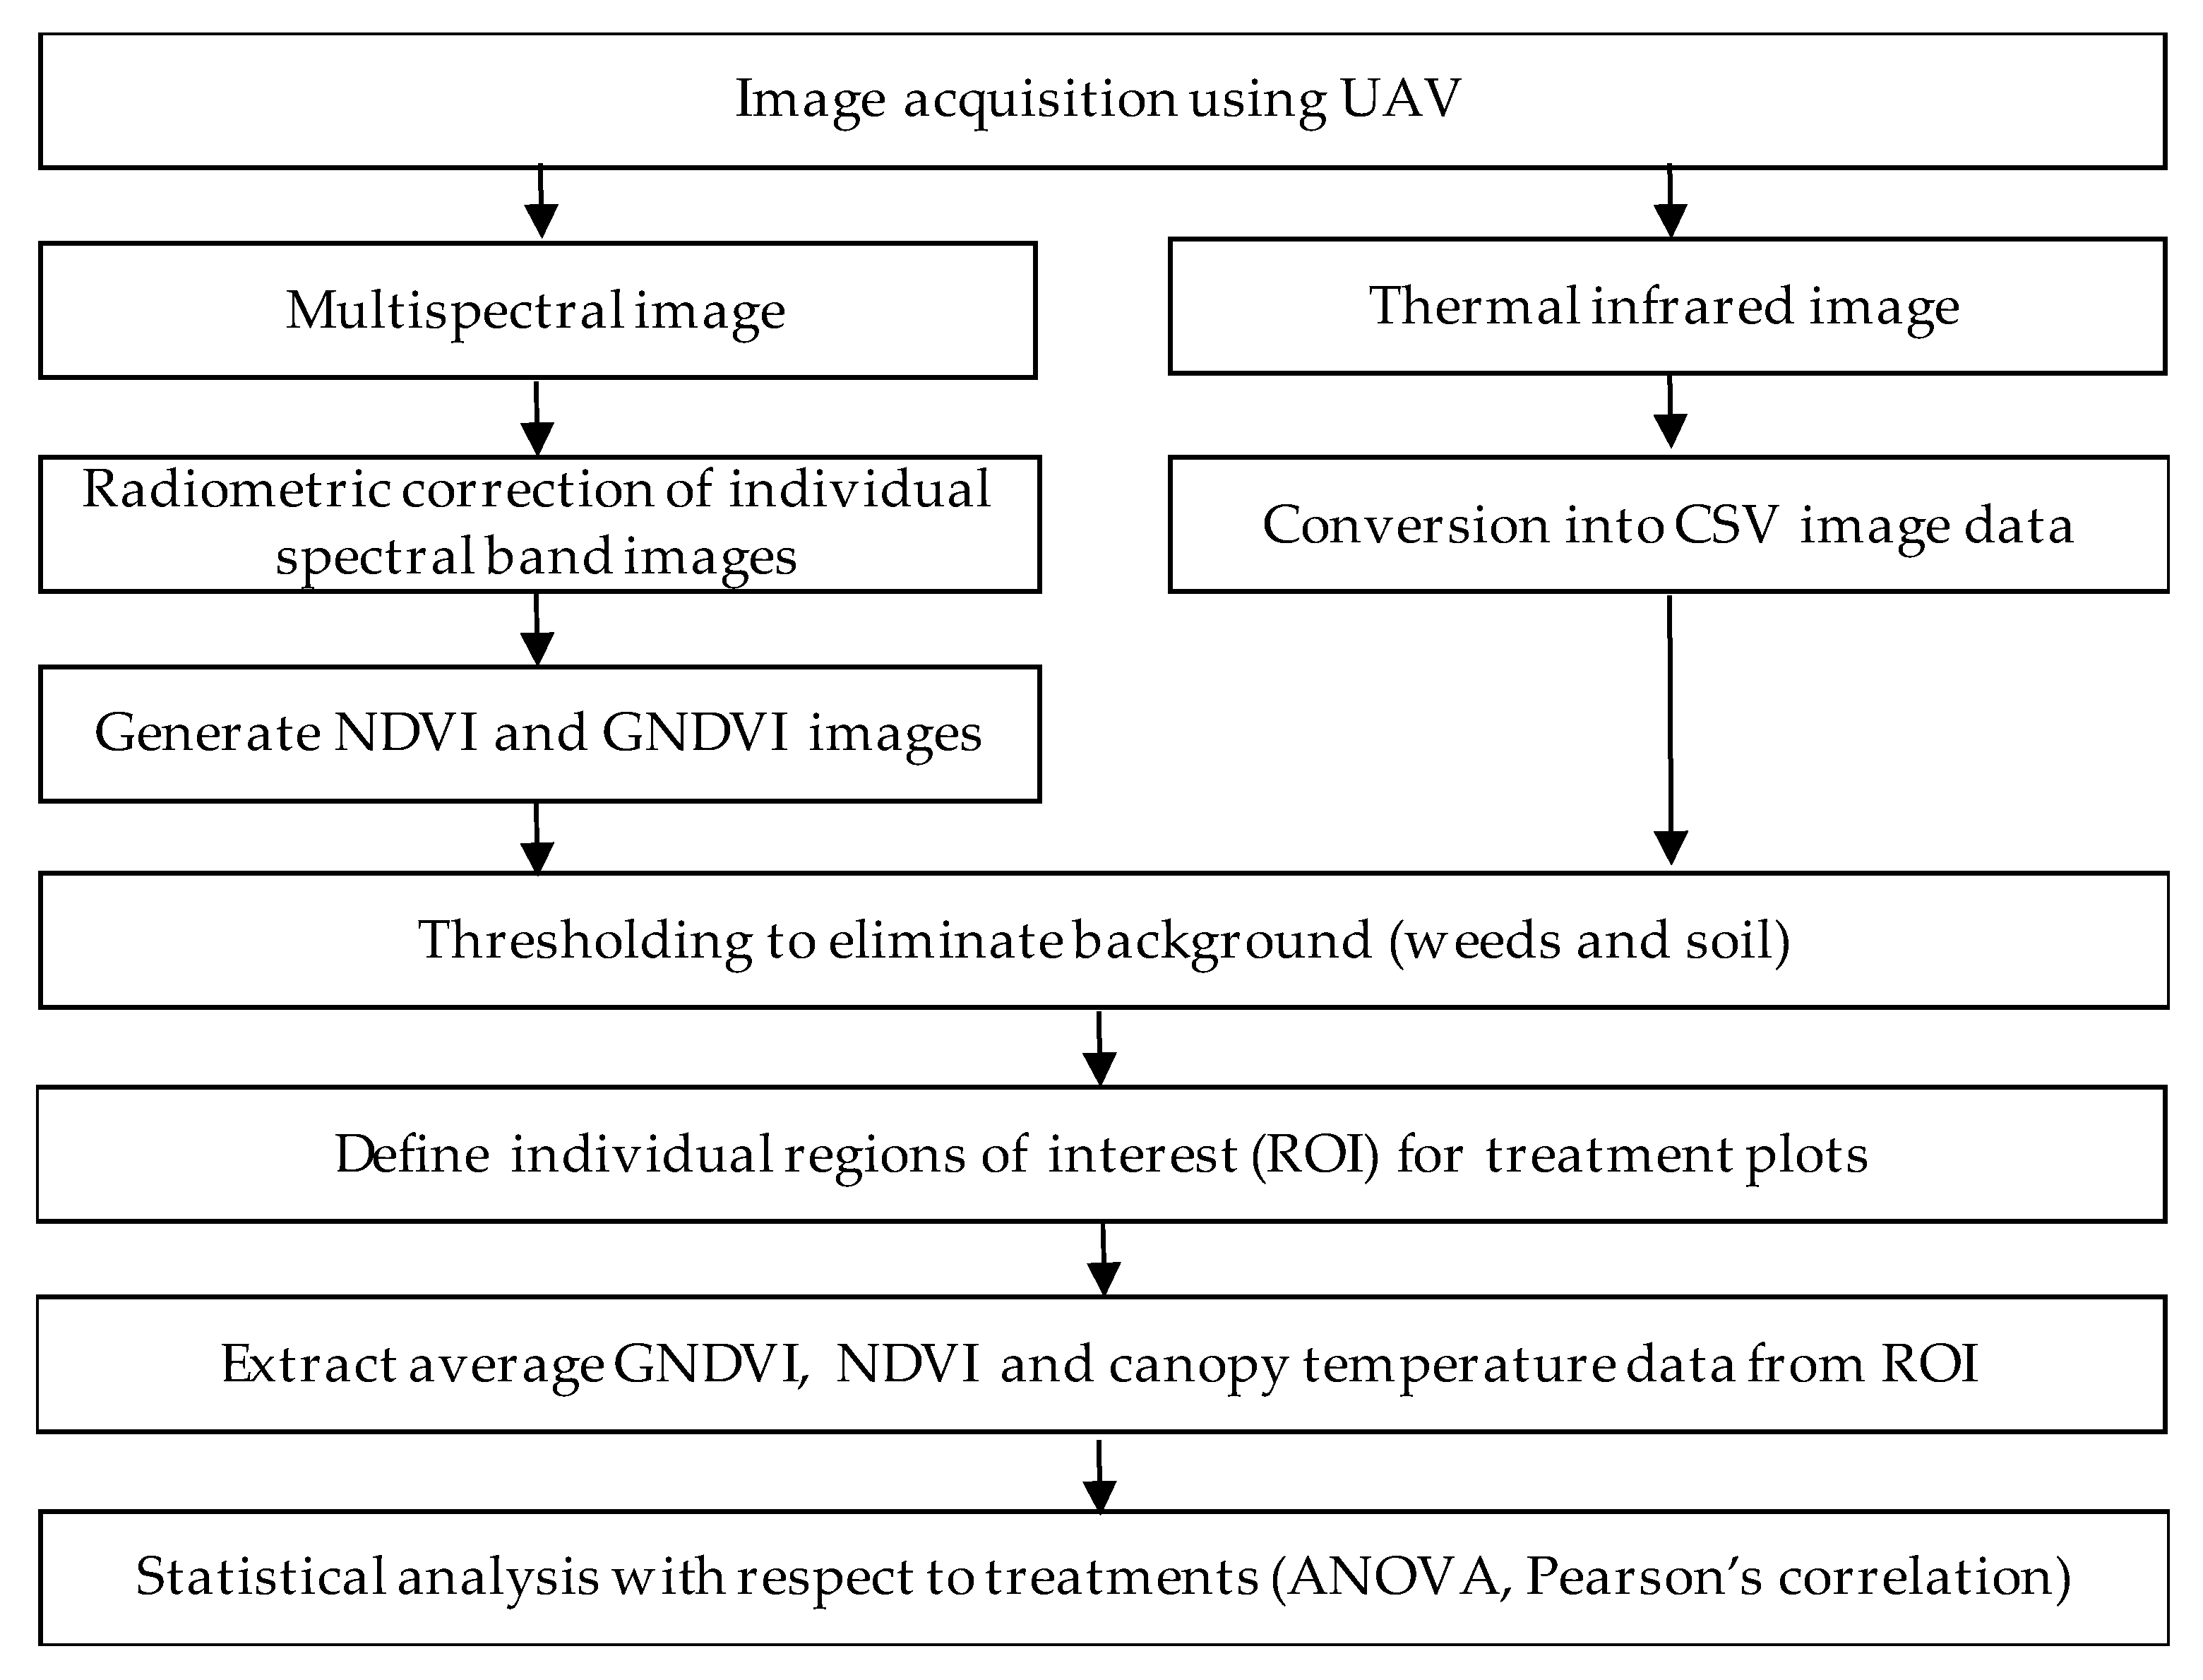
Multispectral and thermal infrared images covering the entire treatment plots were selected for image processing and analysis (Figure 2). Each of the thermal infrared images was saved as a data file to retain the raw temperature of each pixel within the image. Distortion correction was performed in multispectral images using ImageJ® software [14]. Thermal and multispectral images were individually analyzed using algorithms developed in Matlab® using Image Processing Toolbox (version: R 2015b, Mathworks, Natick, MA, USA). Selected multispectral images were radiometrically calibrated with a white reflectance reference panel. Regions of interest (ROI) were extracted manually from images covering the treatment plot. The average temperature, normalized difference vegetation index (NDVI), and green normalized difference vegetation index (GNDVI) were extracted from selected ROI (Equations 1 and 2). In the case of the multispectral images, the indexes were determined from the calculated digital numbers in the image after radiometric calibration.
where:
- NDVI = Normalized Difference Vegetation Index
- NIR = Near Infrared band
- Red = Red band
- GNDVI = Green Normalized Difference Vegetation Index
- NIR = Near Infrared band
- Green = Green band
In the case of thermal images, temperature data over 38°C was removed as the background temperature to avoid soil interference in evaluating treatment effects. To remove weeds/soil in multispectral images, thresholding was performed on processed multispectral images. Stomatal conductance data was averaged for each treatment and normalized by dividing each reading by the maximum stomatal conductance of the measurement day (Equation 3).
where:
- Ngs = Normalized stomatal conductance
- gs = stomatal conductance from porometer (mmol/m2s)
- Max(gs) = Maximum stomatal conductance (mmol/m2s)
The average NDVI, GNDVI, temperature, and stomatal conductance data pertinent to each treatment plot were used for descriptive data analysis using R Studio (version 0.99.451, R Studio Inc., Boston, MA, USA). Pearson correlation between measured variables, analysis of variance (ANOVA), and multiple comparison using the least significance difference (LSD) test were performed during statistical analysis. All results were inferred at a 5% level of significance.
3. Results and Discussion
3.1. Crop Response to Water Stress
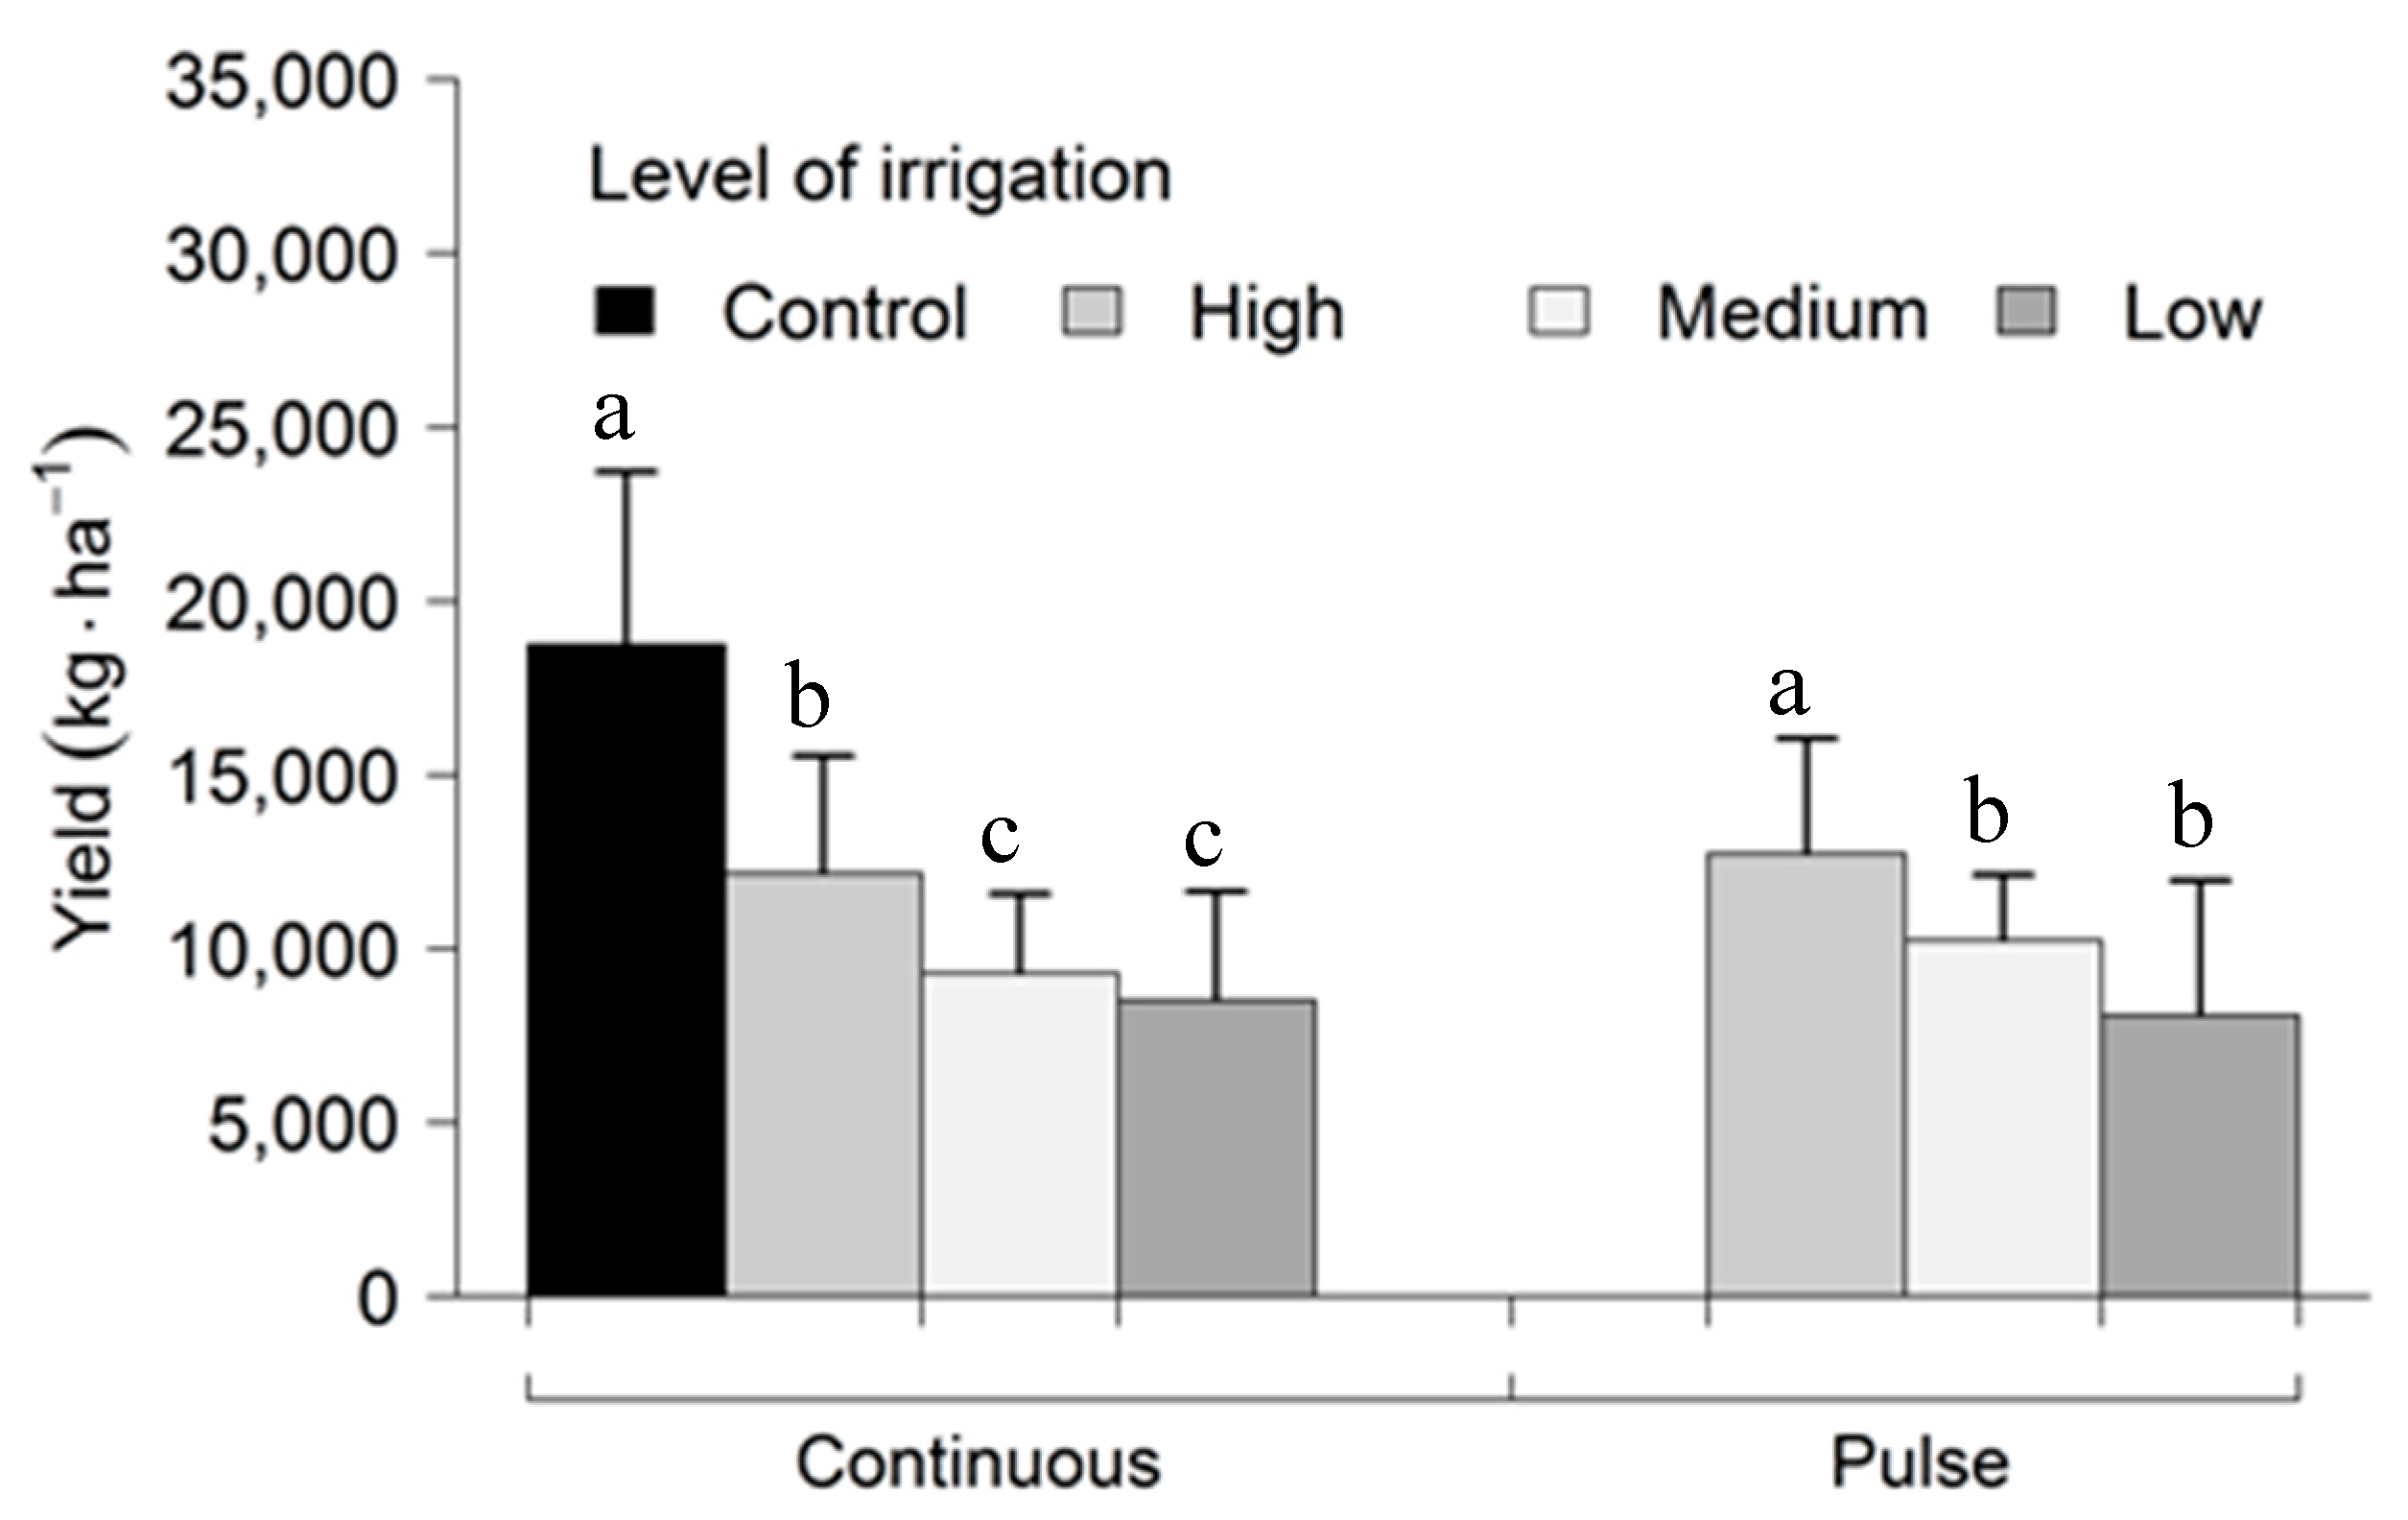
Subsurface irrigation treatments were applied to the field for two consecutive seasons. The results from season 2015 was reported in Zúñiga et al. [15]. In the 2016 season, there were no significant differences in the yield when the effect of the irrigation technique (pulse, continuous) or depth of irrigation (30, 60, 90 cm) was evaluated. However, a significant difference was observed in the yield when comparing the treatments according to the level of applied irrigation. Regardless of the type or depth of irrigation used, treatment plots that received 60% irrigation had a higher yield than 30% and 15% irrigation levels. In addition, there was no difference in yield when plants received a medium and low amount of water (Figure 3). Under continuous irrigation, the control showed a statistically higher yield (18,756 kg/ha) than water deficit irrigated treatments (12,179, 9306, and 8526 kg/ha at 60%, 30%, and 15% irrigation rates).
A linear increasing trend between the amount of water applied and yield was also observed. Such a relationship has been well documented in previous grapevine studies under the surface or rain fed irrigated conditions [16,17,18]. Romero et al. [19] conducted a regulated deficit irrigation experiment in grapevines and found yield reduction by 25% as the irrigation reduced to 30% of evapotranspiration (ETc) after the fruit set, compared grapevines receiving 60% ETc during the entire season. Moreover, there was a 40% reduction in the yield when grapevines were irrigated at 15% ETc from the fruit set to harvest. These results are in agreement with this study. The reduction in yield can be associated with the low leaf area of plants growing under water stress conditions [20]. Similarly, water stress induces a decrease in CO2 assimilation and stomatal conductance [21,22]. It results in reduced photosynthesis and can translate to lower production.
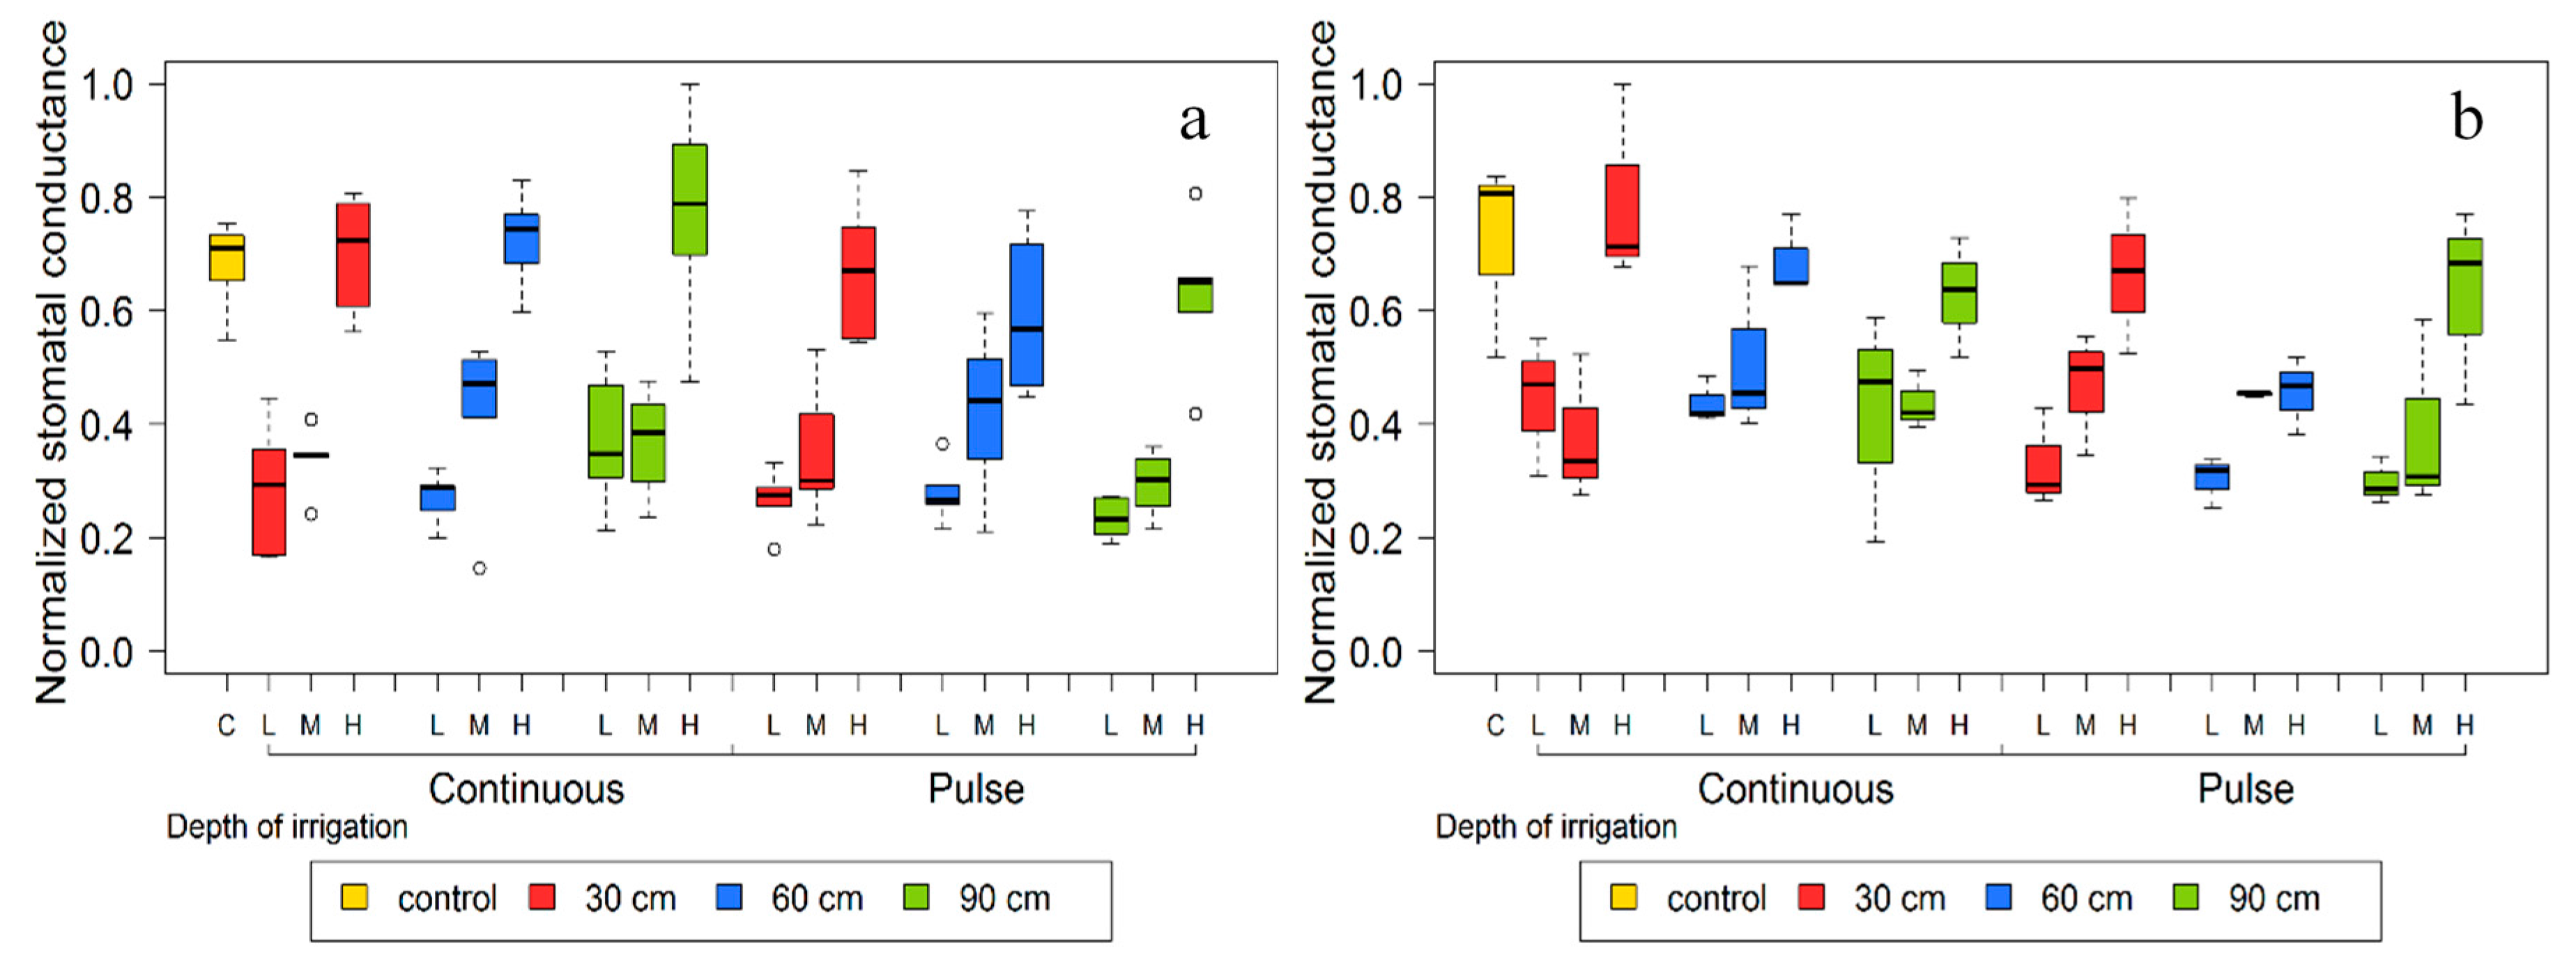
Stomatal conductance is indicative of water stress as it represents the carbon dioxide flow rate based on opening leaf pores [23]. In this study, stomatal conductance obtained at 80 DBH was significantly correlated with the irrigation level. At this stage, the high level of irrigation treatment (60%) showed a similar stomatal conductance when compared to the control. In addition, high level of irrigation treatment had stomatal conductance in the ranges of 440 and 550 mmol/m2s; higher than medium (30%) and low level of irrigation (15%). At 44 DBH, stomatal conductance in the control and high irrigation levels were statistically different from medium and low irrigation levels. Similarly, the average stomatal conductance for continuous irrigation (273 mmol/m2s) was higher than pulse irrigation (230 mmol/m2s). No interaction among the treatments was observed between these two periods (Figure 4).
Reduction in stomatal conductance associated with water stress has been long documented [18,19,21,24]. Water stress increases abscisic acid (ABA) in roots, and this signal generates the stomatal closure in leaves [22]. In this study, fruit yield and stomatal conductance showed a positive correlation (p < 0.01, Figure 5). In addition, similar stomatal conductance between a high level of irrigation and the control were observed. Fruit yield was higher in the control (applied as surface drip) than the high level of subsurface irrigation (60% of the control amount). This result can be explained by a reduction in the total leaf area of vines growing under water stress, and not solely because of reduction in stomatal conductance. These results illustrate that water stress impacts are broader than a single factor. Consequently, to characterize plant behavior under water stress, it is important to consider both physiological effects and spatial variability of the obtained data.
3.2. Vegetation Indices and Crop Water Status Assessment
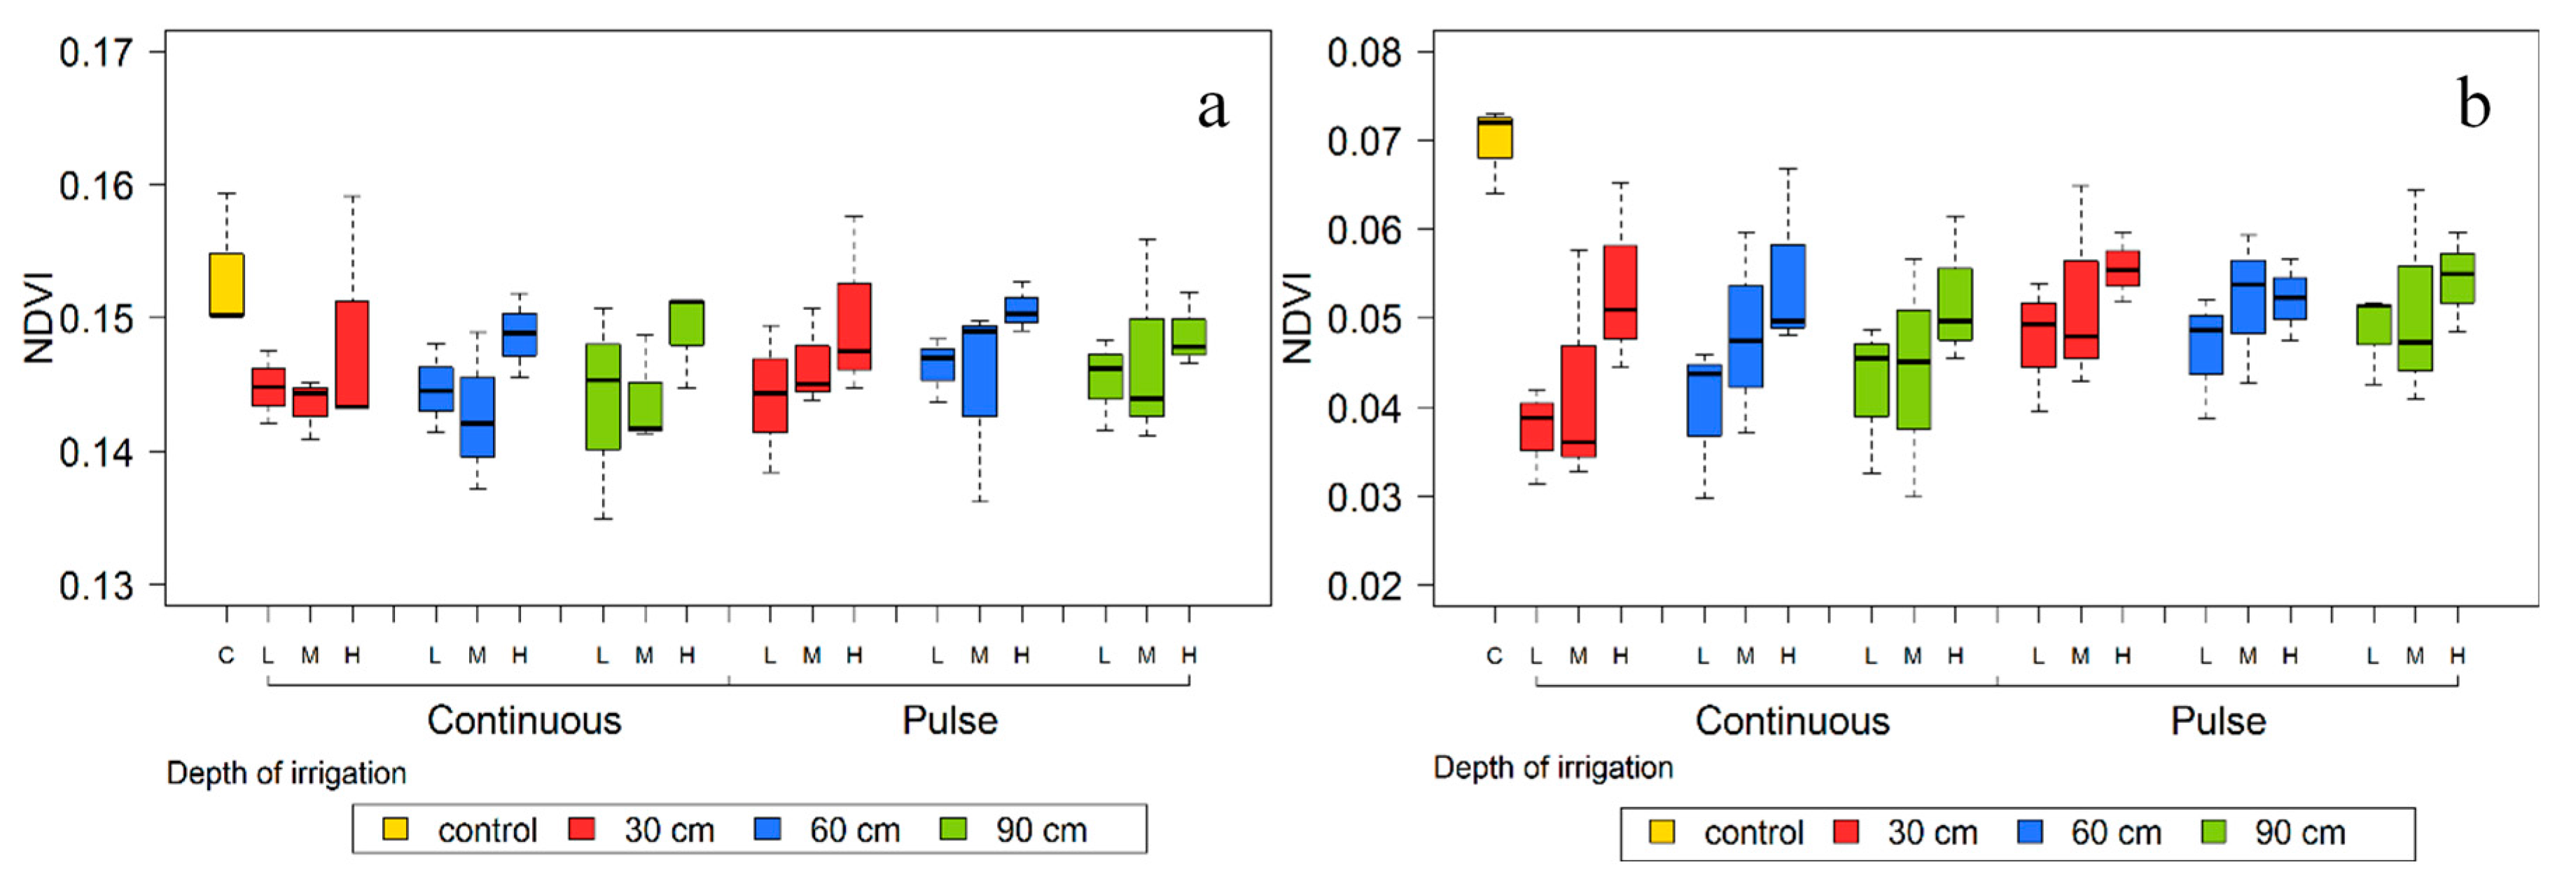
NDVI is a ratio that shows the normalization of pigment absorption in the red channel and the canopy scattering in the NIR channel [25]. The results at 80 DBH showed that the control had a higher NDVI compared to the other treatments. Among the treatments that received deficit irrigation, a high level of irrigation showed a higher NDVI, which indicates a higher crop vigor than medium and low irrigation levels. The medium and low treatments did not show statistically different NDVI. Consequently, the same trend was observed when NDVI was calculated at 44 DBH. However, during this period, the differences were higher than the data acquired at 80 DBH (Figure 6).
NDVI can be related to plant vigor and with a lower leaf area in water stressed plants [20]. However, in our study, NDVI was not representative of treatment differences under severe water stress (medium and low level of irrigation). Given the similar stomatal conductance of these two treatments, this observation can be expected. Nevertheless, this index was accurate for differentiating moderate (60%) and severe water stress (30% and 15%) conditions.
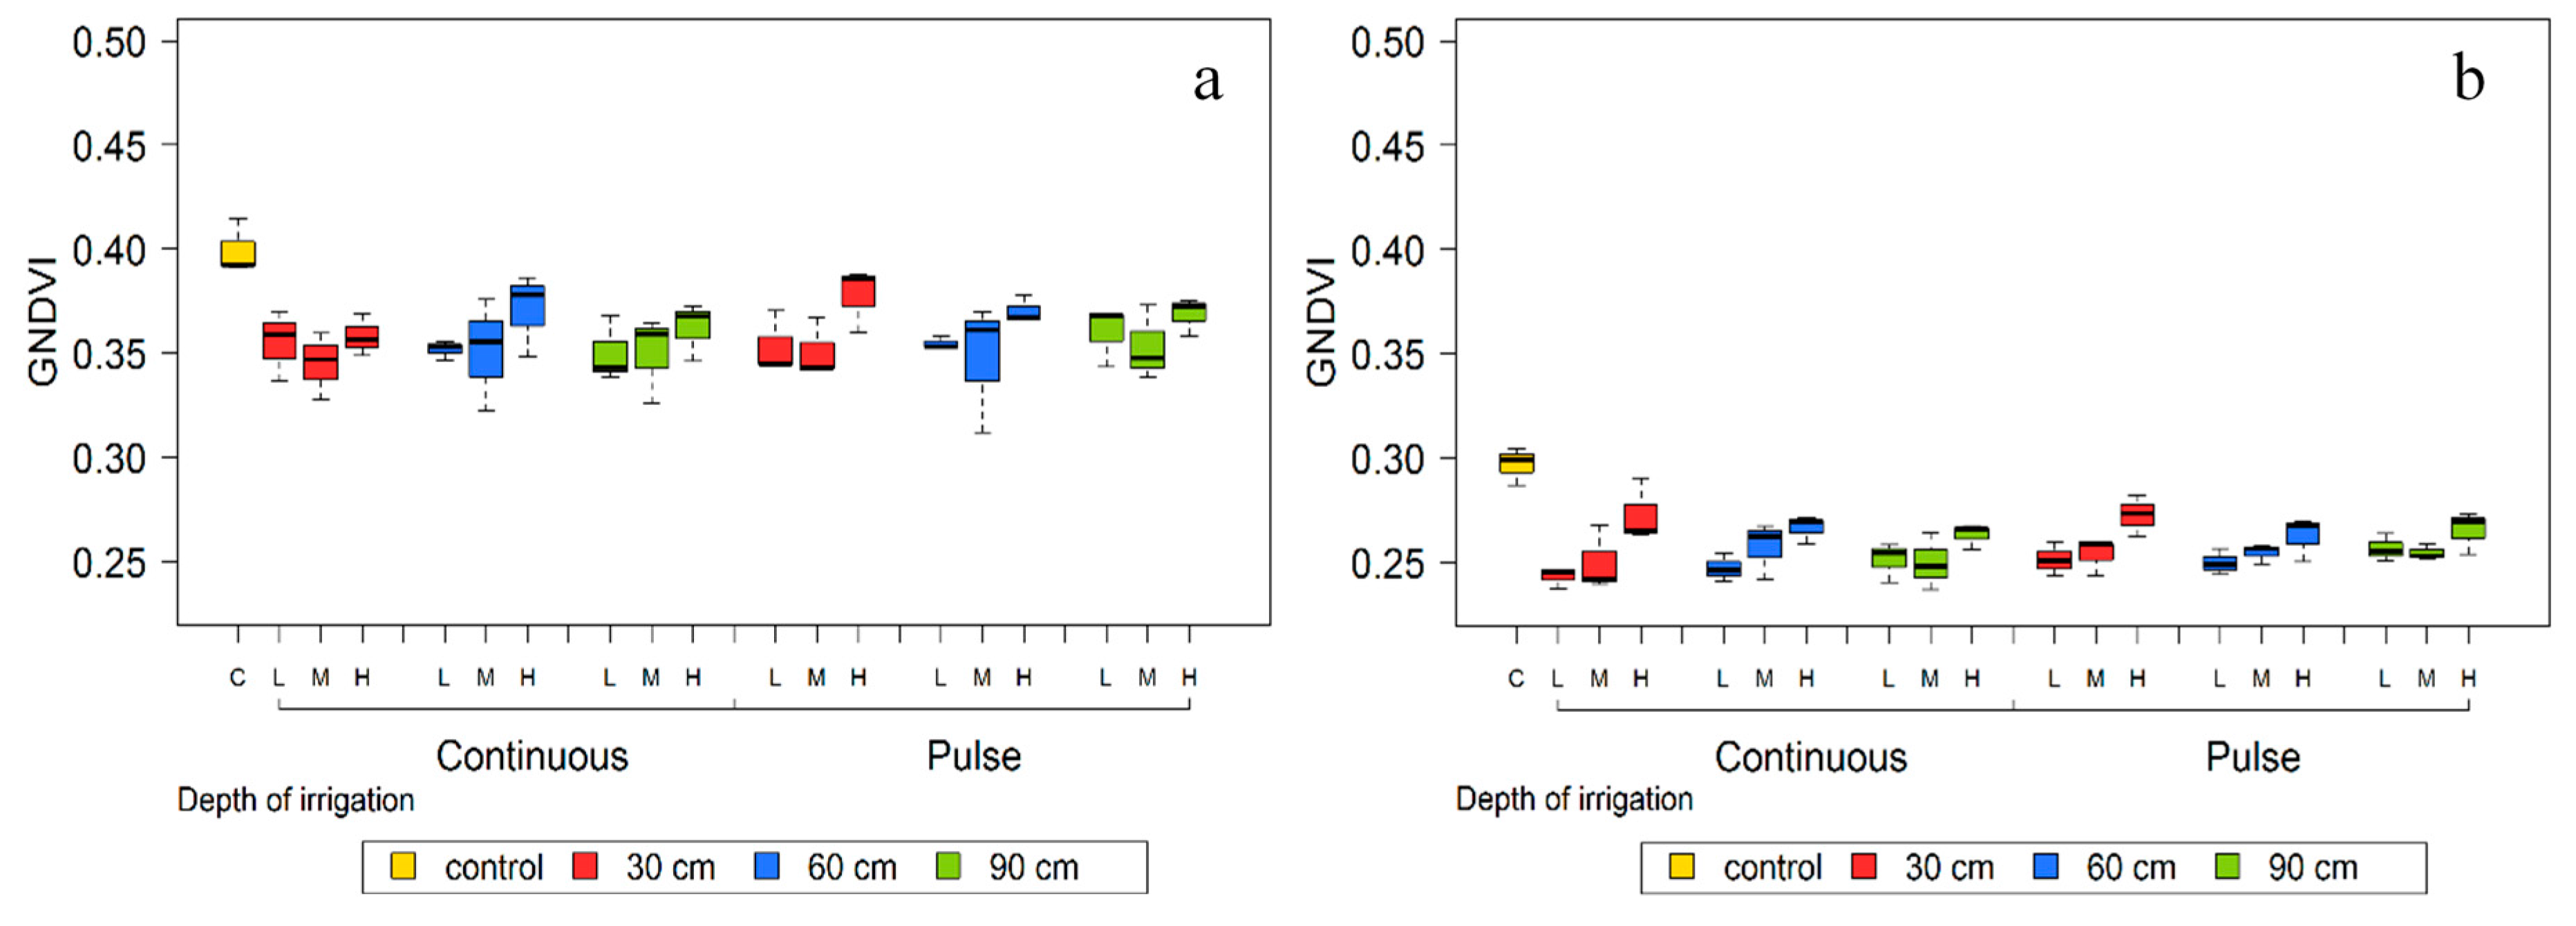
In addition to NDVI, GNDVI was also estimated. GNDVI is an indicator of chlorophyll concentration in the vegetation. Gitelson and Merzlyak [26] recommended the use of the reflectance in the green range of the spectrum (540 to 570 nm) for an assessment of the chlorophyll concentration. This range was much more sensitive to variations in chlorophyll than NDVI. At 80 and 44 DBH, control treatment plants had a higher GNDVI than deficit irrigated treatments. Among these treatments, a high rate of irrigation showed a higher GNDVI and there was no difference between a medium and low rates. There was no statistical difference among deficit irrigated treatments when GNDVI data were compared according to the type (continuous or pulse) or depth of irrigation (Figure 7). Leaf pigment development is affected by water stress, as was concluded by Zulini et al. [27]. However, that development is affected after an extended period of water stress [27]. This is in accordance with the obtained results, where GNDVI decreased when water stress was prolonged between 80 and 44 DBH. In addition, GNDVI was capable of detecting treatment differences, due to pigment development, between moderate (30% irrigation level) and severe (15% irrigation level) water stress.
3.3. Relationship between Vegetation Indices and Response Variables
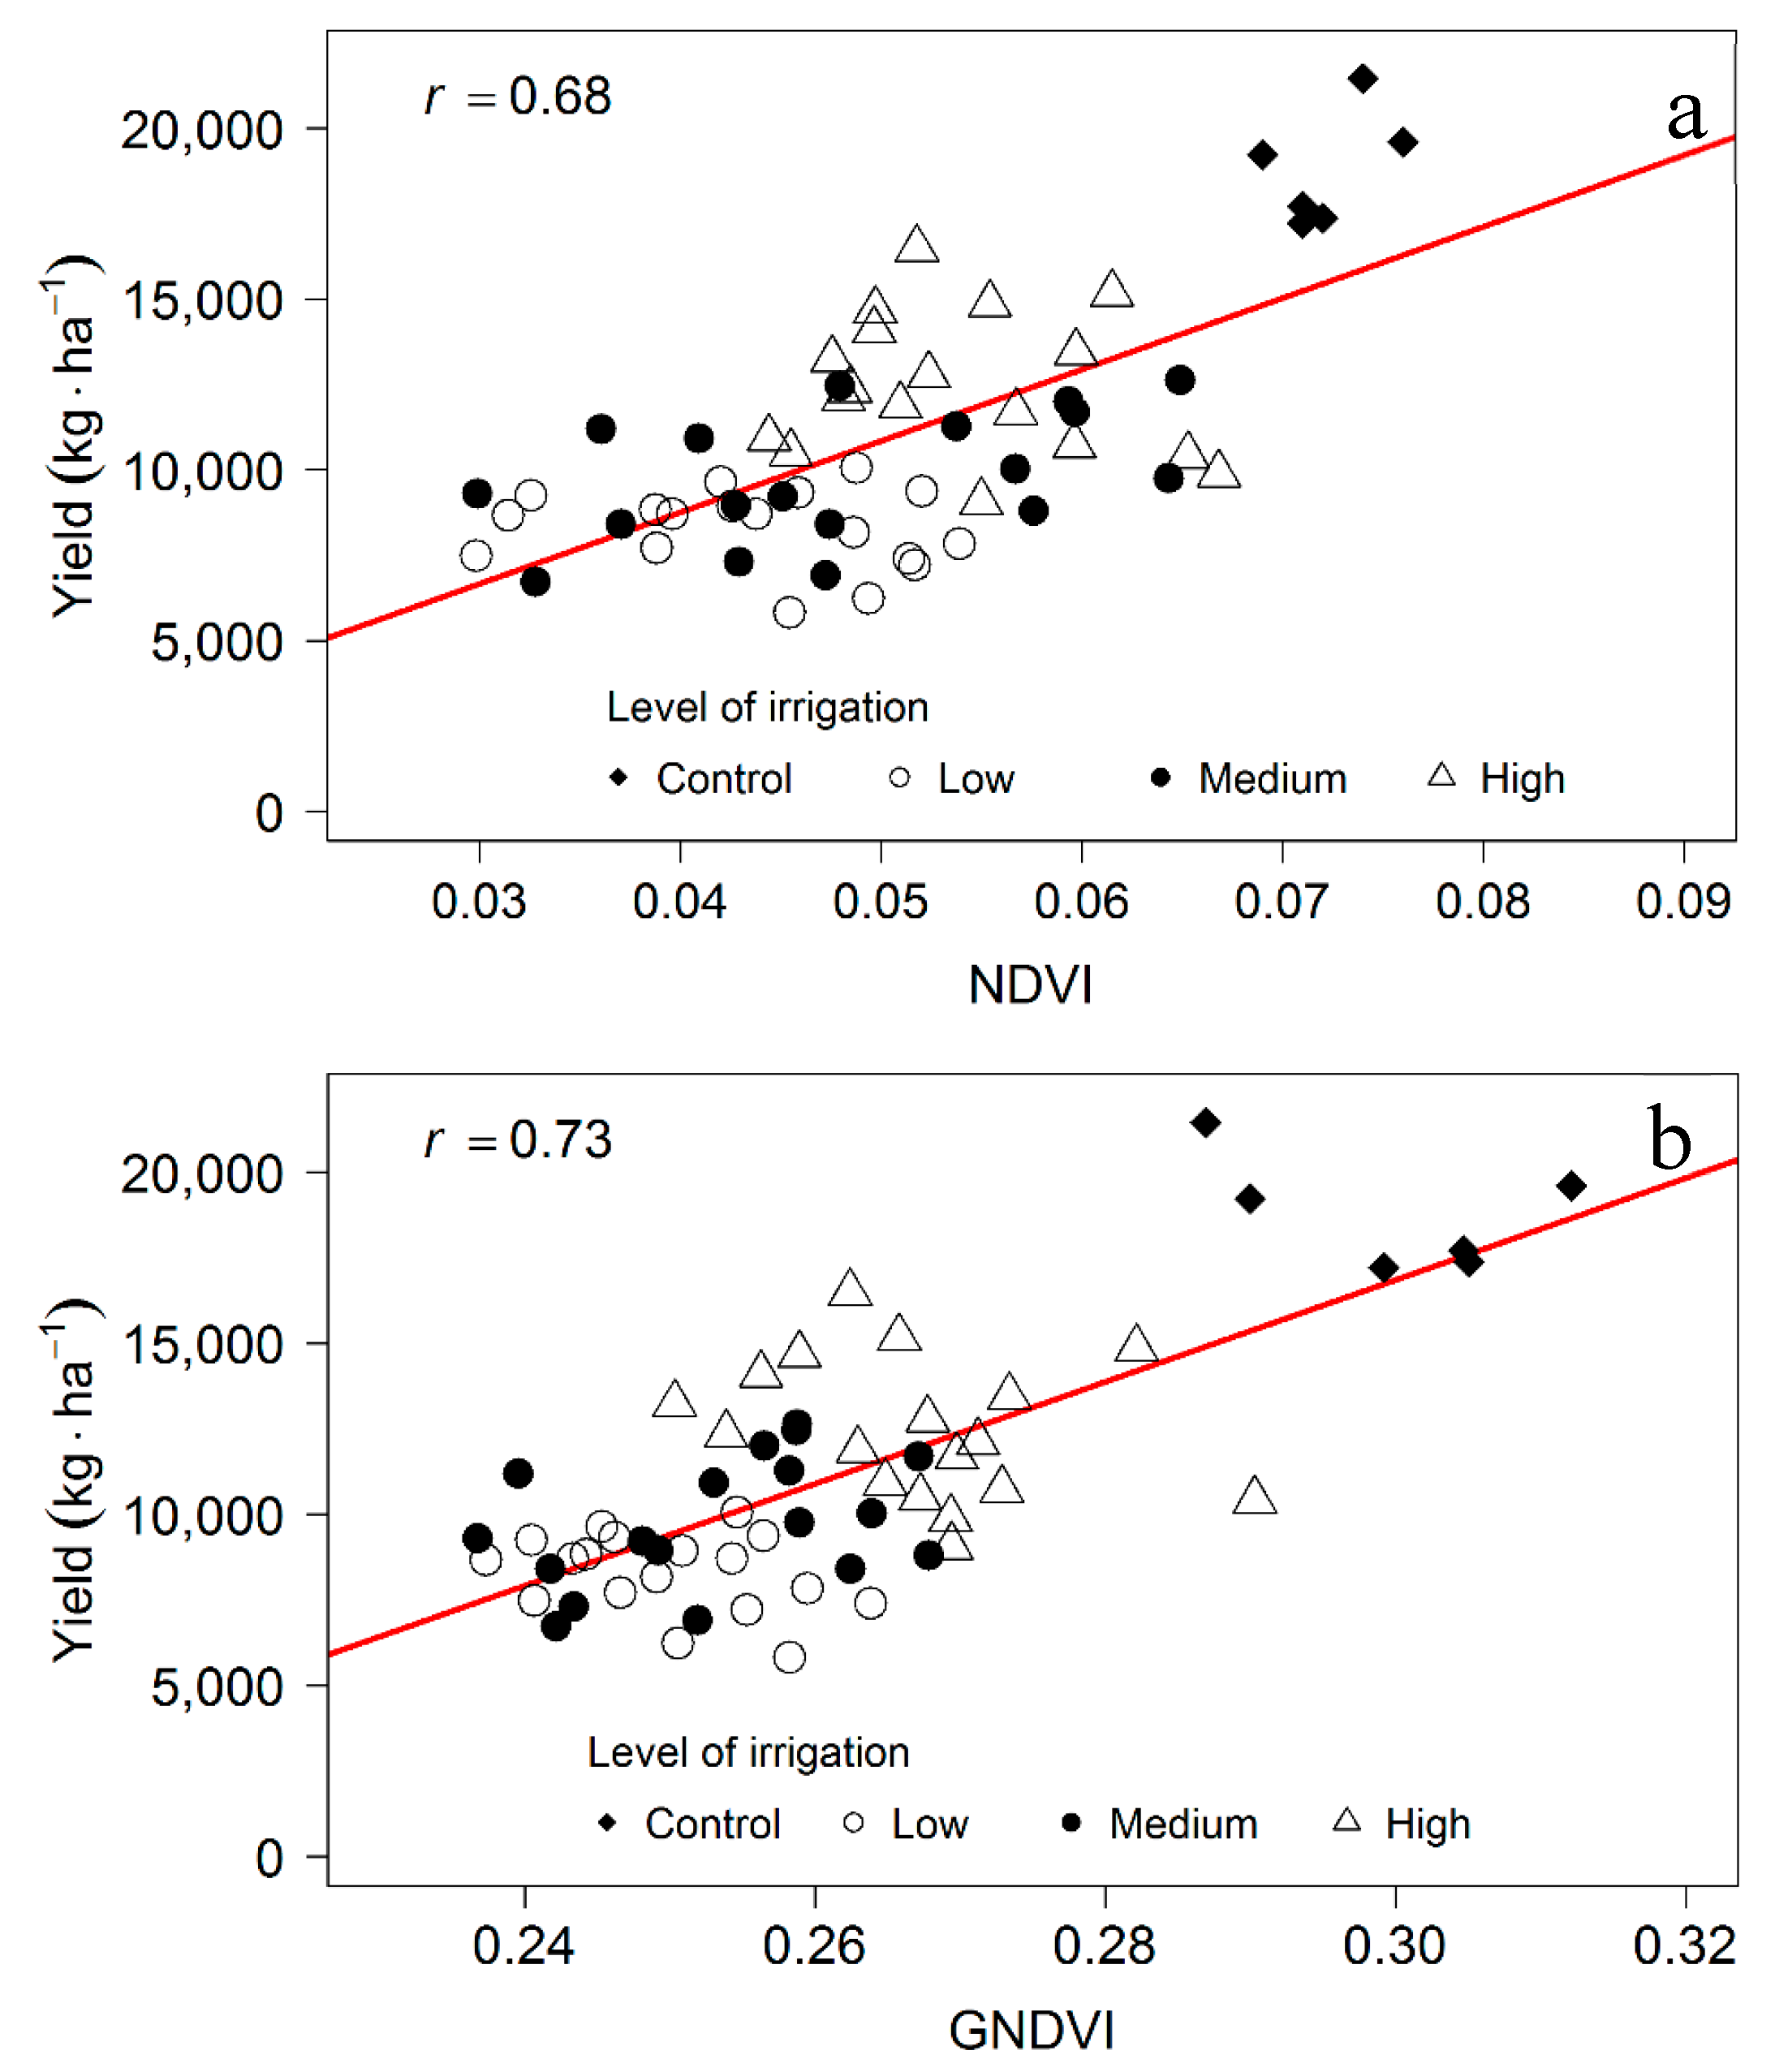
The relationship between the measured vegetation indices (GNDVI, NDVI) and response variables (stomatal conductance and fruit yield) was evaluated in this study. With respect to the NDVI at 80 DBH, a non-significant correlation (p < 0.1) was found between NDVI and yield data (correlation coefficient, r = 0.22). When NDVI was compared to the yield at 44 DBH, a significant correlation was found (p < 0.01) with r = 0.68. (Figure 8a).
However, GNDVI was significantly correlated with yield data at 80 DBH (r = 0.39, p < 0.05). At 44 DBH, GNDVI showed a significantly high correlation with the yield (r = 0.73, p < 0.01, Figure 8b). Prolonged water stress may possibly have affected the pigment development in the leaves, which could be observed from GNDVI data. Several authors have found a relationship between vegetation indices and yield. Texeira and Ustin [28] working in cotton measured NDVI from aerial images, and found a reduction in NDVI with a decreased cotton yield. Similarly, GNDVI measurements have been suggested as a parameter to estimate yield in corn [29]. However, the relationship between vegetation indices and yield is not well documented in grapevines. Serrano et al. [17] measured several vegetation indices using a spectroradiometer, and reported a positive and significant correlation (R2 = 0.32, p < 0.05) between NDVI and yield in grapevine. In our study, a significant correlation between yield and NDVI was found. The major benefit of remote sensing data is the canopy level measurements in comparison to leaf-level proximal data. Spatial variability can also be better captured with the remote sensing data. It is important to note that the correlation between NDVI, as well as GNDVI, to yield increased with time. These indices are considered to show the long-term effect in plants [4]. Baluja et al. [4] in a rainfed grapevine experiment found a significant correlation between GNDVI and NDVI images acquired from a UAV with that of stomatal conductance (r = 0.83 and 0.86 respectively). Therefore, a cumulative effect of water stress in the plants may have been observed.
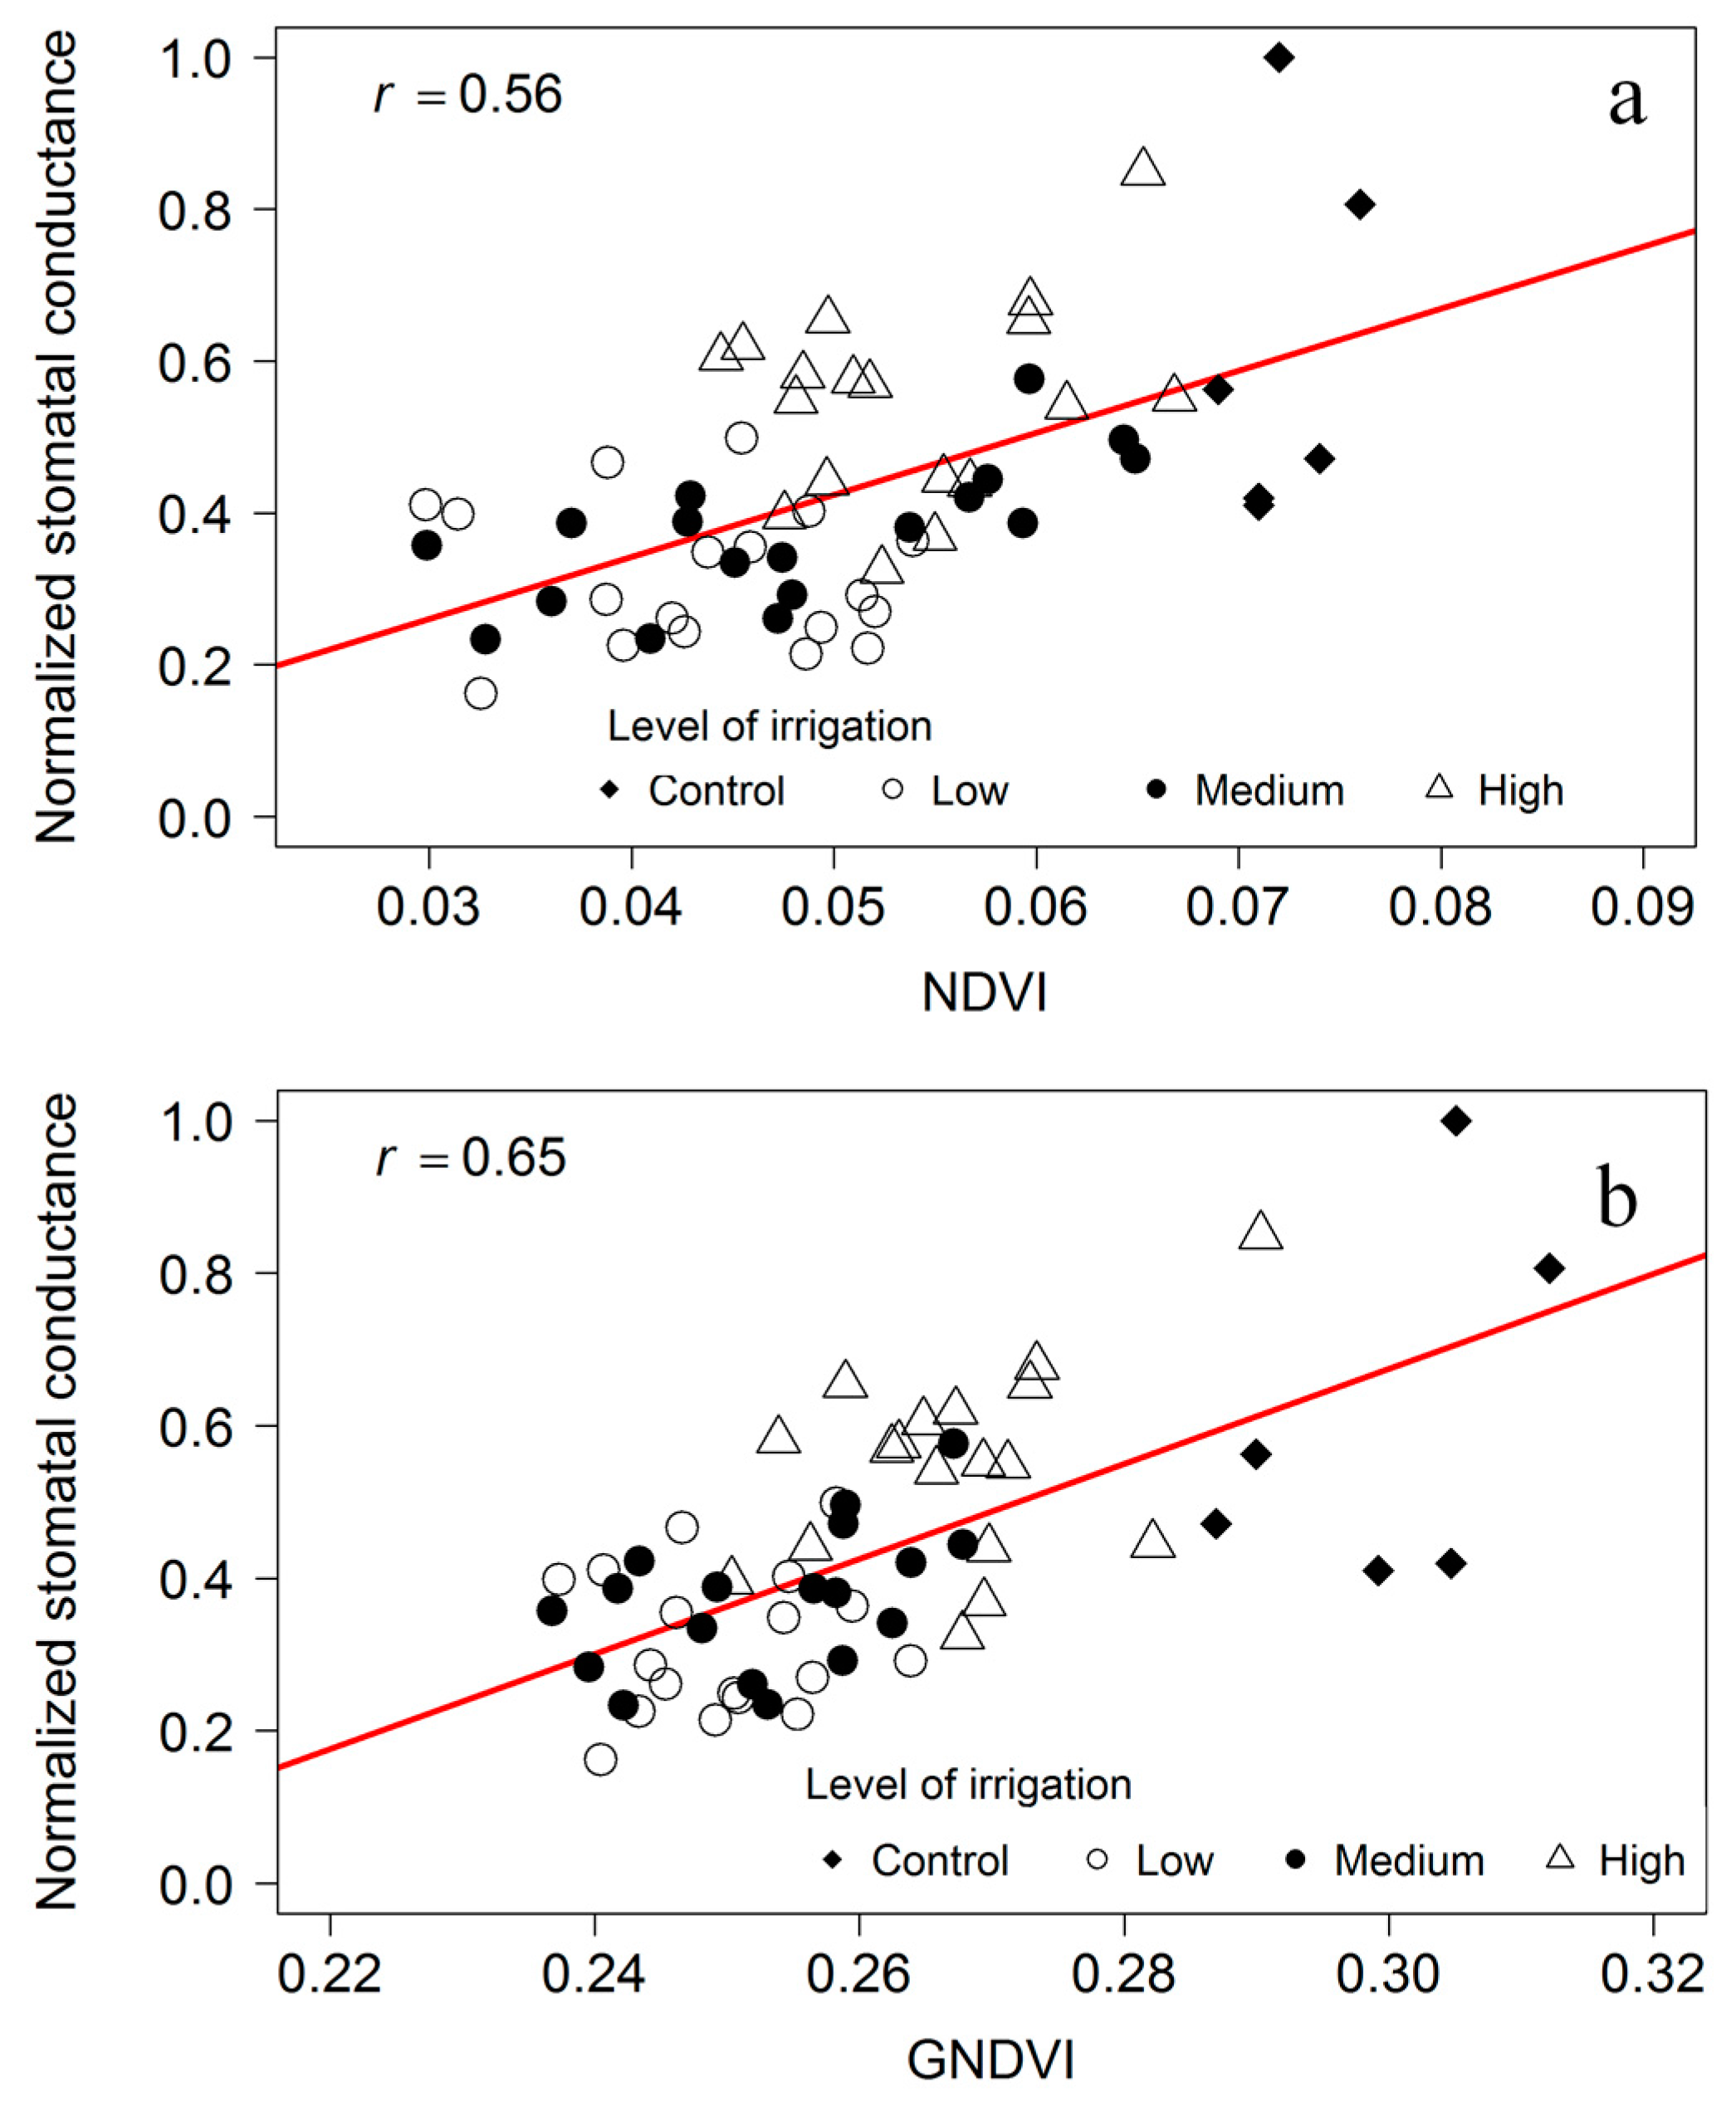
At 80 DBH, stomatal conductance was not correlated with vegetation indices. At 44 DBH, there was a significant correlation between NDVI and stomatal conductance (p < 0.01), with a correlation coefficient of 0.56 (Figure 9a). Correlations between GNDVI and stomatal conductance were significant (p < 0.01) and higher than NDVI at 44 DBH (r = 0.65, Figure 9b).
3.4. Thermal Infrared Data and Crop Water Status Assessment
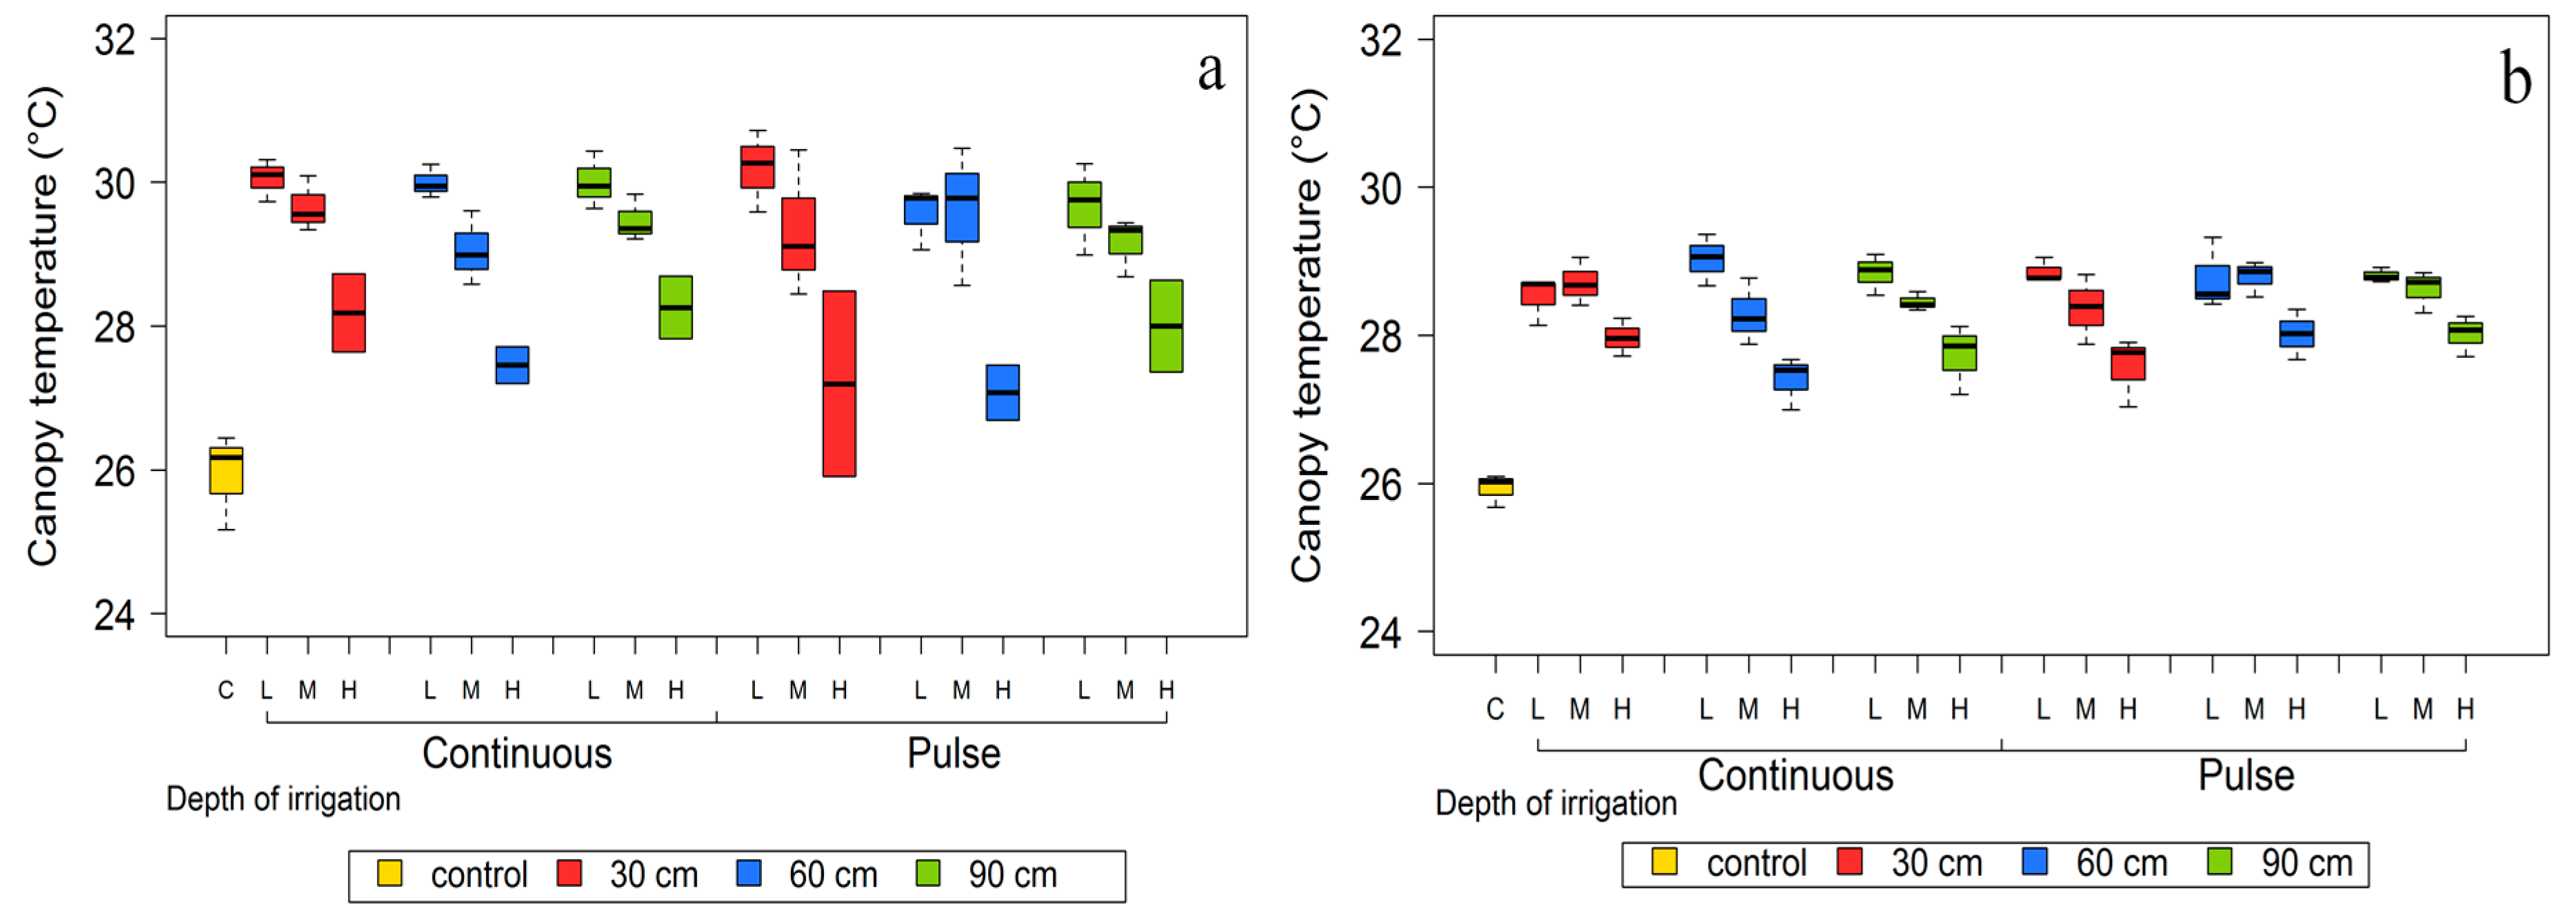
Thermal images were analyzed to find the relationship between irrigation treatments and canopy temperature. The results show a statistically different canopy temperature between the control and treatments. However, at 44 DBH, it was possible to obtain a statistically significant difference in the canopy temperature between treatments that received a high, medium, and low amount of water. At 80 DBH, average canopy temperature for a high, medium, and low amount of irrigation was 27.7, 29.5, and 29.7 °C, respectively. At 44 DBH, average canopy temperature was 27.7, 28.5, and 28.8 °C for the corresponding treatments (Figure 10). Grant et al. [24] reported such differences in temperature of leaves when fully irrigated plants were compared to plants receiving 50% ETc. Water stress induces a decrease in stomatal conductance and less heat dissipation in plants; therefore, canopy temperature increases when plants are under water stress. In our study, canopy temperature allowed us to differentiate moderate (60% irrigation) and severe (30% and 15% irrigation) water stress compared to control treatments. Even differences between severe water stress conditions (medium and low level of irrigation) could be observed. This observation was not possible through porometer readings or vegetation indices data.
3.5. Correlations between Thermal Infrared Data and Response Variables
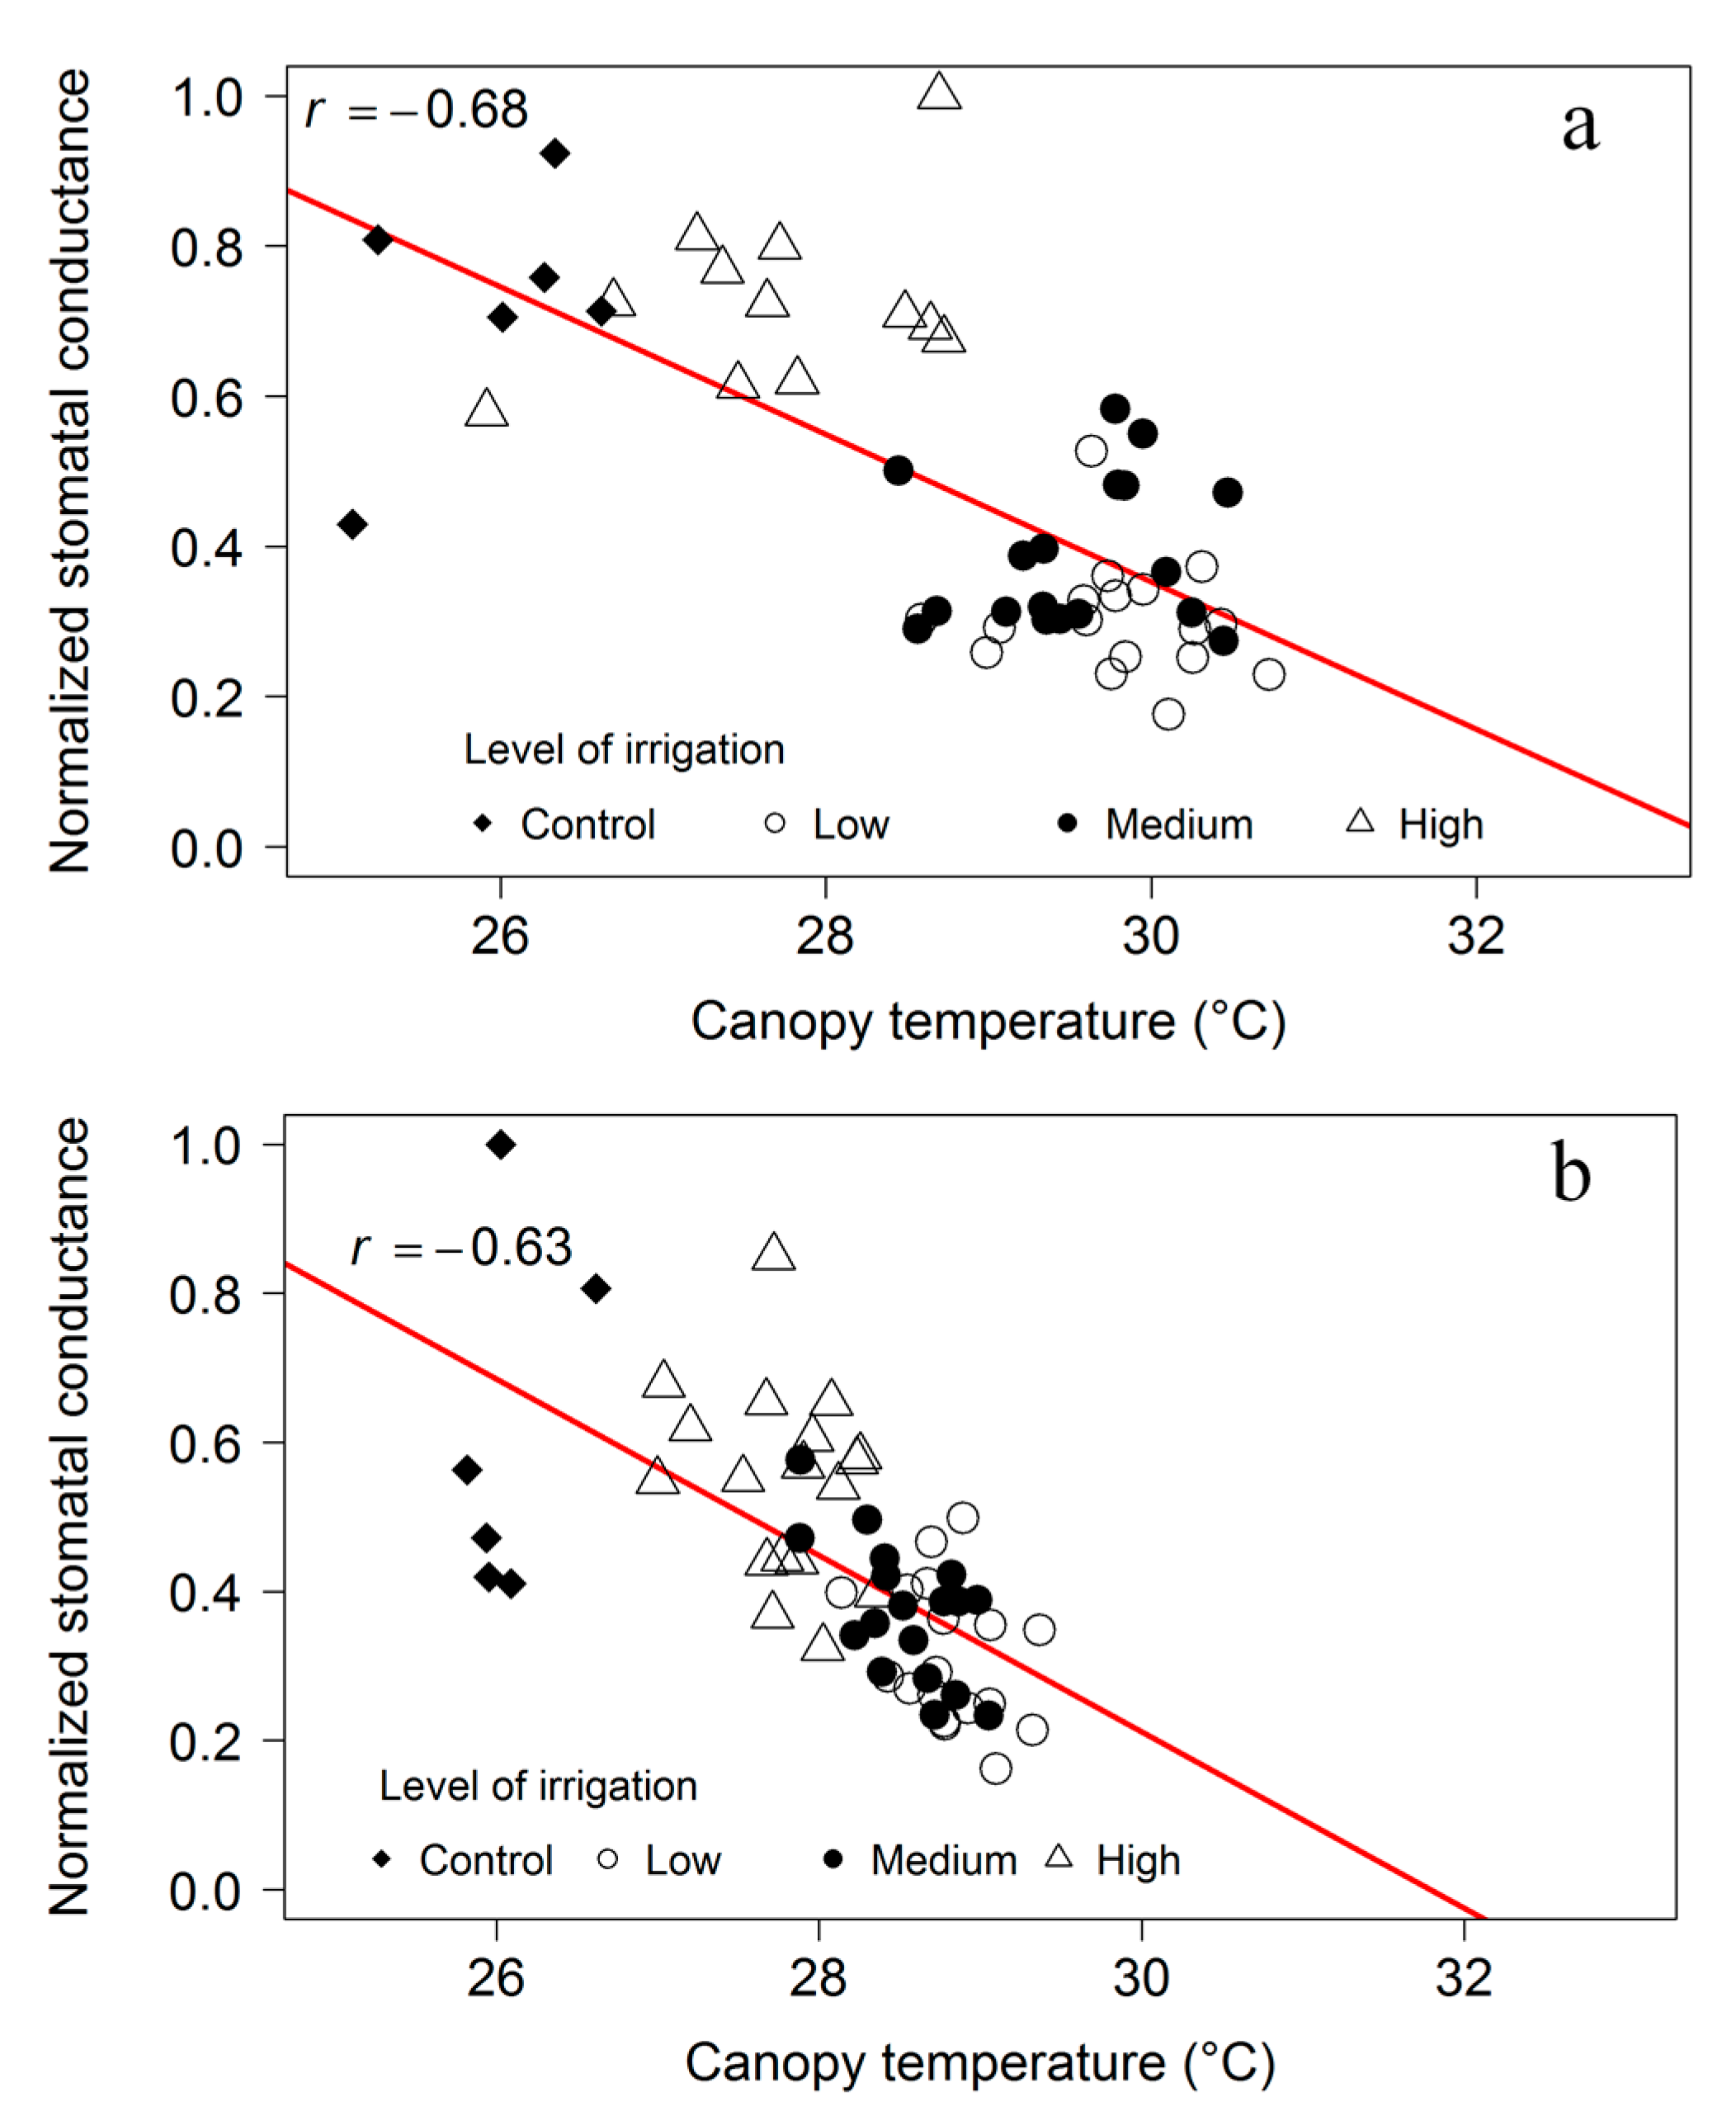
A negative correlation (p < 0.01) was observed when canopy temperature was compared to normalized stomatal conductance at 80 and 44 DBH, with a correlation coefficient of −0.68 and −0.63, respectively (Figure 11). Baluja et al. [4] found a correlation coefficient of −0.82 in rainfed grapes using a thermal camera mounted in an UAV. Similarly, Zarco-Tejada et al. [30] in a citrus orchard under a deficit irrigation experiment obtained a correlation coefficient of −0.88 between stomatal conductance and canopy temperature with UAV-based thermal imaging. Stomatal conductance-canopy temperature correlation coefficients obtained in this study were higher than those obtained with NDVI or GNDVI estimates at 80 DBH. Consequently, analysis of thermal images appears to be useful for a better assessment of the short term water condition in a vineyard compared to the NDVI or GNDVI data. Baluja et al. [4] reported similar results with thermal and vegetation indices data in rainfed vineyards. The results could potentially be used to estimate stomatal conductance from thermal images obtained from UAVs. The method is also high-throughput and more representative of the spatial variability to record vineyard water status.
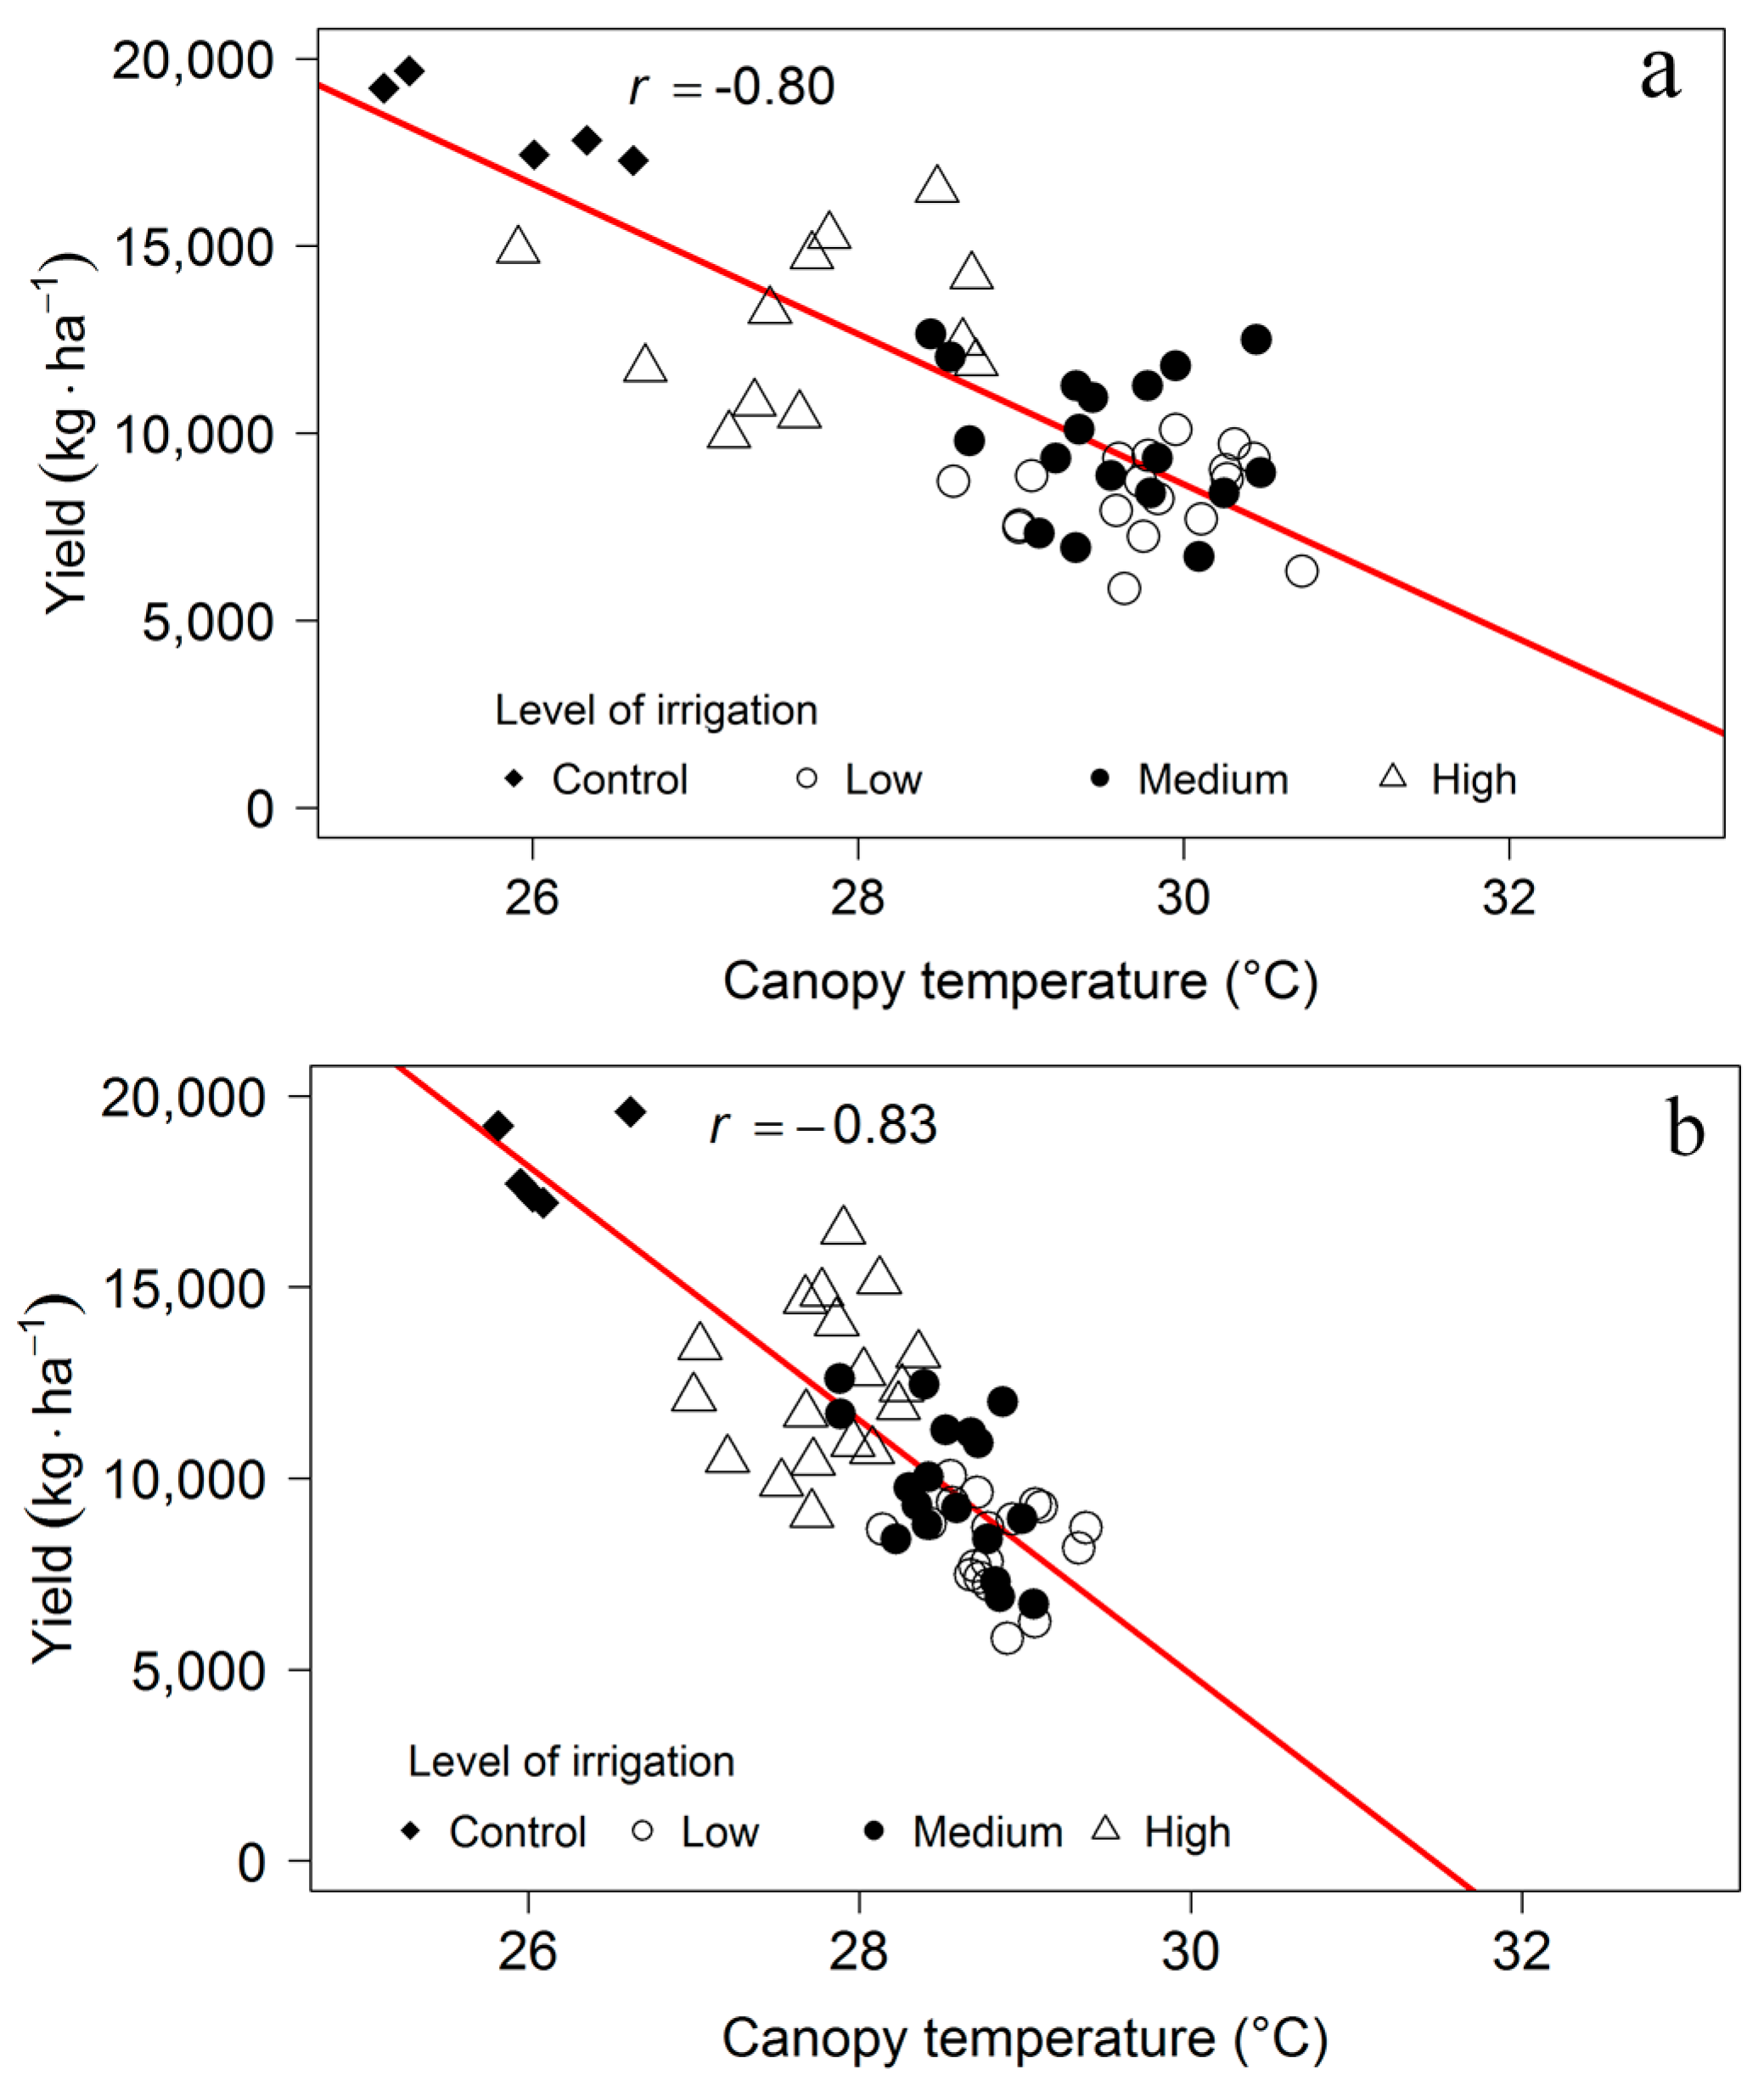
Thermal images and yield data were compared to understand the influence of the canopy temperature and grape production. The results showed a negative correlation (p < 0.01) between the canopy temperature and yield. The correlation coefficients at 80 and 44 DBH were −0.80 and −0.83, respectively (Figure 12). These values were higher than the ones obtained when yield was compared to NDVI and GNDVI (Figure 8). The relationship between canopy temperature and yield is not well documented. Serrano et al. [17] found a negative correlation between difference of canopy temperature and air temperature (ΔTmidday) and yield for two seasons. The coefficient of determination was 0.40 in the first season and 0.44 in the second season (p < 0.05 and p < 0.01, respectively). Correlation among these parameters in this study demonstrate an encouraging trend and requires further investigation. Canopy temperature can change based on the orchard daily conditions [4]. Considering canopy temperature accuracy, data acquisition time, and spatial variability consideration, it is possible to recommend use of infrared thermal images acquired from UAVs for vineyard irrigation scheduling. In addition, results show potential of using thermal imagery as a yield estimator for orchard management or plant breeding programs.
4. Conclusions
Overall, this study demonstrates the feasibility of using UAV-based multi-spectral and infrared thermal images for vineyard irrigation scheduling. Our results confirmed that grapevine yield was affected by the level of subsurface irrigation treatments. However, fruit yield was not affected by either depth or irrigation technique (pulse or continuous). Stomatal conductance did not show differences among treatments receiving 100% and 60% irrigation rates. Nevertheless, stomatal conductance was lower when treatments were irrigated with 30% and 15% irrigation rates. In addition, multispectral sensor derived vegetation indices had higher values with the level of irrigation, whereas the canopy temperature showed a reversing trend. Overall, the data exhibited a relationship between remote sensing (NDVI, GNDVI, and canopy temperature) and response variables (stomatal conductance and yield). Thermal infrared data was able to differentiate treatments when they received 30% and 15% irrigation rates. Overall, these results demonstrate the potential to use multispectral sensors to understand water stress for near-real time production decision making. In addition, there is a potential to estimate plant stomatal conductance from canopy temperature data obtained by a UAV integrated radiometric calibration enabled thermal imaging sensor.
Acknowledgments
We are very grateful to Sanaz Jarolmasjed, Chongyuan Zhang, Rajeev Sinha, and Xiaoxi Ma for their help in data collection. This activity was funded, in part, with an Emerging Research Issues Internal Competitive Grant from the Washington State University, College of Agricultural, Human, and Natural Resource Sciences, Agricultural Research Center project; and Washington State Department of Agriculture (WSDA)-Specialty Crop Block Grant Program. Additionally, we acknowledge Kiona Winery and Vineyards for providing the land, vines, irrigation and overall management of the vineyard site and appreciate their collaboration.
Author Contributions
P.W.J., L.R.K., and S.S. conceived and designed the experiments; P.W.J. implemented the irrigation treatments; L.R.K. and C.Z.E. acquired remote data and performed the experiments; C.Z.E., L.R.K., and S.S. processed and presented the data; S.S. and L.R.K. contributed reagents/materials/analysis tools; C.Z.E., L.R.K., S.S. and P.W.J wrote/edited the paper.
Conflicts of Interest
The authors declare no conflict of interest.
References
- Casassa, L.F.; Keller, M.; Harbertson, J.F. Regulated Deficit Irrigation Alters Anthocyanins, Tannins and Sensory Properties of Cabernet Sauvignon Grapes and Wines. Molecules 2015, 20, 7820–7844. [Google Scholar] [CrossRef] [PubMed]
- Zhang, N.; Wang, M.; Wang, N. Precision agriculture—A worldwide overview. Comput. Electron. Agric. 2002, 36, 113–132. [Google Scholar] [CrossRef]
- Sankaran, S.; Mishra, A.; Maja, J.M.; Ehsani, R. Visible-near infrared spectroscopy for detection of Huanglongbing in citrus orchards. Comput. Electron. Agric. 2011, 77, 127–134. [Google Scholar] [CrossRef]
- Baluja, J.; Diago, M.P.; Balda, P.; Zorer, R.; Meggio, F.; Morales, F.; Tardaguila, J. Assessment of vineyard water status variability by thermal and multispectral imagery using an unmanned aerial vehicle (UAV). Irrig. Sci. 2012, 30, 511–522. [Google Scholar] [CrossRef]
- Haberland, J.A.; Colaizzi, P.D.; Kostrzewski, M.A.; Waller, P.M.; Choi, C.Y.; Eaton, F.E.; Barnes, E.M.; Clarke, T.R. AgIIS, Agricultural Irrigation Imaging System. Appl. Eng. Agric. 2009, 26, 247–253. [Google Scholar] [CrossRef]
- Gutiérrez, P.A.; López-Granados, F.; Peña-Barragán, J.M.; Jurado-Expósito, M.; Hervás-Martínez, C. Logistic regression product-unit neural networks for mapping Ridolfia segetum infestations in sunflower crop using multitemporal remote sensed data. Comput. Electron. Agric. 2008, 64, 293–306. [Google Scholar] [CrossRef]
- Rodríguez-Pérez, J.R.; Riaño, D.; Carlisle, E.; Ustin, S.; Smart, D.R. Evaluation of Hyperspectral Reflectance Indexes to Detect Grapevine Water Status in Vineyards. Am. J. Enol. Vitic. 2007, 58, 302–317. [Google Scholar]
- Bellvert, J.; Zarco-Tejada, P.J.; Girona, J.; Fereres, E. Mapping crop water stress index in a “Pinot-noir” vineyard: Comparing ground measurements with thermal remote sensing imagery from an unmanned aerial vehicle. Precis. Agric. 2014, 15, 361–376. [Google Scholar] [CrossRef]
- Möller, M.; Alchanatis, V.; Cohen, Y.; Meron, M.; Tsipris, J.; Naor, A.; Ostrovsky, V.; Sprintsin, M.; Cohen, S. Use of thermal and visible imagery for estimating crop water status of irrigated grapevine. J. Exp. Bot. 2007, 58, 827–838. [Google Scholar] [CrossRef] [PubMed]
- Idso, S.B.; Jackson, R.D.; Pinter, P.J.; Reginato, R.J.; Hatfield, J.L. Normalizing the stress-degree-day parameter for environmental variability. Agric. Meteorol. 1981, 24, 45–55. [Google Scholar] [CrossRef]
- AgWeatherNet at Washington State University. Available online: http://weather.wsu.edu/ (accessed on 14 August 2017).
- Keller, M.; Smythyman, R.; Mills, L. Interactive Effects of Deficit Irrigation and Crop Load on Cabernet Sauvignon in an Arid Climate. Am. J. Enol. Vitic. 2008, 59, 221–234. [Google Scholar]
- Shellie, K. Interactive Effects of Deficit Irrigation and Berry Exposure Aspect on Merlot and Cabernet Sauvignon in an Arid Climate. Am. J. Enol. Vitic. 2011. [Google Scholar] [CrossRef]
- Abramoff, M.D.; Magalhães, P.J.; Ram, S.J. Image processing with ImageJ. Biophotonics Int. 2004, 11, 36–42. [Google Scholar]
- Zúñiga, C.; Khot, L.R.; Jacoby, P.; Sankaran, S. Remote sensing based water-use efficiency evaluation in sub-surface irrigated wine grape vines. Proc. SPIE 9866 2016. [Google Scholar] [CrossRef]
- Medrano, H.; Escalona, J.M.; Cifre, J.; Bota, J.; Flexas, J. A ten-year study on the physiology of two Spanish grapevine cultivars under field conditions: Effects of water availability from leaf photosynthesis to grape yield and quality. Funct. Plant Biol. 2003, 30, 607–619. [Google Scholar] [CrossRef]
- Serrano, L.; González-Flor, C.; Gorchs, G. Assessment of grape yield and composition using the reflectance based Water Index in Mediterranean rainfed vineyards. Remote Sens. Environ. 2012, 118, 249–258. [Google Scholar] [CrossRef] [Green Version]
- Costa, J.M.; Ortuño, M.F.; Lopes, C.M.; Chaves, M.M. Grapevine varieties exhibiting differences in stomatal response to water deficit. Funct. Plant Biol. 2012, 39, 179–189. [Google Scholar] [CrossRef]
- Romero, P.; Fernández-Fernández, J.I.; Martinez-Cutillas, A. Physiological Thresholds for Efficient Regulated Deficit-Irrigation Management in Winegrapes Grown under Semiarid Conditions. Am. J. Enol. Vitic. 2010, 61, 300–312. [Google Scholar]
- Pellegrino, A.; Lebon, E.; Simonneau, T.; Wery, J. Towards a simple indicator of water stress in grapevine (Vitis vinifera L.) based on the differential sensitivities of vegetative growth components. Aust. J. Grape Wine Res. 2005, 11, 306–315. [Google Scholar] [CrossRef]
- De Souza, C.R.; Maroco, J.P.; dos Santos, T.P.; Rodrigues, M.L.; Lopes, C.M.; Pereira, J.S.; Chaves, M.M. Partial rootzone drying: Regulation of stomatal aperture and carbon assimilation in field-grown grapevines (Vitis vinifera cv. Moscatel). Funct. Plant Biol. 2003, 30, 653–662. [Google Scholar] [CrossRef]
- Osakabe, Y.; Osakabe, K.; Shinozaki, K.; Tran, L.-S.P. Response of plants to water stress. Front. Plant Sci. 2014, 5. [Google Scholar] [CrossRef] [PubMed]
- Kim, T.-H.; Böhmer, M.; Hu, H.; Nishimura, N.; Schroeder, J.I. Guard Cell Signal Transduction Network: Advances in Understanding Abscisic Acid, CO2, and Ca2+ Signaling. Annu. Rev. Plant Biol. 2010, 61, 561–591. [Google Scholar] [CrossRef] [PubMed]
- Grant, O.M.; Tronina, Ł.; Jones, H.G.; Chaves, M.M. Exploring thermal imaging variables for the detection of stress responses in grapevine under different irrigation regimes. J. Exp. Bot. 2007, 58, 815–825. [Google Scholar] [CrossRef] [PubMed]
- Zarco-Tejada, P.J.; Ustin, S.L.; Whiting, M.L. Temporal and Spatial Relationships between Within-Field Yield Variability in Cotton and High-Spatial Hyperspectral Remote Sensing Imagery. Agron. J. 2005, 97, 641–653. [Google Scholar] [CrossRef]
- Gitelson, A.A.; Merzlyak, M.N. Remote sensing of chlorophyll concentration in higher plant leaves. Adv. Space Res. 1998, 22, 689–692. [Google Scholar] [CrossRef]
- Zulini, L.; Rubinigg, M.; Zorer, R.; Bertamini, M. Effects of Drought Stress on Chlorophyll Fluorescence and Photosynthetic Pigments in Grapevine Leaves (Vitis vinifera cv. “White Riesling”). Int. Workshop Adv. Grapevine Wine Res. 2007, 754, 289–294. [Google Scholar] [CrossRef]
- Dos, S.; Teixeira, A.; Ustin, S.L. Use of Biweekly High Resolution Aerial Images in Precision Farming. In ASAE Paper No. 003051; American Society of Agricultural Engineers: Milwaukee, WI, USA, 2000; pp. 1–11. [Google Scholar]
- Diker, K.; Bausch, W.C.; Heermann, D.F. Monitoring Temporal Changes of Irrigated Corn by Aerial Images; American Society of Agricultural Engineers: Sacramento, CA, USA, 2001. [Google Scholar]
- Zarco-Tejada, P.J.; González-Dugo, V.; Berni, J.A.J. Fluorescence, temperature and narrow-band indices acquired from a UAV platform for water stress detection using a micro-hyperspectral imager and a thermal camera. Remote Sens. Environ. 2012, 117, 322–337. [Google Scholar] [CrossRef]
Figure 1.
Green normalized difference vegetation index (GNDVI) image of the experimental site in the Kiona vineyards describing the irrigation treatments. Irrigation rate was 100% (standard irrigation rate) for the Control; and 60% (High), 30% (Medium), and 15% (Low) of the standard irrigation rate. The subsurface irrigation depths were 30, 60, and 90 cm. ‘Cont’ and ‘Pulse’ refer to continuous and pulse irrigation, respectively. The GNDVI scale is given on the right side.

Figure 2.
Flowchart describing the key image processing and analysis steps.

Figure 3.
Fruit yield obtained from treatment plots based on the amount of water (high, medium, and low) and irrigation technique (continuous and pulse). Bars indicate standard deviation with overhead letters a, b, and c represent treatments that were significantly different at α = 0.05 for respective irrigation technique (continuous and pulse).

Figure 4.
Normalized stomatal conductance data obtained at (a) 80 and (b) 44 DBH. In the boxplot, the upper and lower whiskers represent the maximum and minimum values, the upper and lower box borders represent the 75th and 25th percentile values, respectively, and the horizontal dark line indicates the median. C = control, 100% standard irrigation rate; L = low level of irrigation, 15%; M = medium level of irrigation, 30%; H = high level of irrigation, 60%.

Figure 5.
Correlation between the fruit yield and normalized stomatal conductance at (a) 80 and (b) 44 DBH.
Figure 5.
Correlation between the fruit yield and normalized stomatal conductance at (a) 80 and (b) 44 DBH.
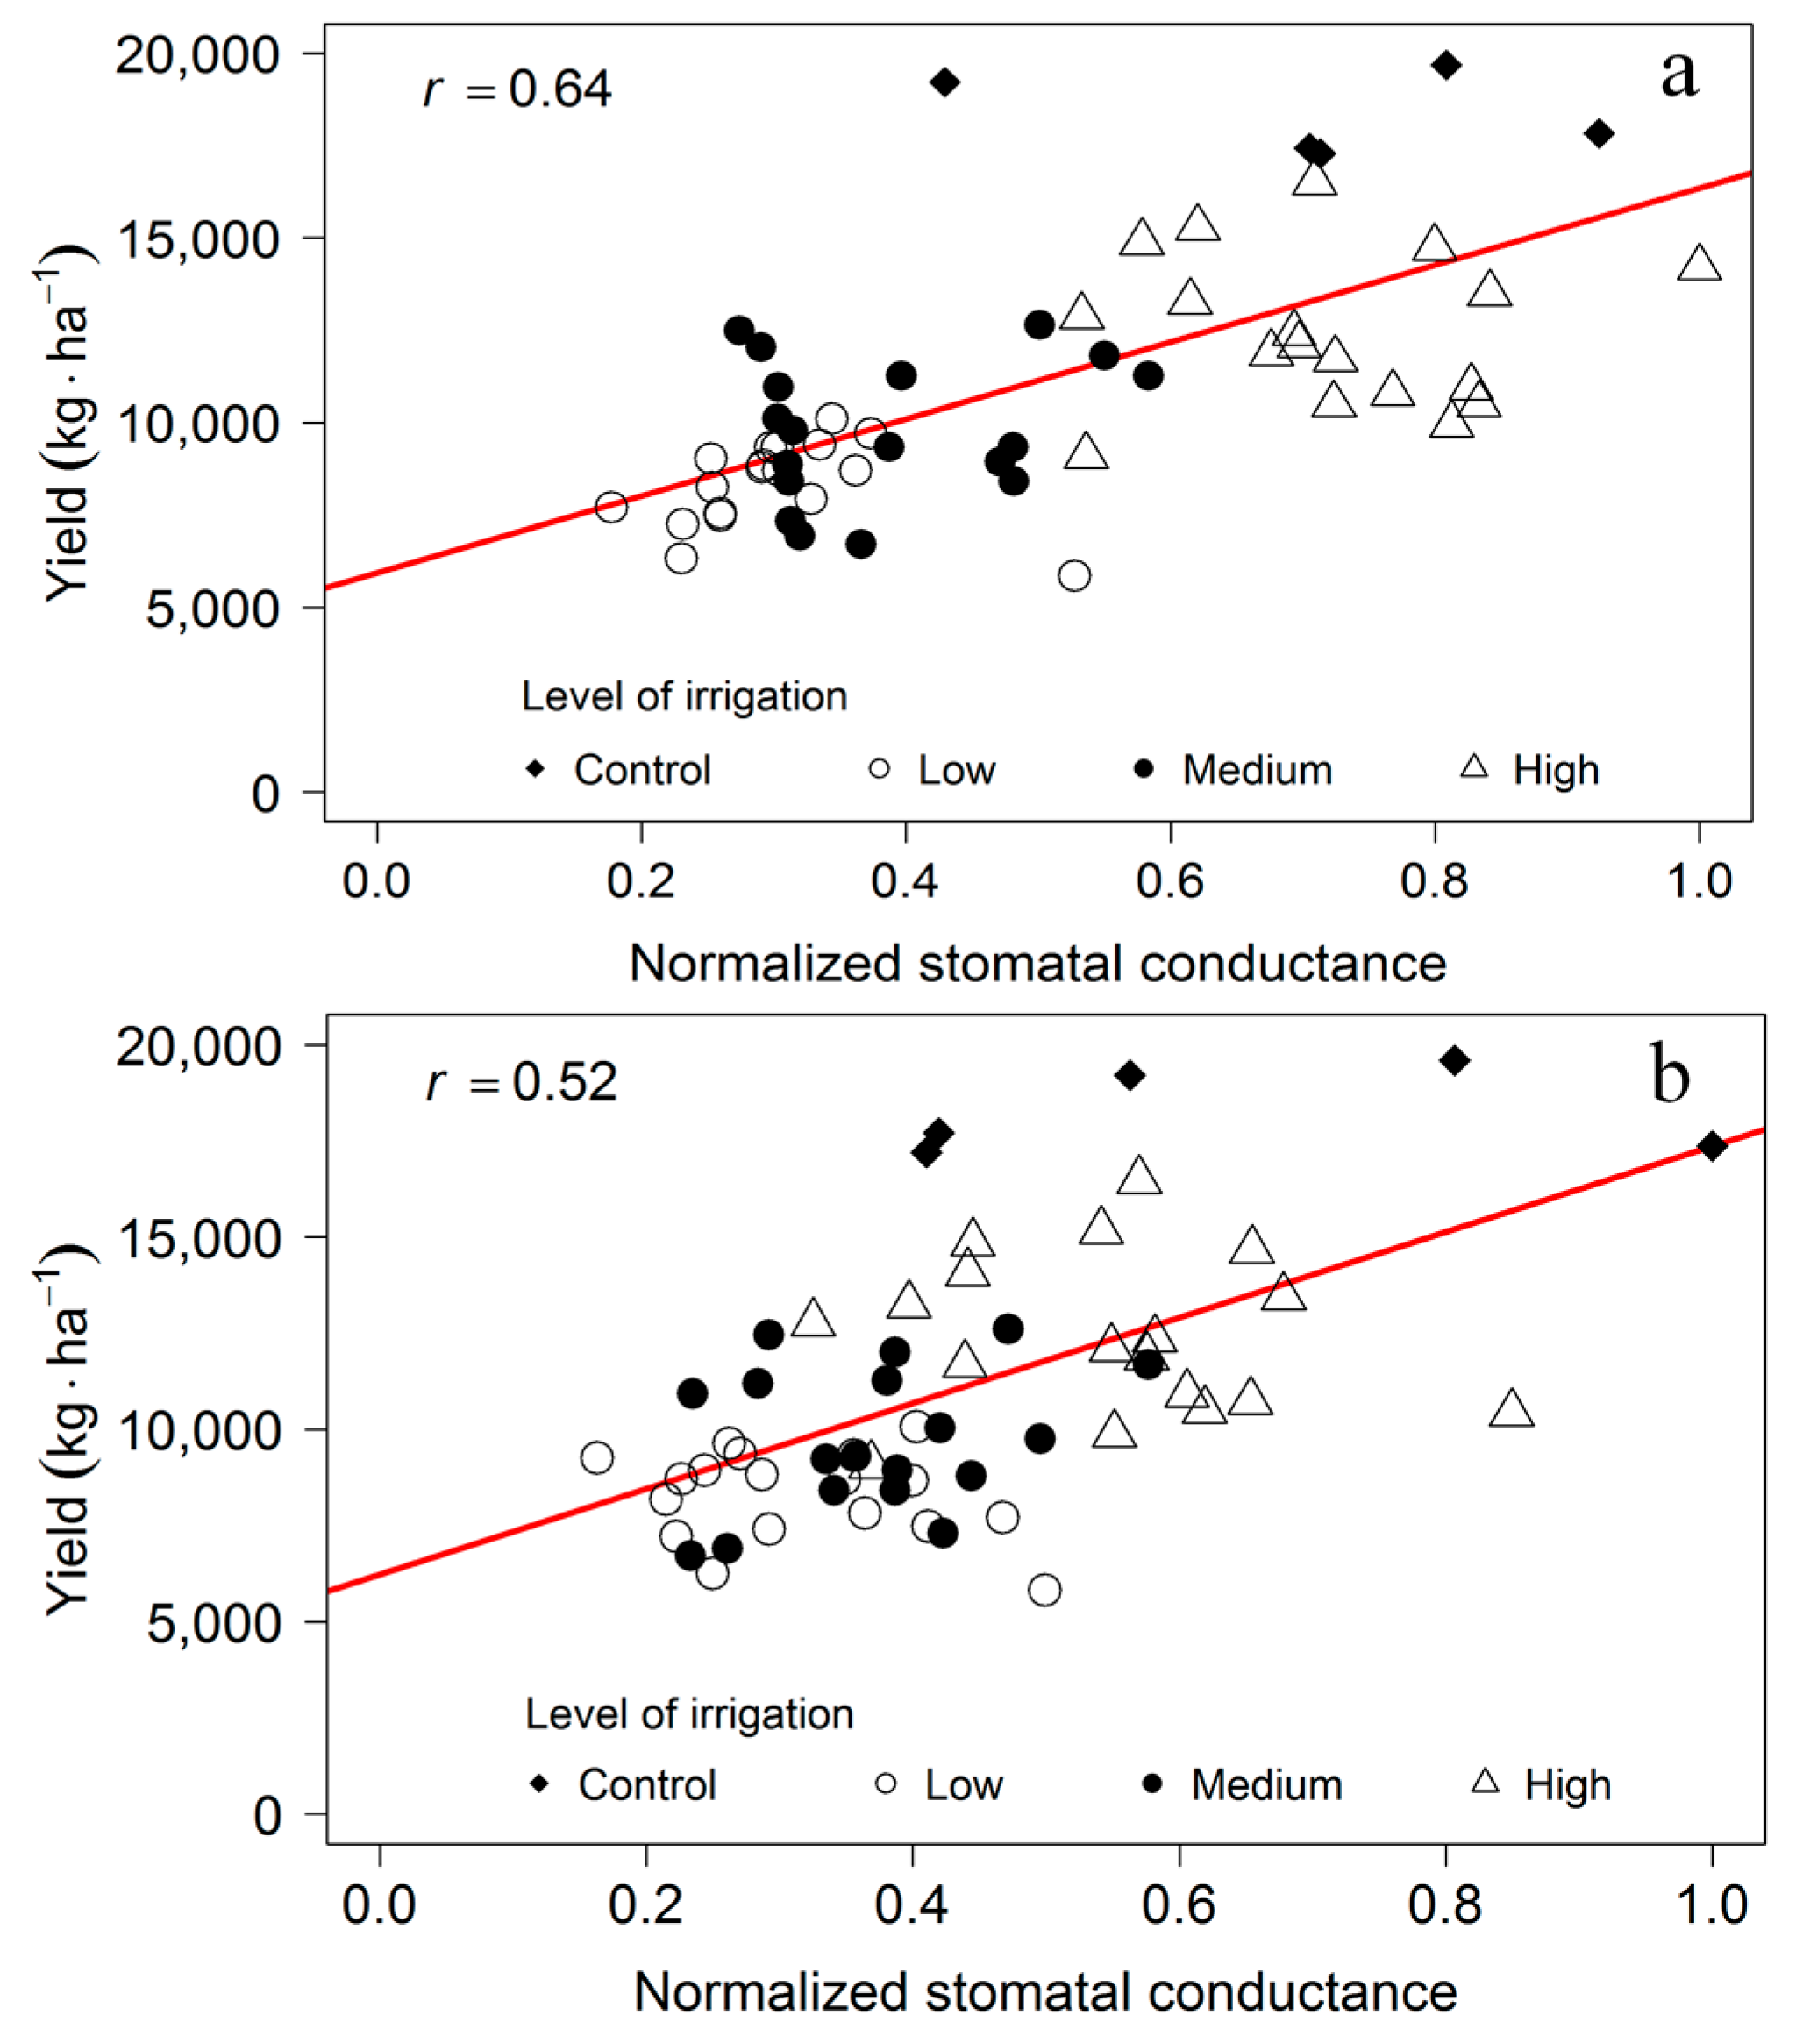
Figure 6.
Normalized difference vegetation index (NDVI) data obtained at (a) 80 and (b) 44 DBH. In the boxplot, the upper and lower whiskers represent the maximum and minimum values, the upper and lower box borders represent the 75th and 25th percentile values, respectively, and the horizontal dark line indicates the median. C = control, 100% standard irrigation rate; L = low level of irrigation, 15%; M = medium level of irrigation, 30%; H = high level of irrigation, 60%.

Figure 7.
Green normalized difference vegetation index (GNDVI) data obtained at (a) 80 and (b) 44 DBH. In the boxplot, the upper and lower whiskers represent the maximum and minimum values, the upper and lower box borders represent the 75th and 25th percentile values, respectively, and the horizontal dark line indicates the median. C = control, 100% standard irrigation rate; L = low level of irrigation, 15%; M = medium level of irrigation, 30%; H = high level of irrigation, 60%.

Figure 8.
Correlations between (a) NDVI and (b) GNDVI data with the fruit yield at 44 DBH.

Figure 9.
Correlations between (a) NDVI and (b) GNDVI data with stomatal conductance at 44 DBH.

Figure 10.
Canopy temperature data obtained at (a) 80 and (b) 44 DBH. In the boxplot, the upper and lower whiskers represent the maximum and minimum values, the upper and lower box borders represent the 75th and 25th percentile values, respectively, and the horizontal dark line indicates the median. C = control, 100% standard irrigation rate; L = low level of irrigation, 15%; M = medium level of irrigation, 30%; H = high level of irrigation, 60%.

Figure 11.
Correlation between canopy temperature and normalized stomatal conductance at (a) 80 and (b) 44 DBH.
Figure 11.
Correlation between canopy temperature and normalized stomatal conductance at (a) 80 and (b) 44 DBH.

Figure 12.
Correlation between canopy temperature and yield at (a) 80 and (b) 44 DBH.


Table 1.
Treatment distribution in the experimental site.
| Irrigation treatment | Parameter |
|---|---|
| Technique | Pulse and Continuous |
| Level (for each technique), % | 15 (Low), 30 (Medium), 60 (High) |
| Depth (for each level and technique), cm | 30, 60, 90 |
© 2017 by the authors. Licensee MDPI, Basel, Switzerland. This article is an open access article distributed under the terms and conditions of the Creative Commons Attribution (CC BY) license (http://creativecommons.org/licenses/by/4.0/).
Share and Cite
MDPI and ACS Style
Espinoza, C.Z.; Khot, L.R.; Sankaran, S.; Jacoby, P.W. High Resolution Multispectral and Thermal Remote Sensing-Based Water Stress Assessment in Subsurface Irrigated Grapevines. Remote Sens. 2017, 9, 961. https://doi.org/10.3390/rs9090961
AMA Style
Espinoza CZ, Khot LR, Sankaran S, Jacoby PW. High Resolution Multispectral and Thermal Remote Sensing-Based Water Stress Assessment in Subsurface Irrigated Grapevines. Remote Sensing. 2017; 9(9):961. https://doi.org/10.3390/rs9090961
Chicago/Turabian StyleEspinoza, Carlos Zúñiga, Lav R. Khot, Sindhuja Sankaran, and Pete W. Jacoby. 2017. "High Resolution Multispectral and Thermal Remote Sensing-Based Water Stress Assessment in Subsurface Irrigated Grapevines" Remote Sensing 9, no. 9: 961. https://doi.org/10.3390/rs9090961
Note that from the first issue of 2016, this journal uses article numbers instead of page numbers. See further details here.