Novel Nutrition Profiling of New Zealanders’ Varied Eating Patterns


1
Eastern Institute of Technology, Napier 4112, New Zealand
2
School of Sport and Recreation, Auckland University of Technology, Auckland 1010, New Zealand
*
Author to whom correspondence should be addressed.
Nutrients 2018, 10(1), 30; https://doi.org/10.3390/nu10010030
Submission received: 25 October 2017
/
Revised: 10 December 2017
/
Accepted: 20 December 2017
/
Published: 31 December 2017
Abstract
:There is increasing recognition that the relationship between nutrition and health is influenced by complex eating behaviors. The aims of this study were to develop novel nutrition profiles of New Zealanders and to describe the prevalence of these profiles. Observational, cross-sectional data from the Sovereign Wellbeing Index, 2014 was used to develop the profiles in an a-priori process. Descriptive prevalence for the total data (N = 10,012; 4797 males; 18+ years) and profiles were reported. Nutrition question responses were presented as: Includers (consumed few time a week or more), Avoiders (few time a month) and Limiters (not eaten). Fruit or non-starchy vegetables were Included (fruit: 83.4%, 95% confidence interval (CI: 82.7, 84.1); vegetables: 82.6% (81.8, 83.4)) by the majority of the sample. Also Included were confectionary (48.6% 95% CI (47.6, 49.6)) and full sugar drinks (34.3% (33.4, 35.2)). The derived nutrition profiles were: Junk Food (22.4% 95% CI (21.6, 23.3)), Moderator (43.0% (42.1, 44.0)), High-Carbohydrate (23.0% (22.2, 23.8)), Mediterranean (11.1% (10.5, 11.8)), Flexitarian (8.8% (8.2, 9.4)), and Low-Carbohydrate (5.4% (4.9, 5.8)). This study suggests that New Zealanders follow a number of different healthful eating patterns. Future work should consider how these alternate eating patterns impact on public health.
1. Introduction
Nutrition, along with physical activity, is one of the major determinants of health and disease [1,2,3,4]. Yet there are a number of issues around the youthful science of public health nutrition that are still to be addressed. One of these is the increasing recognition that the relationship between nutrition and health is influenced by complex eating behaviors and patterns [5]. The more traditional focus on individual nutrient intake is limited in its ability to assess multiple potential interactions [6,7]. A number of authors have argued the benefits of examining dietary patterns as they more closely resembles “real-word” behaviors [5,7,8]. It has also been suggested that a more integrated approach that includes various social science viewpoints is an important future direction for understanding the complexities of nutritional science [9]. This study utilizes a social science viewpoint to broadly describe eating behaviors as a novel approach to the epidemiological study of nutrition and public health.
The impact of overall dietary patterns rather than isolated nutrient intake has increasingly been shown to have importance to metabolic health [5]. Some studies have examined patterns similar to dietary guidelines and the relationship to heart disease. In one study a “Prudent” dietary pattern was linked to a lower risk of coronary heart disease compared to a “Western” dietary pattern [10,11]. In another study the United Kingdoms’ dietary guidelines showed a reduction in risk factors for cardiovascular disease compared to more traditional British eating patterns [12].
Two alternate eating patterns that have also increasingly been examined are the Mediterranean and DASH (Dietary Approaches to Stop Hypertension) diets [5]. A number of meta-analyses have linked the Mediterranean dietary pattern to a reduced risk of coronary heart disease, myocardial infarctions, stroke [13], hypertension [14], metabolic syndrome [15], and diabetes [16,17]. The DASH diet has also been linked to reduced risk of diabetes [17] hypertension [14] and cardiometabolic risk factors [18]. However, some concerns have been raised about the quality of the evidence [19,20].
Other alternate patterns have yet to be studied, however, when food or nutrient-focused studies are examined there are indications that alternate patterns may have benefits to health. For example, carbohydrate restriction has shown evidence of weight loss [21], reduced risk of cardiovascular disease and total mortality [22], along with reductions in diabetic symptoms [23]. Reductions in high-sugar foods and drinks have also been associated with reductions in body weight [24], and have therefore, been linked to reduced risk of non-communicable diseases [25]. Vegetarianism and the permutation of various meat restrictions appear to have equivocal benefits to health, likely due to the large variations in food quality that can be incorporated under the meat restrictive banner [5,26,27]. The next step, therefore, is to develop dietary patterns that incorporate more alternate approaches outside of governmental guidelines, but include food groups linked to good health as described above.
In New Zealand, the governmental guidelines on healthy eating [28], like most developed countries, apply a food-specific approach to what is prescribed and what should be avoided. The guidelines emphasize a diet consisting of predominantly carbohydrates such as fruit, vegetables, and wholegrains; some protein such as lean meats, nuts and seeds, and low-fat or reduced-fat dairy products; and limiting saturated fats of predominantly animal origin. Additionally, they suggest limiting the intake of added salt and sugars [28]. Because of this narrow focus on what constitutes a healthy diet, the monitoring of population nutrition in New Zealand to date has also been limited to whether these recommendations are or are not being followed [29,30,31,32]. With the wealth of knowledge available on the internet, individuals are undoubtedly being exposed to alternate eating paradigms. A recent analysis of popular online books and podcasts reported the most popular nutrition philosophies were low-carbohydrate and vegetarian approaches [33]. This demonstrates an interest in alternate eating patterns, but what we currently do not know is how many people put this interest into practice.
This study, therefore, incorporated two key aims: (i) to use a simple survey, incorporated as part of the Sovereign Wellbeing Index (SWI) [34], to develop novel nutrition profiles of New Zealanders that reflect a broad range of eating patterns; and (ii) to describe the prevalence of these nutrition profiles to provide a broader behavioral viewpoint of New Zealanders eating patterns.
2. Materials and Methods
2.1. Participants
Observational cross-sectional data from the SWI, Round 2 (2014) [34] was used in this study. Participants were recruited through the largest commercial database in New Zealand which ensured complete anonymity for respondents. Round 2 of the SWI comprised 10,012 participants (15.7% response rate). The representativeness of the sample is discussed below. All participants gave their informed consent for inclusion before they participated in the study. The study was conducted in accordance with the Declaration of Helsinki, and the protocol was approved by the Auckland University of Technology Ethics Committee (12/201).
2.2. Data Collection
Participants completed the entire SWI web-based survey on wellbeing (65 items), health and lifestyle (64 items), and demographics (20 items), which took around (median) 21 min to complete. Data was collected in the middle of the New Zealand spring season between 1 October 2014 and 3 November 2014 (33 days). The demographic (age, gender, labor force status, ethnicity, average household income) and nutrition food profiling questions, as described below, was used to develop the nutritional profiles. The remainder of the data from the SWI is described elsewhere [34].
There were 21 food profiling items which examined the consumption patterns of major food groups to determine whether different food groups were restricted or included in the participants’ diets. These questions addressed participants’ food consumption using the following leader; “On average, over the last four weeks, how often have you consumed the following food?” Six response options were available to participants (Table 1). Responses were classified into three consumption patterns (Avoiders, Limiters, Includers) for each food profiling question for statistical analysis of prevalence. Avoiders were defined as having not eaten a food group, Limiters were defined as consuming a food group a few times a month, and Includers were defined by consumption a few times a week or more often. The nutrition survey questions have previously been content-validated and reliability-tested [35]. Quadratic weighted kappa for test-retest reliability showed fair to excellent strength of agreement for 20 out of the 21 nutrition survey questions.
2.3. Profiling Procedures
Novel nutrition profiles were devised through an investigator-driven process utilizing an expert panel. The panel represented a wide range of expert knowledge in the areas of public health, nutrition, and physical activity and included a New Zealand Registered Dietitian, a public health academic specializing in physical activity and nutrition, an exercise physiologist, and two epidemiologists. Investigator-driven profiling methodology was chosen in preference to data-driven clustering analysis, as the aim of this study was to develop and report on the prevalence rates of nutrition patterns linked to positive health outcomes and those common in the popular media.
Initially, some time was spent developing a short list of possible nutrition profiles and selecting the relevant question from the survey to differentiate these profiles. Six profiles were selected, based on current popular eating approaches and governmental dietary guidelines. The profile groups developed were:
Junk Food Group: This group was classified based on the daily consumption of “junk” type foods such as takeaway food, confectionery, and sugary drinks. All the other nutrition profiles were developed from the remainder of the sample once the Junk Food Group and therefore, the high inclusion of “junk” type foods, had been removed.
Flexitarian Group: This group was based on the irregular or non-consumption of white, red and processed meat and was designed to include as many meat restricting groups as possible, such as; ovo-vegetarians, vegetarians, and vegans, and both strict and flexible followers.
High-Carbohydrate Group: This group was classified based on the regular consumption of non-starchy vegetables and grains.
Mediterranean Group: This was a subset of the High-Carbohydrate group and was based on the traits of a Mediterranean diet, which included regular consumption of non-starchy vegetables, grains, olive oil, and either white meat or fish [36].
Low-Carbohydrate Group: This group was classified based on the regular consumption of non-starchy vegetables and a limited consumption of grains.
Moderator Group: The remainder of the sample was classified as the Moderator group, which consumed most of the different food types.
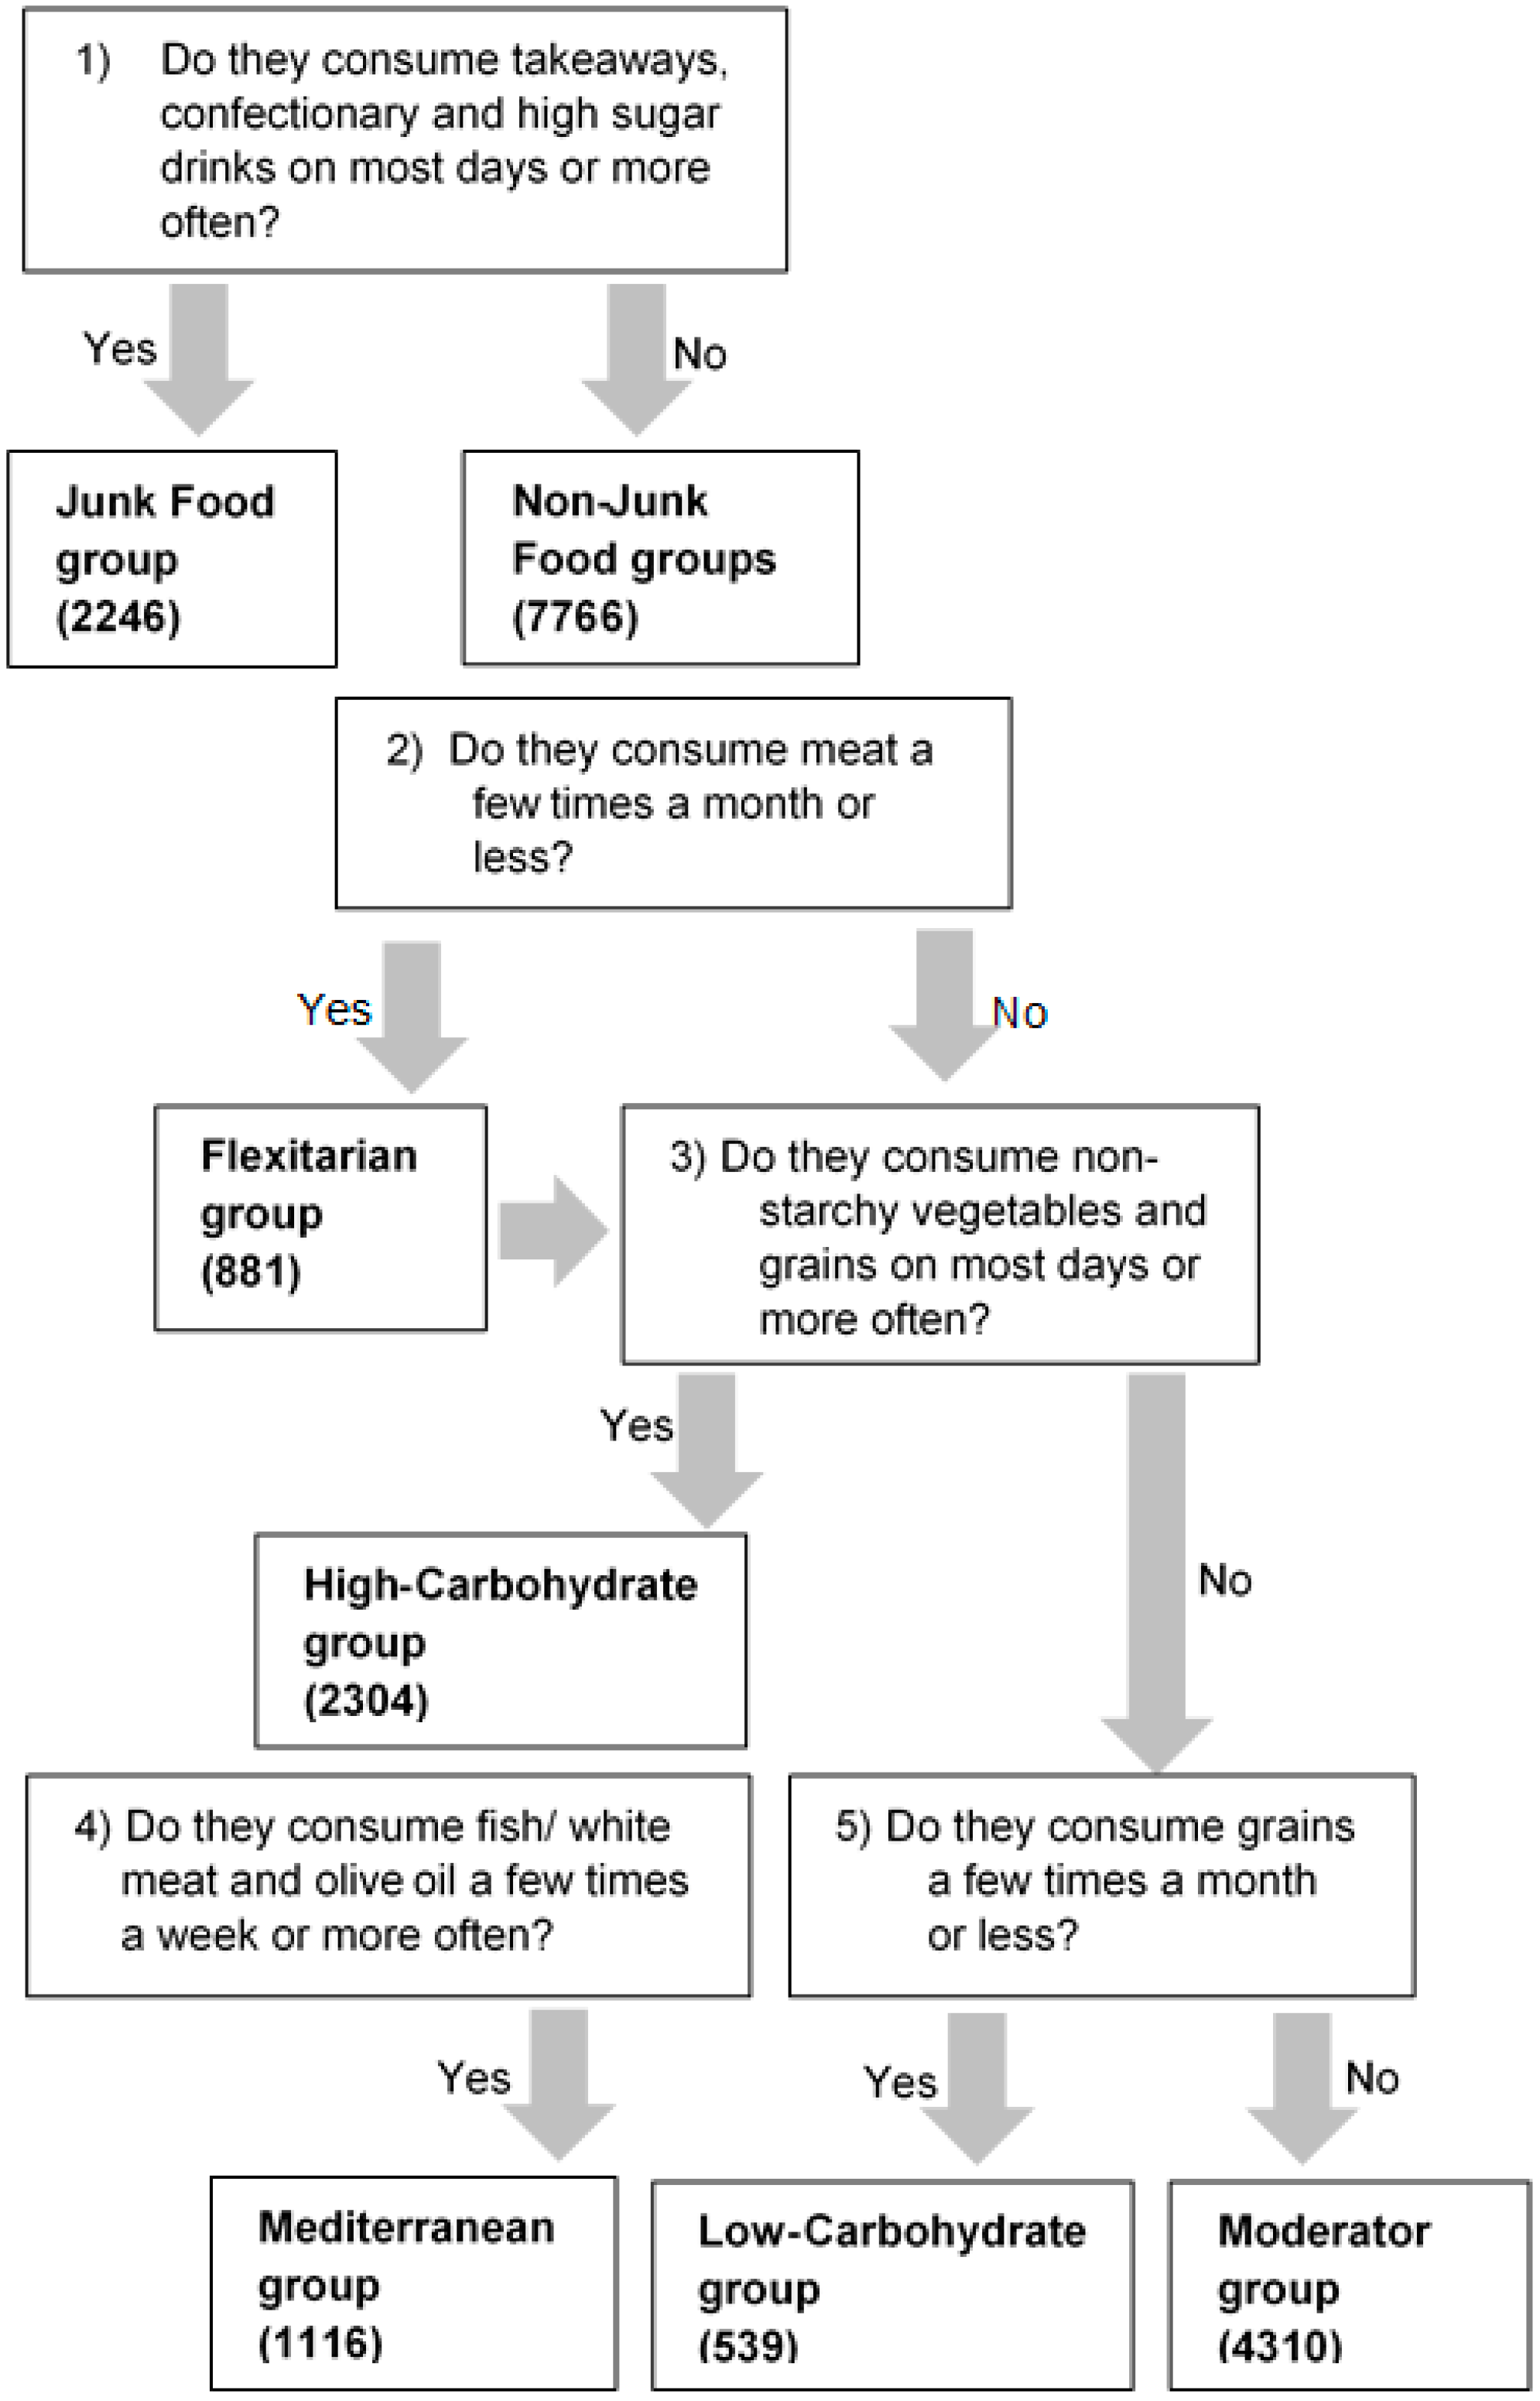
The questions selected from the nutrition section of the SWI that were used to differentiate the profiles in a stepwise approach are shown in Figure 1. Due to this approach, some participants could be classified into more than one group. For example, it was possible for participants profiled into the Flexitarian group to also be profiled into either the High-Carbohydrate, Mediterranean or Low-Carbohydrate groups. Additionally, the Mediterranean group was a sub-group of the High-Carbohydrate group. Full details on the nutrition questions and response options are shown in Table 1.
2.4. Data Analysis
Descriptive statistics were used to describe both the profile groups and responses to the individual nutrition questions. Incomplete or non-response data were excluded on a per question basis. This included system missing data and responses of “prefer not to answer”. Further details on data handling for the full survey can be found in [37].
Survey data were analyzed using IBM SPSS Statistics (version 24, Armonk, NY, USA). The SPSS custom tables function was used to describe the total sample simple prevalence (frequency counts and percentage) for each nutrition question. The SPSS syntax editor was used to profile the data into the six nutrition profiles (Junk Food, Low Carbohydrate, High Carbohydrate, Flexitarian, Mediterranean, Moderator groups) from specific question responses as shown in Figure 1.
The SPSS crosstabs function was used to derive the descriptive prevalence estimates (frequency counts and percentage) for the nutrition profiles. Cross-tabulations were also used to determine the overlap between profile groups. A margin of error around the prevalence estimates was indicated using 95% confidence intervals (CI). Results are given as % (95% CI) unless otherwise stated.
3. Results
3.1. Demographics of Total Sample
The demographics of the participants from Round 2 of the SWI which were used to develop the nutrition profiles showed a predominant European ethnicity, and were predominantly in employment. The gender, household income, and age distribution of participants were fairly uniform, except for a smaller sample group in the under 20-year age group, and a larger group in the under $30,000 income bracket (Table 2). When the SWI data was compared to the New Zealand 2013 census probability samples [38], similar prevalence were seen for gender (% variance; males 0.6, females −0.6), age (% variance range; −2.0 to 1.7), ethnicity (% variance range; −0.8 to 5.8), and labor force status (% variance range; −3.9 to 0.2). Smoking status was also similar (% variance; smokers 0.5, non-smokers −0.5).
3.2. Prevalence of the Nutrition Profile Groups
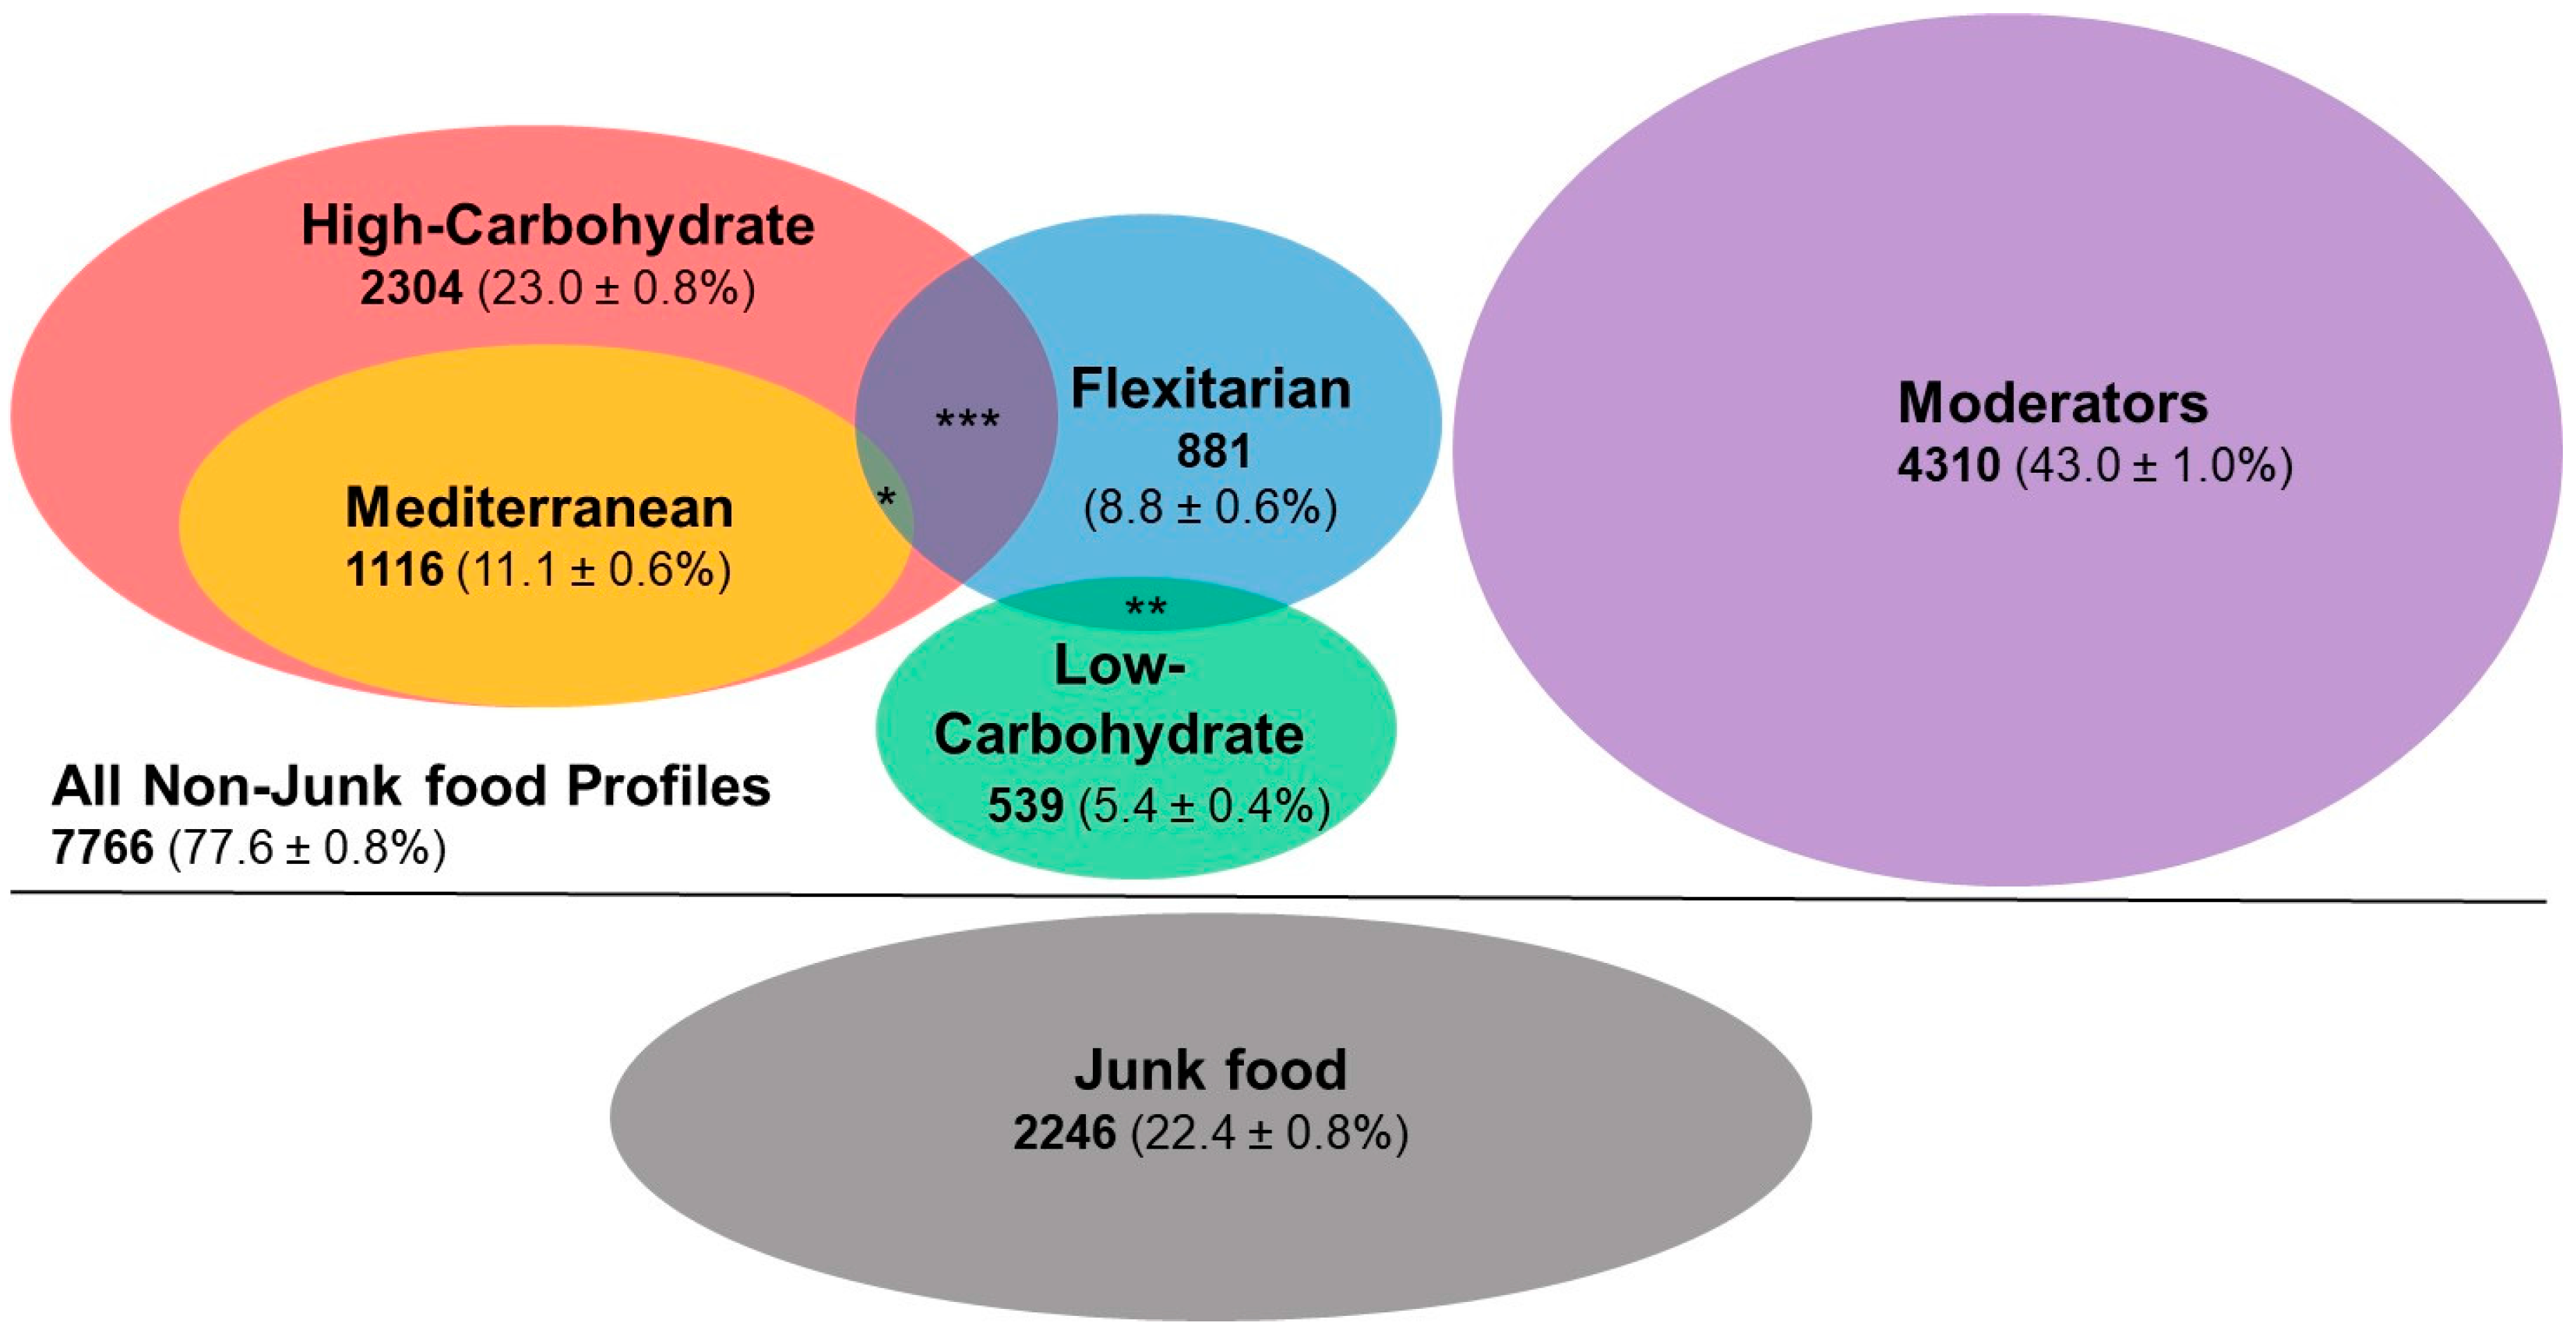
Figure 2 presents the nutrition profiles, indicating overlaps where appropriate. The Junk Food Group contained almost a quarter of the sample; of the other five profile groups, the largest was the Moderator group, with the Low-Carbohydrate group being the smallest. There was some overlap between profile groups, with the largest overlap occurring between the Flexitarian and High-Carbohydrate groups.
3.3. Demographics of the Nutrition Profile Groups
A greater percentage of females were in the High-Carbohydrate (55.5%, 95% CI (53.4, 57.5)), Low-Carbohydrate (61.3%, (57.1, 65.4)), Mediterranean (57.6% (54.7, 60.5)), and Flexitarian (56.2% (52.9, 59.5)) groups, compared to the total sample (51.0%). The Junk Food Group showed similar prevalence across genders (females: 50.0% (47.9, 52.1)), and the Moderator group showed a slightly greater number of males (51.2% (49.7, 52.7)). There were also some differences in age group distributions across food profiles. The 20–29 years age group was over-represented in the Junk Food Group (26.8% (24.9, 28.8)), whereas the 50–59 years and 60+ years age groups were over-represented in the Low-Carbohydrate group (27.9% (23.8, 31.9), 25.1% (21.2, 29.0) respectively). The 60 years and over was over-represented in the High-Carbohydrate group (23.4% (21.5, 25.2)).
3.4. Prevalence for Individual Nutrition Questions
Table 3 presents the prevalence of Avoiders, Limiters, and Includers for each food profiling question across the profile groups. Across the total sample, 16.6% Avoided or Limited fruit, and 17.4% Avoided or Limited non-starchy vegetables. A high proportion of the sample Included confectionery and full-sugar drinks in their diets on a regular basis. Of the animal proteins, fish and shellfish were the most commonly Avoided or Limited. Grains were Included regularly in the diet for the majority of the sample.
The Flexitarian profile group had a higher prevalence of grain Limiters than the total sample. The Flexitarian group also restricted a number of different food groups in addition to animal product food groups.
The Moderator profile group had a higher prevalence of grain Includers compared to the total sample. The Moderator group had a pattern of a high prevalence of Includers across many of the food groups.
Though grain restriction was a profiling question for the Low-Carbohydrate group there were more Avoiders than Limiters for this food group. Additionally, the prevalence of Includers for starchy vegetables was lower than for the total sample. Though frequent consumption of confectionery and full sugar drinks were excluded from all groups except the Junk Food Group during the profiling process, the Low-Carbohydrate group showed the highest prevalence of Avoiders for these two food groups across all the other nutrition profiles.
In addition to the classification questions for the Junk Food profile, this group had the highest prevalence of Includers for butter and non-butter spreads, processed meat, and cakes and biscuits. Like the Moderator group, the Junk Food Group had a pattern of a high prevalence of Includers across a number of food groups.
The High-Carbohydrate group had a similar pattern to its sub-group, the Mediterranean profile group. The greatest prevalence of takeaway Limiters was in the High-Carbohydrate group. The Mediterranean group had the highest prevalence of olive oil Includers which was a classification question for this group. This group had the second highest prevalence of confectionery Includers.
4. Discussion
This study proposed a novel profiling system to examine New Zealander eating behaviors. A key finding was that the majority of New Zealanders include some form of “healthful” behavior most of the time. Three-quarters of the sample included food or food groups regularly that previous research has linked to improved metabolic health. However, a quarter of the sample was classified into the Junk Food Group and was therefore considered to have an “unhealthful” behavior pattern.
The profiling of nutrition behaviors that include patterns outside of the current governmental guidelines has been called for by a number of authors [5,7,8]. Ten years ago [9], a call was made for a shift away from nutrients to a more food-focused science of nutrition. This is beginning to occur and recent work has begun to show that cardiometabolic diseases are influenced by foods and combinations of foods in overall dietary patterns, rather than by individual nutrients [5]. Additionally, a multidisciplinary approach to nutrition that includes a social science paradigm has been suggested as a move towards understanding the complex interactions between eating behavior and the health consequences of those behaviors [9].
This study is the first that the authors are aware of that has attempted to describe a broad range of eating behavior patterns and included alternate patterns such as low-carbohydrate eating. This approach offers a way forward to help gain further insight into population health and eating and as a potential avenue towards future health promotion.
4.1. Future Directions
This study is an initial step in the observation of alternate eating paradigms in New Zealanders. Further work is still required to help understand the motivations behind various food choices to understand whether individuals are consciously choosing to follow specific dietary patterns and if so why. Genetic variations undoubtedly play a role in food choice, as well as the impact on the resulting health outcomes. The research field of epigenetics, nutrigenetics, and nutrigenomics [39] are likely to provide some interesting future implications around individualised food choices and may help us understand why certain eating patterns work better for some individuals than others. Future approaches to public health research should consider incorporating a broader approach in order to move towards a more positive health paradigm. More work in this area is now required. Although this work is specific to New Zealand, future comparisons should be made with other developed countries with similar governmental nutrition guidelines.
4.2. Study Limitations
Several study limitations should be noted. This is an observational study and therefore can identify trends that would benefit from further study; however, causal relationships cannot be inferred. Also, like all self-reported nutrition data, under-reporting of foods should be a consideration [40]. Seasonality may also have impacted on the results, as the data was collected over the New Zealand spring season.
The brevity of the survey questions was both a benefit, in that it increased the potential sample size by reducing cognitive load as well as increasing ease of collection; however, it also limited the detail that could be delineated from the data. If the definition of groups had been made more specific, the size of some of the profile groups would have been very small. Therefore, groups such as vegetarian and vegans were included in a single profile (Flexitarian), and this may have led to the overall group pattern of exclusion. This may be also an explanation for some of the other unexpected patterns of exclusion or inclusion seen across profile groups.
Due to the step-wise profiling process, the size of all the profile groups apart from the Junk Food Group and the default Moderator group may actually be larger than described here. The Junk Food profile was defined first and excluded any participants that consumed takeaways, full sugar drinks, and confectionary daily from the other profile groups, even if they followed any other dietary patterns. Additionally, the definitions of the dietary patterns profiled in this study were consciously broad and based on the fundamental characteristics of the various eating patterns. Currently, dietary patterns are not well defined and, therefore, the wider definitions used here may have described larger groups than those that consciously follow specific eating patterns.
The nutrition questions included in the SWI were reviewed for re-test reliability and content validity [35]; however, due to the timing of the SWI, modification of questions was not possible prior to data collection. The nutrition profiling question on full sugar drinks showed poor agreement for test-retest reliability. This question was used as a key profiling question for separation of the Junk Food Group from the remainder of the nutrition profiles. This is acknowledged as limitation could affect the size of the profile groups.
Finally, this study involved an investigator-driven approach to profiling as selected dietary patterns were the focus of this study. Though not necessarily a limitation, this requires acknowledgement and a suggestion that a future line of inquiry may be an interview-based validation of the profiling process used here.
5. Conclusions
Since the current population level monitoring surveys in New Zealand [30,31,32,41] are predominantly designed around understanding to what extent the governmental eating guidelines have been met, nutritional information is typically gathered via an interviewer-driven dietary history, comprising of a 24 h diet recall and a food frequency questionnaire. Foods are then quantified as healthy or unhealthy as defined by the guidelines [28]. The data itself provides a good account of individual food intake, but this provides only a narrow view of nutrition patterns or approaches. This study indicates that New Zealanders follow a number of different eating patterns, that could be considered healthful; therefore, a more comprehensive approach to monitoring is needed in order to more fully understand how these alternate eating patterns impact on public health.
Acknowledgments
The Sovereign Wellbeing Index was funded by Sovereign. No other funding sources have been provided outside of the doctoral study funding from Auckland University of Technology.
Author Contributions
All authors (G.S., O.M., L.M., C.Z.) conceived and designed the study. O.M. and L.M. analyzed and interpreted the data. O.M. wrote the paper with input from the other authors (L.M., G.S., C.Z.). All authors contributed substantially to the work reported.
Conflicts of Interest
The views expressed in the submitted article are the authors’ own and not an official position of the institution or funder. The authors declare no conflict of interest. The founding sponsors had no role in the design of the study; in the collection, analyses, or interpretation of data; in the writing of the manuscript, and in the decision to publish the results.
References
- World Health Organization. Obesity: Prevention and Managing the Global Epidemic: Report of a WHO Consultation; WHO Technical Report Series No. 894; World Health Organization: Geneva, Switzerland, 2000. [Google Scholar]
- Steyn, N.P.; Mann, J.; Bennett, P.H.; Temple, N.; Zimmet, P.; Tuomilehto, J.; Lindström, J.; Louheranta, A. Diet, nutrition and the prevention of type 2 diabetes. Public Health Nutr. 2004, 7, 147–165. [Google Scholar] [CrossRef] [PubMed]
- Reddy, K.S.; Katan, M.B. Diet, nutrition and the prevention of hypertension and cardiovascular diseases. Public Health Nutr. 2004, 7, 167–186. [Google Scholar] [CrossRef]
- Key, T.J.; Schatzkin, A.; Willett, W.C.; Allen, N.E.; Spencer, E.A.; Travis, R.C. Diet, nutrition and the prevention of cancer. Public Health Nutr. 2004, 7, 187–200. [Google Scholar] [CrossRef] [PubMed]
- Mozaffarian, D. Dietary and policy priorities for cardiovascular disease, diabetes, and obesity: A comprehensive review. Circulation 2016, 133, 187–225. [Google Scholar] [CrossRef] [PubMed]
- Hu, F.B. Dietary pattern analysis: A new direction in nutritional epidemiology. Curr. Opin. Lipidol. 2002, 13, 3–9. [Google Scholar] [CrossRef] [PubMed]
- Jacques, P.F.; Tucker, K.L. Are dietary patterns useful for understanding the role of diet in chronic disease? Am. J. Clin. Nutr. 2001, 73, 1–2. [Google Scholar] [PubMed]
- Jacobs, D.R.; Tapsell, L.C. Food, not nutrients, is the fundamental unit in nutrition. Nutr. Rev. 2007, 65, 439–450. [Google Scholar] [CrossRef] [PubMed]
- Pelto, G.H.; Freake, H.C. Social research in an integrated science of nutrition: Future directions. J. Nutr. 2003, 133, 1231–1234. [Google Scholar] [PubMed]
- Hu, F.B.; Rimm, E.; Smith-Warner, S.A.; Feskanich, D.; Stampfer, M.J.; Ascherio, A.; Sampson, L.; Willett, W.C. Reproducibility and validity of dietary patterns assessed with a food-frequency questionnaire. Am. J. Clin. Nutr. 1999, 69, 243–249. [Google Scholar] [PubMed]
- Hu, F.B.; Rimm, E.B.; Stampfer, M.J.; Ascherio, A.; Spiegelman, D.; Willett, W.C. Prospective study of major dietary patterns and risk of coronary heart disease in men. Am. J. Clin. Nutr. 2000, 72, 912–921. [Google Scholar] [PubMed]
- Reidlinger, D.P.; Darzi, J.; Hall, W.L.; Seed, P.T.; Chowienczyk, P.J.; Sanders, T.A.B. How effective are current dietary guidelines for cardiovascular disease prevention in healthy middle-aged and older men and women? A randomized controlled trial. Am. J. Clin. Nutr. 2015, 101, 922–930. [Google Scholar] [CrossRef] [PubMed] [Green Version]
- Grosso, G.; Marventano, S.; Yang, J.; Micek, A.; Pajak, A.; Scalfi, L.; Galvano, F.; Kales, S.N. A comprehensive meta-analysis on evidence of mediterranean diet and cardiovascular disease: Are individual components equal? Crit. Rev. Food Sci. Nutr. 2017, 57, 3218–3232. [Google Scholar] [CrossRef] [PubMed]
- Ndanuko, R.N.; Tapsell, L.C.; Charlton, K.E.; Neale, E.P.; Batterham, M.J. Dietary patterns and blood pressure in adults: A systematic review and meta-analysis of randomized controlled trials. Adv. Nutr. Int. Rev. J. 2016, 7, 76–89. [Google Scholar] [CrossRef] [PubMed]
- Estruch, R.; Ros, E.; Salas-Salvadó, J.; Covas, M.-I.; Corella, D.; Arós, F.; Gómez-Gracia, E.; Ruiz-Gutiérrez, V.; Fiol, M.; Lapetra, J.; et al. Primary prevention of cardiovascular disease with a mediterranean diet. N. Engl. J. Med. 2013, 368, 1279–1290. [Google Scholar] [CrossRef] [PubMed]
- Schwingshackl, L.; Missbach, B.; König, J.; Hoffmann, G. Adherence to a mediterranean diet and risk of diabetes: A systematic review and meta-analysis. Public Health Nutr. 2014, 18, 1292–1299. [Google Scholar] [CrossRef] [PubMed]
- Jannasch, F.; Kröger, J.; Schulze, M.B. Dietary patterns and type 2 diabetes: A systematic literature review and meta-analysis of prospective studies. J. Nutr. 2017, 147, 1174–1182. [Google Scholar] [CrossRef] [PubMed]
- Siervo, M.; Lara, J.; Chowdhury, S.; Ashor, A.; Oggioni, C.; Mathers, J.C. Effects of the dietary approach to stop hypertension (DASH) diet on cardiovascular risk factors: A systematic review and meta-analysis. Br. J. Nutr. 2014, 113, 1–15. [Google Scholar] [CrossRef] [PubMed]
- Liyanage, T.; Ninomiya, T.; Wang, A.; Neal, B.; Jun, M.; Wong, M.G.; Jardine, M.; Hillis, G.S.; Perkovic, V. Effects of the mediterranean diet on cardiovascular outcomes—A systematic review and meta-analysis. PLoS ONE 2016, 11, e0159252. [Google Scholar] [CrossRef] [PubMed]
- Nissensohn, M.; Román-Viñas, B.; Sánchez-Villegas, A.; Piscopo, S.; Serra-Majem, L. The effect of the mediterranean diet on hypertension: A systematic review and meta-analysis. J. Nutr. Educ. Behav. 2016, 48, 42–53. [Google Scholar] [CrossRef] [PubMed]
- Bazzano, L.A.; Hu, T.; Reynolds, K.; Yao, L.; Bunol, C.; Liu, Y.; Chen, C.; Klag, M.J.; Whelton, P.K.; He, J. Effects of low-carbohydrate and low-fat diets. Ann. Int. Med. 2014, 161, 309–318. [Google Scholar] [CrossRef] [PubMed]
- Nakamura, Y.; Okuda, N.; Okamura, T.; Kadota, A.; Miyagawa, N.; Hayakawa, T.; Kita, Y.; Fujiyoshi, A.; Nagai, M.; Takashima, N.; et al. Low carbohydrate diets and cardiovascualr and total mortality in Japanes: A 29-year follow-up of NIPPON DATA80. Br. J. Nutr. 2014, 112, 916–924. [Google Scholar] [CrossRef] [PubMed]
- Schofield, G.; Henderson, G.; Thornley, S.; Crofts, C. Very low-carbohydrate diets in the management of diabetes revisited. N. Z. Med. J. 2016, 129, 67–74. [Google Scholar] [PubMed]
- Te Morenga, L.; Mallard, S.; Mann, J. Dietary sugars and body weight: Systematic review and meta-analyses of randomised controlled trials and cohort studies. Br. Med. J. 2013, 346, e7492. [Google Scholar] [CrossRef] [PubMed]
- World Health Organization. Guideline: Sugars Intake for Adults and Children; World Health Organization: Geneva, Switzerland, 2015. [Google Scholar]
- Key, T.J.; Appleby, P.N.; Rosell, M.S. Health effects of vegetarian and vegan diets. Proc. Nutr. Soc. 2006, 65, 35–41. [Google Scholar] [CrossRef] [PubMed]
- Appleby, P.N.; Thorogood, M.; Mann, J.I.; Key, T.J. The oxford vegetarian study: An overview. Am. J. Clin. Nutr. 1999, 70, 525s–531s. [Google Scholar] [PubMed]
- Ministry of Health. Eating and Activity Guidelines for New Zealand Adults. Available online: http://www.health.govt.nz/publication/eating-and-activity-guidelines-new-zealand-adults (accessed on 1 November 2015).
- Health Promotion Agency. 2016 Health and Lifestyles Survey Questionnaire; Health Promotion Agency Research and Evaluation Unit: Wellington, New Zealand, 2017. [Google Scholar]
- Health Promotion Agency. 2012 Health and Lifestyles Survey; Health Promotion Agency Research and Evaluation Unit: Wellington, New Zealand, 2013. [Google Scholar]
- Ministry of Health. A Focus on Nutrition: Key Findings of the 2008/09 New Zealand Adult Nutrition Survey; Ministry of Health: Wellington, New Zealand, 2011.
- Ministry of Health. Annual Update of Key Results 2015/2016: New Zealand Health Survey; Ministry of Health: Wellington, New Zealand, 2016.
- Prendergast, K. Towards a Framework for Postive Health; Auckland University of Technology: Auckland, New Zealand, 2016. [Google Scholar]
- Mackay, L.M.; Schofield, G.M.; Jarden, A.; Prendergast, K. Sovereign Wellbeing Index; Auckland University of Technology: Auckland, New Zealand, 2015. [Google Scholar]
- Maclaren, O.; Mackay, L.; Schofield, G.; Zinn, C. The development and validation of a new survey tool: The first step to profiling New Zealanders’ eating styles and moving patterns. Aust. N. Z. J. Public Health 2016, 40, 396–397. [Google Scholar] [CrossRef] [PubMed]
- Bach-Faig, A.; Berry, E.M.; Lairon, D.; Reguant, J.; Trichopoulou, A.; Dernini, S.; Medina, F.X.; Battino, M.; Belahsen, R.; Miranda, G.; et al. Mediterranean diet pyramid today. Science and cultural updates. Public Health Nutr. 2011, 14, 2274–2284. [Google Scholar] [CrossRef] [PubMed]
- Human Potential Centre. Sovereign Wellbeing Index (1-2012): Technical Report (Edition 1.0); Auckland University of Technology: Auckland, New Zealand, 2012. [Google Scholar]
- Statistics New Zealand. 2013 Census Data and Reports; Statistics New Zealand: Wellington, New Zealand, 2013.
- Fenech, M.; El-Sohemy, A.; Cahill, L.; Ferguson, L.R.; French, T.A.C.; Tai, E.S.; Milner, J.; Koh, W.P.; Xie, L.; Zucker, M.; et al. Nutrigenetics and nutrigenomics: Viewpoints on the current status and applications in nutrition research and practice. J. Nutr. Nutr. 2011, 4, 69–89. [Google Scholar] [CrossRef] [PubMed]
- Gemming, L.; Jiang, Y.; Swinburn, B.; Utter, J.; Ni Mhurchu, C. Under-reporting remains a key limitation of self-reported dietary intake: An analysis of the 2008/09 New Zealand Adult Nutrition survey. Eur. J. Clin. Nutr. 2013, 259–264. [Google Scholar] [CrossRef] [PubMed]
- Ministry of Health. A Potrait of Health. Key Results of the 2006/07 New Zealand Health Survey; Ministry of Health: Wellington, New Zealand, 2008.
Figure 1.
Questions from the Sovereign Wellbeing Index (2014) used to develop six novel nutrition profiles 1. 1 Numbers in brackets are the nutrition profile group size (n).
Figure 1.
Questions from the Sovereign Wellbeing Index (2014) used to develop six novel nutrition profiles 1. 1 Numbers in brackets are the nutrition profile group size (n).

Figure 2.
Nutrition profiles derived from the Sovereign Wellbeing Index, 2014. Total sample N = 10,012; totals are given for each profile group with % ± 95% confidence limits in brackets; Crossovers percent are percentage of total sample: * High Carb, Mediterranean & Flexitarian 23 (0.2 ± 0.1%); ** Flexitarian & Low Carb 52 (0.5 ± 0.1%); *** High Carb & Flexitarian 216 (2.2 ± 0.3%).

Table 1.
Food profiling questions and response options from the Sovereign Wellbeing Index, 2014.
| Questions | Response Options |
|---|---|
On average over the past 4 weeks, how often have you consumed the following food?
|
|
A = Avoider, L = Limiter, I = Includer.
Table 2.
Demographic data of respondents 1 to the Sovereign Wellbeing Index, 2014.
| N | % | |
|---|---|---|
| Total Population | 10,012 | 100.0 |
| Gender | 9904 | 98.9 |
| Male | 4797 | 47.9 |
| Female | 5107 | 51.0 |
| Age | 8614 | 86.0 |
| under 20 years | 270 | 2.7 |
| 20–29 years | 1692 | 16.9 |
| 30–39 years | 1602 | 16.0 |
| 40–49 years | 1655 | 16.5 |
| 50–59 years | 1694 | 16.9 |
| 60 years and over | 1701 | 17.0 |
| Ethnicity 1 | 10,444 | 97.4 |
| Maori | 956 | 8.9 |
| European | 7605 | 70.9 |
| Pacific people | 310 | 2.9 |
| Asian | 1269 | 11.8 |
| Other | 304 | 2.8 |
| Labour Force Status | 9613 | 96.0 |
| Employed | 5503 | 55.0 |
| Unemployed | 714 | 7.1 |
| Not in the labour force 2 | 2822 | 28.2 |
| Other | 574 | 5.7 |
| Quintiles of Household Income | 7654 | 76.4 |
| ≤$30,000 | 1821 | 18.2 |
| $30,001–$50,000 | 1456 | 14.5 |
| $50,001–$70,000 | 1305 | 13.0 |
| $70,001–$100,000 | 1535 | 15.3 |
| ≥$100,001 | 1537 | 15.4 |
1 Participants could select more than one ethnicity; 2 Neither employed nor unemployed (including retired people, students, home duties, or physical or mental impairment).
Table 3.
The prevalence of different food groups across profile groups 1.
| Food Group | Consumpt-Ion Level 3 | Total Sample | Junk | Flexitarian | Mediterranean | Low-Carbohydrate | High-Carbohydrate | Moderator | ||||||||||||||
|---|---|---|---|---|---|---|---|---|---|---|---|---|---|---|---|---|---|---|---|---|---|---|
| n | % | 95% CI 2 | n | % | 95% CI | n | % | 95% CI | n | % | 95% CI | n | % | 95% CI | n | % | 95% CI | n | % | 95% CI | ||
| Total N | 10,012 | 2246 | 881 | 1116 | 539 | 2304 | 4310 | |||||||||||||||
| All grain products | Avoiders | 413 | 4.3 | (3.9–4.7) | 102 | 4.6 | (3.8–5.5) | 57 | 6.5 | (5.0–8.3) | 0 | 0.0 | (0.0–0.0) | 116 | 21.5 | (18.2–25.1) | 0 | 0.0 | (0.0–0.0) | 145 | 3.7 | (3.1–4.3) |
| Limiters | 1371 | 14.3 | (13.6–15.0) | 290 | 13.0 | (11.7–14.5) | 208 | 23.7 | (21.0–26.6) | 0 | 0.0 | (0.0–0.0) | 423 | 78.5 | (74.9–81.8) | 0 | 0.0 | (0.0–0.0) | 495 | 12.6 | (11.6–13.7) | |
| Includers | 7824 | 81.4 | (80.6–82.2) | 1837 | 82.4 | (80.8–84.0) | 612 | 69.8 | (66.7–72.8) | 1116 | 100.0 | (100.0–100.0) | 0 | 0.0 | (0.0–0.0) | 2304 | 100.0 | (100.0–100.0) | 3287 | 83.7 | (82.5–84.8) | |
| Full-fat dairy products | Avoiders | 951 | 9.9 | (9.3–10.5) | 137 | 6.1 | (5.2–7.2) | 154 | 17.5 | (15.1–20.1) | 112 | 10.0 | (8.4–11.9) | 89 | 16.5 | (13.6–19.8) | 281 | 12.2 | (10.9–13.6) | 354 | 9.0 | (8.2–9.9) |
| Limiters | 1531 | 15.9 | (15.2–16.6) | 281 | 12.6 | (11.3–14.0) | 246 | 28.0 | (25.1–31.0) | 137 | 12.3 | (10.5–14.3) | 112 | 20.8 | (17.5–24.4) | 294 | 12.8 | (11.5–14.2) | 649 | 16.5 | (15.4–17.7) | |
| Includers | 7125 | 74.2 | (73.3–75.1) | 1814 | 81.3 | (79.6–82.8) | 479 | 54.5 | (51.2–57.8) | 866 | 77.7 | (75.2–80.0) | 338 | 62.7 | (58.6–66.7) | 1726 | 75.0 | (73.2–76.7) | 2921 | 74.4 | (73.1–75.8) | |
| Butter | Avoiders | 2612 | 27.2 | (26.3–28.1) | 523 | 23.5 | (21.7–25.3) | 322 | 36.6 | (33.5–39.8) | 226 | 20.3 | (18.0–22.7) | 169 | 31.4 | (27.5–35.4) | 611 | 26.5 | (24.8–28.4) | 1078 | 27.5 | (26.1–28.9) |
| Limiters | 2461 | 25.6 | (24.7–26.5) | 470 | 21.1 | (19.4–22.8) | 284 | 32.3 | (29.2–35.4) | 304 | 27.2 | (24.7–29.9) | 128 | 23.7 | (20.3–27.5) | 640 | 27.8 | (26.0–29.7) | 1024 | 26.1 | (24.8–27.5) | |
| Includers | 4530 | 47.2 | (46.2–48.2) | 1235 | 55.4 | (53.4–57.5) | 274 | 31.1 | (28.1–34.3) | 586 | 52.5 | (49.6–55.4) | 242 | 44.9 | (40.7–49.1) | 1051 | 45.7 | (43.6–47.7) | 1820 | 46.4 | (44.8–48.0) | |
| Low-fat dairy products | Avoiders | 2216 | 23.1 | (22.3–23.9) | 471 | 21.2 | (19.6–23.0) | 269 | 30.5 | (27.6–33.6) | 213 | 19.1 | (16.9–21.5) | 181 | 33.6 | (29.7–37.6) | 502 | 21.8 | (20.2–23.5) | 872 | 22.2 | (21.0–23.6) |
| Limiters | 1723 | 18.0 | (17.2–18.8) | 383 | 17.3 | (15.7–18.9) | 229 | 26.0 | (23.2–29.0) | 135 | 12.1 | (10.3–14.1) | 99 | 18.4 | (15.3–21.8) | 298 | 13.0 | (11.6–14.4) | 757 | 19.3 | (18.1–20.6) | |
| Includers | 5654 | 58.9 | (57.9–59.9) | 1366 | 61.5 | (59.5–63.5) | 383 | 43.5 | (40.2–46.8) | 767 | 68.8 | (66.0–71.5) | 259 | 48.1 | (43.9–52.3) | 1501 | 65.2 | (63.3–67.2) | 2291 | 58.4 | (56.9–60.0) | |
| Eggs | Avoiders | 623 | 6.5 | (6.0–7.0) | 171 | 7.7 | (6.6–8.8) | 151 | 17.2 | (14.8–19.8) | 25 | 2.2 | (1.5–3.2) | 42 | 7.8 | (5.8–10.3) | 120 | 5.2 | (4.4–6.2) | 193 | 4.9 | (4.3–5.6) |
| Limiters | 2502 | 26.0 | (25.1–26.9) | 534 | 24.0 | (22.2–25.8) | 358 | 40.7 | (37.5–44.0) | 203 | 18.2 | (16.0–20.5) | 131 | 24.3 | (20.9–28.1) | 528 | 22.9 | (21.3–24.7) | 1035 | 26.4 | (25.0–27.8) | |
| Includers | 6481 | 67.5 | (66.6–68.4) | 1523 | 68.4 | (66.4–70.3) | 370 | 42.1 | (38.9–45.4) | 888 | 79.6 | (77.1–81.9) | 365 | 67.8 | (63.8–71.7) | 1654 | 71.9 | (70.0–73.7) | 2698 | 68.7 | (67.3–70.2) | |
| Margarine or other non-butter spreads | Avoiders | 2470 | 25.7 | (24.8–26.6) | 478 | 21.5 | (19.9–23.3) | 303 | 34.5 | (31.4–37.7) | 307 | 27.5 | (24.9–30.2) | 223 | 41.4 | (37.3–45.6) | 644 | 28.0 | (26.2–29.8) | 930 | 23.7 | (22.4–25.0) |
| Limiters | 1357 | 14.1 | (13.4–14.8) | 272 | 12.2 | (10.9–13.7) | 215 | 24.5 | (21.7–27.4) | 115 | 10.3 | (8.6–12.2) | 76 | 14.1 | (11.4–17.2) | 267 | 11.6 | (10.3–13.0) | 577 | 14.7 | (13.6–15.8) | |
| Includers | 5774 | 60.1 | (59.1–61.1) | 1471 | 66.2 | (64.2–68.2) | 361 | 41.1 | (37.9–44.3) | 694 | 62.2 | (59.3–65.0) | 240 | 44.5 | (40.4–48.7) | 1391 | 60.4 | (58.4–62.4) | 2421 | 61.6 | (60.1–63.1) | |
| Oils: olive, avocado, macadamia, coconut | Avoiders | 2796 | 29.2 | (28.3–30.1) | 697 | 31.4 | (29.5–33.4) | 310 | 35.2 | (32.1–38.4) | 0 | 0.0 | (0.0–0.0) | 147 | 27.4 | (23.7–31.3) | 524 | 22.8 | (21.1–24.6) | 1191 | 30.4 | (29.0–31.8) |
| Limiters | 2283 | 23.8 | (22.9–24.7) | 462 | 20.8 | (19.2–22.5) | 267 | 30.3 | (27.3–33.4) | 0 | 0.0 | (0.0–0.0) | 108 | 20.1 | (16.9–23.7) | 522 | 22.7 | (21.1–24.5) | 981 | 25.0 | (23.7–26.4) | |
| Includers | 4508 | 47.0 | (46.0–48.0) | 1061 | 47.8 | (45.7–49.9) | 304 | 34.5 | (31.4–37.7) | 1116 | 100.0 | (100.0–100.0) | 282 | 52.5 | (48.3–56.7) | 1250 | 54.4 | (52.4–56.5) | 1749 | 44.6 | (43.1–46.2) | |
| Oils: any other vegetable oil | Avoiders | 1902 | 19.8 | (19.0–20.6) | 388 | 17.4 | (15.9–19.1) | 229 | 26.1 | (23.2–29.0) | 198 | 17.8 | (15.6–20.1) | 167 | 31.0 | (27.2–35.0) | 389 | 16.9 | (15.4–18.5) | 783 | 20.0 | (18.8–21.3) |
| Limiters | 2316 | 24.2 | (23.3–25.1) | 476 | 21.4 | (19.7–23.1) | 312 | 35.5 | (32.4–38.7) | 171 | 15.3 | (13.3–17.5) | 117 | 21.7 | (18.4–25.4) | 472 | 20.5 | (18.9–22.2) | 994 | 25.4 | (24.0–26.7) | |
| Includers | 5372 | 56.0 | (55.0–57.0) | 1360 | 61.2 | (59.1–63.2) | 338 | 38.5 | (35.3–41.7) | 746 | 66.9 | (64.1–69.6) | 254 | 47.2 | (43.0–51.4) | 1437 | 62.5 | (60.5–64.5) | 2142 | 54.7 | (53.1–56.2) | |
| Red meat | Avoiders | 674 | 7.0 | (6.5–7.5) | 140 | 6.3 | (5.3–7.4) | 356 | 40.4 | (37.2–43.7) | 38 | 3.4 | (2.5–4.6) | 35 | 6.5 | (4.6–8.8) | 193 | 8.4 | (7.3–9.6) | 109 | 2.8 | (2.3–3.3) |
| Limiters | 1479 | 15.4 | (14.7–16.1) | 270 | 12.1 | (10.8–13.5) | 525 | 59.6 | (56.3–62.8) | 92 | 8.2 | (6.7–10.0) | 83 | 15.4 | (12.5–18.6) | 264 | 11.5 | (10.2–12.8) | 446 | 11.4 | (10.4–12.4) | |
| Includers | 7454 | 77.6 | (76.8–78.4) | 1816 | 81.6 | (79.9–83.2) | 0 | 0.0 | (0.0–0.0) | 986 | 88.4 | (86.4–90.1) | 421 | 78.1 | (74.5–81.4) | 1845 | 80.1 | (78.5–81.7) | 3372 | 85.9 | (84.8–86.9) | |
| White meat | Avoiders | 478 | 5.0 | (4.6–5.4) | 92 | 4.1 | (3.4–5.0) | 303 | 34.4 | (31.3–37.6) | 13 | 1.2 | (0.7–1.9) | 31 | 5.8 | (4.0–8.0) | 132 | 5.7 | (4.8–6.7) | 52 | 1.3 | (1.0–1.7) |
| Limiters | 1252 | 13.0 | (12.3–13.7) | 235 | 10.5 | (9.3–11.9) | 578 | 65.6 | (62.4–68.7) | 26 | 2.3 | (1.6–3.3) | 55 | 10.2 | (7.9–13.0) | 210 | 9.1 | (8.0–10.3) | 310 | 7.9 | (7.1–8.8) | |
| Includers | 7883 | 82.0 | (81.2–82.8) | 1902 | 85.3 | (83.8–86.8) | 0 | 0.0 | (0.0–0.0) | 1077 | 96.5 | (95.3–97.5) | 453 | 84.0 | (80.8–87.0) | 1961 | 85.1 | (83.7–86.6) | 3567 | 90.8 | (89.9–91.7) | |
| Protein powders and or bars | Avoiders | 7049 | 73.5 | (72.6–74.4) | 1475 | 66.5 | (64.5–68.5) | 712 | 81.0 | (78.3–83.5) | 826 | 74.1 | (71.5–76.7) | 416 | 77.6 | (73.9–81.0) | 1815 | 78.9 | (77.2–80.6) | 2856 | 72.9 | (71.4–74.2) |
| Limiters | 1138 | 11.9 | (11.3–12.5) | 295 | 13.3 | (11.9–14.8) | 102 | 11.6 | (9.6–13.8) | 116 | 10.4 | (8.7–12.3) | 47 | 8.8 | (6.6–11.4) | 222 | 9.7 | (8.5–10.9) | 493 | 12.6 | (11.6–13.6) | |
| Includers | 1397 | 14.6 | (13.9–15.3) | 447 | 20.2 | (18.5–21.9) | 65 | 7.4 | (5.8–9.3) | 172 | 15.4 | (13.4–17.7) | 73 | 13.6 | (10.9–16.7) | 262 | 11.4 | (10.1–12.7) | 571 | 14.6 | (13.5–15.7) | |
| Processed meat | Avoiders | 2152 | 22.4 | (21.6–23.2) | 357 | 16.0 | (14.6–17.6) | 498 | 56.5 | (53.2–59.8) | 235 | 21.1 | (18.7–23.5) | 163 | 30.4 | (26.6–34.3) | 576 | 25.0 | (23.3–26.8) | 750 | 19.1 | (17.9–20.4) |
| Limiters | 4229 | 44.0 | (43.0–45.0) | 800 | 36.0 | (34.0–38.0) | 383 | 43.5 | (40.2–46.8) | 514 | 46.1 | (43.1–49.0) | 256 | 47.7 | (43.5–51.9) | 1057 | 45.9 | (43.9–48.0) | 1809 | 46.1 | (44.5–47.6) | |
| Includers | 3222 | 33.6 | (32.7–34.5) | 1068 | 48.0 | (45.9–50.1) | 0 | 0.0 | (0.0–0.0) | 367 | 32.9 | (30.2–35.7) | 118 | 22.0 | (18.6–25.6) | 669 | 29.1 | (27.2–30.9) | 1367 | 34.8 | (33.3–36.3) | |
| Fish and shellfish | Avoiders | 2172 | 22.5 | (21.7–23.3) | 532 | 23.8 | (22.0–25.5) | 368 | 42.0 | (38.7–45.2) | 121 | 10.8 | (9.1–12.8) | 109 | 20.2 | (17.0–23.8) | 435 | 18.9 | (17.3–20.5) | 848 | 21.5 | (20.2–22.8) |
| Limiters | 4560 | 47.3 | (46.3–48.3) | 937 | 41.8 | (39.8–43.9) | 380 | 43.3 | (40.1–46.6) | 525 | 47.0 | (44.1–50.0) | 275 | 51.0 | (46.8–55.2) | 1115 | 48.4 | (46.4–50.4) | 1950 | 49.5 | (47.9–51.0) | |
| Includers | 2903 | 30.1 | (29.2–31.0) | 771 | 34.4 | (32.5–36.4) | 129 | 14.7 | (12.5–17.2) | 470 | 42.1 | (39.2–45.0) | 155 | 28.8 | (25.1–32.7) | 754 | 32.7 | (30.8–34.7) | 1145 | 29.0 | (27.6–30.5) | |
| Fruit | Avoiders | 339 | 3.5 | (3.1–3.9) | 103 | 4.6 | (3.8–5.5) | 46 | 5.2 | (3.9–6.9) | 11 | 1.0 | (0.5–1.7) | 27 | 5.0 | (3.4–7.1) | 30 | 1.3 | (0.9–1.8) | 137 | 3.5 | (2.9–4.1) |
| Limiters | 1260 | 13.1 | (12.4–13.8) | 321 | 14.3 | (12.9–15.8) | 191 | 21.8 | (19.1–24.6) | 40 | 3.6 | (2.6–4.8) | 58 | 10.8 | (8.4–13.6) | 114 | 4.9 | (4.1–5.9) | 589 | 14.9 | (13.8–16.1) | |
| Includers | 8042 | 83.4 | (82.7–84.1) | 1820 | 81.1 | (79.4–82.7) | 640 | 73.0 | (70.0–75.8) | 1065 | 95.4 | (94.1–96.5) | 454 | 84.2 | (81.0–87.1) | 2160 | 93.8 | (92.7–94.7) | 3219 | 81.6 | (80.4–82.8) | |
| Starchy vegetables | Avoiders | 297 | 3.1 | (2.8–3.4) | 64 | 2.9 | (2.2–3.6) | 61 | 7.0 | (5.4–8.8) | 10 | 0.9 | (0.5–1.6) | 37 | 6.9 | (5.0–9.2) | 27 | 1.2 | (0.8–1.7) | 118 | 3.0 | (2.5–3.6) |
| Limiters | 1315 | 13.6 | (12.9–14.3) | 238 | 10.6 | (9.4–11.9) | 272 | 31.1 | (28.1–34.2) | 66 | 5.9 | (4.6–7.4) | 70 | 13.0 | (10.3–16.0) | 184 | 8.0 | (6.9–9.1) | 595 | 15.1 | (14.0–16.2) | |
| Includers | 8022 | 83.3 | (82.6–84.0) | 1940 | 86.5 | (85.1–87.9) | 543 | 62.0 | (58.7–65.2) | 1040 | 93.2 | (91.6–94.6) | 432 | 80.1 | (76.6–83.3) | 2093 | 90.8 | (89.6–92.0) | 3228 | 81.9 | (80.7–83.1) | |
| Non-starchy vegetables | Avoiders | 553 | 5.8 | (5.3–6.3) | 145 | 6.5 | (5.5–7.6) | 88 | 10.1 | (8.2–12.2) | 0 | 0.0 | (0.0–0.0) | 0 | 0.0 | (0.0–0.0) | 0 | 0.0 | (0.0–0.0) | 320 | 8.2 | (7.3–9.1) |
| Limiters | 1113 | 11.6 | (11.0–12.2) | 236 | 10.6 | (9.4–11.9) | 210 | 24.0 | (21.3–26.9) | 0 | 0.0 | (0.0–0.0) | 0 | 0.0 | (0.0–0.0) | 0 | 0.0 | (0.0–0.0) | 667 | 17.0 | (15.9–18.2) | |
| Includers | 7930 | 82.6 | (81.8–83.4) | 1847 | 82.9 | (81.3–84.4) | 576 | 65.9 | (62.7–69.0) | 1116 | 100.0 | (100.0–100.0) | 539 | 100.0 | (100.0–100.0) | 2304 | 100.0 | (100.0–100.0) | 2932 | 74.8 | (73.4–76.2) | |
| Cakes and biscuits 4 | Avoiders | 584 | 6.1 | (5.6–6.6) | 53 | 2.4 | (1.8–3.1) | 108 | 12.3 | (10.3–14.6) | 59 | 5.3 | (4.1–6.7) | 89 | 16.5 | (13.6–19.9) | 112 | 4.9 | (4.0–5.8) | 254 | 6.4 | (5.7–7.2) |
| Limiters | 2676 | 27.8 | (26.9–28.7) | 256 | 11.4 | (10.2–12.8) | 355 | 40.5 | (37.3–43.8) | 242 | 21.7 | (19.3–24.2) | 224 | 41.6 | (37.5–45.8) | 548 | 23.8 | (22.1–25.6) | 1367 | 34.7 | (33.2–36.2) | |
| Includers | 6370 | 66.1 | (65.2–67.0) | 1932 | 86.2 | (84.7–87.6) | 413 | 47.1 | (43.9–50.5) | 815 | 73.0 | (70.4–75.6) | 225 | 41.8 | (37.7–46.0) | 1644 | 71.4 | (69.5–73.2) | 2318 | 58.8 | (57.3–60.4) | |
| Nuts | Avoiders | 1941 | 20.2 | (19.4–21.0) | 434 | 19.5 | (17.9–21.2) | 210 | 23.9 | (21.2–26.9) | 98 | 8.8 | (7.2–10.5) | 123 | 22.9 | (19.5–26.6) | 323 | 14.0 | (12.6–15.5) | 891 | 22.6 | (21.4–24.0) |
| Limiters | 3282 | 34.1 | (33.2–35.0) | 651 | 29.2 | (27.3–31.1) | 294 | 33.5 | (30.5–36.7) | 315 | 28.2 | (25.6–30.9) | 168 | 31.2 | (27.4–35.2) | 739 | 32.1 | (30.2–34.0) | 1495 | 38.0 | (36.5–39.5) | |
| Includers | 4393 | 45.7 | (44.7–46.7) | 1144 | 51.3 | (49.2–53.4) | 373 | 42.5 | (39.3–45.8) | 703 | 63.0 | (60.1–65.8) | 247 | 45.9 | (41.7–50.1) | 1242 | 53.9 | (51.9–55.9) | 1550 | 39.4 | (37.9–40.9) | |
| Confectionary: sweets and chocolate | Avoiders | 1067 | 11.1 | (10.5–11.7) | 48 | 2.1 | (1.6–2.8) | 166 | 19.0 | (16.5–21.7) | 126 | 11.3 | (9.5–13.3) | 123 | 22.9 | (19.5–26.6) | 275 | 11.9 | (10.7–13.3) | 502 | 12.8 | (11.7–13.8) |
| Limiters | 3875 | 40.3 | (39.3–41.3) | 286 | 12.8 | (11.4–14.2) | 444 | 50.7 | (47.4–54.0) | 511 | 45.8 | (42.9–48.8) | 273 | 50.8 | (46.6–55.1) | 1067 | 46.3 | (44.3–48.4) | 1925 | 48.9 | (47.4–50.5) | |
| Includers | 4682 | 48.6 | (47.6–49.6) | 1909 | 85.1 | (83.6–86.5) | 265 | 30.3 | (27.3–33.4) | 478 | 42.9 | (40.0–45.8) | 141 | 26.3 | (22.7–30.1) | 961 | 41.7 | (39.7–43.8) | 1507 | 38.3 | (36.8–39.8) | |
| Full sugar soft drinks 5 | Avoiders | 3284 | 34.1 | (33.2–35.0) | 293 | 13.1 | (11.7–14.5) | 405 | 46.2 | (42.9–49.5) | 480 | 43.0 | (40.1–45.9) | 302 | 56.1 | (51.9–60.3) | 1028 | 44.6 | (42.6–46.7) | 1398 | 35.5 | (34.1–37.1) |
| Limiters | 3038 | 31.6 | (30.7–32.5) | 314 | 14.0 | (12.6–15.5) | 327 | 37.3 | (34.1–40.5) | 436 | 39.1 | (36.2–42.0) | 157 | 29.2 | (25.5–33.1) | 860 | 37.3 | (35.4–39.3) | 1461 | 37.1 | (35.6–38.7) | |
| Includers | 3303 | 34.3 | (33.4–35.2) | 1634 | 72.9 | (71.0–74.7) | 145 | 16.5 | (14.2–19.1) | 200 | 17.9 | (15.8–20.3) | 79 | 14.7 | (11.9–17.9) | 416 | 18.1 | (16.5–19.7) | 1074 | 27.3 | (25.9–28.7) | |
| Takeaways 6 | Avoiders | 1506 | 15.6 | (14.9–16.3) | 164 | 7.3 | (6.3–8.4) | 246 | 28.0 | (25.1–31.1) | 206 | 18.5 | (16.3–20.8) | 137 | 25.5 | (21.9–29.3) | 437 | 19.0 | (17.4–20.6) | 607 | 15.4 | (14.3–16.6) |
| Limiters | 5542 | 57.6 | (56.6–58.6) | 976 | 43.5 | (41.5–45.6) | 541 | 61.6 | (58.4–64.8) | 736 | 65.9 | (63.1–68.7) | 320 | 59.5 | (55.3–63.6) | 1517 | 65.8 | (63.9–67.8) | 2345 | 59.6 | (58.1–61.1) | |
| Includers | 2581 | 26.8 | (25.9–27.7) | 1102 | 49.2 | (47.1–51.2) | 91 | 10.4 | (8.5–12.5) | 174 | 15.6 | (13.6–17.8) | 81 | 15.1 | (12.2–18.3) | 350 | 15.2 | (13.8–16.7) | 983 | 25.0 | (23.6–26.4) | |
1 Nutrition profiles names based around eating pattern; 2 Confidence intervals (CI); 3 Avoiders defined as not consuming food groups, Limiters defined as consuming food group a few times a month, Includers defined as consuming food group a few times a week or more often; 4 Cakes and biscuits includes, chips, crackers or muesli bars; 5 Full sugar soft drinks includes sports drinks, fruit juice or cordial; 6 Takeaways includes fast food outlets, and fish and chips; Note, totals do not add to 10,012 as profiles allow for overlap.
© 2017 by the authors. Licensee MDPI, Basel, Switzerland. This article is an open access article distributed under the terms and conditions of the Creative Commons Attribution (CC BY) license (http://creativecommons.org/licenses/by/4.0/).
Share and Cite
MDPI and ACS Style
Maclaren, O.; Mackay, L.; Schofield, G.; Zinn, C. Novel Nutrition Profiling of New Zealanders’ Varied Eating Patterns. Nutrients 2018, 10, 30. https://doi.org/10.3390/nu10010030
AMA Style
Maclaren O, Mackay L, Schofield G, Zinn C. Novel Nutrition Profiling of New Zealanders’ Varied Eating Patterns. Nutrients. 2018; 10(1):30. https://doi.org/10.3390/nu10010030
Chicago/Turabian StyleMaclaren, Olivia, Lisa Mackay, Grant Schofield, and Caryn Zinn. 2018. "Novel Nutrition Profiling of New Zealanders’ Varied Eating Patterns" Nutrients 10, no. 1: 30. https://doi.org/10.3390/nu10010030
Note that from the first issue of 2016, this journal uses article numbers instead of page numbers. See further details here.