Gelidium elegans Extract Ameliorates Type 2 Diabetes via Regulation of MAPK and PI3K/Akt Signaling

Department of Food Science and Biotechnology, College of Life Science, CHA University, 463–400 Seongnam, Kyonggi, Korea
*
Author to whom correspondence should be addressed.
†
These authors contributed equally to this work.
Nutrients 2018, 10(1), 51; https://doi.org/10.3390/nu10010051
Submission received: 24 October 2017
/
Revised: 29 December 2017
/
Accepted: 5 January 2018
/
Published: 6 January 2018
Abstract
:Gelidium elegans, a red alga native to the Asia Pacific region, contains biologically active polyphenols. We conducted a molecular biological study of the anti-diabetic effect of Gelidium elegans extract (GEE) in C57BL/KsJ-db/db mice. Mice that had been administered GEE had significantly lower body mass, water consumption, and fasting blood glucose than db/db controls. Moreover, hemoglobin A1c (HbA1c), an indicator of the glycemic status of people with diabetes, was significantly lower in mice that had been administered GEE. We also found that 200 mg/kg/day GEE upregulates the insulin signaling pathway by activating insulin receptor substrate-1 (IRS-1) and phosphoinositide 3-kinase (PI3K), and increasing the expression of glucose transporter type 4 (GLUT4). In parallel, mitogen-activated protein kinase (MAPK) activity was lower in GEE-treated groups. In summary, these findings indicate that GEE regulates glucose metabolism by activating the insulin signaling pathway and downregulating the MAPK signaling pathway.
1. Introduction
Diabetes mellitus (DM) is a metabolic disease that is characterized by excess glucose in the bloodstream [1]. The American Diabetes Association (ADA) reported that 12% of the annual $245 billion cost of healthcare in the USA is spent on diabetes care, and the population of diabetic individuals is rapidly growing worldwide [2]. There are two principal types of DM, characterized either by an absolute deficiency of insulin (type 1 diabetes), or resistance to the effects of insulin (type 2 diabetes; T2D) [3]. Of these, T2D is a common disorder that affects an estimated 110 million people worldwide. T2D is characterized by a disorder of insulin action, impaired glucose uptake into skeletal muscle and adipose tissue, and greater hepatic glucose output, resulting in hyperglycemia and insulin resistance [4].
Insulin signaling has been investigated for many decades, including through the mitogen-activated protein kinase (MAPK), phosphoinositol 3-kinase (PI3K)/Akt, and mechanistic target of rapamycin (mTOR) pathways [5,6,7]. Of these, the PI3K/Akt and MAPK pathways play major roles downstream of insulin receptor substrates (IRSs) [8]. The PI3K/Akt pathway has a crucial role in mediating the metabolic effects of insulin, in particular by increasing glucose uptake via the insulin-sensitive glucose transporter type 4 (GLUT4) [9]. GLUT4 is expressed in peripheral insulin-sensitive tissues, and is stored in intracellular vesicles that are mobilized to the plasma membrane immediately following insulin stimulation, thereby effecting glucose transport into cells [10,11]. Defective GLUT4 translocation is a feature of insulin resistance, which is an essential precursor of T2D [12]. Moreover, the PI3K/Akt and MAPK pathways mediate the effects of insulin on growth, the metabolism of glucose and lipids, and oxidative stress [13]. Both PI3K/Akt and signaling pathways play crucial roles in the development of diabetes. Aberrant activation of these pathways leads to abnormal glucose and lipid metabolism and oxidative stress, which are key features of diabetic pathophysiology.
There are a number of pharmacologic agents that are approved by the Food and Drug Administration (FDA) as therapies for diabetes, including metformin, rosiglitazone, and pioglitazone [14,15]. These agents help to regulate blood glucose by reducing hepatic glucose production and increasing blood glucose utilization [16,17,18]. However, although these anti-diabetic agents produce substantial reductions in blood glucose, their use is associated with a number of adverse effects, such as weight gain and gastrointestinal irritation, inducing diarrhea, nausea, and vomiting [19,20]. It is now believed that a healthy diet may be sufficient to ameliorate the symptoms of diabetes by maintaining a more normal blood glucose level [21,22,23].
Several studies report that consumption of particular phytochemicals, such as polyphenols, which are extracted from vegetables, fruits, and edible seaweeds, can reduce blood glucose both in rodent models and in human clinical trials [22,24]. Specific bioactive compounds of plant origin, including resveratrol, curcumin, and pterostilbene, have been shown to ameliorate diabetes [25,26,27]. Recent studies demonstrate that edible seaweeds may have beneficial effects in diabetes patients [28,29]. In particular, dieckol, an extract from a brown seaweed native to the Asia Pacific region, attenuates hyperglycemia through enhanced translocation of GLUT4 in peripheral tissues [29]. In addition, fucoxanthin reduces hyperglycemia in diabetic mice [30].
One example of note is Gelidium elegans extract (GEE), previously known as Gelidium amansii, an edible seaweed native to the Asia Pacific region [31]. We have described the bioactivity of GEE, including its anti-oxidant, anti-hyperglycemic, and anti-obesity effects [32,33,34]. Our previous study showed that GEE has the potential to regulate energy metabolism in high fat diet-induced obese mice [32], and in particular it may regulate glucose homeostasis [35]. The constituents of GEE are 5.1% moisture, 24.1% crude ash, 16.7% crude protein, 47.6% carbohydrate, and 8.79 mg polyphenol per g. It is a polyphenol-rich extract from an edible seaweed that may be useful for the treatment of various pathological conditions. However, although previous reports indicate that GEE might regulate blood glucose, the molecular mechanism of its anti-diabetic effects remains unclear in peripheral tissues.
We previously demonstrated that GEE affects glucose homeostasis and has an anti-hyperglycemic effect in high fat diet-induced obese mice [36]. We hypothesized that this may be achieved through the modulation of GLUT4 expression, insulin receptor substrate-1 (IRS-1)/phosphoinositide 3-kinase (PI3K), and MAPK pathways. We tested this possibility using the leptin receptor-deficient db/db mouse, a model of T2D, which exhibits a number of the typical metabolic defects seen in patients, including hyperglycemia and hyperinsulinemia [36,37], and shares many of the clinical characteristics of human T2D [37,38]. Thus, the present study investigated the effect of GEE on glucose metabolism in db/db mice by analyzing its effects on the PI3K/Akt and MAPK signaling pathways.
2. Materials and Methods
2.1. Materials
GEE was provided by NEWTREE Inc. (Kyeonggi, Korea). Its composition is shown in Table 1. Antibodies targeting GLUT4 (sc-7938), phospho-IRS-1 (sc-17196), IRS-1 (sc-559), phospho-PI3K p85α (sc-12929), phospho-c-Jun N-terminal kinases (p-JNK, sc-6254), JNK (sc-571), and glyceraldehyde 3-phosphate dehydrogenase (GAPDH, sc-25778) were purchased from Santa Cruz Biotechnology (Dallas, TX, USA). Antibodies targeting PI3K (#4255), phosphoprotein kinase B (p-Akt, #9271), Akt (#9272), phospho-p38 MAPK (p-p38 MAPK, cs-9215), p38 MAPK (#9211), phospho-p44/42 MAPK (p-ERK1/2, #4377), and ERK1/2 (#9102) were purchased from Cell Signaling Technology (Bedford, MA, USA). Metformin was obtained from the Cayman Chemical Company (Ann Arbor, MI, USA).
2.2. Approval of Animal Experiments
The protocols for the use of experimental animals were approved by the Institutional Animal Care and Use Committee of CHA University (IACUC 150071), and all experiments were conducted using the approved protocols and according to National Institutes of Health (NIH) guidelines.
2.3. Animal Husbandry and Experimental Design
This study used five-week-old male C57BL/ksJ-db/db mice and C57BL/KsJ m+/+ db mice from Central Lab Animal Inc. (Seoul, Korea). All mice were maintained in the animal facility at CHA University, Kyeonggi, Korea under a 12 h/12 h light/dark cycle at 20–24 °C and with a relative humidity of 44.5–51.8%. All experimental mice were randomly divided into five groups after a one-week adaptation period: (1) positive control group; (2) diabetic control group; (3) diabetic mice treated with metformin (140 mg/kg/day); (4) diabetic mice treated with GEE (50 mg/kg/day); (5) diabetic mice treated with GEE (200 mg/kg/day). All treatments were administered by oral gavage daily for five weeks, and all groups were fed a rodent chow diet (Zeigler Brothers, Gardners, PA, USA).
2.4. Body Mass, Food Intake, and Water Consumption
Body mass was measured before treatments commenced and once weekly thereafter. Food intake and water consumption were measured on the first day of treatment, and then once weekly during the experimental period. The amounts of food and water given were measured before they were supplied to each cage, and the amounts remaining the following week were measured, to calculate the weekly food intake and water consumption per unit mouse body mass.
2.5. Fasting Blood Glucose Measurement
Glucose was measured weekly in blood obtained from a tail vein after withholding food for 12 h during the dark period, using a glucose analyzer, GlucoDr (Allmedicus, Kyeonggi, Korea).
2.6. Blood Biochemistry
Mice were euthanized by overexposure to CO2 and cervical dislocation. Blood was collected via cardiac puncture and collected aseptically into ethylene diamine tetra-acetic acid (EDTA)-coated syringes. The blood samples were allowed to clot at room temperature for 1 h. To isolate plasma, blood was centrifuged at 13,000× g for 15 min at 4 °C and stored at −80 °C. Triglyceride (TG), low-density lipoprotein (LDL)-cholesterol, high-density lipoprotein (HDL)-cholesterol, and total cholesterol levels were determined using enzymatic kits (Roche, Mannheim, Germany). Glycosylated hemoglobin A1c (HbA1c) was determined by an enzymatic colorimetric method using a kit obtained from Mybiosource, San Diego, CA, USA. Insulin and C-peptide were measured using commercially available kits from Shibayagi Inc., Tokyo, Japan.
2.7. Organ Masses
Mice were euthanized by overexposure to CO2 and cervical dislocation. Subcutaneous adipose, liver, heart, lung, and skeletal muscle (thigh muscle) were removed after five weeks. Subcutaneous adipose, liver, heart, and lung were immediately weighed.
2.8. Western Blot Analysis
Liver and skeletal muscle samples were homogenized in Pro-prep lysis buffer (iNtRON Biotechnology, Seoul, Korea) including inhibitor cocktails 2 and 3 (Sigma, St. Louis, MO, USA), followed by centrifugation at 12,000× g at 4 °C for 20 min to collect the supernatant. The protein concentration of the supernatant was then determined using the Bradford method (Bio Legend, San Diego, CA, USA). Lysates (30 μg/sample) were subjected to sodium dodecyl sulfate polyacrylamide gel electrophoresis (SDS-PAGE), and then separated proteins were transferred to polyvinylidene fluoride (PVDF) membranes (Bio-Rad, Hercules, CA, USA), as previously described [39]. The membranes were then incubated with specific antibodies, and bands were detected using an enhanced chemiluminescence substrate and LAS image software (Fuji, Tokyo, Japan).
2.9. Statistical Analysis
Statistical analyses were performed using SPSS 12.0 (Statistical Package for Social Sciences version 12.0, Chicago, IL, USA). Body mass and fasting blood glucose were analyzed by two-way analysis of variance (ANOVA), followed by Tukey’s multiple comparisons post hoc test. The other data were analyzed by one-way ANOVA, followed by Duncan’s test. Results are expressed as mean ± standard deviation (SD). p < 0.05 was considered statistically significant (signified in the Figures by labels a, b, c, and d).
3. Results
3.1. Effect of GEE on Body Mass and Fasting Blood Glucose in db/db Mice
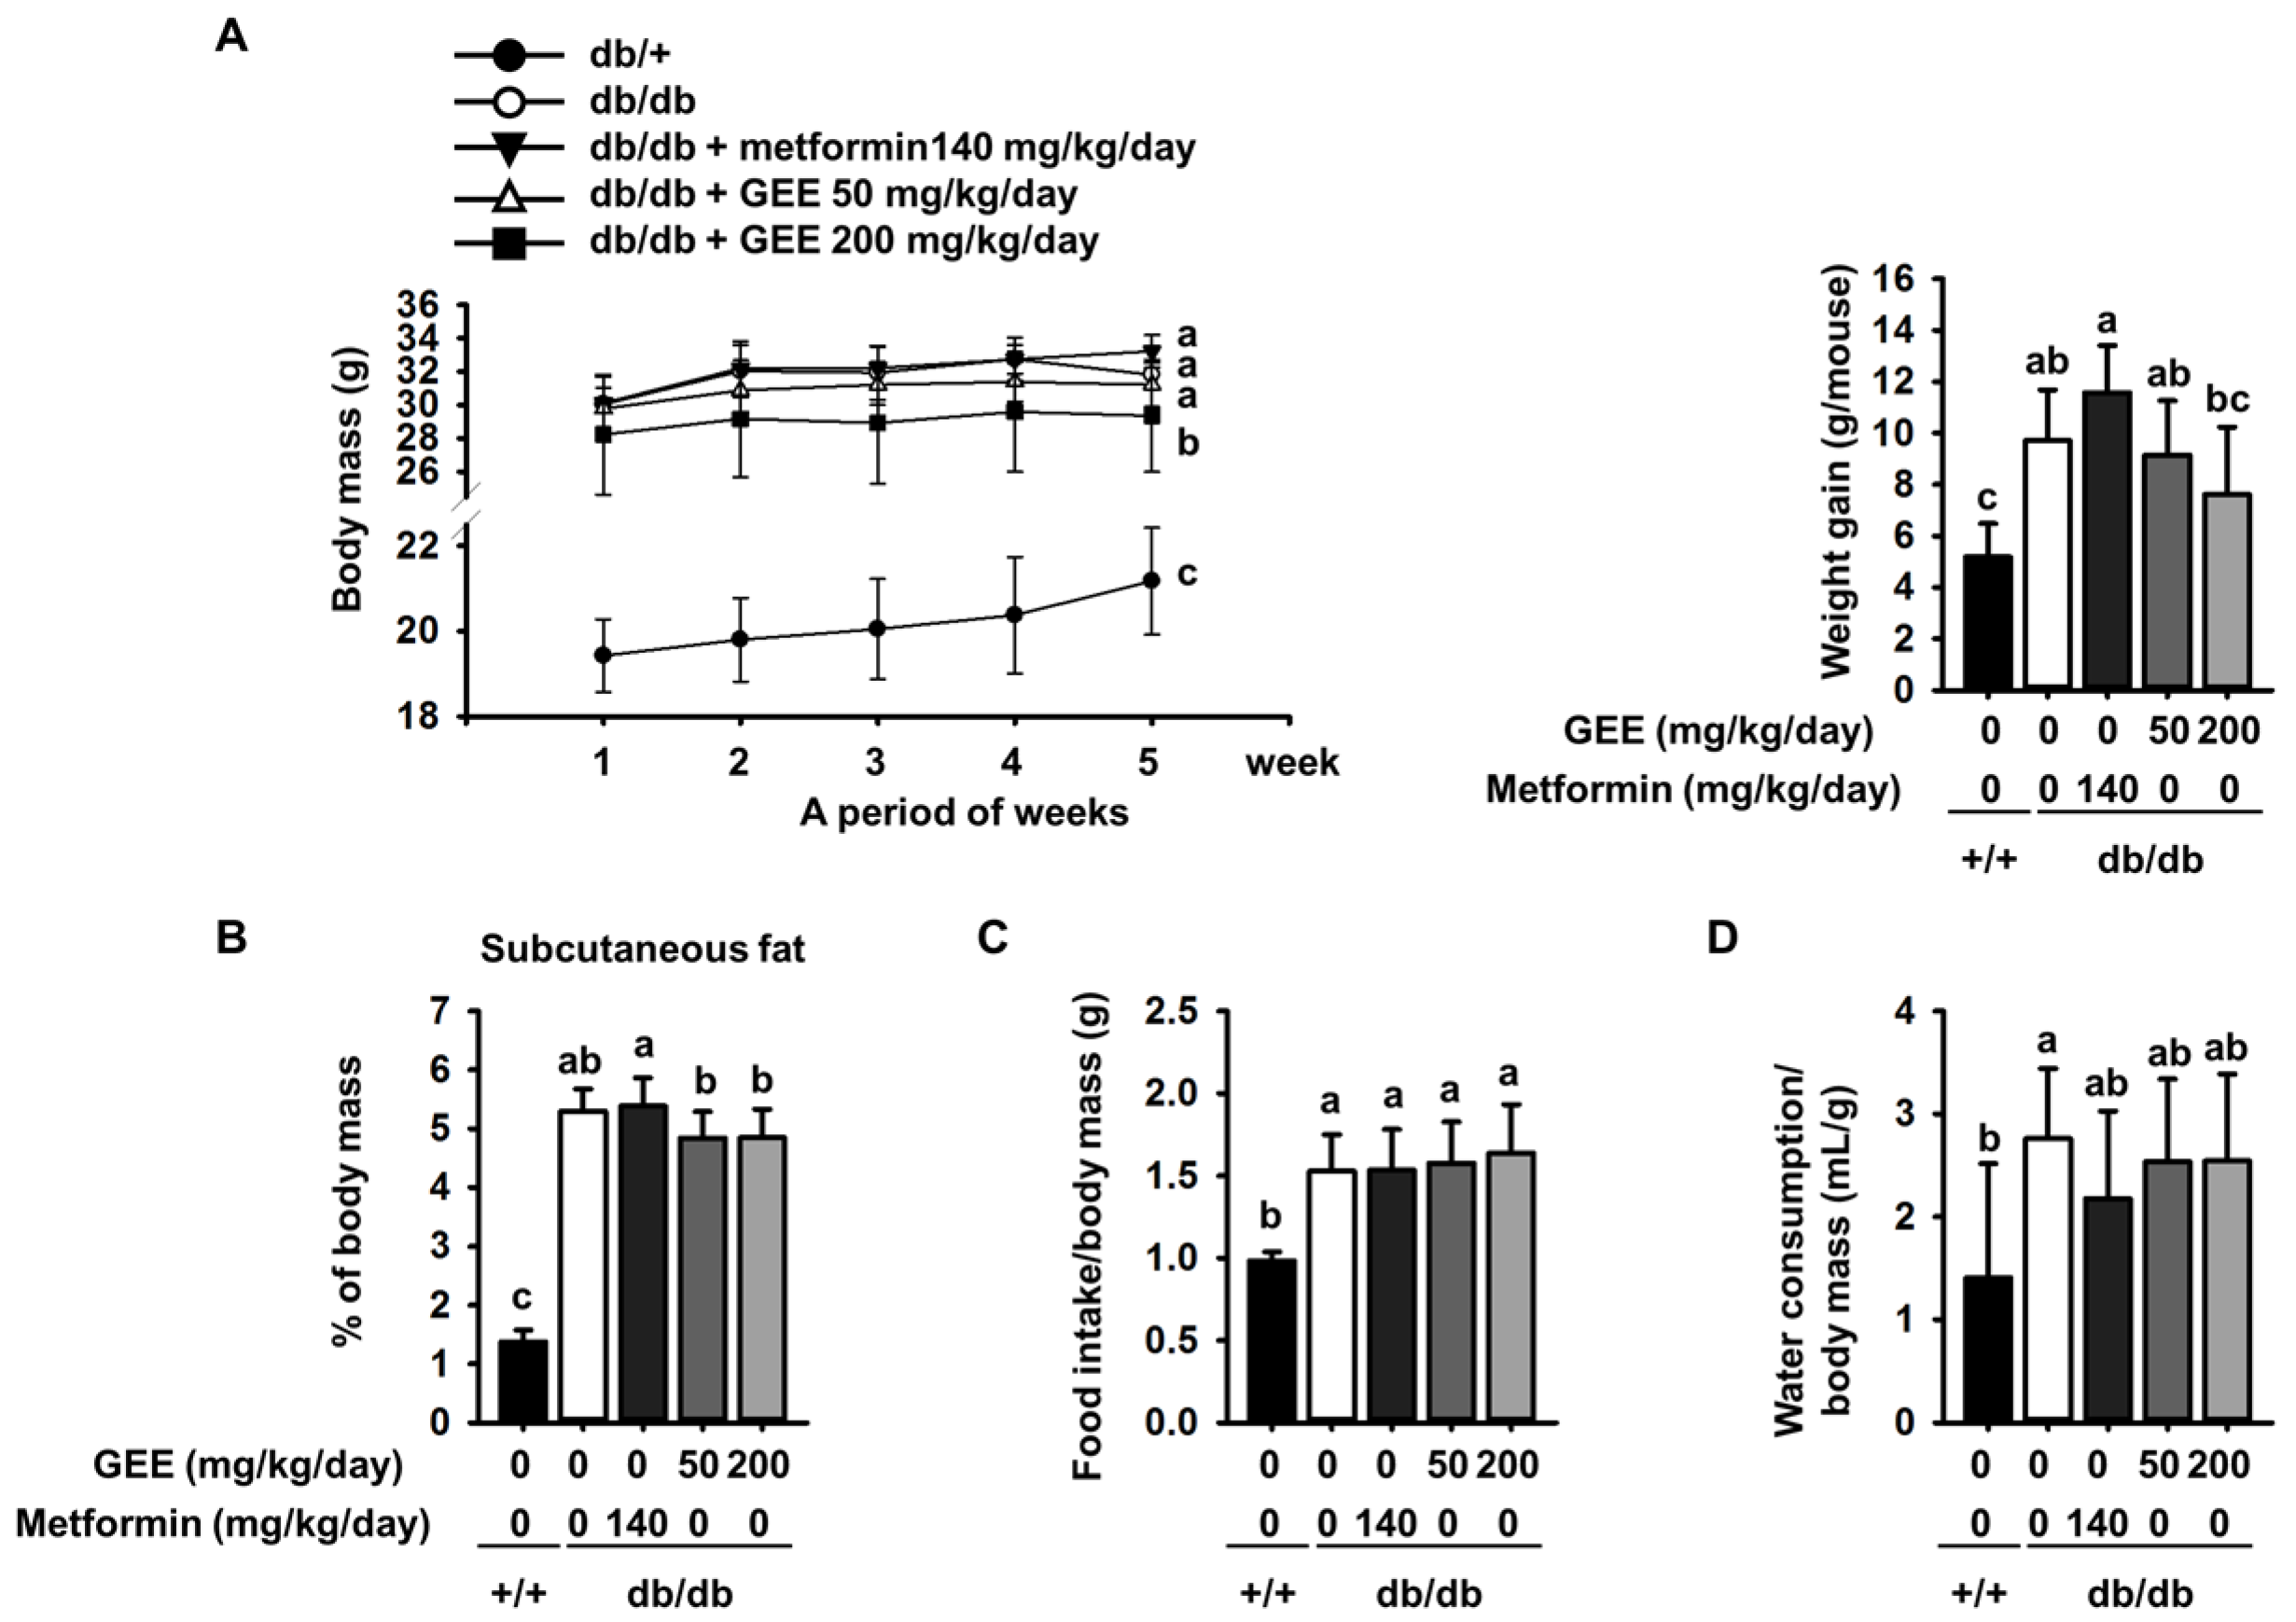
The body mass of each group of mice was assessed once a week during the experimental period. The initial body mass, food intake, and water consumption of the metformin, GEE 50, and GEE 200 mg/kg/day groups were not significantly different from those of the db/db control group. However, the final body masses and changes in mass among the groups were different (Figure 1A). Mice administered with 140 mg/kg/day metformin had a slightly higher final body mass (33.1 ± 1.0 g) than db/db controls (31.8 ± 0.7 g). Conversely, mice given 50 mg/kg/day GEE (31.2 ± 1.3 g) and 200 mg/kg/day GEE (29.4 ± 3.4 g) had lower final body masses than the db/db controls.
In addition, 50 and 200 mg/kg/day GEE inhibited weight gain, such that treated mice had smaller amounts of subcutaneous adipose than db/db controls (Figure 1B).
Water consumption was significantly lower in the metformin, and 50 and 200 mg/kg/day GEE, groups than in the db/db control group (Figure 1D).
Although the food intake/body mass ratio was not significantly different among the diabetic mice (Figure 1C), the db/db control group and those administered with metformin showed an increase in body mass ~4.1% greater than that shown by the db/db control group. Moreover, we observed that the masses of the liver and subcutaneous adipose depot were higher in the diabetic than the control mice at the end of the experiment (Table 2). However, 50 and 200 mg/kg/day GEE groups showed lower body, liver, and subcutaneous adipose depot mass than the db/db control group. However, the masses of the major organs (heart, lungs, spleen, and kidney) were not affected.
Finding an effective therapy for hyperglycemia is a top priority in diabetes research [40]. We therefore investigated whether GEE might have an anti-hyperglycemic effect in diabetic mice.
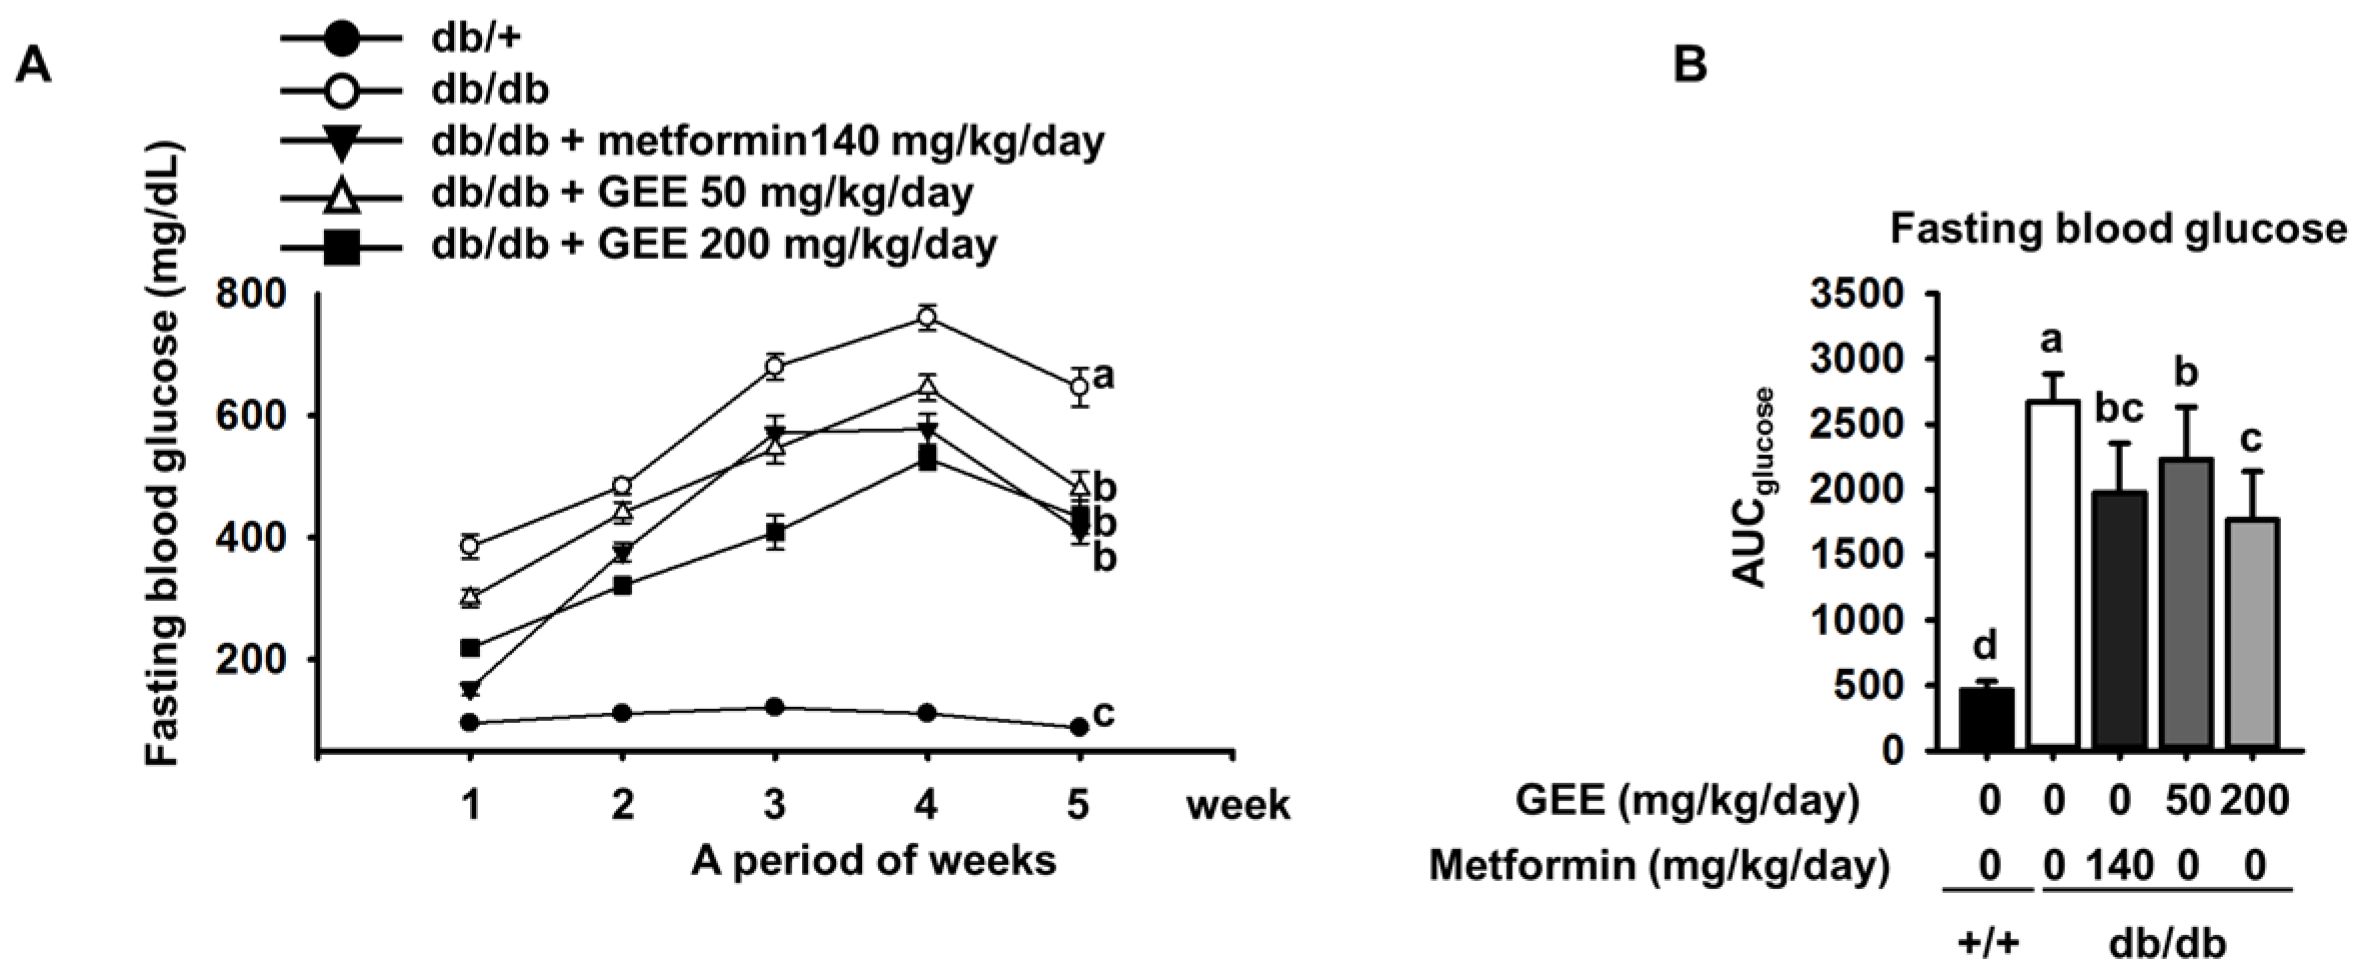
The db/db mouse demonstrates rising blood glucose with age [41]. As shown in Figure 2A, all of the diabetic groups showed high fasting glucose during the experimental period. By contrast, the fasting blood glucose level in the control group was within the normal range (105.0 ± 13.4 mg/dL).
Fasting blood glucose was significantly higher in the db/db control group than in the metformin-treated group. By contrast, the groups administered with 50 or 200 mg/kg/day GEE showed significantly lower increases in blood glucose (300.6 ± 116.9 mg/dL and 218.5 ± 100.4 mg/dL after the first week of treatment, respectively). The group that received 200 mg/kg/day GEE showed significantly lower blood glucose after one week than the db/db control group, a difference that persisted for the whole experimental period.
The area under the curve (AUC) is a useful method of comparing blood glucose between groups over a period of time [42]. We therefore calculated the AUC using the trapezoidal rule to evaluate the effect of GEE on blood glucose over the experimental period. As shown in Figure 2B, the effect of the treatment regimens on AUC glucose mirrored their effects on individual glucose measurements.
C-peptide, which is cleaved from the pro-insulin molecule prior to its release, also seems to play a role in the maintenance of normoglycemia [43]. Mice treated with 50 or 200 mg/kg/day GEE showed a lower C-peptide level than the db/db control group, and the difference in C-peptide concentration correlated with the difference in serum insulin between groups. These findings indicate that GEE suppresses insulin secretion, which may result in lower insulin resistance. Diabetes is also characterized by high serum HbA1c [44]. Therefore, we measured serum HbA1c and found that the db/db control group had significantly higher serum HbA1c levels than the positive control group (Table 3). However, the GEE groups showed much lower serum HbA1c levels, indicating that GEE may ameliorate diabetes. However, the levels of LDL, TG, and total cholesterol were not affected. These data provide preliminary evidence that GEE can ameliorate glycemic deterioration in diabetes.
3.2. Effect of GEE on GLUT4 Protein Expression in the Skeletal Muscle and Liver of db/db Mice
We next analyzed the skeletal muscle and liver of diabetic mice to determine the mechanism whereby GEE induced the observed effects.
To clarify whether GEE could prevent the development of diabetes, we quantified a key determinant of glucose uptake, GLUT4, by western blotting in skeletal muscle and the liver. As shown in Figure 3A, metformin, and 50 and 200 mg/kg/day GEE, stimulated glucose uptake via GLUT4.
GLUT4 protein expression in the skeletal muscle was 1.7-fold higher in mice administered with 200 mg/kg/day GEE than in the db/db control group. It was also significantly higher in the liver of mice administered 200 mg/kg/day GEE (Figure 3B). The db/db control group had a lower level of GLUT4 protein, but GEE ameliorated the diabetes-induced reduction in the GLUT4 protein level. GLUT4 is the main effector of glucose uptake in peripheral insulin target tissues [45,46], and our findings indicate that GEE could regulate glucose uptake via this transporter. We next hypothesized that this effect of GEE could be mediated through the regulation of the insulin signaling pathway in skeletal muscle and the liver.
3.3. GEE Increases Phosphorylation of Intermediates in the PI3K/Akt Pathway in db/db Mice
Many studies report that the insulin signaling pathway, which includes IRS-1, PI3K, and Akt, is a critical regulator of GLUT4 translocation and glucose uptake [47,48,49]. To further elucidate the molecular mechanism of the effect of GEE in skeletal muscle and the liver, we used western blotting to evaluate the expression of IRS-1, PI3K, and Akt.
As shown in Figure 4A, the db/db control group had a lower level of IRS-1 phosphorylation than the metformin-treated mice, while GEE significantly increased the expression of IRS-1, PI3K, and Akt in skeletal muscle. Compared with the db/db control group, the 200 mg/kg/day GEE group showed significant increases in IRS-1, PI3K, and Akt phosphorylation of ~25%, 20%, and 38%, respectively, in skeletal muscle. We also determined the effect of GEE in the liver by western blot (Figure 3B).
Consistent with the observations in muscle, we found that 200 mg/kg/day GEE induced significant increases in hepatic IRS, PI3K, and Akt phosphorylation versus the db/db control group. These results suggest that GEE may promote glucose uptake in db/db mice via activation of the insulin signaling pathway.
3.4. GEE Suppresses MAPK Pathway Activation in db/db Mice
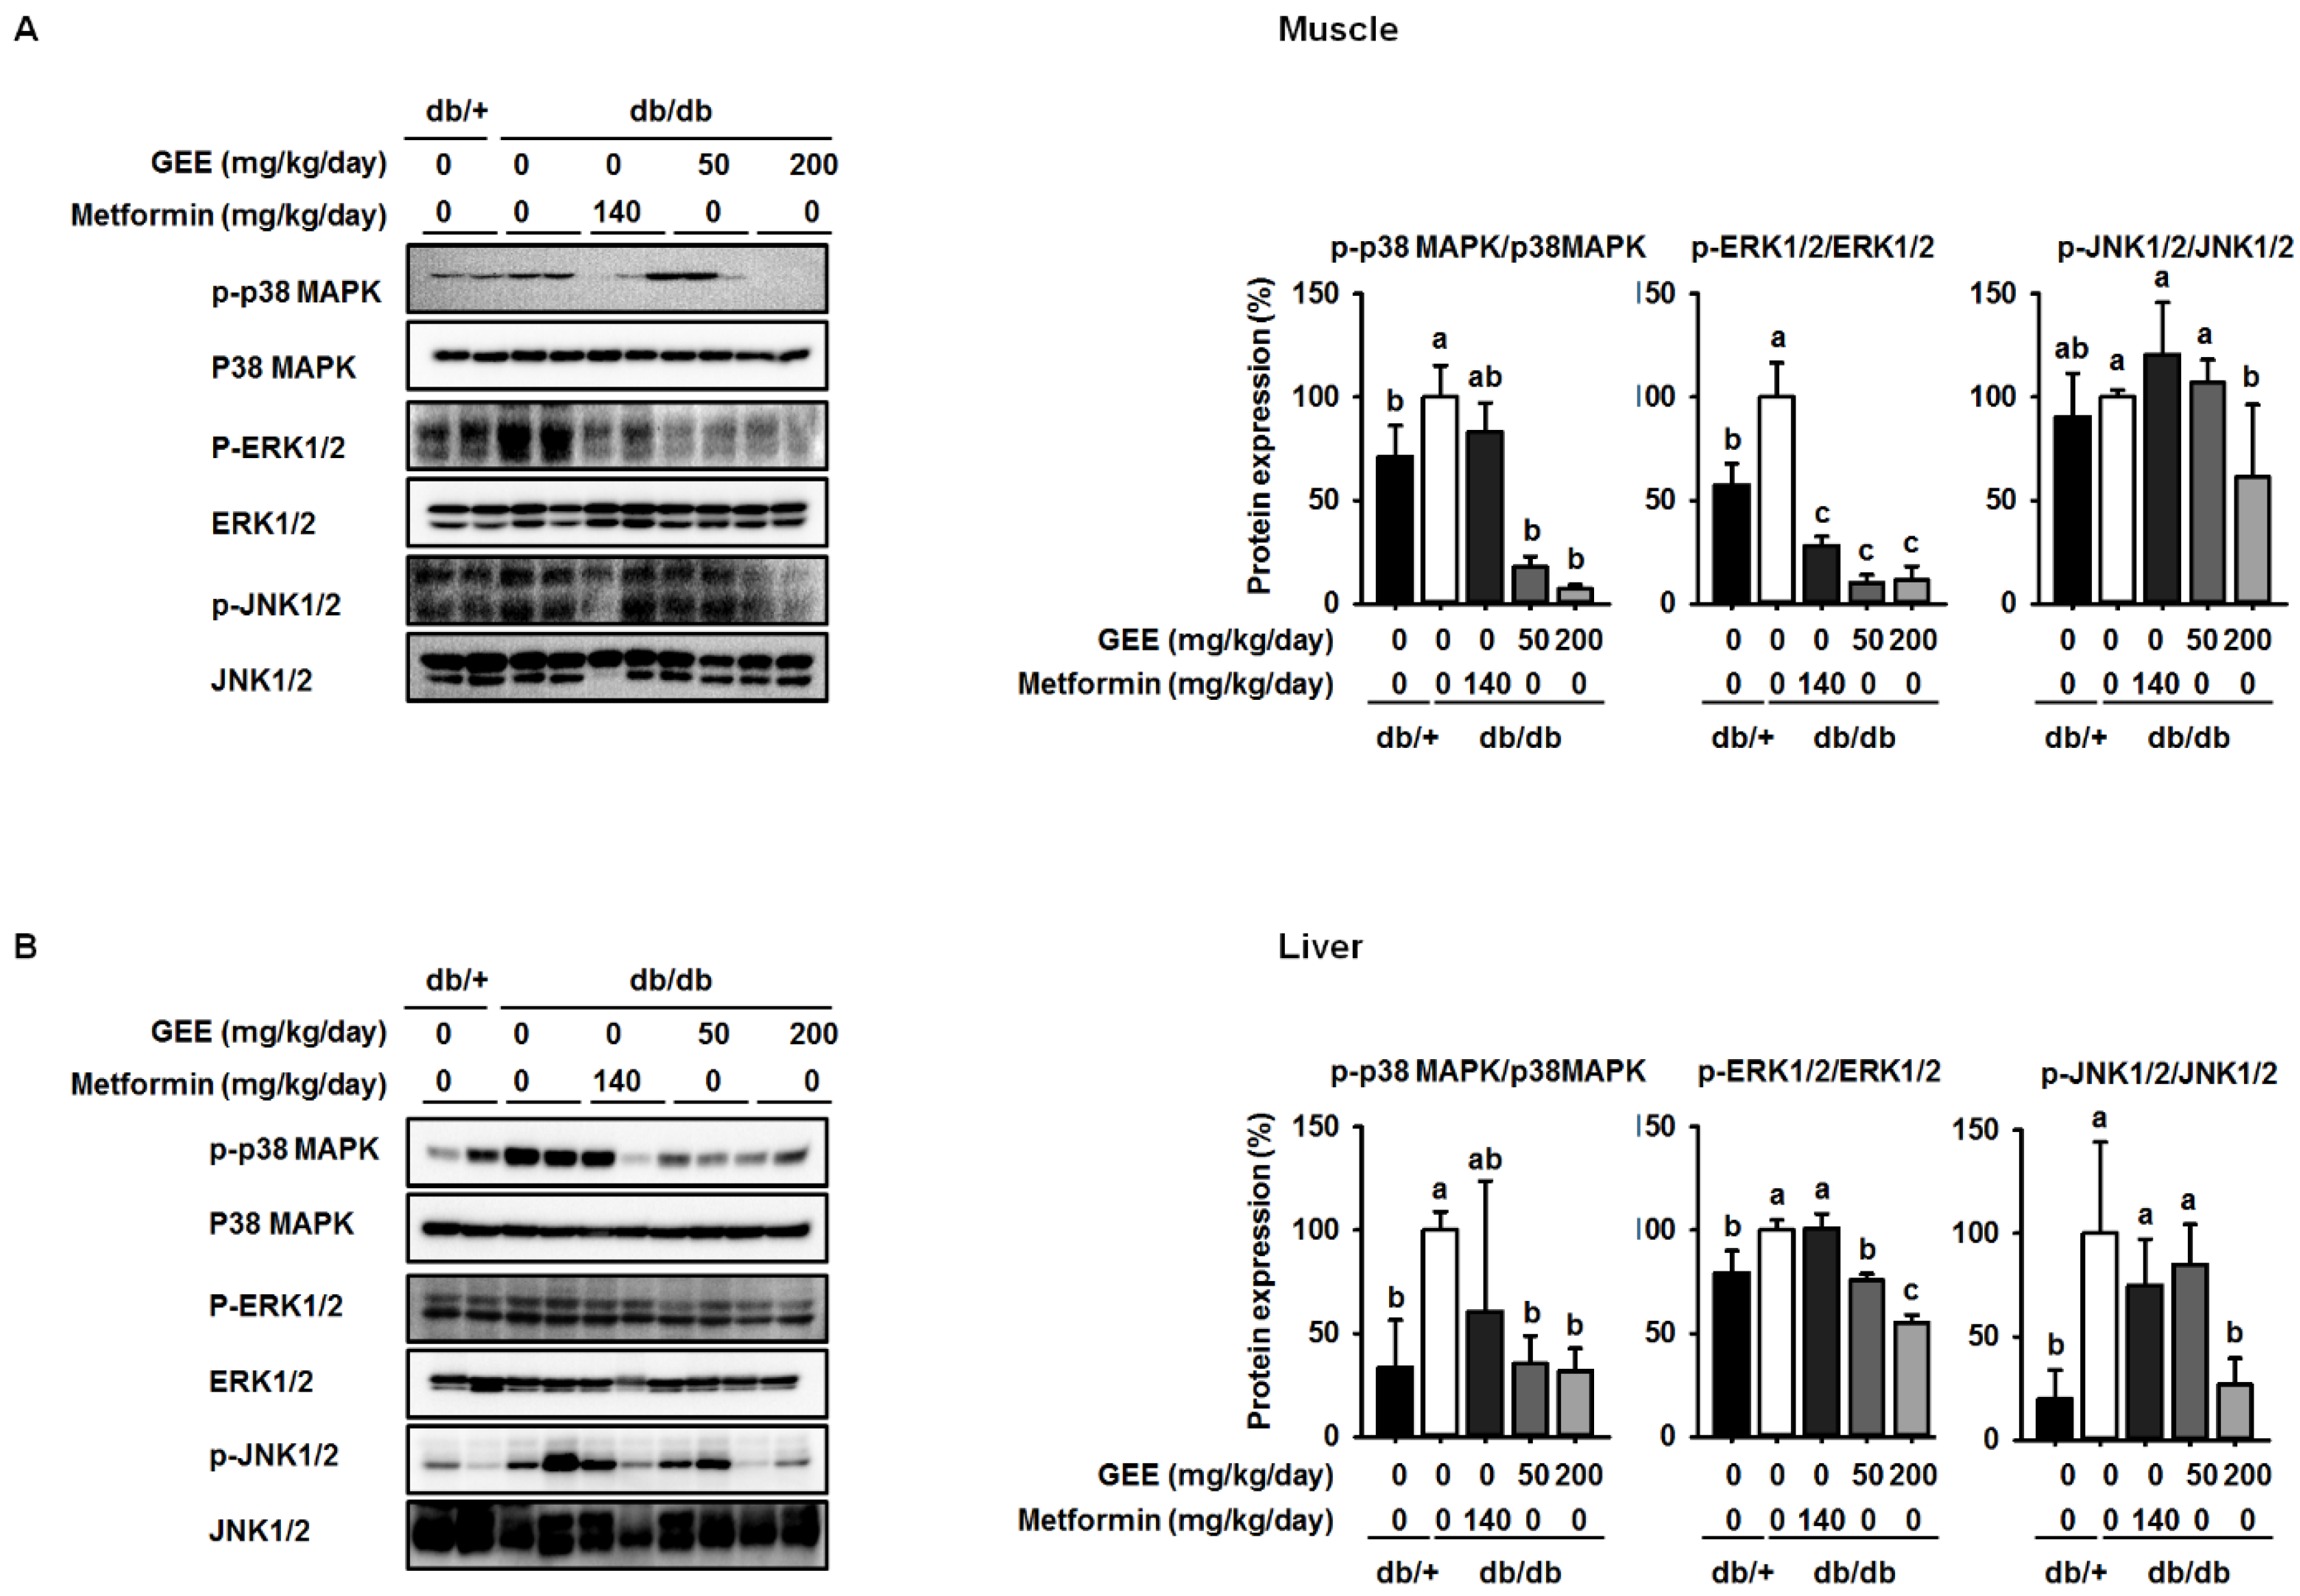
Insulin activates two main signaling pathways in its target tissues: the PI3K/Akt and the RAS-MAPK pathways. Recent studies demonstrate that MAPK pathways, including the p38 MAPK, ERK, and JNK pathways, are implicated in the control of cell development, glycolipid metabolism, inflammation, and oxidative stress, and intermediates have been shown to be phosphorylated in diabetes [50,51].
Western blotting was used to determine whether GEE administration decreases the expression of p38 MAPK, ERK, and JNK. The db/db control group showed higher levels of phosphorylation of p38 MAPK, ERK, and JNK than the metformin-treated mice, while mice administered 200 mg/kg/day GEE showed significantly lower phosphorylation of p38 MAPK, ERK, and JNK (by ~93%, 89%, and 39%, respectively) in the skeletal muscle than the db/db control group (Figure 5A). We also investigated the effect of GEE in liver by western blotting (Figure 4B). Consistent with the observations in muscle, 200 mg/kg/day GEE induced a significant decrease in the phosphorylation of p38 MAPK, ERK, and JNK versus db/db controls in the liver. These results suggest that GEE may ameliorate diabetes by deactivating MAPK pathways.
4. Discussion
Here, we show that the administration of GEE to db/db mice limits their increase in body mass and ameliorates the increase in blood glucose that characterizes their phenotype. Moreover, GEE is sufficient to ameliorate diabetic symptoms, such as extreme thirst, increased body mass, and high blood glucose, potentially through the upregulation of GLUT4 and the PI3K/Akt pathway, and the downregulation of MAPK pathway activation, in db/db mice. Our study thus demonstrates a beneficial effect of GEE on glucose uptake by the tissues of diabetic mice, which may be achieved through improved insulin sensitivity, possibly via the inhibition of MAPK pathways.
Diabetes is a metabolic disease in which the body does not appropriately process glucose, resulting in hyperglycemia [52]. In this study, fasting blood glucose and HbA1c were high in the db/db control group, confirming well-established diabetes in these mice [45]. The therapeutic effects of GEE on metabolic disorders have been reported previously. Recent studies by ourselves and others show that GEE can ameliorate hyperglycemia in high fat diet-fed mice [32]. Consistent with these previous results, we show that GEE reduces fasting blood glucose in diabetic mice.
Insulin resistance in T2D results in impaired insulin-stimulated glucose transport and metabolism in skeletal muscle and adipose, and the defective suppression of hepatic glucose output [53].
Skeletal muscle and the liver are major contributors to glucose metabolism, and GLUT4 is the principal means whereby glucose is delivered intracellularly [54,55]. Our results show that GEE administration upregulates GLUT4 protein expression in the liver and muscle of insulin resistant mice. These data suggest that GEE may lower blood glucose by enhancing glucose uptake into peripheral tissues.
The insulin signaling pathway, which includes the key mediators IRS-1, PI3K, and Akt, plays crucial cellular and molecular roles, including the synthesis and degradation of glycogen, lipid, and proteins [56,57]. Many studies show that impaired IRS-1 activation and PI3/Akt signaling suppresses glucose uptake and GLUT4 translocation [47]. Previous studies indicated that GEE can improve hyperglycemia and regulate glucose homeostasis in vivo [35]. However, these studies did not show a molecular mechanism for the effect of GEE. In the present study, GEE reversed the diabetes-induced downregulation of p-IRS, p-PI3K, and p-Akt in peripheral tissues, indicating that GEE restores insulin signaling in db/db mice.
In addition to the PI3K/Akt signaling pathway, a number of other signaling pathways have been implicated in the pathogenesis of diabetes, being involved in abnormal glucose regulation, glucolipid metabolism, and oxidative stress. These include the AMP-activated protein kinase (AMPK) pathway and MAPK pathways [58,59,60]. Furthermore, the PI3K/Akt pathway might also affect the activation of the MAPK signaling cascade [61]. To establish whether GEE has its effects on glucose homeostasis through MAPK pathways, we analyzed the expression of MAPK genes in the skeletal muscle and liver of db/db mice and found that MAPK activation, assessed by measuring the phosphorylation of p38 MAPK, ERK, and JNK, was markedly lower.
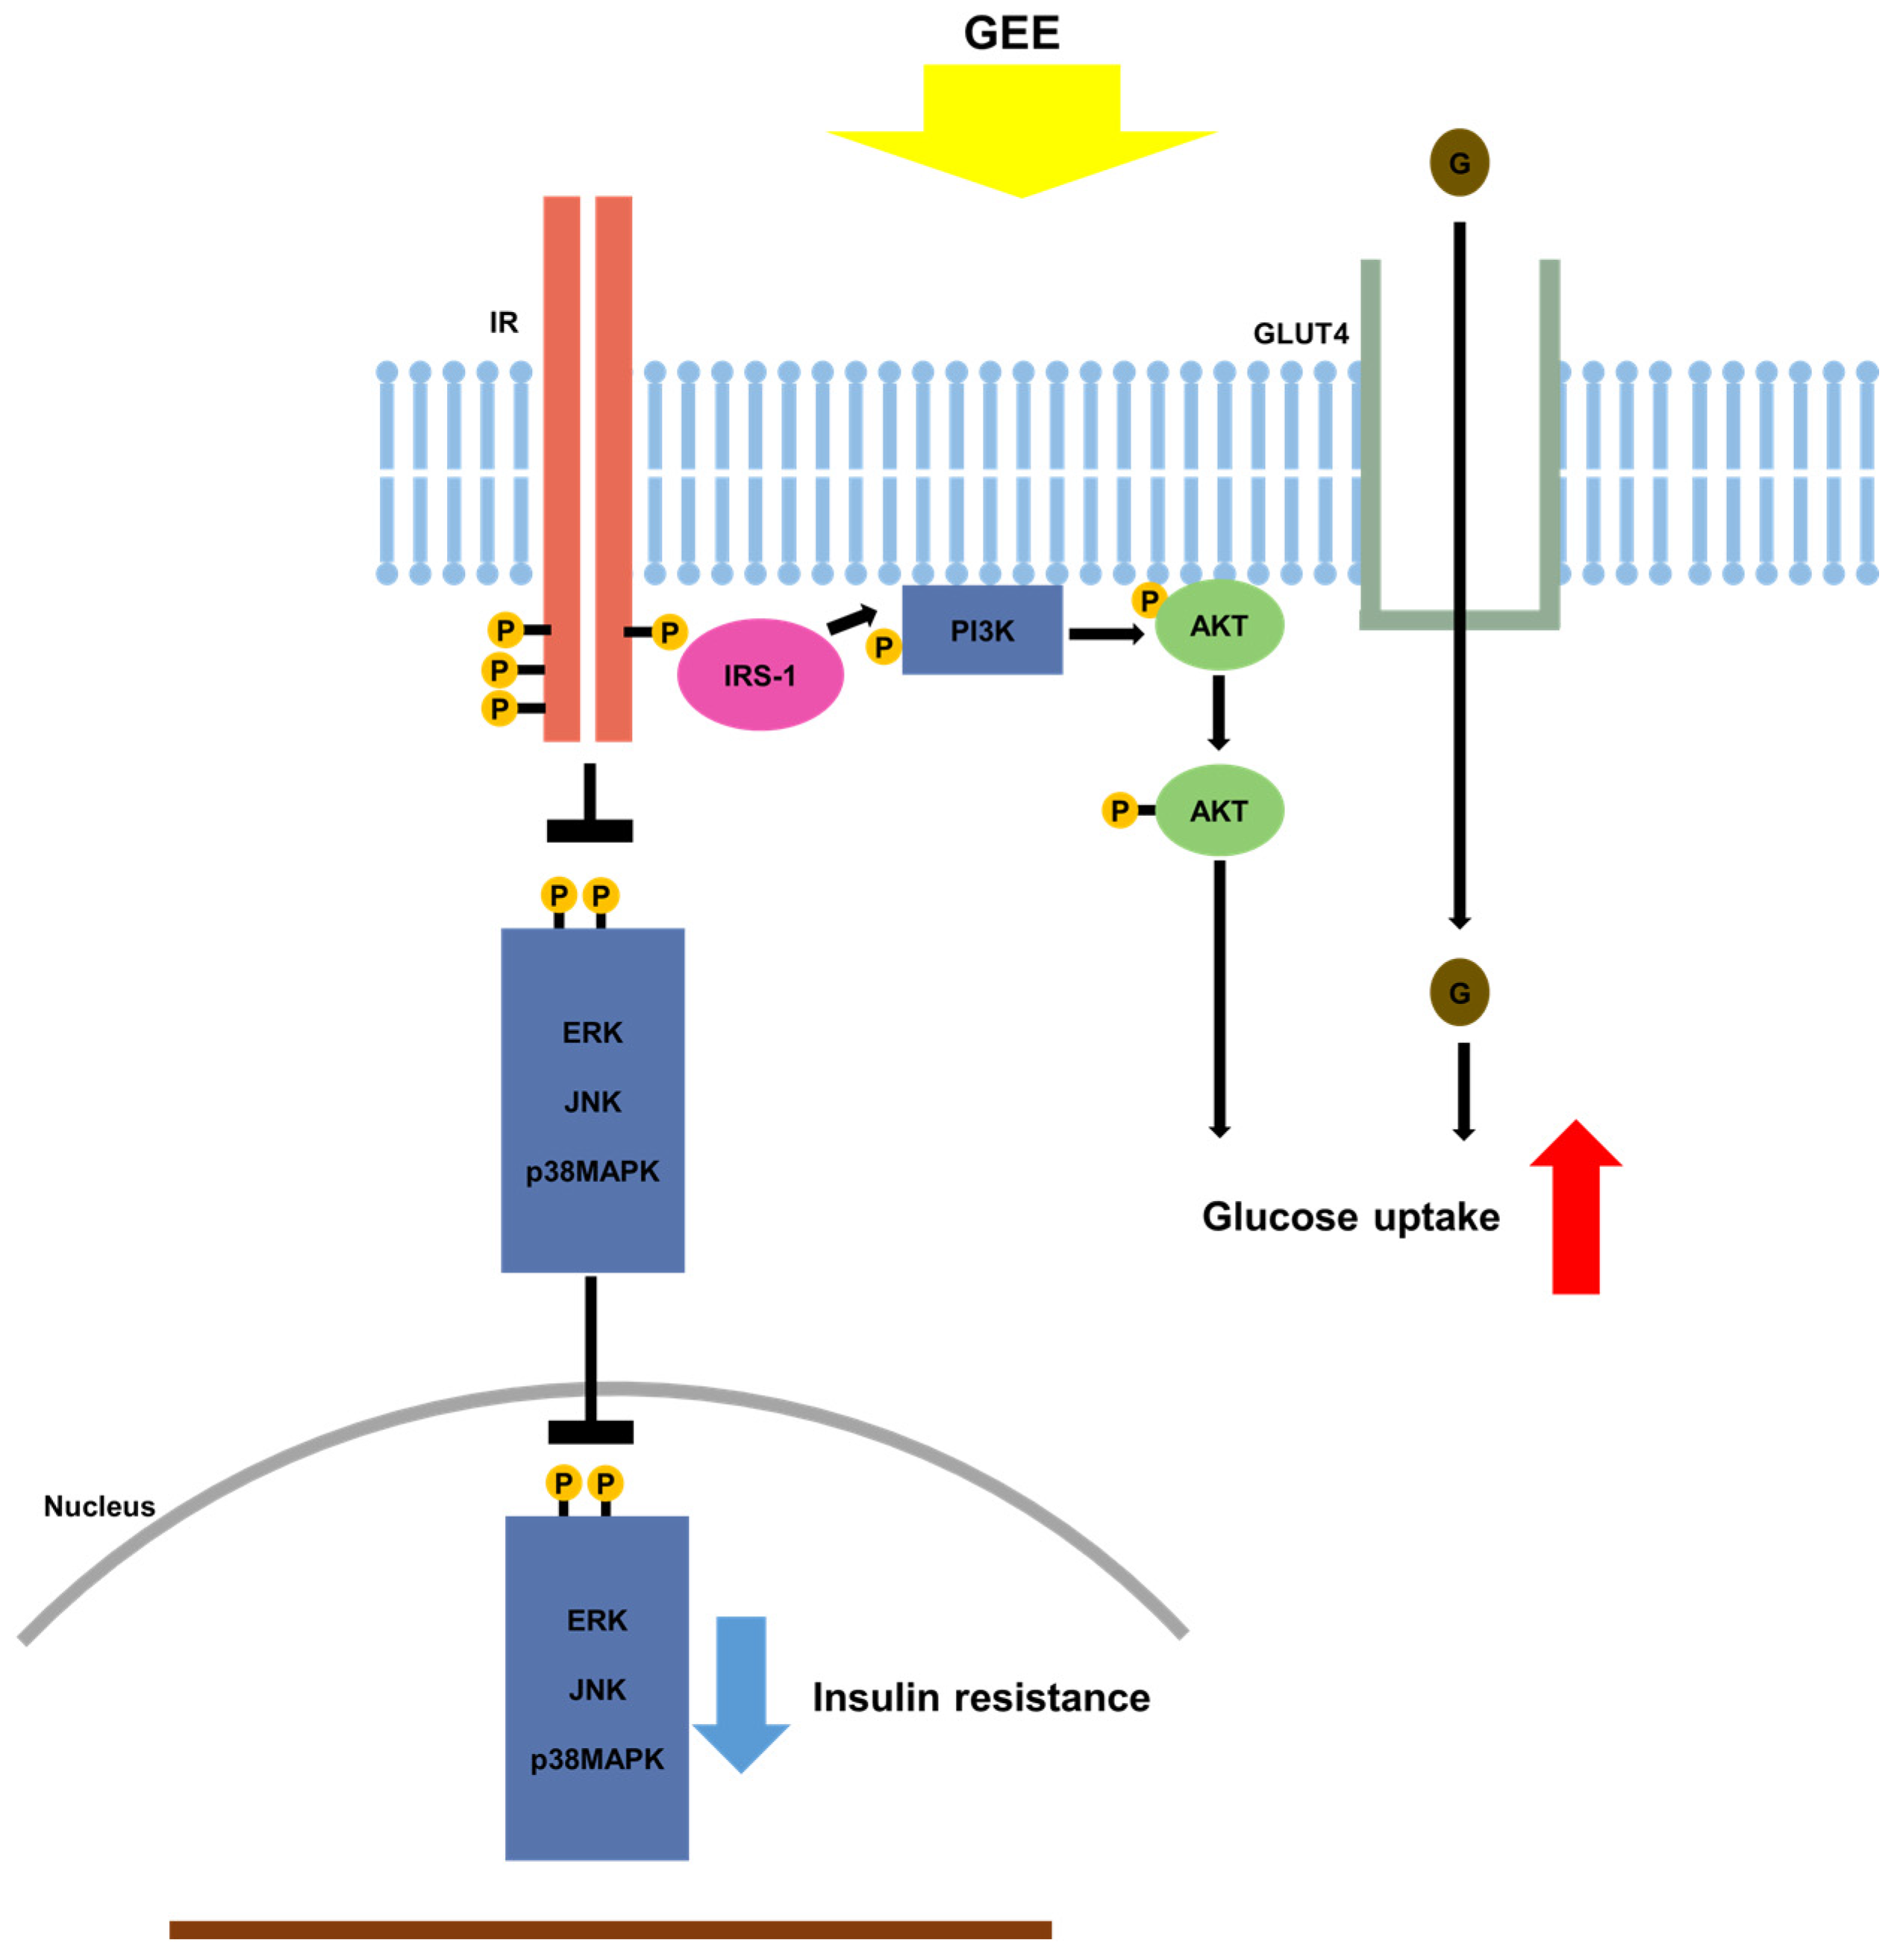
Previous work demonstrated that the activation of MAPK signaling cascades may suppress the phosphorylation of IRS, leading to insulin resistance [61]. Interestingly, the activation of MAPK signaling cascades downregulates GLUT4 expression, resulting in reduced glucose transport [62]. In the present study, the activation of p38 MAPK, ERK, and JNK in the skeletal muscle and liver of db/db mice was significantly suppressed by the administration of GEE. These findings suggest that GEE may increase glucose uptake and ameliorate insulin resistance by reducing p38 MAPK, ERK, and JNK phosphorylation (Figure 6).
In many studies, body mass and subcutaneous adipose mass have been shown to be higher in diabetes [63]. In addition, a number of widely prescribed diabetes drugs have been shown to lower blood glucose by upregulating the transport of glucose into cells [64,65]. Visceral fat accumulation can contribute to this reduction in glucose uptake, poor metabolic control, and the development of diabetes complications. We previously showed that GEE-treated mice have less adipose tissue, both subcutaneous and abdominal, in association with higher uncoupling protein-1 activation [32]. Consistent with our previous results, we show here that GEE decreased body and organ mass, including that of visceral fat and liver. This might indicate that GEE promotes mitochondrial activity in brown adipose tissue, in which metabolic energy is dissipated as heat. GEE treatment may also reduce visceral fat mass, but further studies are needed to verify the involvement of altered mitochondrial activity in the anti-diabetic actions of GEE.
In summary, our study demonstrates that GEE lowers blood glucose and relieves the clinical signs of diabetes in mice, likely mediated through greater glucose uptake in peripheral tissues through the upregulation of GLUT4 and the PI3K/Akt pathway. Moreover, GEE activates IRS-1 and inhibits activation of MAPK pathways, and therefore should ameliorate insulin resistance and the clinical signs of diabetes. These data support the potential use of GEE for the treatment of diabetes.
Acknowledgments
This work was supported by the National Research Foundation of Korea (NRF), which is funded by the Ministry of Education (20161D1A1A09917209).
Author Contributions
Jia Choi conceived and designed the study; Jia Choi and Eun-Jeong Koh performed the experiments; Jia Choi and Kui-Jin Kim analyzed the data; Jia Choi and Boo-Yong Lee wrote and edited the paper.
Conflicts of Interest
The authors declare no conflict of interest.
References
- Musselman, D.L.; Betan, E.; Larsen, H.; Phillips, L.S. Relationship of depression to diabetes types 1 and 2: Epidemiology, biology, and treatment. Biol. Psychiatry 2003, 54, 317–329. [Google Scholar] [CrossRef]
- Burge, M.R.; Schade, D.S. Diabetes and the Affordable Care Act; Mary Ann Liebert, Inc.: New Rochelle, NY, USA, 2014. [Google Scholar]
- Cnop, M.; Welsh, N.; Jonas, J.-C.; Jörns, A.; Lenzen, S.; Eizirik, D.L. Mechanisms of pancreatic β-cell death in type 1 and type 2 diabetes. Diabetes 2005, 54, S97–S107. [Google Scholar] [CrossRef] [PubMed]
- DeFronzo, R.A.; Ferrannini, E. Insulin resistance: A multifaceted syndrome responsible for NIDDM, obesity, hypertension, dyslipidemia, and atherosclerotic cardiovascular disease. Diabetes Care 1991, 14, 173–194. [Google Scholar] [CrossRef] [PubMed]
- Robinson, M.J.; Cobb, M.H. Mitogen-activated protein kinase pathways. Curr. Opin. Cell Biol. 1997, 9, 180–186. [Google Scholar] [CrossRef]
- Li, S.; Brown, M.S.; Goldstein, J.L. Bifurcation of insulin signaling pathway in rat liver: MTORC1 required for stimulation of lipogenesis, but not inhibition of gluconeogenesis. Proc. Natl. Acad. Sci. USA 2010, 107, 3441–3446. [Google Scholar] [CrossRef] [PubMed]
- Harrington, L.S.; Findlay, G.M.; Gray, A.; Tolkacheva, T.; Wigfield, S.; Rebholz, H.; Barnett, J.; Leslie, N.R.; Cheng, S.; Shepherd, P.R. The TSC1-2 tumor suppressor controls insulin–PI3K signaling via regulation of IRS proteins. J. Cell Biol. 2004, 166, 213–223. [Google Scholar] [CrossRef] [PubMed]
- Khorami, S.A.H.; Movahedi, A.; Khaza’ai, H.; Mutalib, A.; Sokhini, M. PI3K/AKT pathway in modulating glucose homeostasis and its alteration in diabetes. AMBS 2015, 1, 46–55. [Google Scholar]
- Sano, H.; Eguez, L.; Teruel, M.N.; Fukuda, M.; Chuang, T.D.; Chavez, J.A.; Lienhard, G.E.; McGraw, T.E. Rab10, a target of the AS160 Rab GAP, is required for insulin-stimulated translocation of GLUT4 to the adipocyte plasma membrane. Cell Metab. 2007, 5, 293–303. [Google Scholar] [CrossRef] [PubMed]
- Kraegen, E.W.; Clark, P.W.; Jenkins, A.B.; Daley, E.A.; Chisholm, D.J.; Storlien, L.H. Development of muscle insulin resistance after liver insulin resistance in high-fat–fed rats. Diabetes 1991, 40, 1397–1403. [Google Scholar] [CrossRef] [PubMed]
- Guilherme, A.; Virbasius, J.V.; Puri, V.; Czech, M.P. Adipocyte dysfunctions linking obesity to insulin resistance and type 2 diabetes. Nat. Rev. Mol. Cell Biol. 2008, 9, 367–377. [Google Scholar] [CrossRef] [PubMed]
- DeFronzo, R.A.; Tripathy, D. Skeletal muscle insulin resistance is the primary defect in type 2 diabetes. Diabetes Care 2009, 32 (Suppl. 2), S157–S163. [Google Scholar] [CrossRef] [PubMed]
- Aksamitiene, E.; Kiyatkin, A.; Kholodenko, B.N. Cross-Talk between Mitogenic Ras/MAPK and Survival PI3K/Akt Pathways: A Fine Balance; Portland Press Limited: London, UK, 2012. [Google Scholar]
- Miyoshi, H.; Kato, K.; Iwama, H.; Maeda, E.; Sakamoto, T.; Fujita, K.; Toyota, Y.; Tani, J.; Nomura, T.; Mimura, S. Effect of the anti-diabetic drug metformin in hepatocellular carcinoma in vitro and in vivo. Int. J. Oncol. 2014, 45, 322–332. [Google Scholar] [CrossRef] [PubMed]
- Hampp, C.; Borders-Hemphill, V.; Moeny, D.G.; Wysowski, D.K. Use of antidiabetic drugs in the US, 2003–2012. Diabetes Care 2014, 37, 1367–1374. [Google Scholar] [CrossRef] [PubMed]
- Doran, E.; Halestrap, A.P. Evidence that metformin exerts its anti-diabetic effects through inhibition of complex 1 of the mitochondrial respiratory chain. Biochem. J. 2000, 348, 607–614. [Google Scholar]
- Kramer, D.; Shapiro, R.; Adler, A.; Bush, E.; Rondinone, C. Insulin-sensitizing effect of rosiglitazone (BRL-49653) by regulation of glucose transporters in muscle and fat of Zucker rats. Metabolism 2001, 50, 1294–1300. [Google Scholar] [CrossRef] [PubMed]
- Sugiyama, Y.; Taketomi, S.; Shimura, Y.; Ikeda, H.; Fujita, T. Effects of pioglitazone on glucose and lipid metabolism in Wistar fatty rats. Arzneimittelforschung 1990, 40, 263–267. [Google Scholar] [PubMed]
- Singh, S.; Loke, Y.K.; Furberg, C.D. Long-term risk of cardiovascular events with rosiglitazone: A meta-analysis. JAMA 2007, 298, 1189–1195. [Google Scholar] [CrossRef] [PubMed]
- Schuster, D.P.; Duvuuri, V. Diabetes mellitus. Clin. Podiatr. Med. Surg. 2002, 19, 79–107. [Google Scholar] [CrossRef]
- Tunnicliffe, J.M.; Shearer, J. Coffee, glucose homeostasis, and insulin resistance: Physiological mechanisms and mediators. Appl. Physiol. Nutr. Metab. 2008, 33, 1290–1300. [Google Scholar] [CrossRef] [PubMed]
- Kim, K.-J.; Yoon, K.-Y.; Lee, B.-Y. Fucoidan regulate blood glucose homeostasis in C57BL/KSJ m+/+ db and C57BL/KSJ db/db mice. Fitoterapia 2012, 83, 1105–1109. [Google Scholar] [CrossRef] [PubMed]
- Hannan, J.; Ali, L.; Rokeya, B.; Khaleque, J.; Akhter, M.; Flatt, P.; Abdel-Wahab, Y. Soluble dietary fibre fraction of Trigonella foenum-graecum (fenugreek) seed improves glucose homeostasis in animal models of type 1 and type 2 diabetes by delaying carbohydrate digestion and absorption, and enhancing insulin action. Br. J. Nutr. 2007, 97, 514–521. [Google Scholar] [CrossRef] [PubMed]
- Kang, S.-I.; Jin, Y.-J.; Ko, H.-C.; Choi, S.-Y.; Hwang, J.-H.; Whang, I.; Kim, M.-H.; Shin, H.-S.; Jeong, H.-B.; Kim, S.-J. Petalonia improves glucose homeostasis in streptozotocin-induced diabetic mice. Biochem. Biophys. Res. Commun. 2008, 373, 265–269. [Google Scholar] [CrossRef] [PubMed]
- Pari, L.; Satheesh, M.A. Effect of pterostilbene on hepatic key enzymes of glucose metabolism in streptozotocin-and nicotinamide-induced diabetic rats. Life Sci. 2006, 79, 641–645. [Google Scholar] [CrossRef] [PubMed]
- Soufi, F.; Sheervalilou, R.; Vardiani, M.; Khalili, M.; Alipour, M. Chronic resveratrol administration has beneficial effects in experimental model of type 2 diabetic rats. Endocr. Regul. 2012, 46, 83–90. [Google Scholar] [CrossRef] [PubMed]
- Weisberg, S.P.; Leibel, R.; Tortoriello, D.V. Dietary curcumin significantly improves obesity-associated inflammation and diabetes in mouse models of diabesity. Endocrinology 2008, 149, 3549–3558. [Google Scholar] [CrossRef] [PubMed]
- Kim, M.S.; Kim, J.Y.; Choi, W.H.; Lee, S.S. Effects of seaweed supplementation on blood glucose concentration, lipid profile, and antioxidant enzyme activities in patients with type 2 diabetes mellitus. Nutr. Res. Pract. 2008, 2, 62–67. [Google Scholar] [CrossRef] [PubMed]
- Kang, M.-C.; Wijesinghe, W.; Lee, S.-H.; Kang, S.-M.; Ko, S.-C.; Yang, X.; Kang, N.; Jeon, B.-T.; Kim, J.; Lee, D.-H. Dieckol isolated from brown seaweed Ecklonia cava attenuates type ІІ diabetes in db/db mouse model. Food Chem. Toxicol. 2013, 53, 294–298. [Google Scholar] [CrossRef] [PubMed]
- Maeda, H.; Hosokawa, M.; Sashima, T.; Miyashita, K. Dietary combination of fucoxanthin and fish oil attenuates the weight gain of white adipose tissue and decreases blood glucose in obese/diabetic KK-Ay mice. J. Agric. Food Chem. 2007, 55, 7701–7706. [Google Scholar] [CrossRef] [PubMed]
- Kang, M.C.; Kang, N.; Kim, S.Y.; Lima, I.S.; Ko, S.C.; Kim, Y.T.; Kim, Y.B.; Jeung, H.D.; Choi, K.S.; Jeon, Y.J. Popular edible seaweed, Gelidium amansii prevents against diet-induced obesity. Food Chem. Toxicol. 2016, 90, 181–187. [Google Scholar] [CrossRef] [PubMed]
- Choi, J.; Kim, K.J.; Koh, E.J.; Lee, B.Y. Gelidium elegans Regulates the AMPK-PRDM16-UCP-1 Pathway and Has a Synergistic Effect with Orlistat on Obesity-Associated Features in Mice Fed a High-Fat Diet. Nutrients 2017, 9, 342. [Google Scholar] [CrossRef] [PubMed]
- Choi, J.; Kim, K.-J.; Koh, E.-J.; Lee, B.-Y. Altered Gelidium elegans extract-stimulated beige-like phenotype attenuates adipogenesis in 3T3-L1 cells. J. Food Nutr. Res. 2016, 4, 448–453. [Google Scholar]
- Jeon, H.J.; Seo, M.J.; Choi, H.S.; Lee, O.H.; Lee, B.Y. Gelidium elegans, an Edible Red Seaweed, and Hesperidin Inhibit Lipid Accumulation and Production of Reactive Oxygen Species and Reactive Nitrogen Species in 3T3-L1 and RAW264.7 Cells. Phytother. Res. 2014, 28, 1701–1709. [Google Scholar] [CrossRef] [PubMed]
- Choi, J.; Kim, K.-J.; Koh, E.-J.; Seo, Y.-J.; Lee, B.-Y. Gelidium elegans Regulates Blood Glucose Homeostasis in ICR Mice. J. Food Nutr. Res. 2017, 5, 274–280. [Google Scholar]
- Kim, M.; Lim, J.; Youn, H.; Hong, Y.; Yang, K.; Park, H.; Chung, S.; Koh, S.; Shin, S.; Choi, B. Resveratrol prevents renal lipotoxicity and inhibits mesangial cell glucotoxicity in a manner dependent on the AMPK–SIRT1–PGC1α axis in db/db mice. Diabetologia 2013, 56, 204–217. [Google Scholar] [CrossRef] [PubMed]
- Burke, S.J.; Batdorf, H.M.; Burk, D.H.; Noland, R.C.; Eder, A.E.; Boulos, M.S.; Karlstad, M.D.; Jason Collier, J. db/db Mice Exhibit Features of Human Type 2 Diabetes That Are Not Present in Weight-Matched C57BL/6J Mice Fed a Western Diet. J. Diabetes Res. 2017, 2017, 116–132. [Google Scholar] [CrossRef] [PubMed]
- Nishina, P.M.; Lowe, S.; Wang, J.; Paigen, B. Characterization of plasma lipids in genetically obese mice: The mutants obese, diabetes, fat, tubby, and lethal yellow. Metabolism 1994, 43, 549–553. [Google Scholar] [CrossRef]
- Harlow, E.; Lane, D. Antibodies: A Laboratory Manual; Cold Spring Harbor Press: Cold Spring Harbor, NY, USA, 1988; pp. 139–245. [Google Scholar]
- Worthington, D.R.; Brown, S.J. Diabetes Management System and Method for Controlling Blood Glucose. Patent USRE43316 E1, 17 April 2012. [Google Scholar]
- Ma, D.L.; Chen, F.Q.; Xu, W.J.; Yue, W.Z.; Yuan, G.; Yang, Y. Early intervention with glucagon-like peptide 1 analog liraglutide prevents tau hyperphosphorylation in diabetic db/db mice. J. Neurochem. 2015, 135, 301–308. [Google Scholar] [CrossRef] [PubMed]
- Pruessner, J.C.; Kirschbaum, C.; Meinlschmid, G.; Hellhammer, D.H. Two formulas for computation of the area under the curve represent measures of total hormone concentration versus time-dependent change. Psychoneuroendocrinology 2003, 28, 916–931. [Google Scholar] [CrossRef]
- Nauck, M.A.; Heimesaat, M.M.; Orskov, C.; Holst, J.J.; Ebert, R.; Creutzfeldt, W. Preserved incretin activity of glucagon-like peptide 1 [7-36 amide] but not of synthetic human gastric inhibitory polypeptide in patients with type-2 diabetes mellitus. J. Clin. Investig. 1993, 91, 301–307. [Google Scholar] [CrossRef] [PubMed]
- Rohlfing, C.L.; Little, R.R.; Wiedmeyer, H.-M.; England, J.D.; Madsen, R.; Harris, M.I.; Flegal, K.M.; Eberhardt, M.S.; Goldstein, D.E. Use of GHb (HbA1c) in screening for undiagnosed diabetes in the US population. Diabetes Care 2000, 23, 187–191. [Google Scholar] [CrossRef] [PubMed]
- Wallberg-Henriksson, H.; Zierath, J.R. GLUT4: A key player regulating glucose homeostasis? Insights from transgenic and knockout mice. Mol. Membr. Biol. 2001, 18, 205–211. [Google Scholar] [CrossRef] [PubMed]
- Liu, M.-L.; Gibbs, E.M.; McCoid, S.C.; Milici, A.; Stukenbrok, H.A.; McPherson, R.K.; Treadway, J.L.; Pessin, J.E. Transgenic mice expressing the human GLUT4/muscle-fat facilitative glucose transporter protein exhibit efficient glycemic control. Proc. Natl. Acad. Sci. USA 1993, 90, 11346–11350. [Google Scholar] [CrossRef] [PubMed]
- Carvalho, E.; Jansson, P.-A.; Nagaev, I.; Wenthzel, A.-M.; Smith, U. Insulin resistance with low cellular IRS-1 expression is also associated with low GLUT4 expression and impaired insulin-stimulated glucose transport. FASEB J. 2001, 15, 1101–1103. [Google Scholar] [CrossRef] [PubMed]
- Tremblay, F.; Lavigne, C.; Jacques, H.; Marette, A. Defective insulin-induced GLUT4 translocation in skeletal muscle of high fat–fed rats is associated with alterations in both Akt/protein kinase B and atypical protein kinase C (ζ/λ) activities. Diabetes 2001, 50, 1901–1910. [Google Scholar] [CrossRef] [PubMed]
- Jeon, H.-J.; Yoon, K.-Y.; Koh, E.-J.; Choi, J.; Kim, K.-J.; Choi, H.-S.; Lee, B.-Y. Seapolynol and Dieckol Improve Insulin Sensitivity through the Regulation of the PI3K Pathway in C57BL/KsJ-db/db Mice. J. Food Nutr. Res. 2015, 3, 648–652. [Google Scholar] [CrossRef]
- Gogg, S.; Smith, U.; Jansson, P.-A. Increased MAPK activation and impaired insulin signaling in subcutaneous microvascular endothelial cells in type 2 diabetes: The role of endothelin-1. Diabetes 2009, 58, 2238–2245. [Google Scholar] [CrossRef] [PubMed]
- Zhou, J.; Xu, G.; Ma, S.; Li, F.; Yuan, M.; Xu, H.; Huang, K. Catalpol ameliorates high-fat diet-induced insulin resistance and adipose tissue inflammation by suppressing the JNK and NF-κB pathways. Biochem. Biophys. Res. Commun. 2015, 467, 853–858. [Google Scholar] [CrossRef] [PubMed]
- Weyer, C.; Bogardus, C.; Mott, D.M.; Pratley, R.E. The natural history of insulin secretory dysfunction and insulin resistance in the pathogenesis of type 2 diabetes mellitus. J. Clin. Investig. 1999, 104, 787–794. [Google Scholar] [CrossRef] [PubMed]
- Cline, G.W.; Petersen, K.F.; Krssak, M.; Shen, J.; Hundal, R.S.; Trajanoski, Z.; Inzucchi, S.; Dresner, A.; Rothman, D.L.; Shulman, G.I. Impaired glucose transport as a cause of decreased insulin-stimulated muscle glycogen synthesis in type 2 diabetes. New Engl. J. Med. 1999, 341, 240–246. [Google Scholar] [CrossRef] [PubMed]
- Abel, E.D.; Peroni, O.; Kim, J.K.; Young-Bum, K. Adipose-selective targeting of the GLUT4 gene impairs insulin action in muscle and liver. Nature 2001, 409, 729–733. [Google Scholar] [CrossRef] [PubMed]
- Carvalho, E.; Kotani, K.; Peroni, O.D.; Kahn, B.B. Adipose-specific overexpression of GLUT4 reverses insulin resistance and diabetes in mice lacking GLUT4 selectively in muscle. Am. J. Physiol. Endocrinol. Metab. 2005, 289, E551–E561. [Google Scholar] [CrossRef] [PubMed]
- Kerouz, N.J.; Hörsch, D.; Pons, S.; Kahn, C.R. Differential regulation of insulin receptor substrates-1 and-2 (IRS-1 and IRS-2) and phosphatidylinositol 3-kinase isoforms in liver and muscle of the obese diabetic (ob/ob) mouse. J. Clin. Investig. 1997, 100, 3164–3172. [Google Scholar] [CrossRef] [PubMed]
- Khamzina, L.; Veilleux, A.; Bergeron, S.; Marette, A. Increased activation of the mammalian target of rapamycin pathway in liver and skeletal muscle of obese rats: Possible involvement in obesity-linked insulin resistance. Endocrinology 2005, 146, 1473–1481. [Google Scholar] [CrossRef] [PubMed]
- Chen, K.; Li, G.; Geng, F.; Zhang, Z.; Li, J.; Yang, M.; Dong, L.; Gao, F. Berberine reduces ischemia/reperfusion-induced myocardial apoptosis via activating AMPK and PI3K–Akt signaling in diabetic rats. Apoptosis 2014, 19, 946–957. [Google Scholar] [CrossRef] [PubMed]
- Schultze, S.M.; Hemmings, B.A.; Niessen, M.; Tschopp, O. PI3K/AKT, MAPK and AMPK signalling: Protein kinases in glucose homeostasis. Expert Rev. Mol. Med. 2012, 14, e1. [Google Scholar] [CrossRef] [PubMed]
- Ponugoti, B.; Dong, G.; Graves, D.T. Role of forkhead transcription factors in diabetes-induced oxidative stress. Exp. Diabetes Res. 2012, 2012, 567–575. [Google Scholar] [CrossRef] [PubMed]
- Rondinone, C.M.; Wang, L.-M.; Lonnroth, P.; Wesslau, C.; Pierce, J.H.; Smith, U. Insulin receptor substrate (IRS) 1 is reduced and IRS-2 is the main docking protein for phosphatidylinositol 3-kinase in adipocytes from subjects with non-insulin-dependent diabetes mellitus. Proc. Natl. Acad. Sci. USA 1997, 94, 4171–4175. [Google Scholar] [CrossRef] [PubMed]
- Aguirre, V.; Uchida, T.; Yenush, L.; Davis, R.; White, M.F. The c-Jun NH2-terminal kinase promotes insulin resistance during association with insulin receptor substrate-1 and phosphorylation of Ser307. J. Biol. Chem. 2000, 275, 9047–9054. [Google Scholar] [CrossRef] [PubMed]
- Goodpaster, B.H.; Thaete, F.L.; Simoneau, J.-A.; Kelley, D.E. Subcutaneous abdominal fat and thigh muscle composition predict insulin sensitivity independently of visceral fat. Diabetes 1997, 46, 1579–1585. [Google Scholar] [CrossRef] [PubMed]
- Zhang, B.; Graziano, M.P.; Doebber, T.W.; Leibowitz, M.D.; White-Carrington, S.; Szalkowski, D.M.; Hey, P.J.; Wu, M.; Cullinan, C.A.; Bailey, P. Down-regulation of the expression of the obese gene by an antidiabetic thiazolidinedione in Zucker diabetic fatty rats and db/db mice. J. Biol. Chem. 1996, 271, 9455–9459. [Google Scholar] [CrossRef] [PubMed]
- Gross, J.L.; Kramer, C.K.; Leitão, C.B.; Hawkins, N.; Viana, L.V.; Schaan, B.D.; Pinto, L.C.; Rodrigues, T.C.; Azevedo, M.J. Effect of antihyperglycemic agents added to metformin and a sulfonylurea on glycemic control and weight gain in type 2 diabetes: A network meta-analysis. Ann. Intern. Med. 2011, 154, 672–679. [Google Scholar] [CrossRef] [PubMed]
Figure 1.
Effect of GEE on body mass (A); differences between time-points and treatments were analyzed by two-way ANOVA followed by Tukey’s multiple comparisons post hoc test. (n = 8 per group). Effect of GEE on subcutaneous fat (B); food intake/body mass ratio (C); and water consumption/body mass ratio (D) in db/db mice. Data were analyzed by a one-way ANOVA followed by Duncan’s test. Five-week-old mice were administered with or without GEE (50 and 200 mg/kg/day) for five weeks. Data are mean ± SD (n = 8 per group, a p < 0.05, b p < 0.01, c p < 0.001).

Figure 2.
Effect of GEE on fasting blood glucose in db/db mice. Prior to measurement, five-week-old mice were fasted for 12 h during the dark period. Blood glucose levels were measured weekly. The mice were treated with or without GEE (50 and 200 mg/kg/day) (A). Area under the curve for glucose (AUC glucose) was calculated using the trapezoidal rule (B). Differences between time-points and treatments were analyzed by two-way ANOVA followed by Tukey’s multiple comparisons post hoc test. Data are mean ± SD. (n = 8 per group, a p < 0.05, b p < 0.01, c p < 0.001).

Figure 3.
Effect of GEE on GLUT4 protein expression in the skeletal muscle and liver of db/db mice. Five-week-old mice were administered with or without GEE (50 and 200 mg/kg/day) for five weeks. GLUT4 was quantified by western blotting in the skeletal muscle (A) and liver (B). Protein expression was quantified after normalization to glyceraldehyde 3-phosphate dehydrogenase (GAPDH) using Image J software. Data were analyzed by a one-way ANOVA followed by Duncan’s test. Data are mean ± SD (n = 8 per group, a p < 0.05, b p < 0.01).
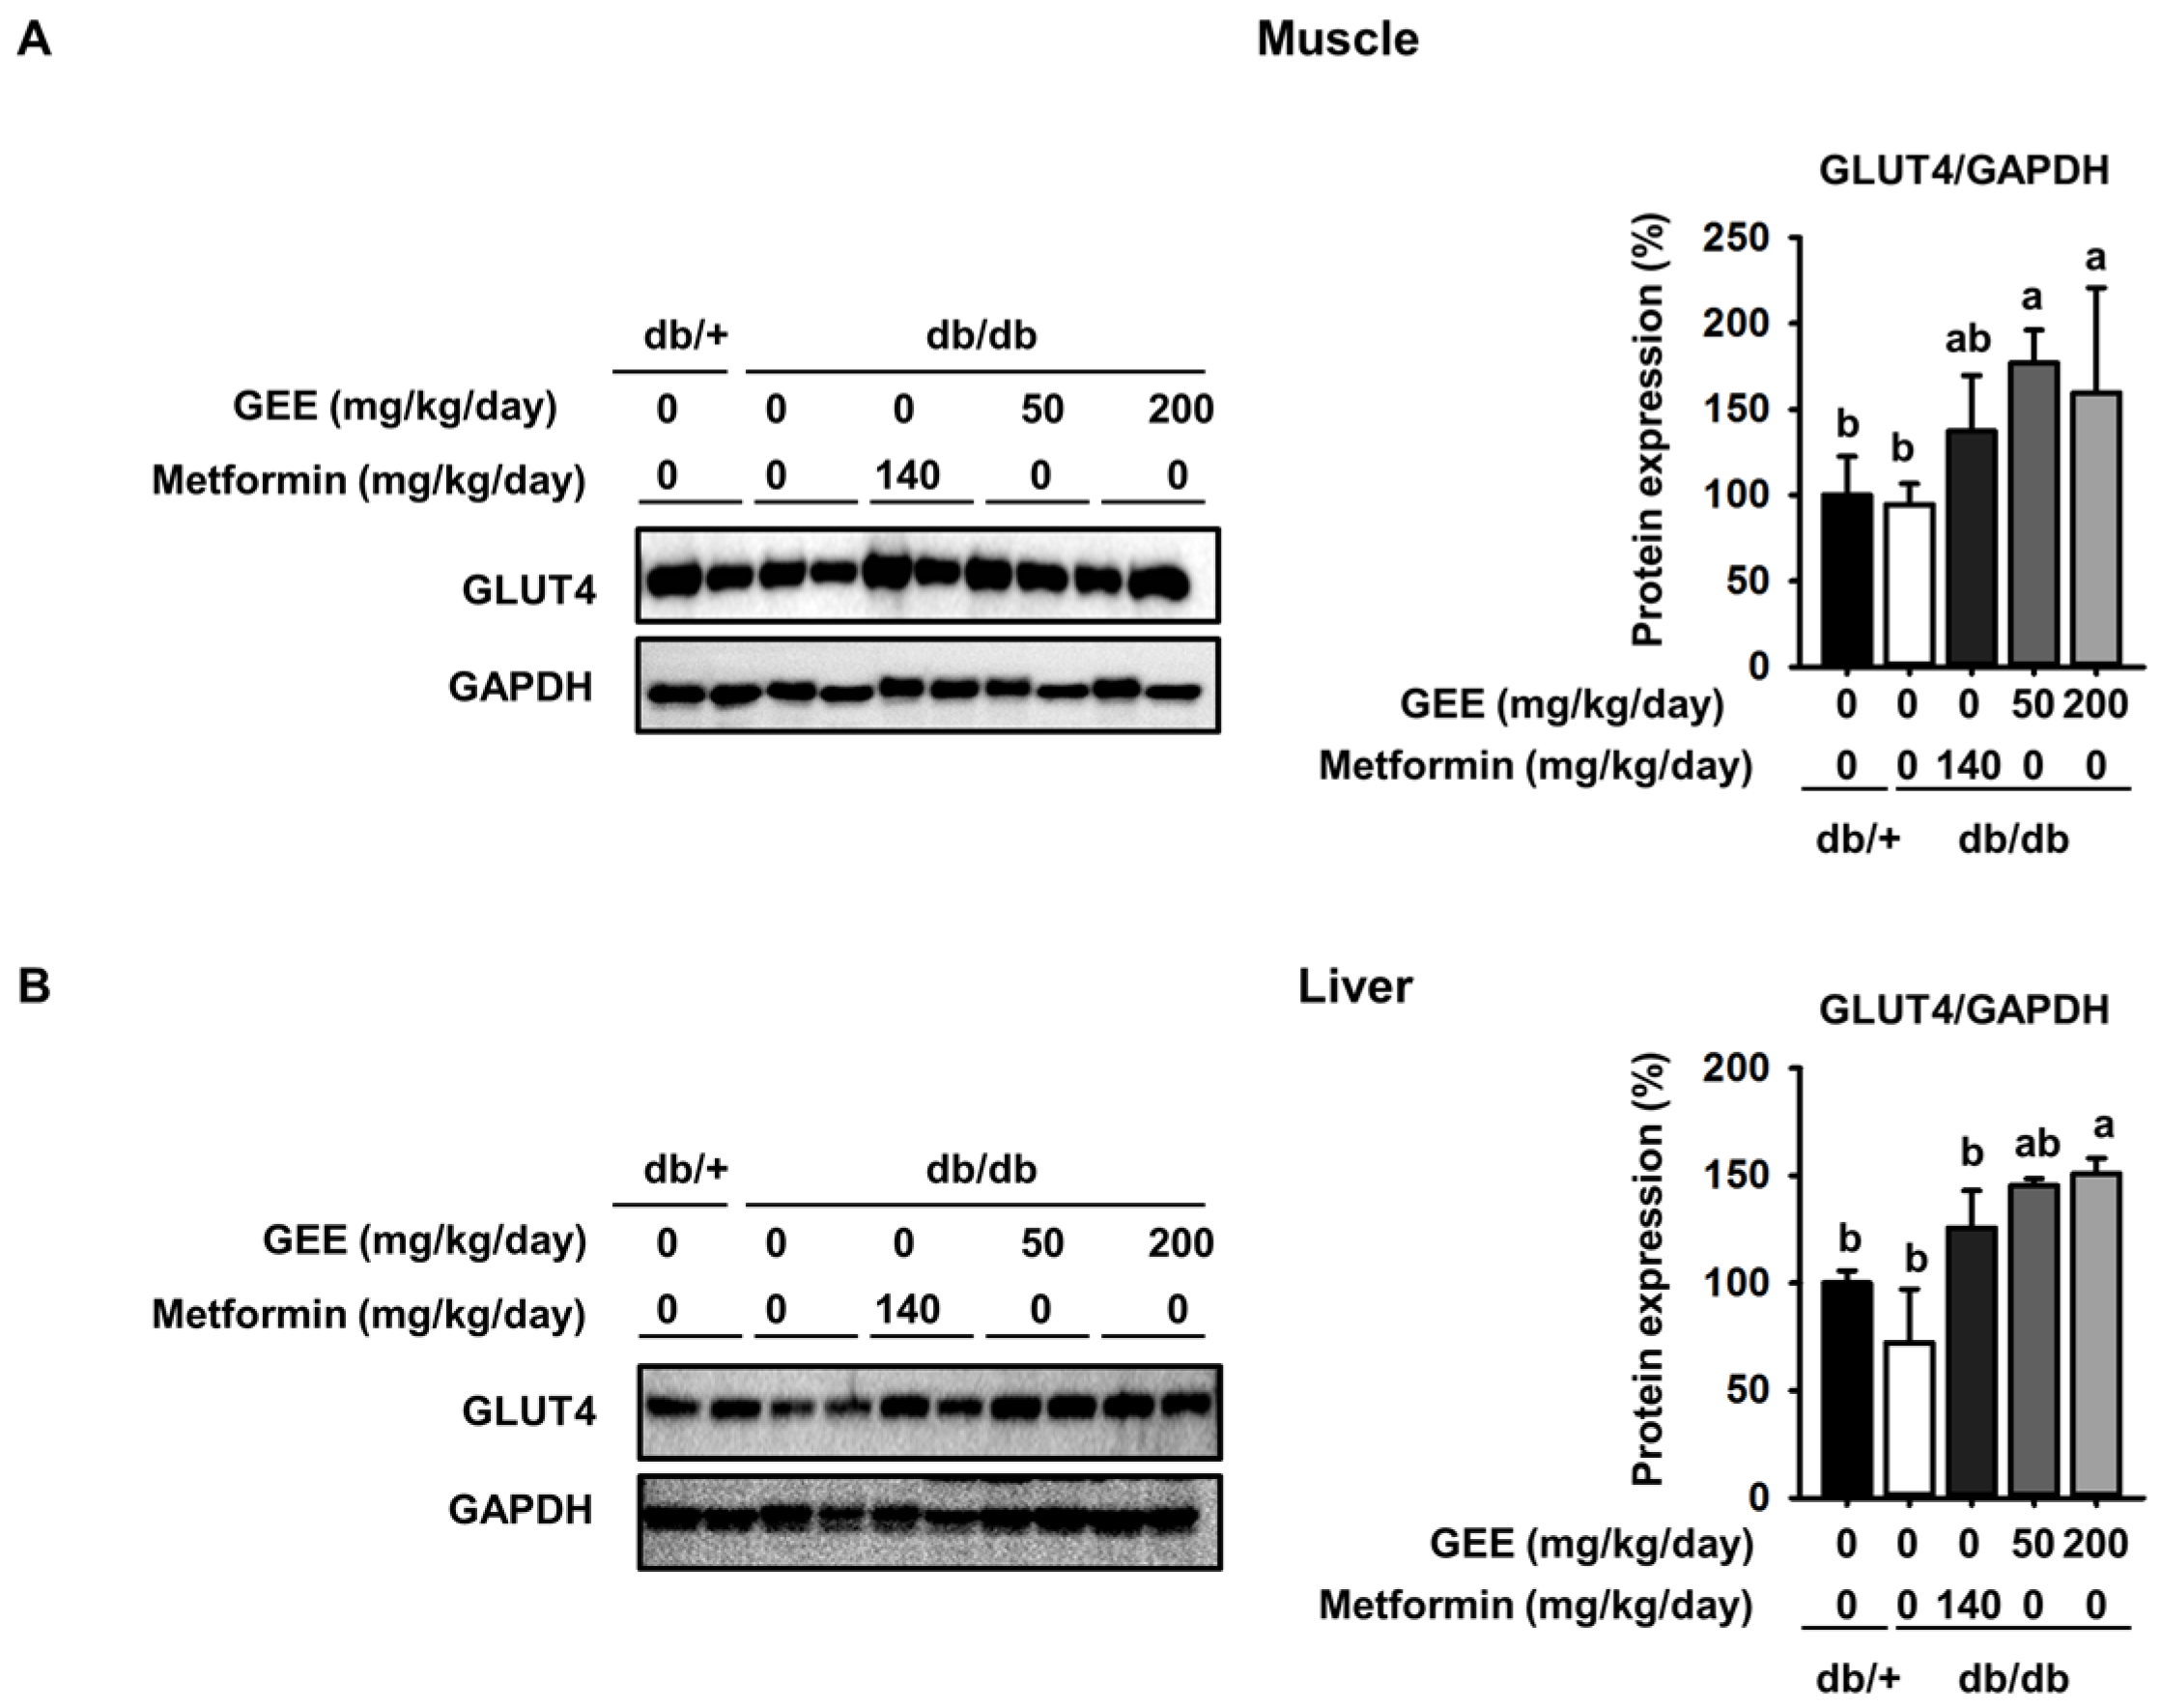
Figure 4.
GEE increases glucose uptake via the phosphoinositide 3-kinase (PI3K)/Akt pathway in db/db mice. Five-week-old mice were administered with or without GEE (50 and 200 mg/kg/day) for five weeks. phospho-IRS-1, phospho-PI3K, and phospho-Akt were determined by western blotting in the skeletal muscle (A) and liver (B). Phosphorylation of each intermediate was quantified after normalization to total insulin receptor substrate-1 (IRS-1), phosphoinositide 3-kinase (PI3K), and Akt protein expression levels, respectively, using Image J software. Data were analyzed by a one-way ANOVA followed by Duncan’s test. Data are mean ± SD (n = 8 per group, a p < 0.05, b p < 0.01, c p < 0.001).
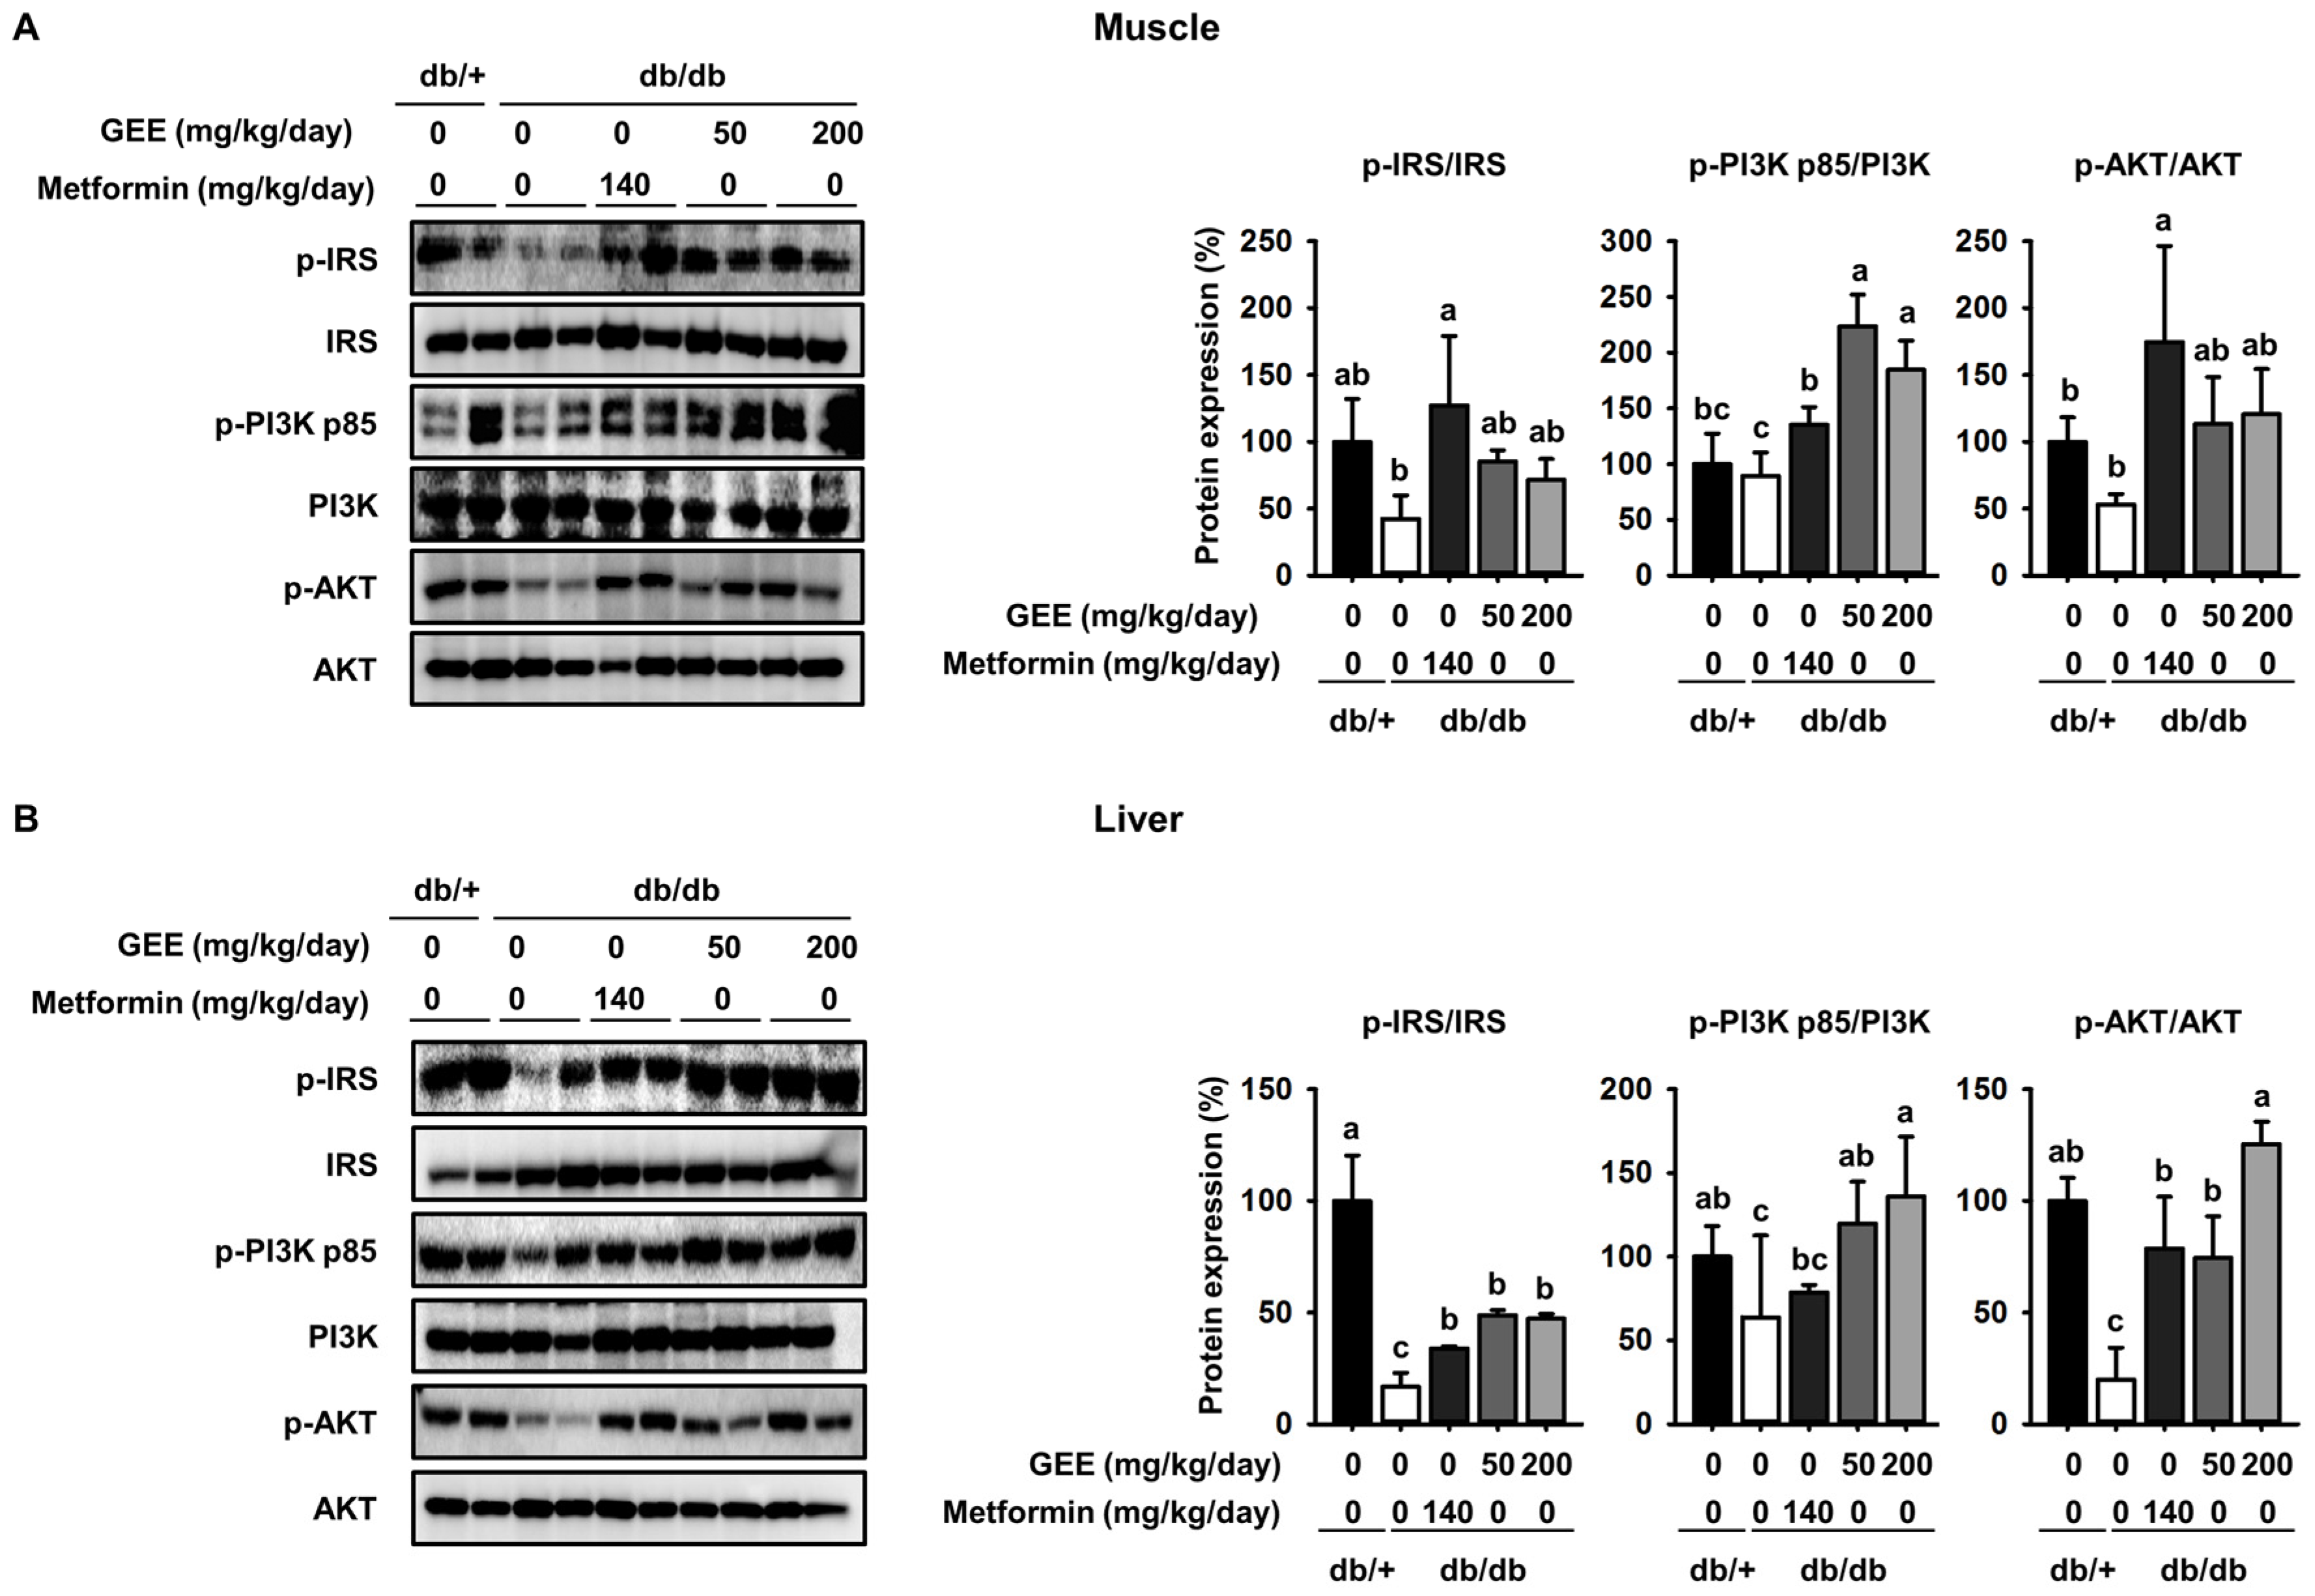
Figure 5.
GEE suppresses mitogen-activated protein kinase (MAPK) pathway activation in db/db mice. Five-week old mice were administered with or without GEE (50 and 200 mg/kg/day) for five weeks. p-p38 MAPK, p-ERK1/2, and p-JNK1/2 were evaluated by western blotting in the skeletal muscle (A) and liver (B). Phosphorylation levels were quantified after normalization to the total p38 MAPK, ERK1/2, and JNK1/2 protein, respectively, using Image J software. Data were analyzed by a one-way ANOVA followed by Duncan’s test. Data are mean ± SD (n = 8 per group, a p < 0.05, b p < 0.01, c p < 0.001).

Figure 6.
Proposed mechanism whereby GEE ameliorates type 2 diabetes through the regulation of MAPK and PI3K/Akt signaling. Gelidium elegans extract (GEE) stimulates glucose uptake and thus should ameliorate the clinical signs of diabetes, through activation of the phosphatidylinositol-3 kinase (p-PI3K)/protein kinase B (Akt) signaling pathway and suppression of mitogen-activated protein kinase (MAPK) signaling pathways. → indicates stimulation; ┴, inhibition; IR, insulin receptor; GLUT4, glucose transporter type 4; ERK, p44/42 MAPK; JNK; c-Jun N-terminal kinases.

Table 1.
Gelidium elegans extract (GEE) composition.
| Nutrient | Ingredient | Content |
|---|---|---|
| Proximate composition (%) | Moisture | 5.1 |
| Crude ash | 24.1 | |
| Crude protein | 16.7 | |
| Carbohydrate | 47.6 |
Table 2.
Effect of GEE on organ masses in db/db mice.
| Group | Organ Mass (g) | |||||
|---|---|---|---|---|---|---|
| db/+ | db/db | |||||
| Parameters | GEE 0 * | GEE 0 * | GEE 0 * | GEE 50 * | GEE 200 * | |
| Metformin 0 * | Metformin 0 * | Metformin 140 * | Metformin 0 * | Metformin 0 * | ||
| Subcutaneous fat | 0.30 ± 0.04 d | 1.63 ± 0.13 b | 1.83 ± 0.21 a | 1.53 ± 0.16 bc | 1.45 ± 0.13 c | |
| Liver | 1.08 ± 0.07 d | 2.13 ± 0.18 a | 1.89 ± 0.15 bc | 2.05 ± 0.15 ab | 1.84 ± 0.19 c | |
| Heart | 0.16 ± 0.03 | 0.15 ± 0.03 | 0.16 ± 0.01 | 0.15 ± 0.02 | 0.15 ± 0.02 | |
| Lung | 0.18 ± 0.03 | 0.19 ± 0.04 | 0.19 ± 0.03 | 0.19 ± 0.03 | 0.19 ± 0.03 | |
* (mg/kg/day), (n = 8 per group, a p < 0.05, b p < 0.01, c p < 0.001).
Table 3.
Effect of GEE on blood biochemistry in db/db mice. LDL: low-density lipoprotein; HbA1c: hemoglobin A1c.
Table 3.
Effect of GEE on blood biochemistry in db/db mice. LDL: low-density lipoprotein; HbA1c: hemoglobin A1c.
| Group | Blood Biochemistry | |||||
|---|---|---|---|---|---|---|
| db/+ | db/db | |||||
| Parameters | GEE 0 * | GEE 0 * | GEE 0 * | GEE 50 * | GEE 200 * | |
| Metformin 0 * | Metformin 0 * | Metformin 140 * | Metformin 0 * | Metformin 0 * | ||
| Insulin | 0.17 ± 0.08 b | 1.06 ± 0.54 a | 0.52 ± 0.20 ab | 0.91 ± 0.20 a | 0.58 ± 0.30 ab | |
| C-peptide | 35.7 ± 25.8 b | 336.0 ± 168.0 a | 178.2 ± 97.3 ab | 159.3 ± 167.4 b | 145.2 ± 57.0 b | |
| HbA1c (ng/mL) | 14.6 ± 2.5 b | 28.0 ± 4.1 a | 19.7 ± 1.9 bc | 21.7 ± 2.0 b | 16.1 ± 4.2 cd | |
| LDL (mg/dL) | 14.7 ± 0.3 | 14.4 ± 1.0 | 14.5 ± 0.9 | 14.4 ± 1.4 | 14.1 ± 0.9 | |
| Triglyceride (mg/dL) | 75.3 ± 8.0 b | 341.5 ± 97.2 a | 282.2 ± 108.5 a | 237.5 ± 136.9 a | 315.8 ± 174.0 a | |
| T. cholesterol (mg/dL) | 95.1 ± 9.1 b | 177.8 ± 24.0 a | 156.7 ± 21.9 a | 157.8 ± 33.5 a | 152.7 ± 15.6 a | |
* (mg/kg/day), (n = 8 per group, a p < 0.05, b p < 0.01, c p < 0.001).
© 2018 by the authors. Licensee MDPI, Basel, Switzerland. This article is an open access article distributed under the terms and conditions of the Creative Commons Attribution (CC BY) license (http://creativecommons.org/licenses/by/4.0/).
Share and Cite
MDPI and ACS Style
Choi, J.; Kim, K.-J.; Koh, E.-J.; Lee, B.-Y. Gelidium elegans Extract Ameliorates Type 2 Diabetes via Regulation of MAPK and PI3K/Akt Signaling. Nutrients 2018, 10, 51. https://doi.org/10.3390/nu10010051
AMA Style
Choi J, Kim K-J, Koh E-J, Lee B-Y. Gelidium elegans Extract Ameliorates Type 2 Diabetes via Regulation of MAPK and PI3K/Akt Signaling. Nutrients. 2018; 10(1):51. https://doi.org/10.3390/nu10010051
Chicago/Turabian StyleChoi, Jia, Kui-Jin Kim, Eun-Jeong Koh, and Boo-Yong Lee. 2018. "Gelidium elegans Extract Ameliorates Type 2 Diabetes via Regulation of MAPK and PI3K/Akt Signaling" Nutrients 10, no. 1: 51. https://doi.org/10.3390/nu10010051
Note that from the first issue of 2016, this journal uses article numbers instead of page numbers. See further details here.