Dose-Dependent Effects of Randomized Intraduodenal Whey-Protein Loads on Glucose, Gut Hormone, and Amino Acid Concentrations in Healthy Older and Younger Men

 , ,
, ,
Abstract
:1. Introduction
2. Materials and Methods
2.1. Subjects
2.2. Protocol
2.3. Measurements
2.4. Data and Statistical Analysis
3. Results
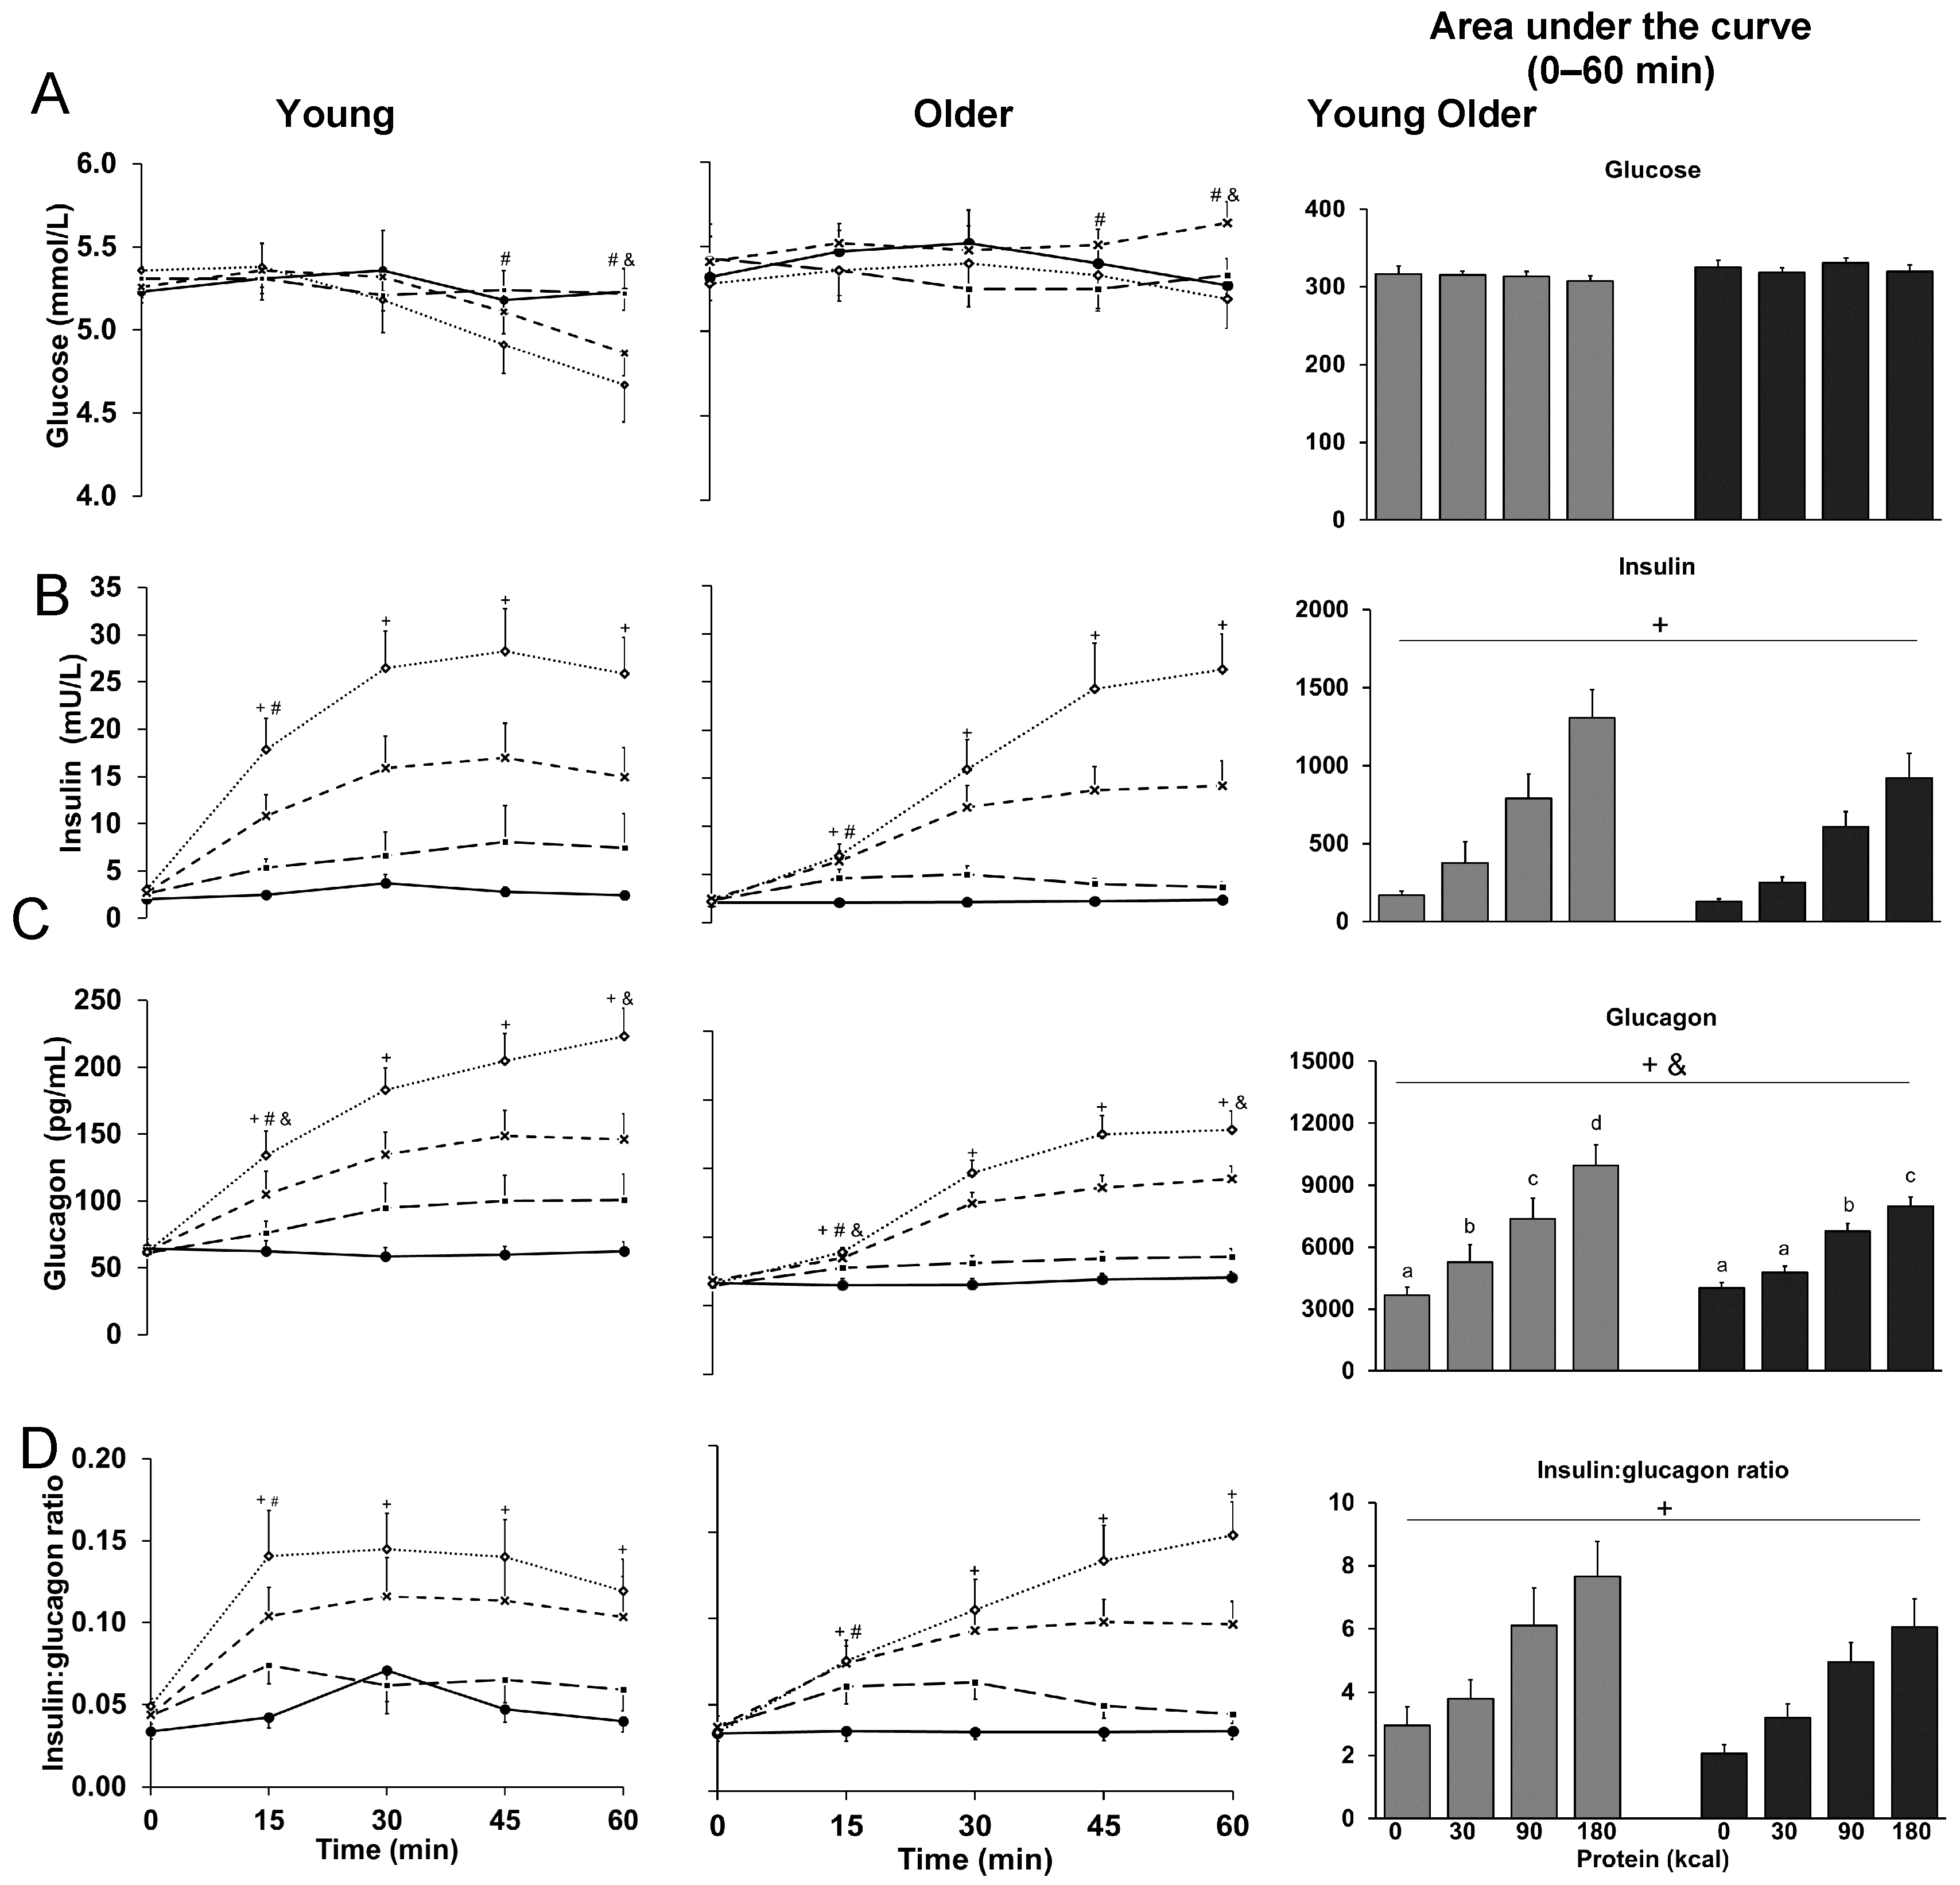
3.1. Glucose
3.2. Insulin
3.3. Glucagon
3.4. Ratio of Insulin to Glucagon
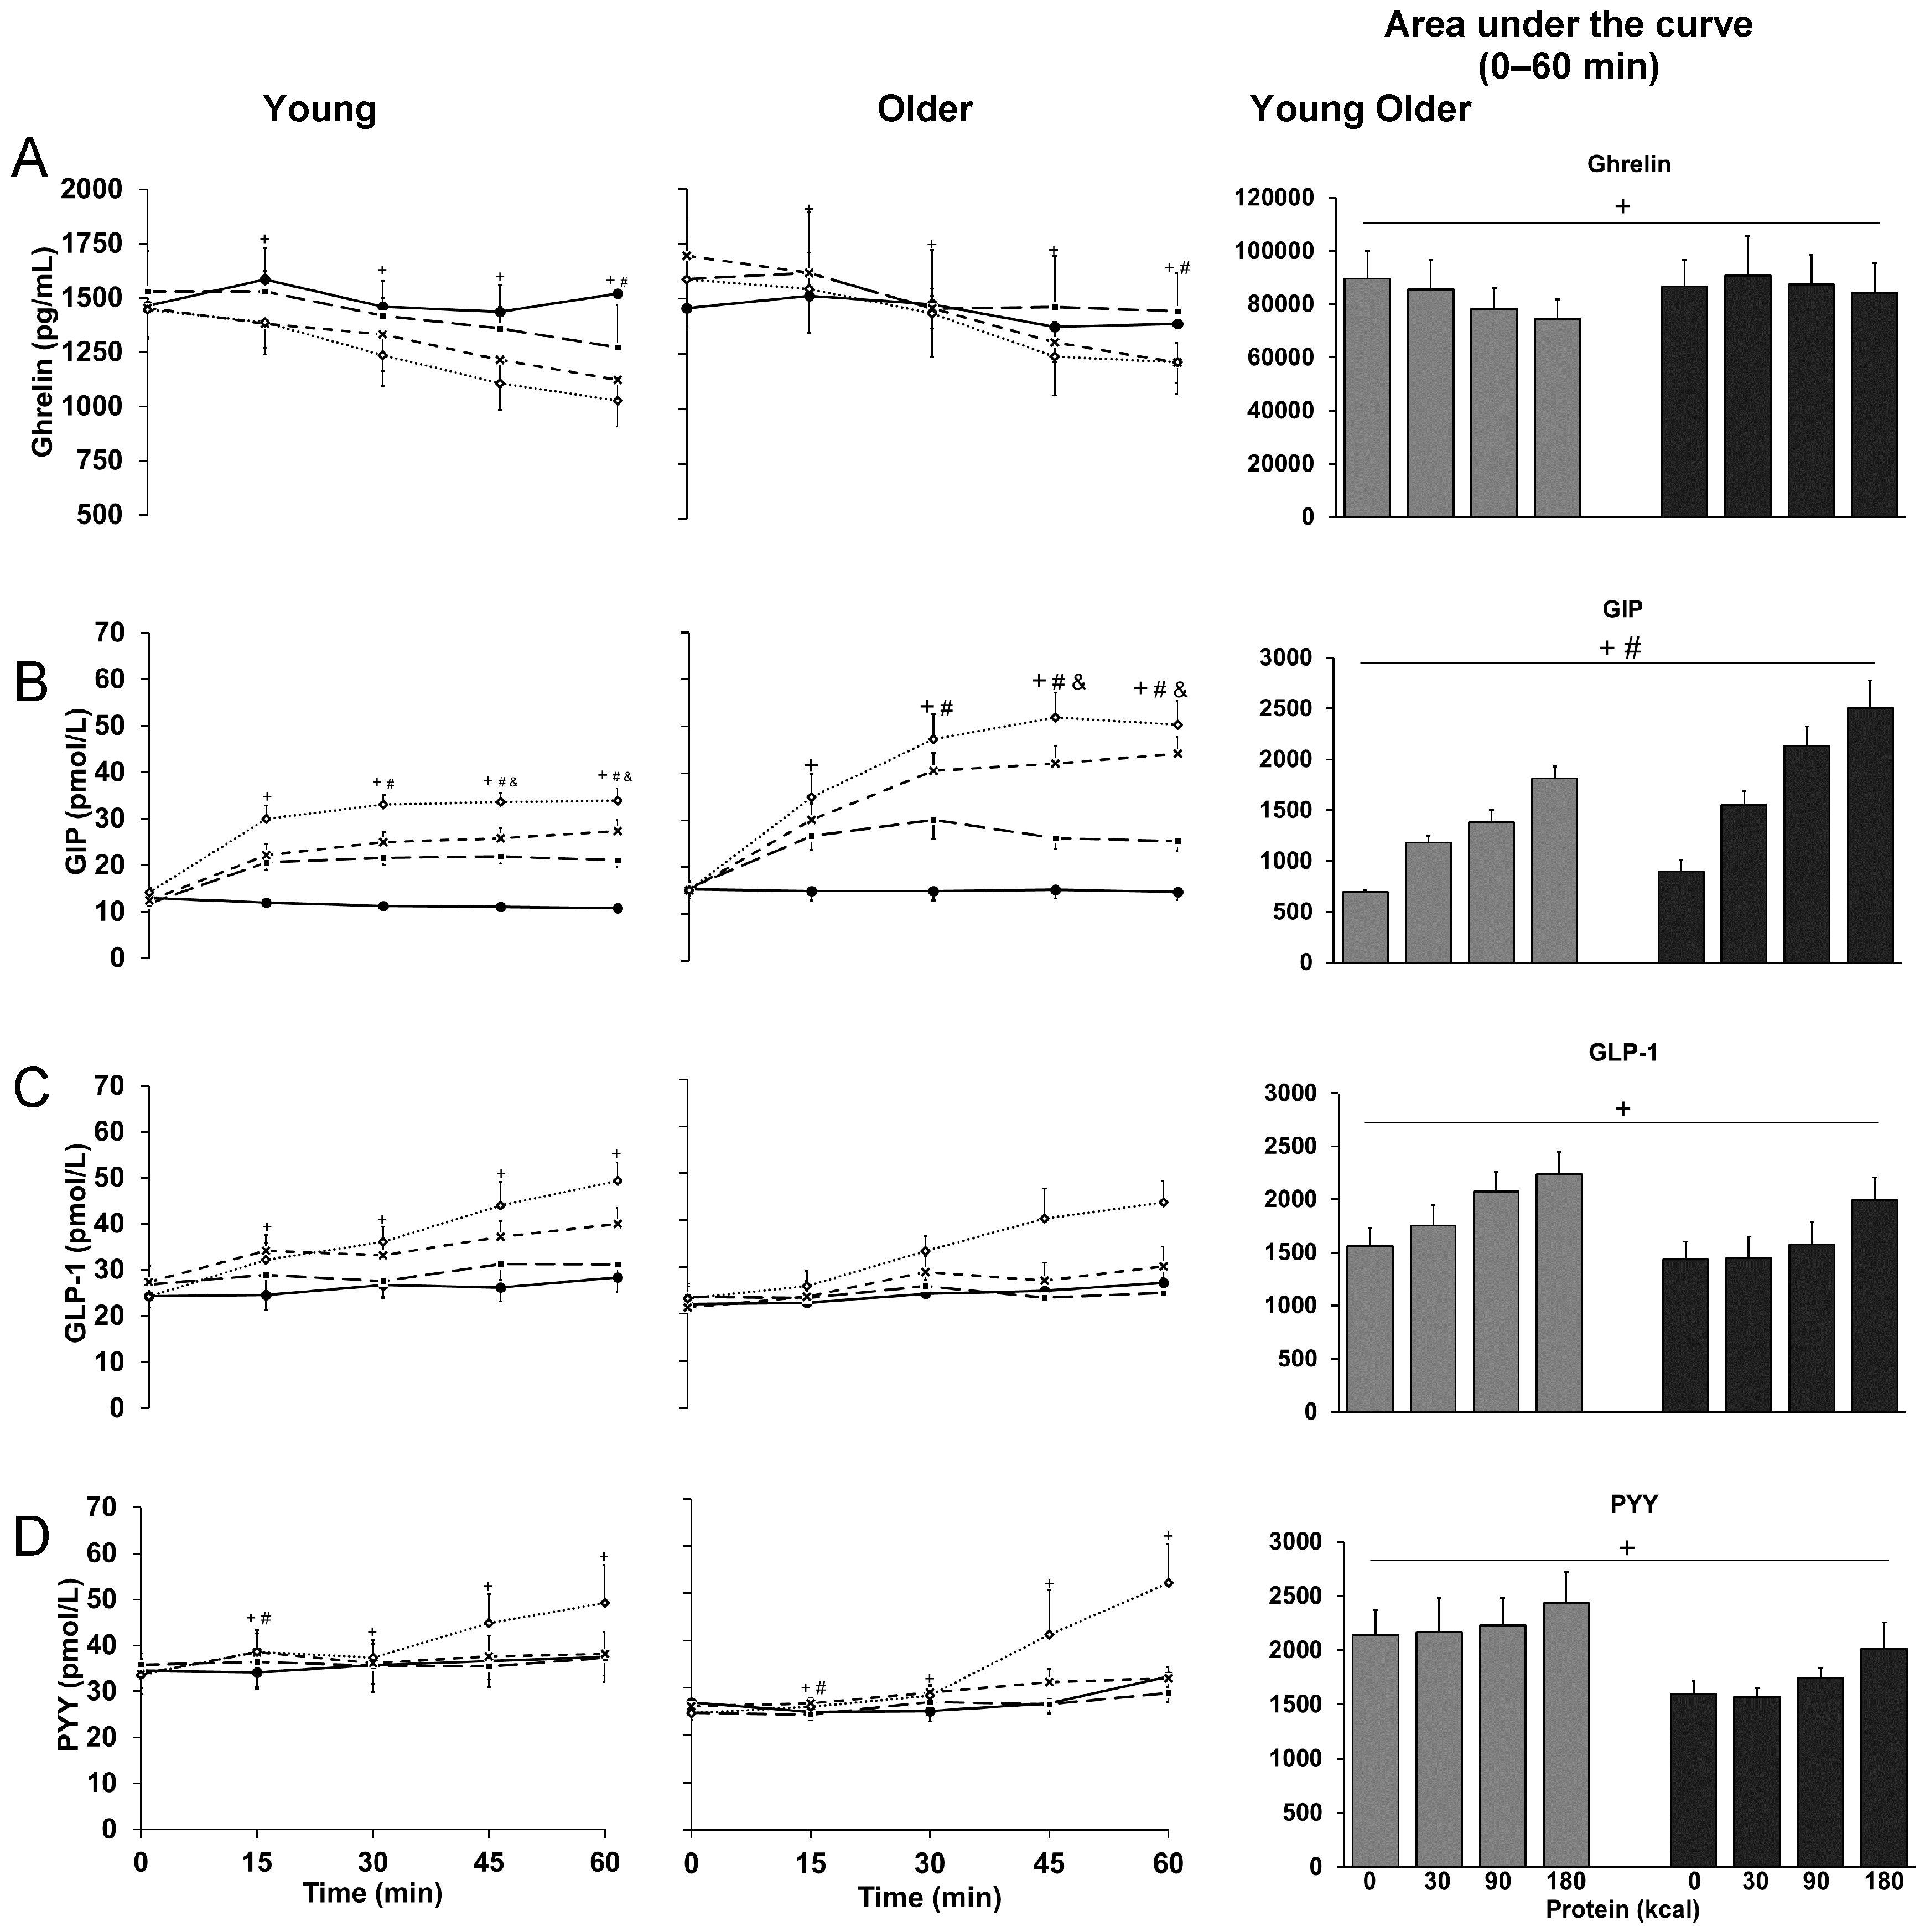
3.5. Ghrelin
3.6. GIP
3.7. GLP-1
3.8. PYY
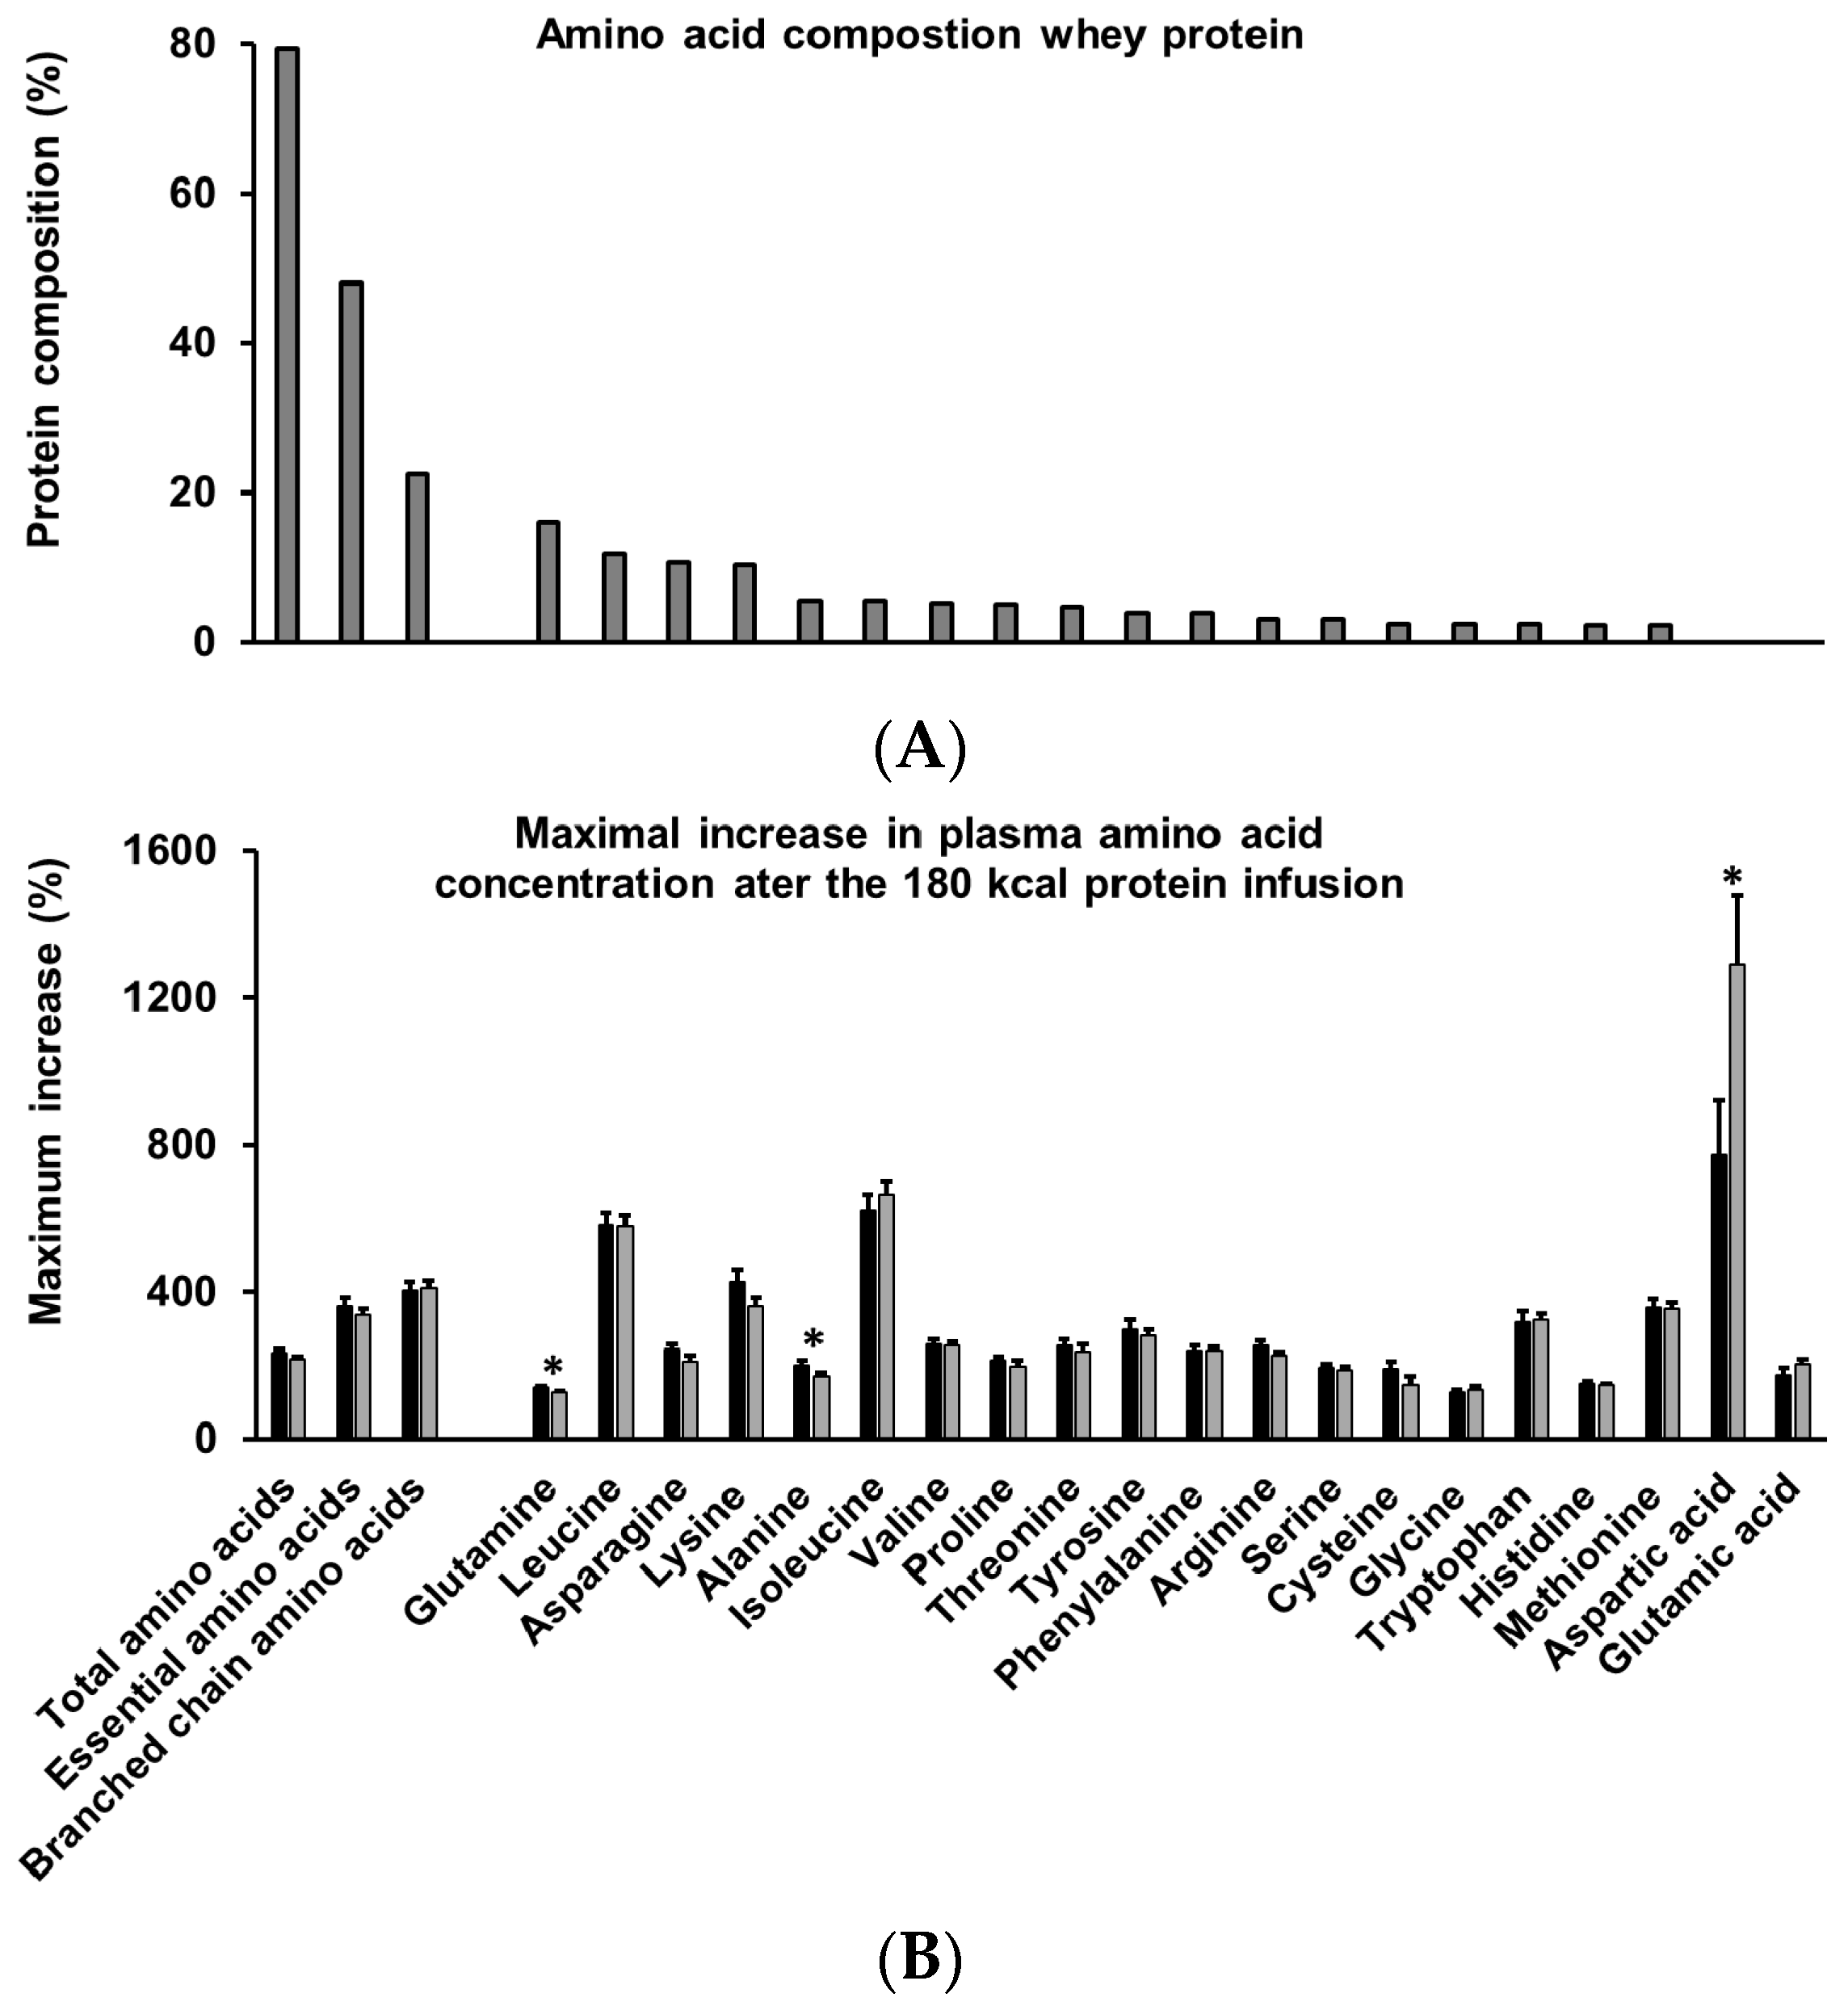
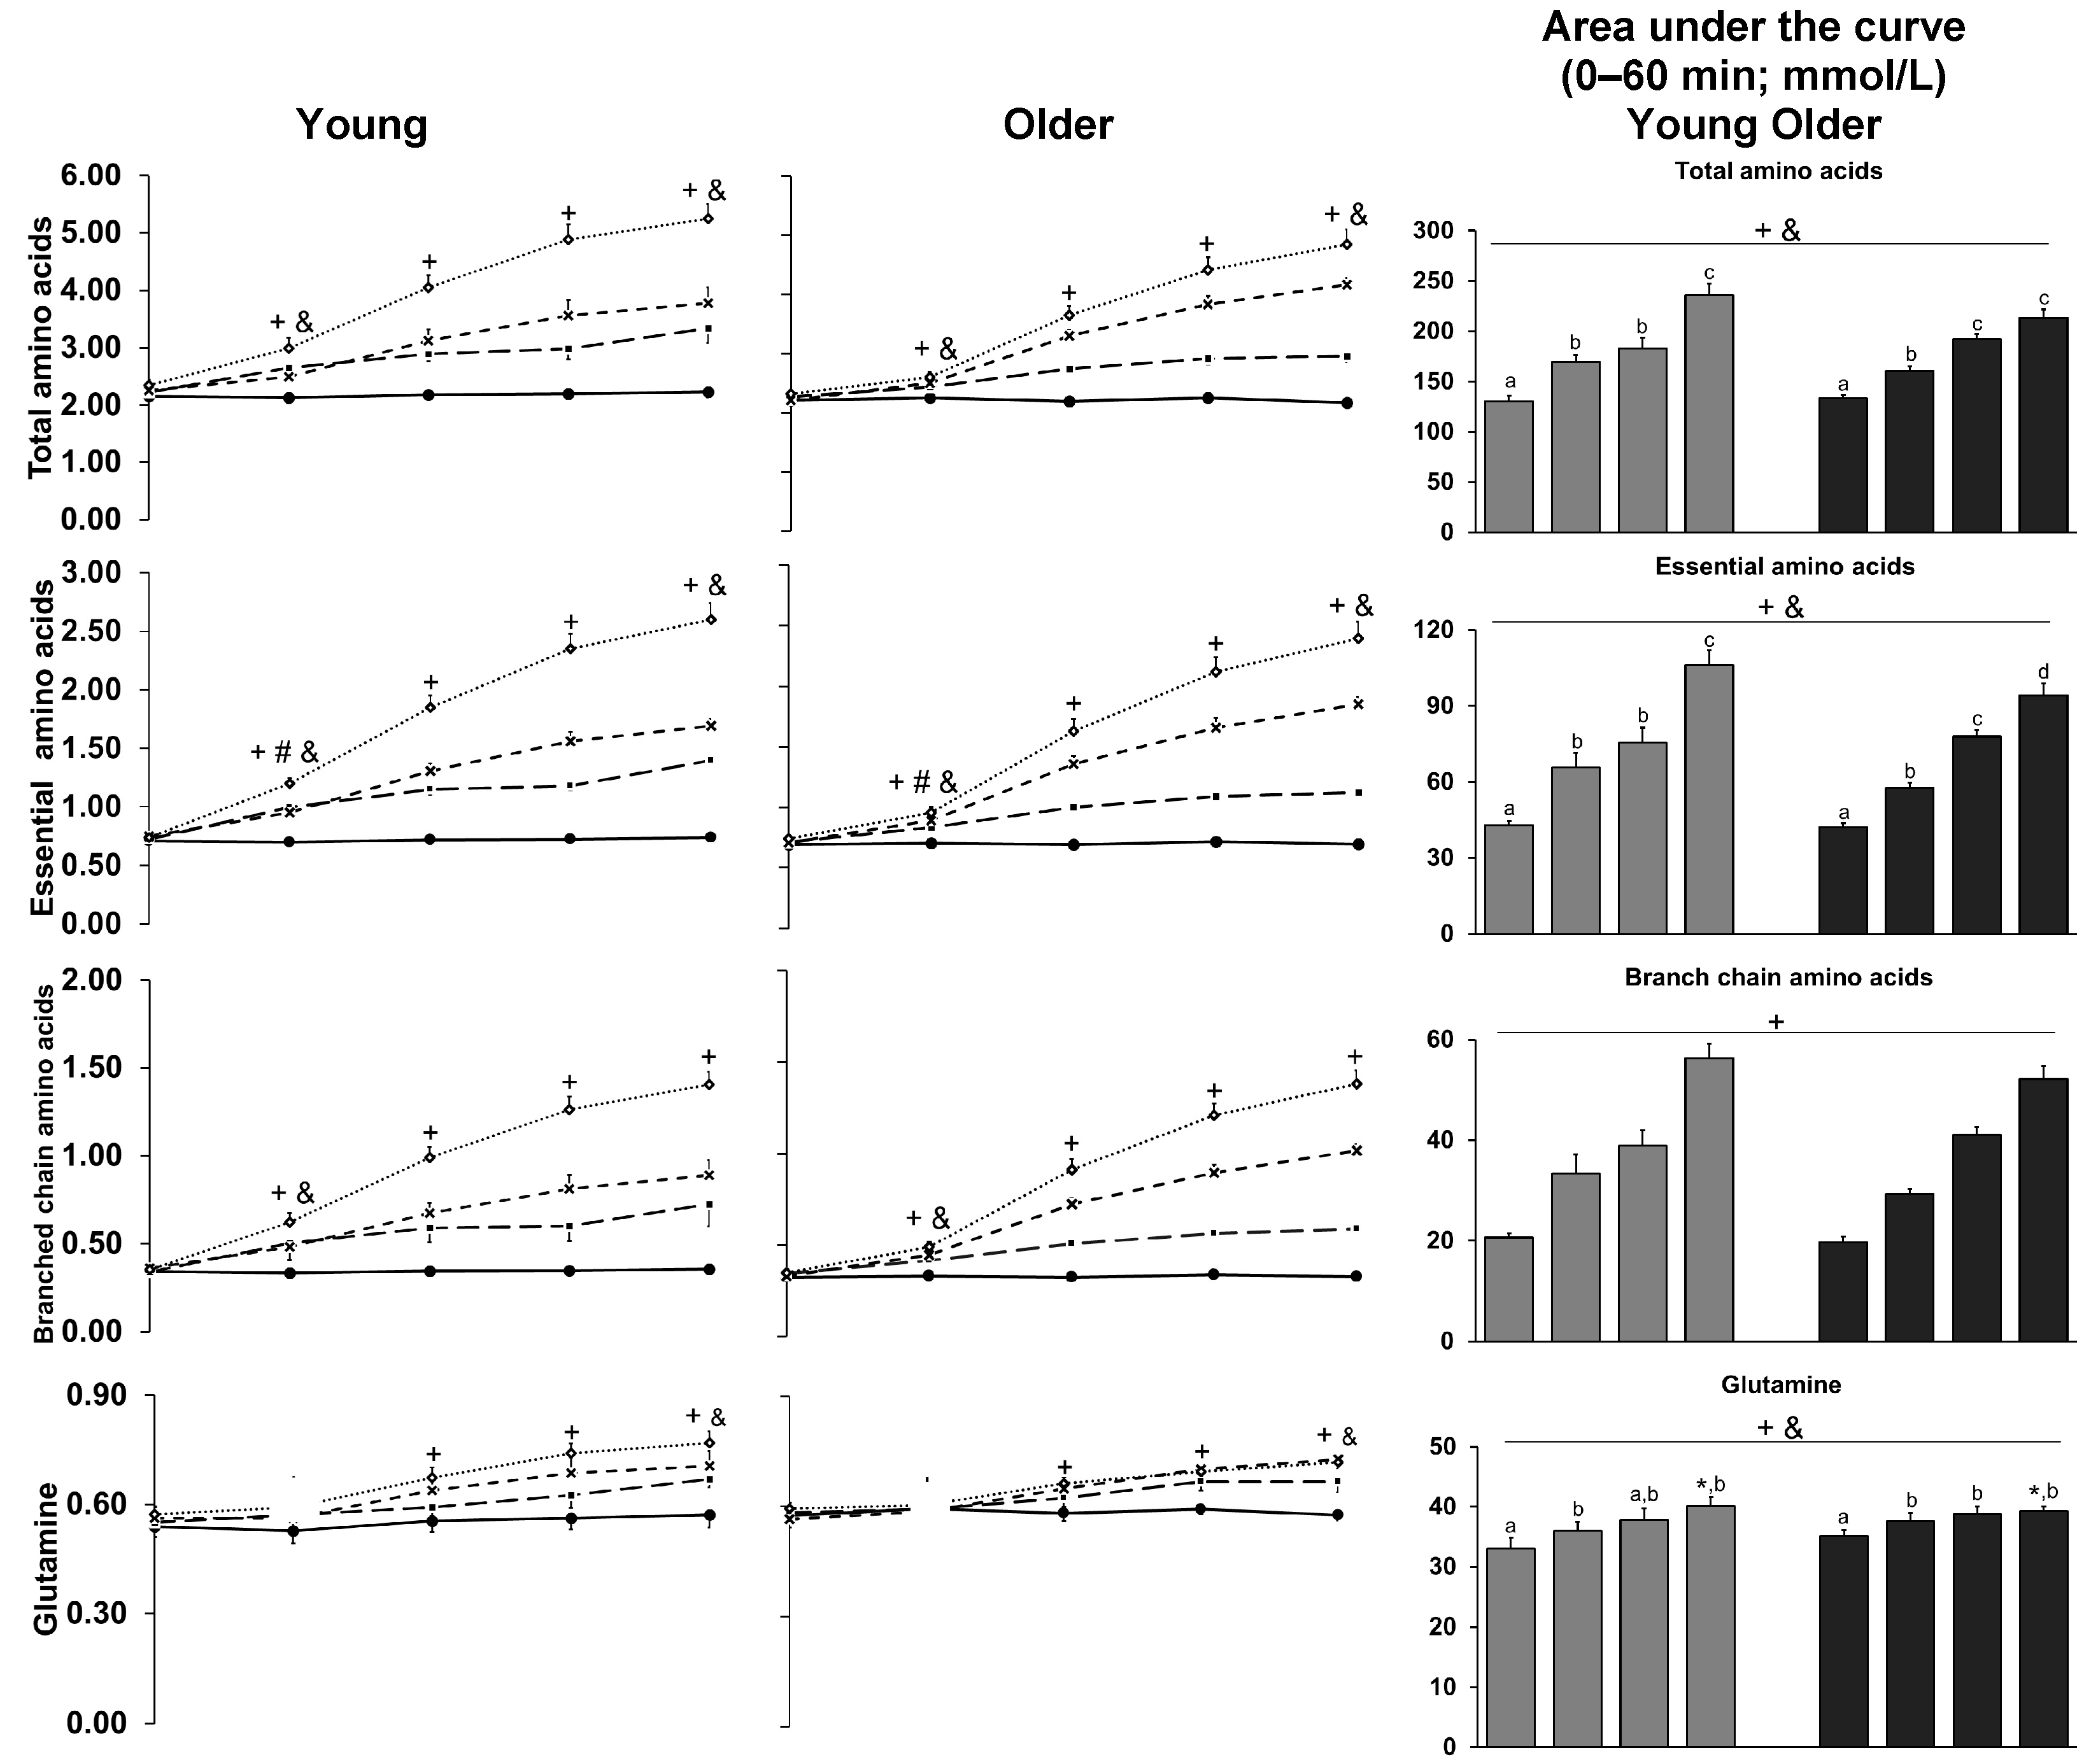
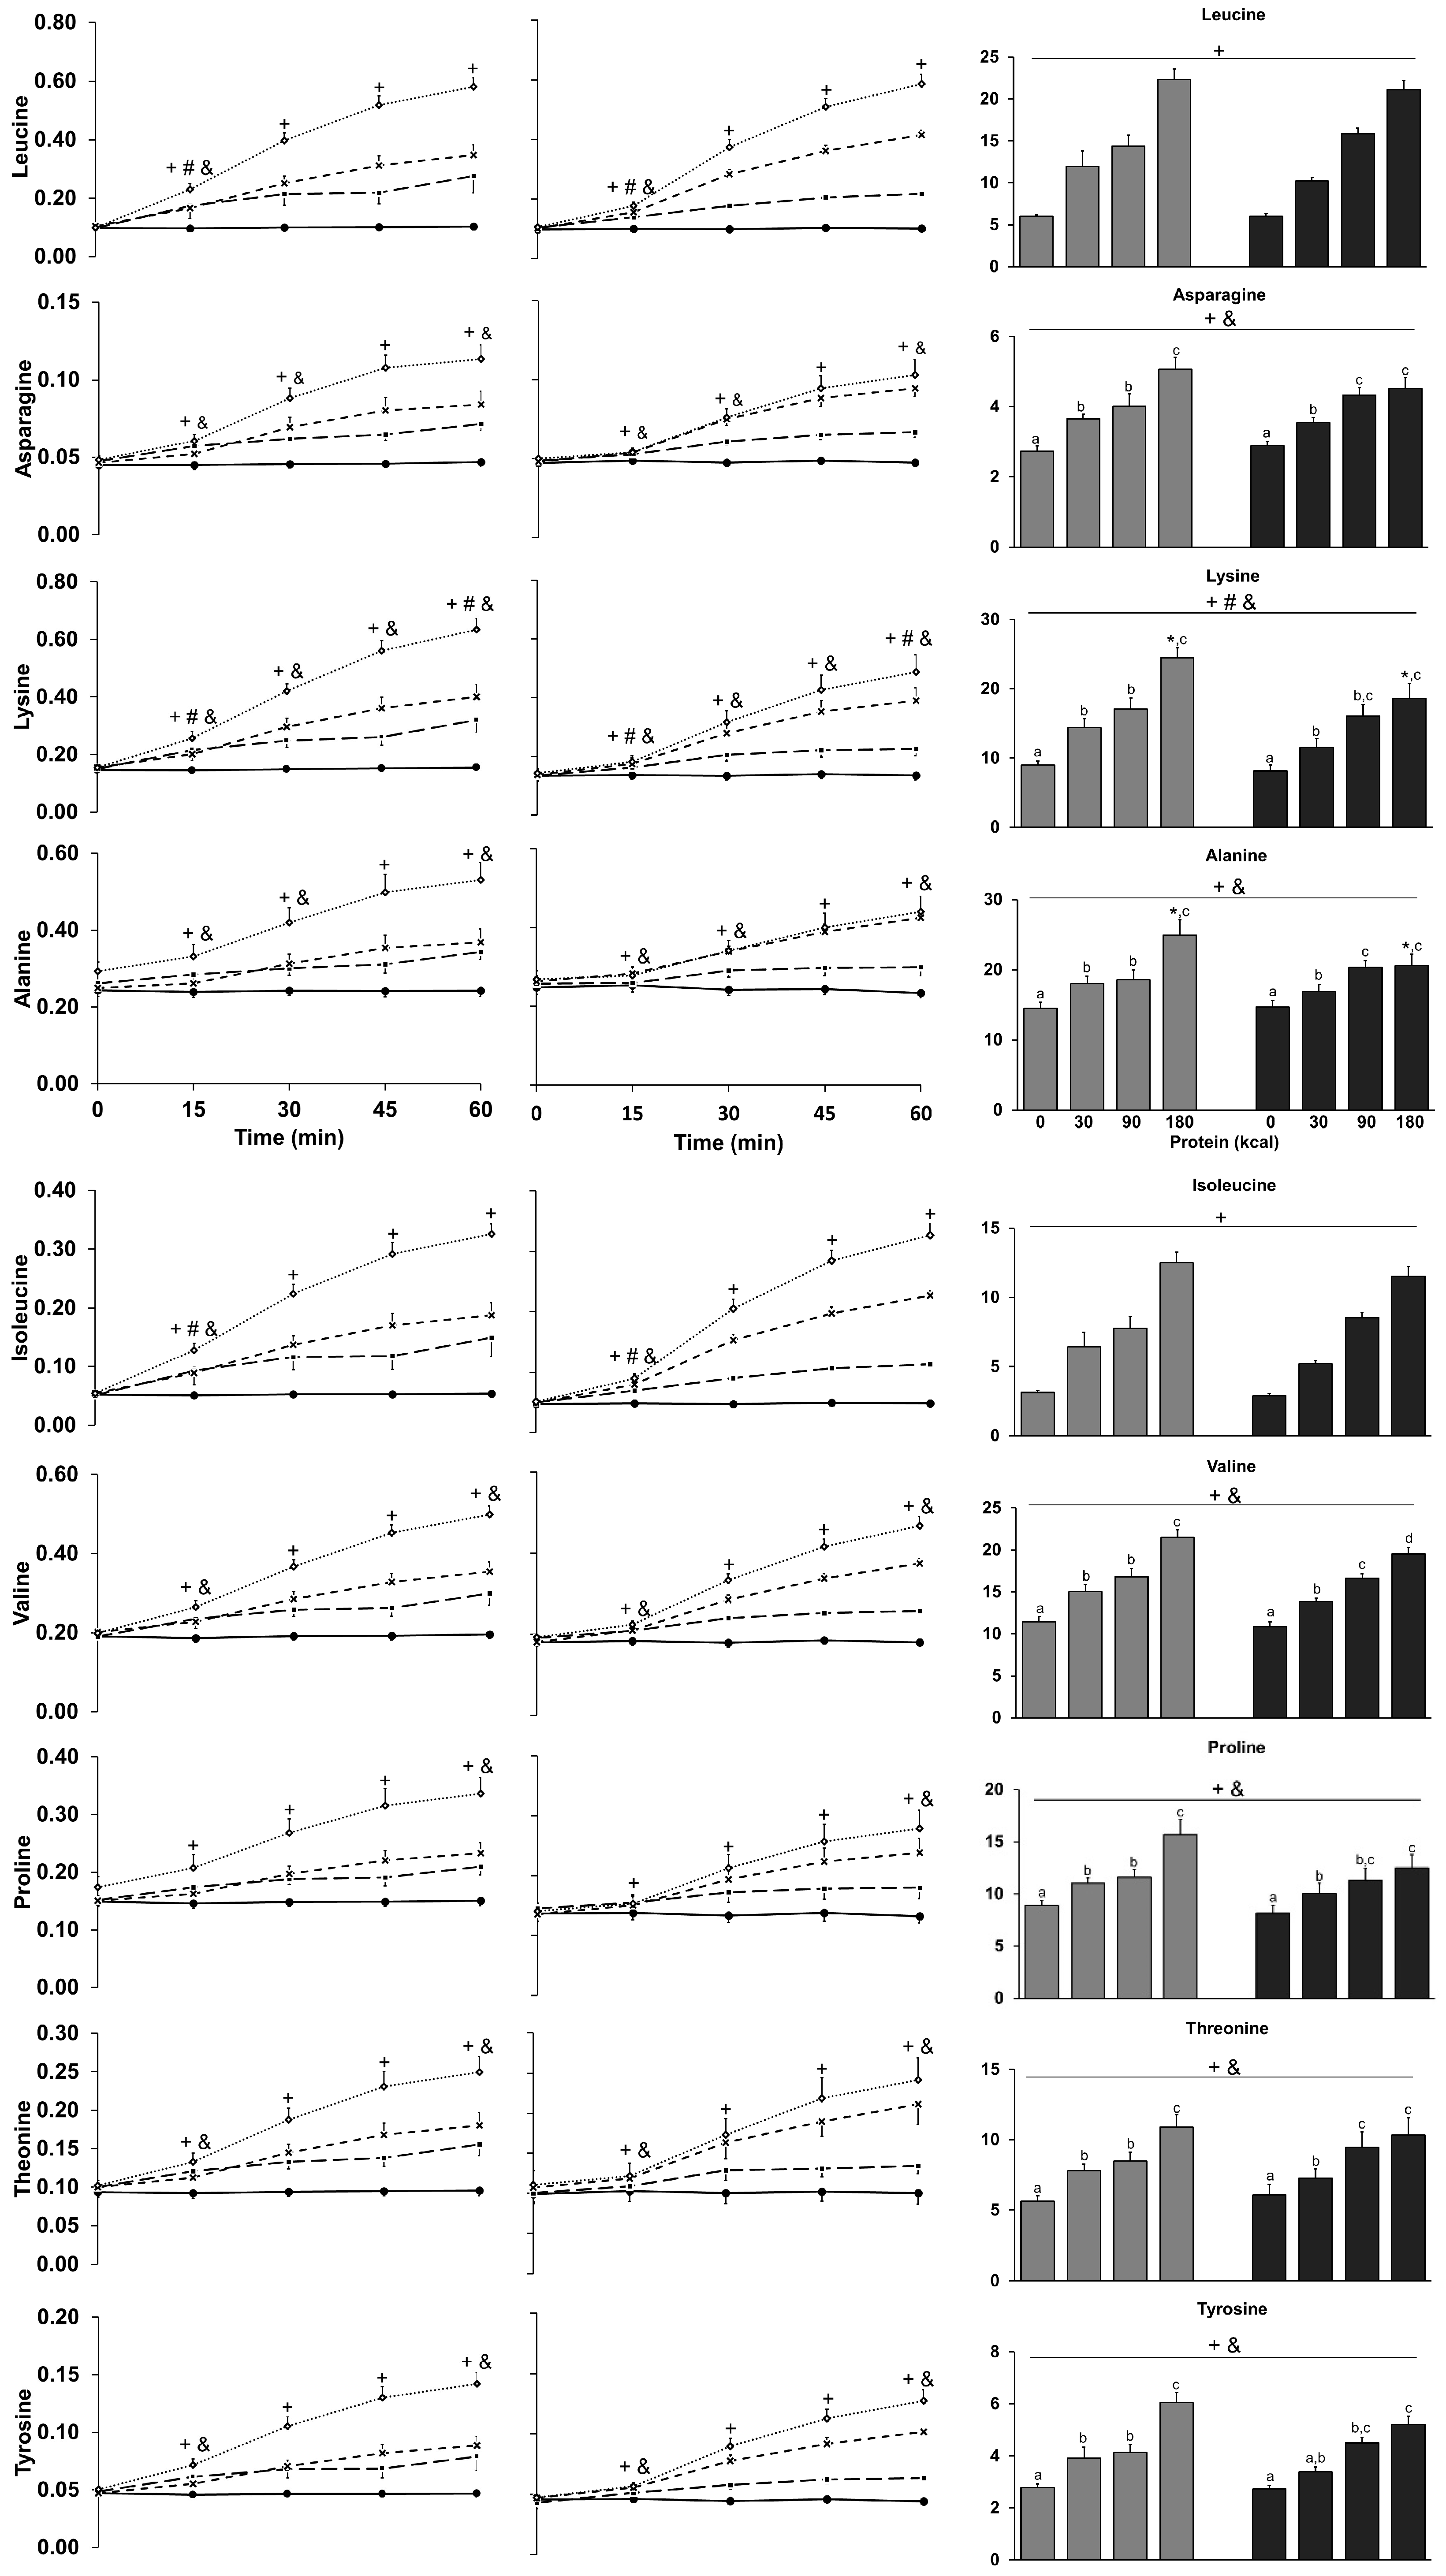
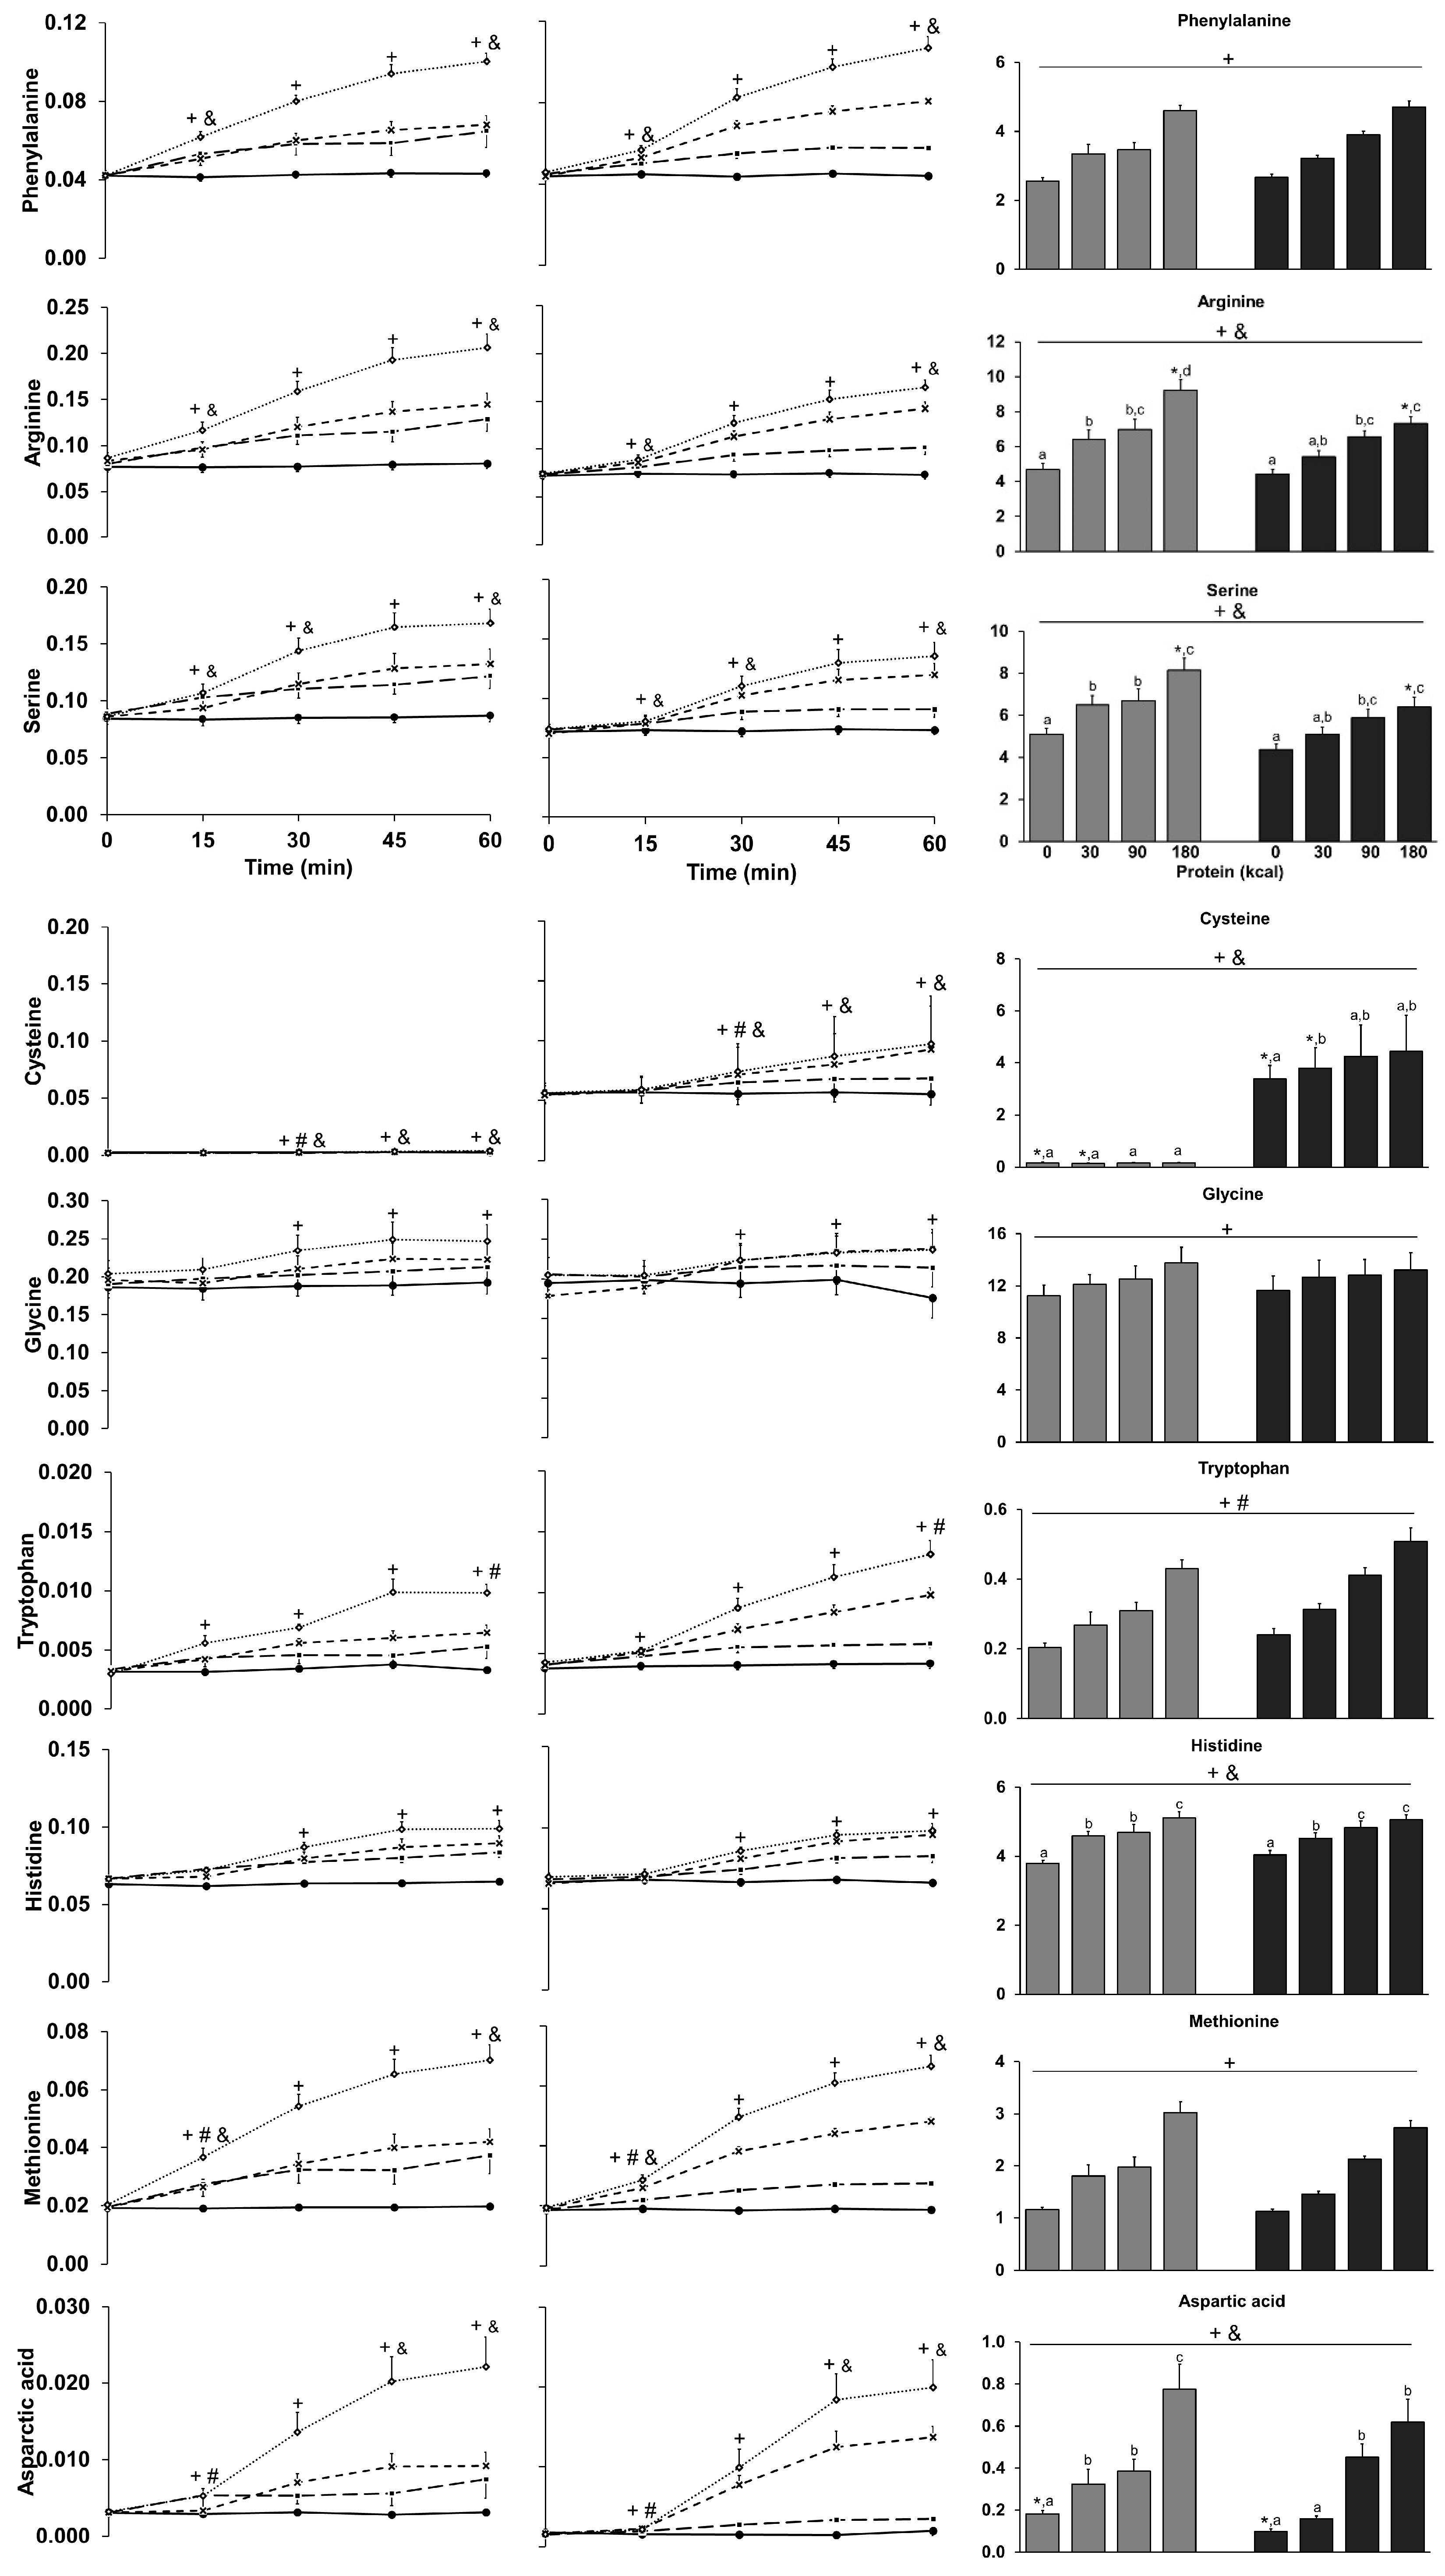
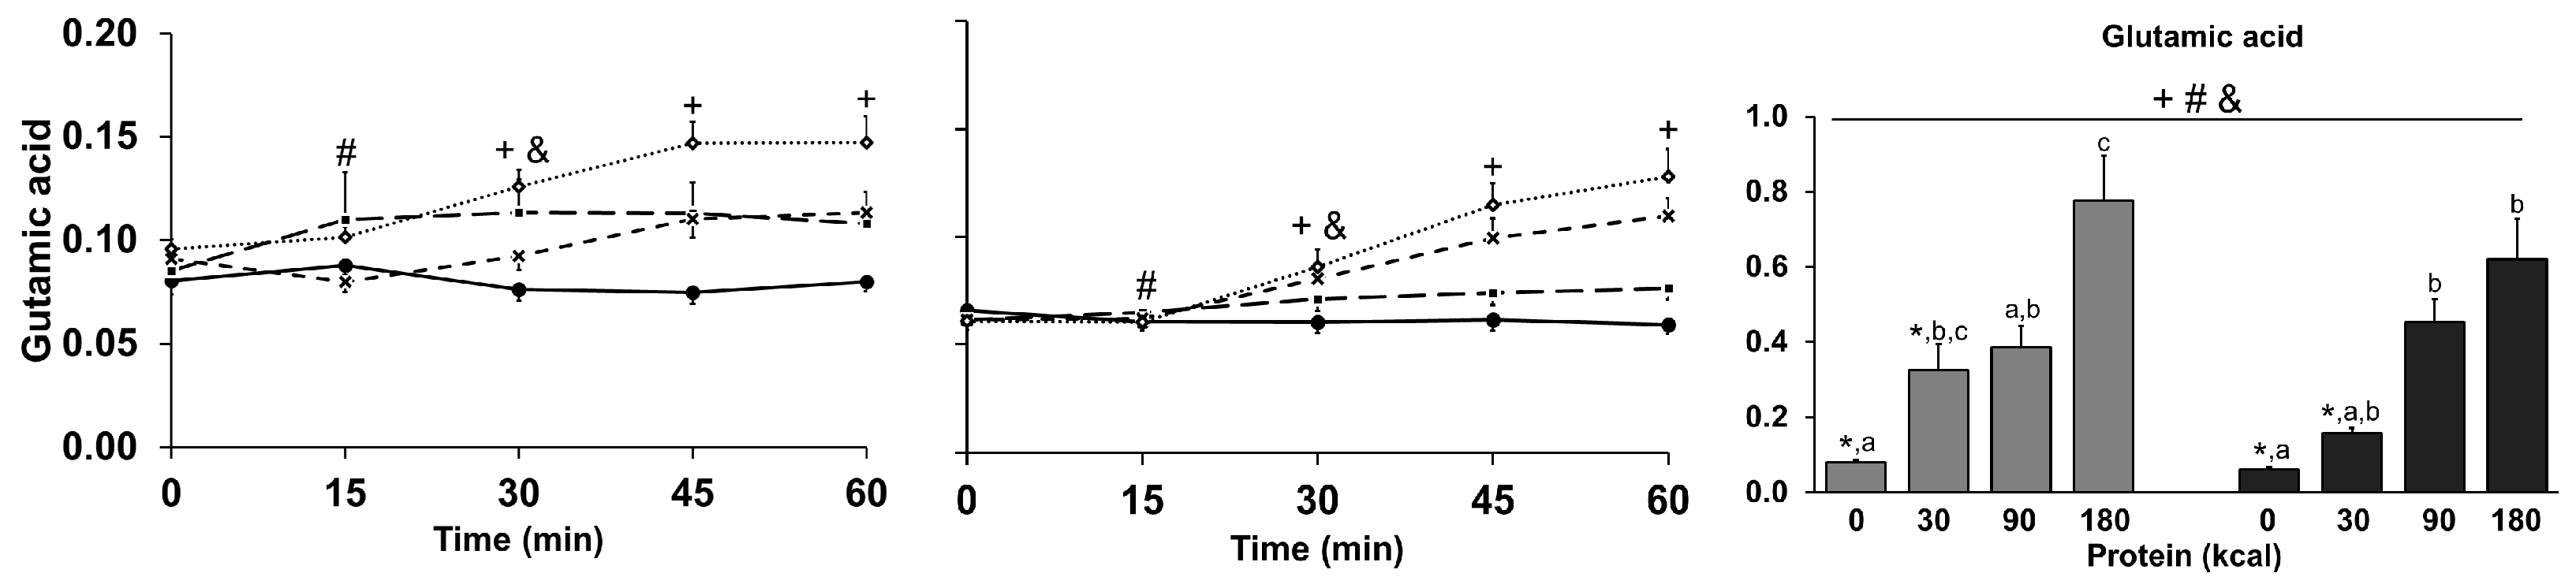
3.9. Amino Acids
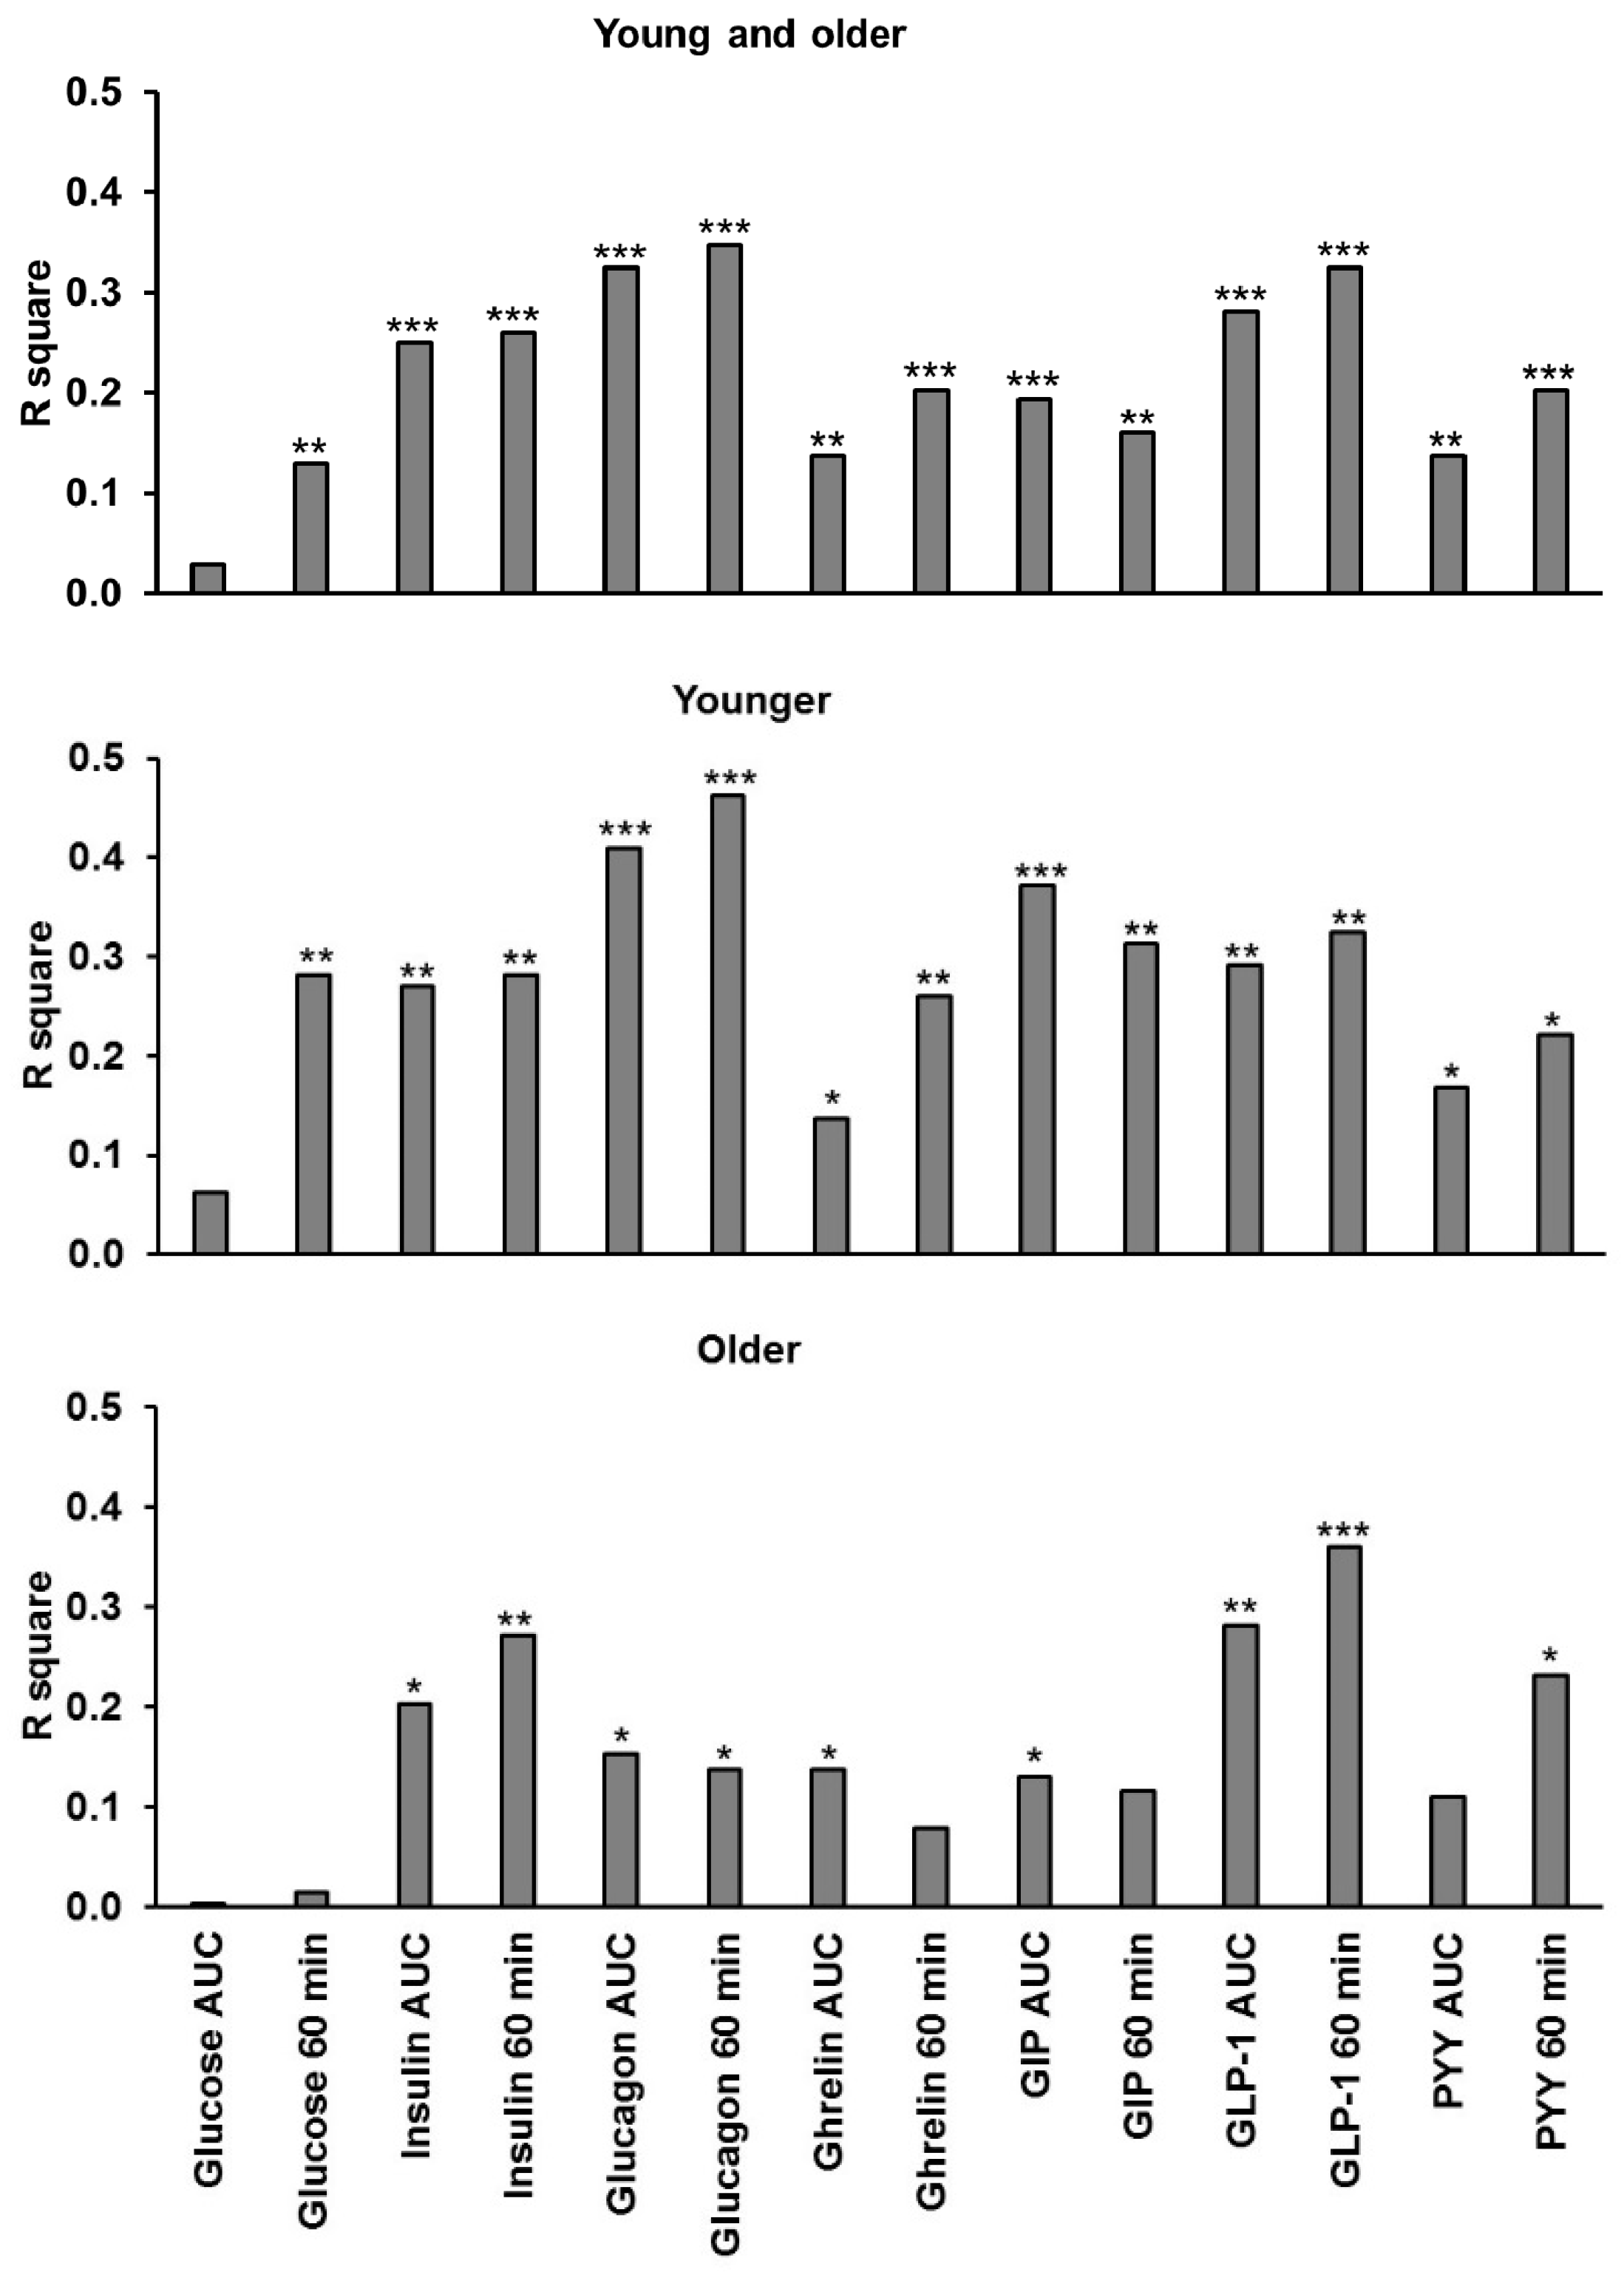
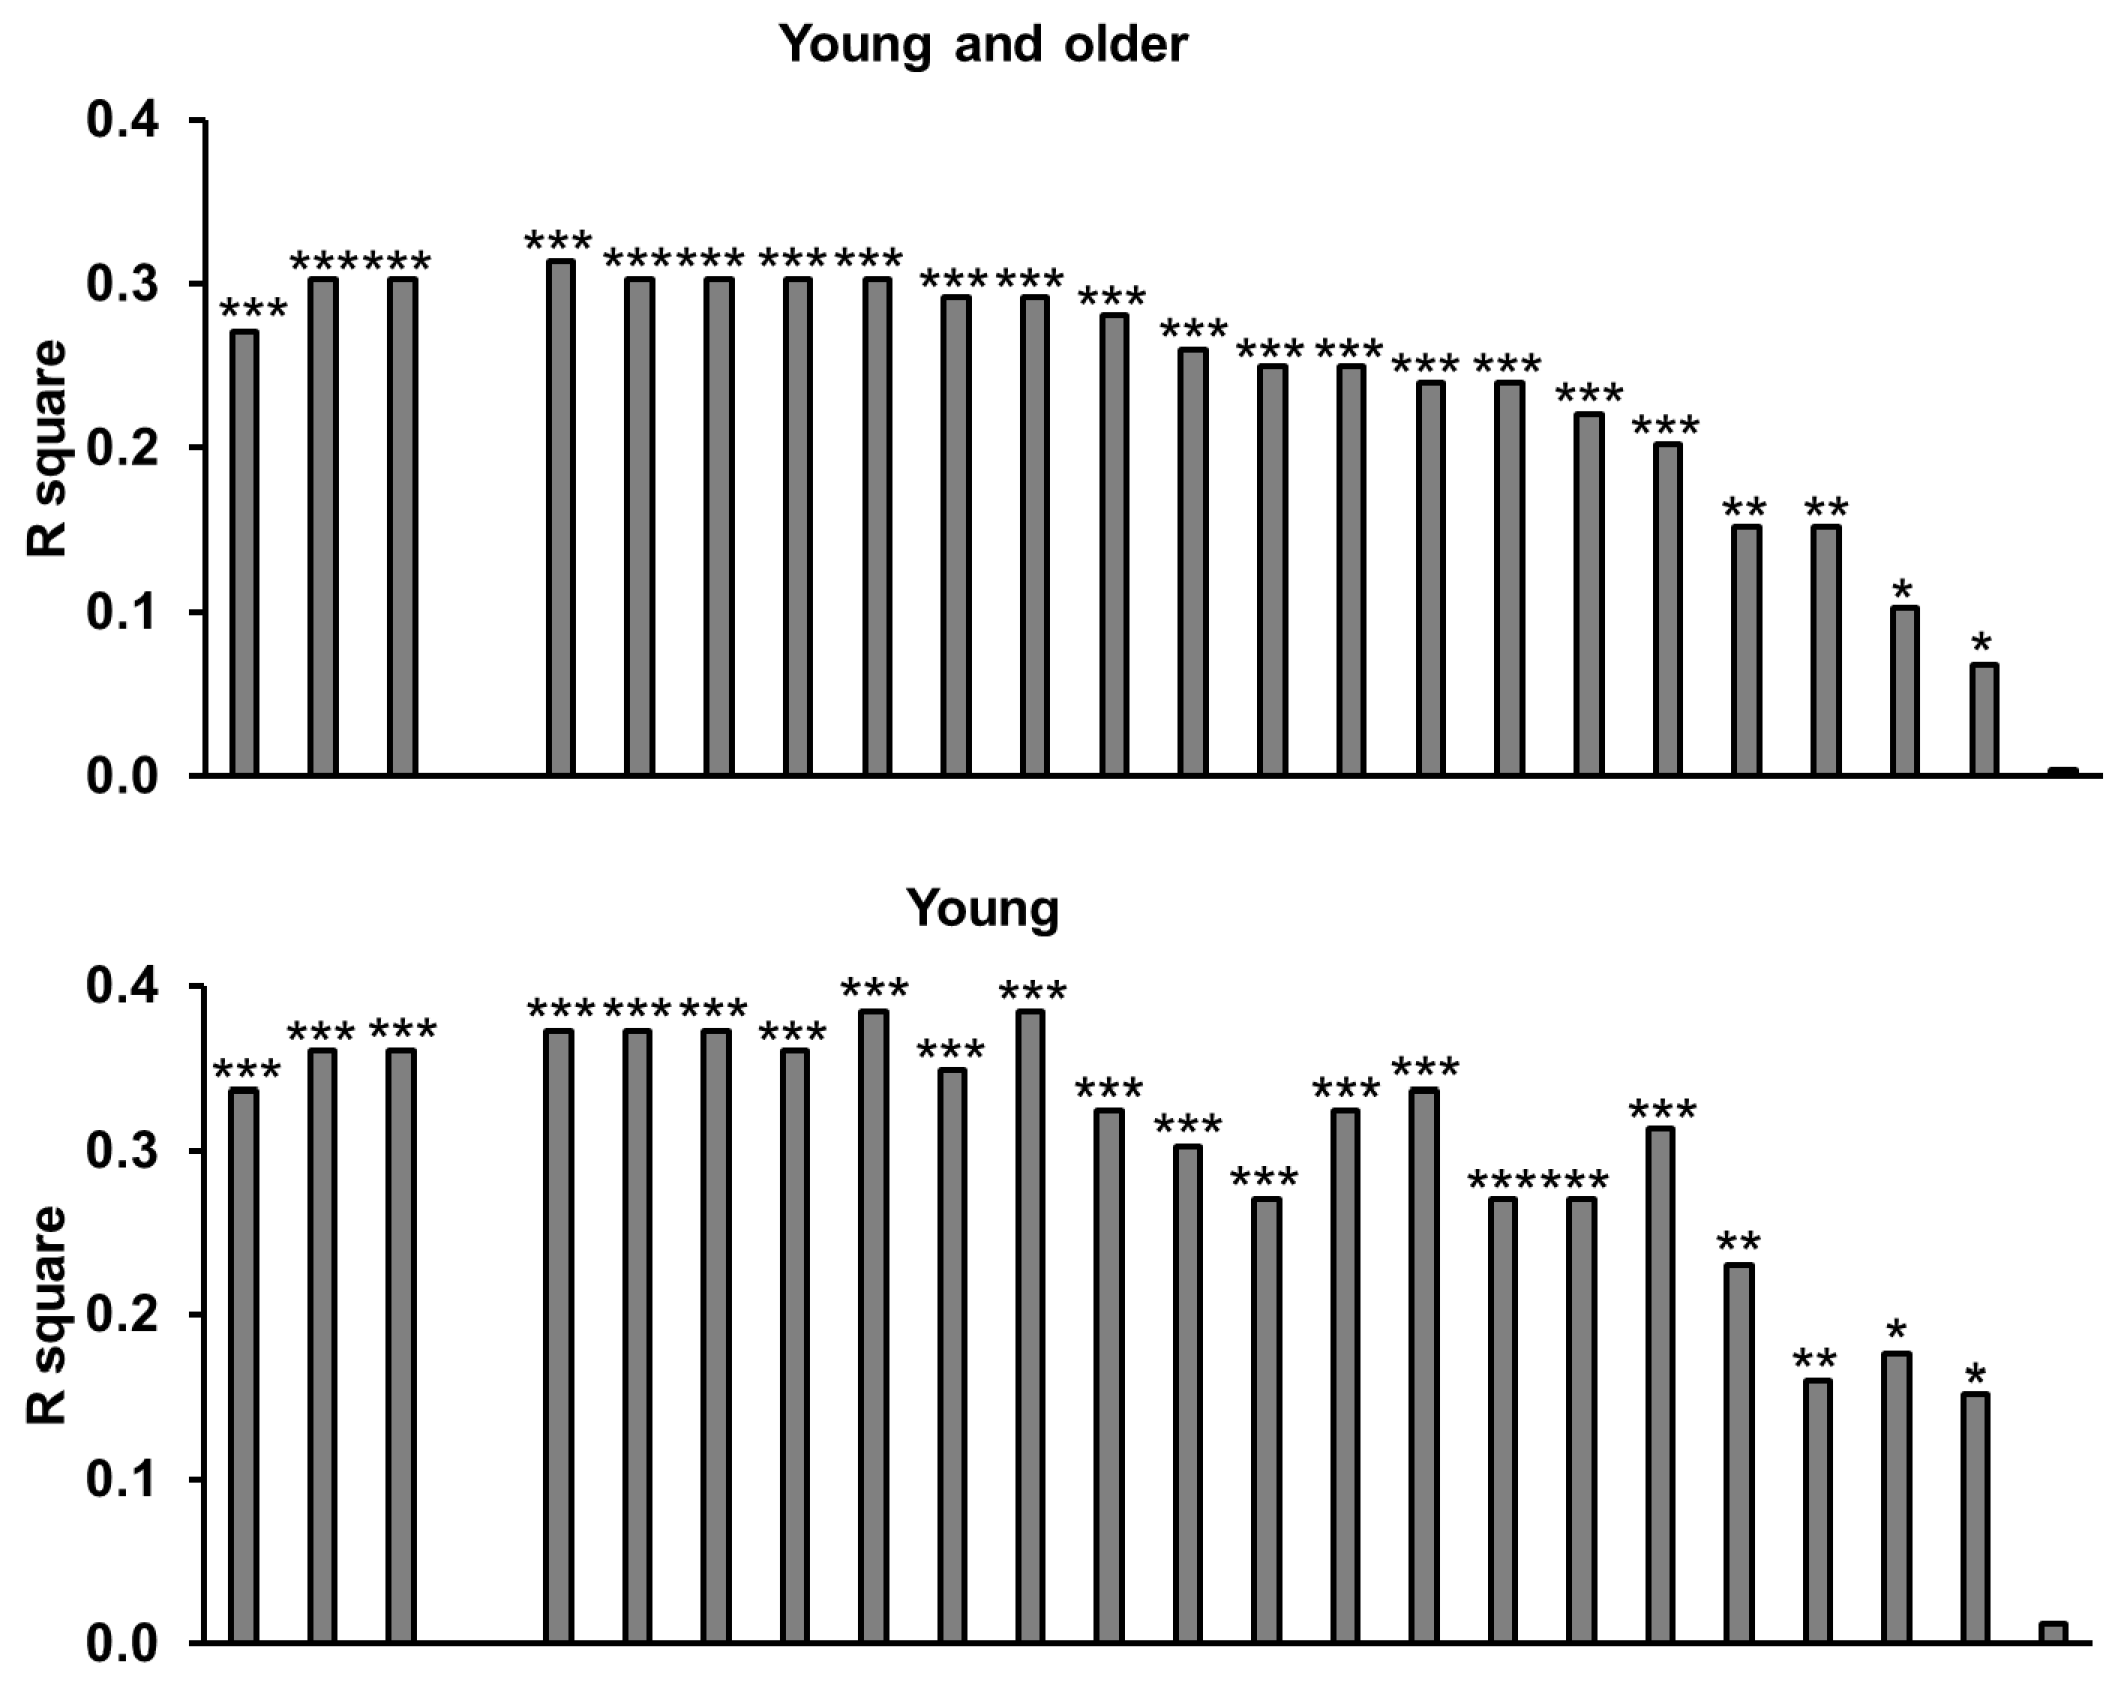
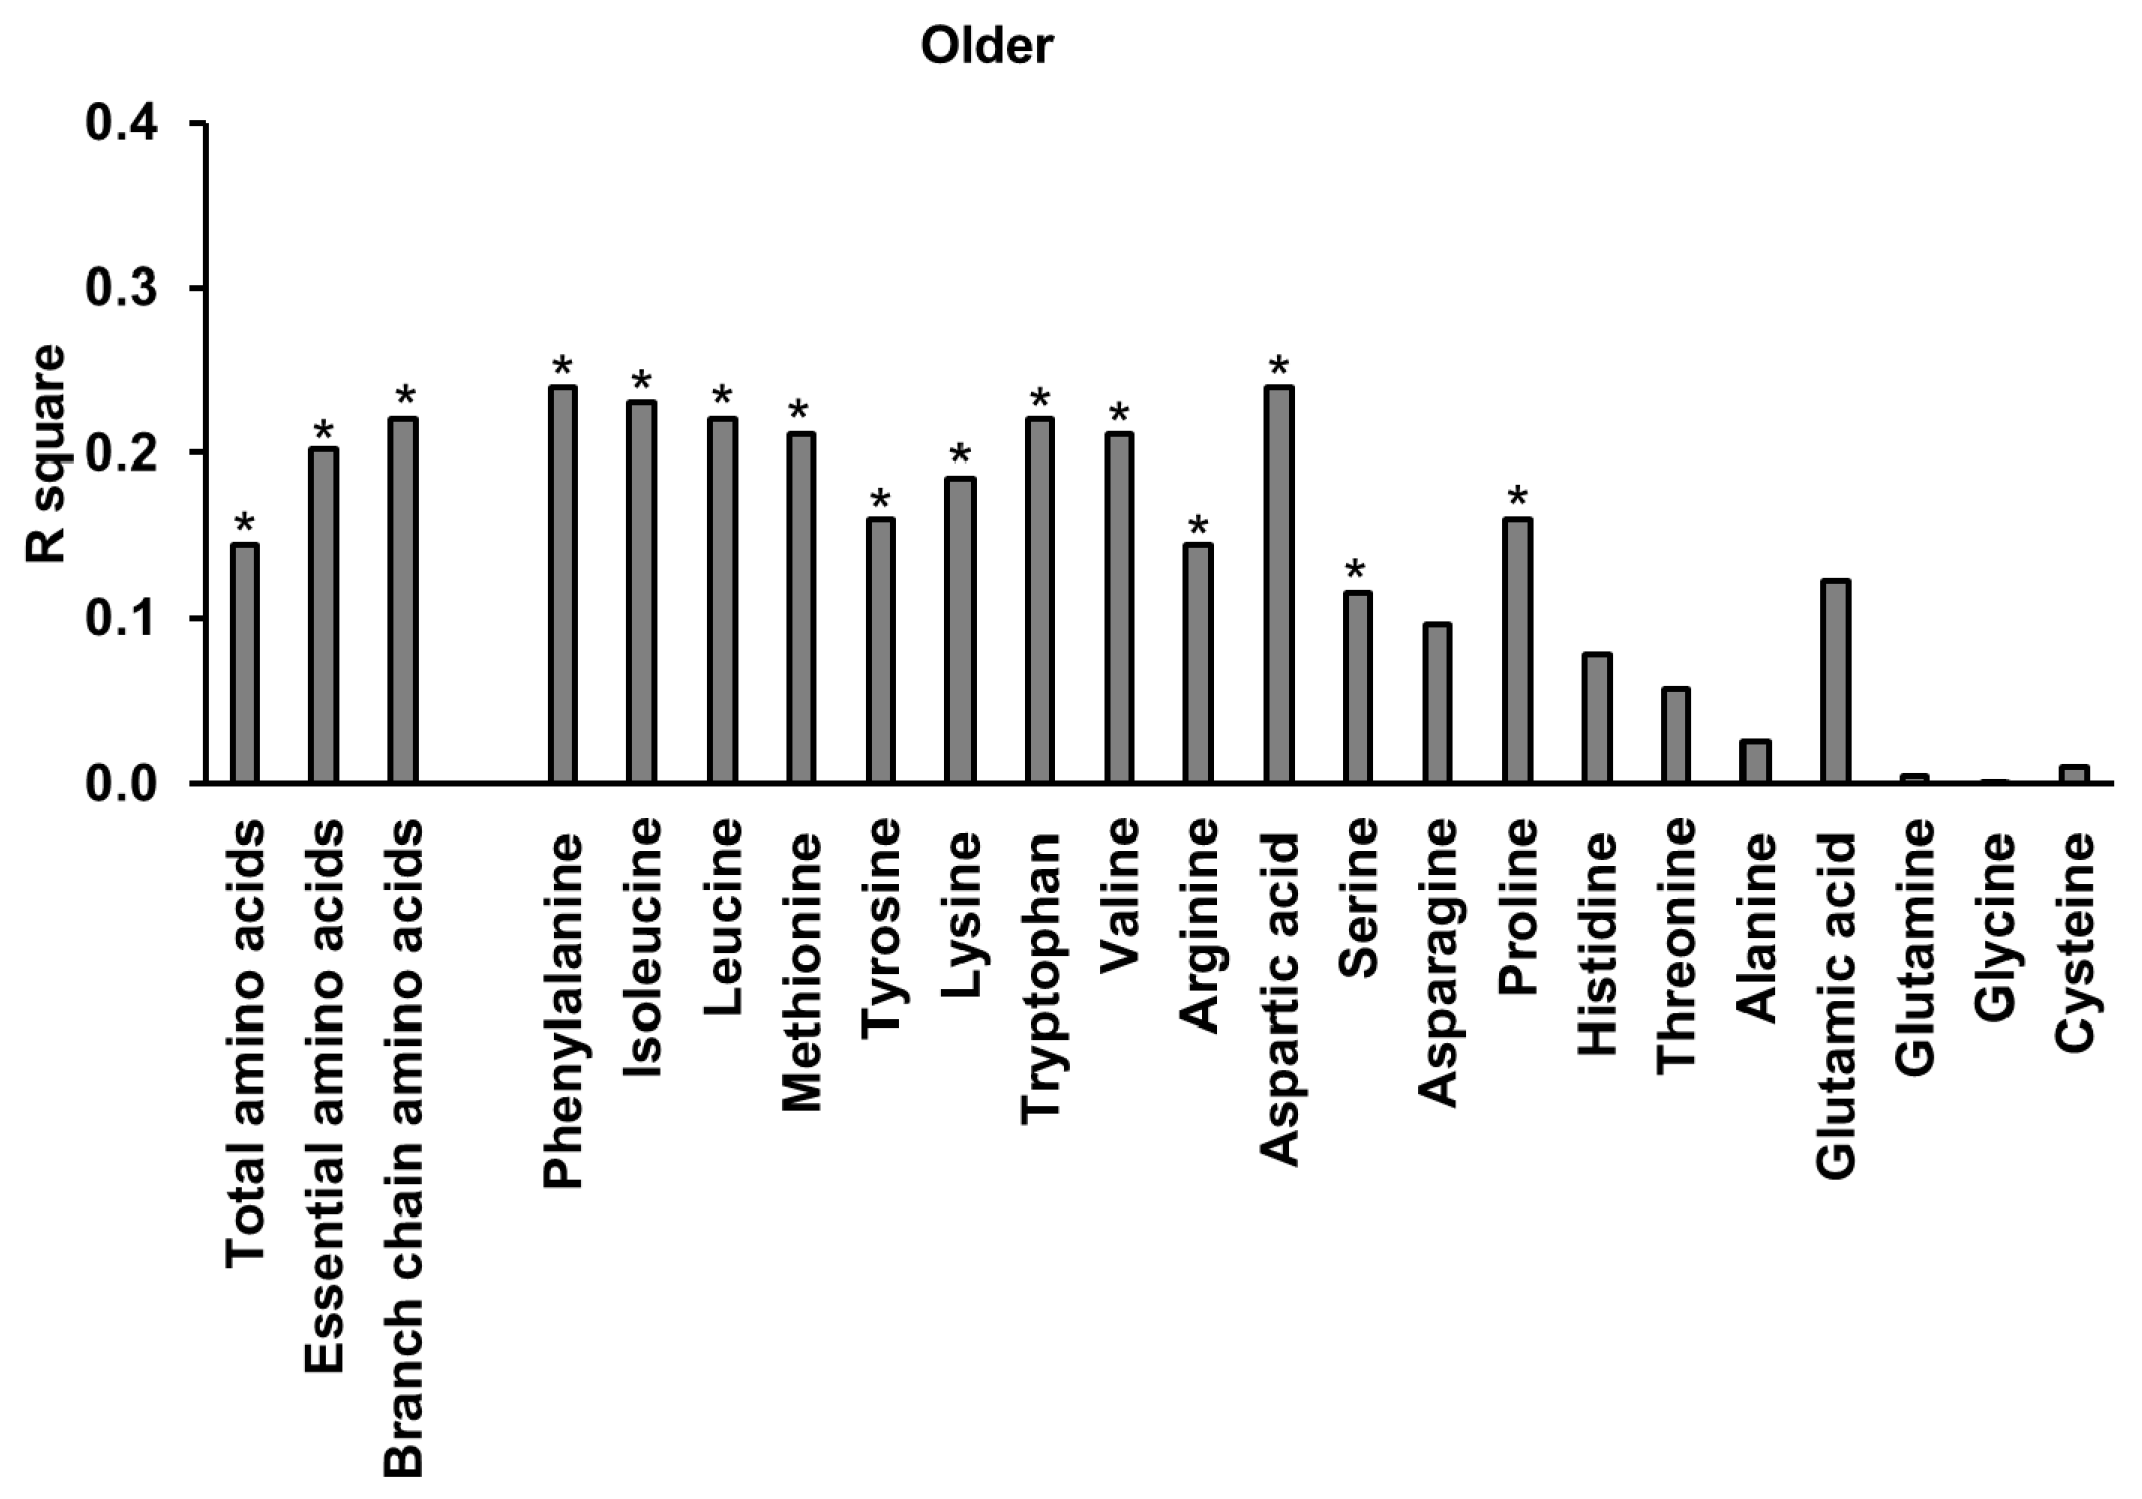
3.10. Relationships of Energy Intake, Gut Hormones, and Amino Acids
4. Discussion
5. Conclusions
Acknowledgments
Author Contributions
Conflicts of Interest
Appendix A


References
- Morley, J.E.; Silver, A.J. Anorexia in the elderly. Neurobiol. Aging 1988, 9, 9–16. [Google Scholar] [CrossRef]
- Jahangir, E.; De Schutter, A.; Lavie, C.J. Low weight and overweightness in older adults: Risk and clinical management. Prog. Cardiovasc. Dis. 2014, 57, 127–133. [Google Scholar] [CrossRef] [PubMed]
- Soenen, S.; Chapman, I.M. Body weight, anorexia, and undernutrition in older people. J. Am. Med. Direct. Assoc. 2013, 14, 642–648. [Google Scholar] [CrossRef] [PubMed]
- Milne, A.C.; Potter, J.; Vivanti, A.; Avenell, A. Protein and energy supplementation in elderly people at risk from malnutrition. Cochrane Database Syst. Rev. 2009, CD003288. [Google Scholar] [CrossRef] [PubMed]
- Johnson, M.A. Strategies to improve diet in older adults. Proc. Nutr. Soc. 2012, 72, 166–172. [Google Scholar] [CrossRef] [PubMed]
- Malafarina, V.; Uriz-Otano, F.; Iniesta, R.; Gil-Guerrero, L. Effectiveness of nutritional supplementation on muscle mass in treatment of sarcopenia in old age: A systematic review. J. Am. Med. Direct. Assoc. 2013, 14, 10–17. [Google Scholar] [CrossRef] [PubMed]
- Pennings, B.; Groen, B.; de Lange, A.; Gijsen, A.P.; Zorenc, A.H.; Senden, J.M.; van Loon, L.J. Amino acid absorption and subsequent muscle protein accretion following graded intakes of whey protein in elderly men. Am. J. Physiol. Endocrinol. Metab. 2012, 302, E992–E999. [Google Scholar] [CrossRef] [PubMed]
- Pennings, B.; Boirie, Y.; Senden, J.M.; Gijsen, A.P.; Kuipers, H.; van Loon, L.J. Whey protein stimulates postprandial muscle protein accretion more effectively than do casein and casein hydrolysate in older men. Am. J. Clin. Nutr. 2011, 93, 997–1005. [Google Scholar] [CrossRef] [PubMed]
- Paddon-Jones, D.; Sheffield-Moore, M.; Zhang, X.J.; Volpi, E.; Wolf, S.E.; Aarsland, A.; Ferrando, A.A.; Wolfe, R.R. Amino acid ingestion improves muscle protein synthesis in the young and elderly. Am. J. Physiol. Endocrinol. Metab. 2004, 286, E321–E328. [Google Scholar] [CrossRef] [PubMed]
- Devries, M.C.; Phillips, S.M. Supplemental Protein in Support of Muscle Mass and Health: Advantage Whey. J. Food Sci. 2015, 80, A8–A15. [Google Scholar] [CrossRef] [PubMed]
- Paddon-Jones, D.; Coss-Bu, J.A.; Morris, C.R.; Phillips, S.M.; Wernerman, J. Variation in Protein Origin and Utilization: Research and Clinical Application. Nutr. Clin. Pract. 2017, 32, 48S–57S. [Google Scholar] [CrossRef] [PubMed]
- Soenen, S.; Martens, E.A.; Hochstenbach-Waelen, A.; Lemmens, S.G.; Westerterp-Plantenga, M.S. Normal protein intake is required for body weight loss and weight maintenance, and elevated protein intake for additional preservation of resting energy expenditure and fat free mass. J. Nutr. 2013, 143, 591–596. [Google Scholar] [CrossRef] [PubMed]
- Soenen, S.; Hochstenbach-Waelen, A.; Westerterp-Plantenga, M.S. Efficacy of alpha-lactalbumin and milk protein on weight loss and body composition during energy restriction. Obesity 2011, 19, 370–379. [Google Scholar] [CrossRef] [PubMed]
- Ryan, A.T.; Luscombe-Marsh, N.D.; Saies, A.A.; Little, T.J.; Standfield, S.; Horowitz, M.; Feinle-Bisset, C. Effects of intraduodenal lipid and protein on gut motility and hormone release, glycemia, appetite, and energy intake in lean men. Am. J. Clin. Nutr. 2013, 98, 300–311. [Google Scholar] [CrossRef] [PubMed]
- Ryan, A.T.; Feinle-Bisset, C.; Kallas, A.; Wishart, J.M.; Clifton, P.M.; Horowitz, M.; Luscombe-Marsh, N.D. Intraduodenal protein modulates antropyloroduodenal motility, hormone release, glycemia, appetite, and energy intake in lean men. Am. J. Clin. Nutr. 2012, 96, 474–482. [Google Scholar] [CrossRef] [PubMed]
- Steinert, R.E.; Feinle-Bisset, C.; Asarian, L.; Horowitz, M.; Beglinger, C.; Geary, N. Ghrelin, CCK, GLP-1, and PYY(3–36): Secretory controls and physiological roles in eating and glycemia in health, obesity, and after RYGB. Physiol. Rev. 2017, 97, 411–463. [Google Scholar] [CrossRef] [PubMed]
- Luscombe-Marsh, N.D.; Hutchison, A.T.; Soenen, S.; Steinert, R.E.; Clifton, P.M.; Horowitz, M.; Feinle-Bisset, C. Plasma free amino acid responses to intraduodenal whey protein, and relationships with insulin, glucagon-like peptide-1 and energy intake in lean healthy men. Nutrients 2016, 8, 4. [Google Scholar] [CrossRef] [PubMed]
- MacIntosh, C.G.; Horowitz, M.; Verhagen, M.A.; Smout, A.J.; Wishart, J.; Morris, H.; Goble, E.; Morley, J.E.; Chapman, I.M. Effect of small intestinal nutrient infusion on appetite, gastrointestinal hormone release, and gastric myoelectrical activity in young and older men. Am. J. Gastroenterol. 2001, 96, 997–1007. [Google Scholar] [CrossRef] [PubMed]
- Meneilly, G.S.; Demuth, H.U.; McIntosh, C.H.; Pederson, R.A. Effect of ageing and diabetes on glucose-dependent insulinotropic polypeptide and dipeptidyl peptidase IV responses to oral glucose. Diabet. Med. J. Br. Diabet. Assoc. 2000, 17, 346–350. [Google Scholar] [CrossRef]
- Ranganath, L.; Sedgwick, I.; Morgan, L.; Wright, J.; Marks, V. The ageing entero-insular axis. Diabetologia 1998, 41, 1309–1313. [Google Scholar] [CrossRef] [PubMed]
- Di Francesco, V.; Barazzoni, R.; Bissoli, L.; Fantin, F.; Rizzotti, P.; Residori, L.; Antonioli, A.; Graziani, M.S.; Zanetti, M.; Bosello, O.; et al. The quantity of meal fat influences the profile of postprandial hormones as well as hunger sensation in healthy elderly people. J. Am. Med. Dir. Assoc. 2010, 11, 188–193. [Google Scholar] [CrossRef] [PubMed]
- MacIntosh, C.G.; Andrews, J.M.; Jones, K.L.; Wishart, J.M.; Morris, H.A.; Jansen, J.B.; Morley, J.E.; Horowitz, M.; Chapman, I.M. Effects of age on concentrations of plasma cholecystokinin, glucagon-like peptide 1, and peptide YY and their relation to appetite and pyloric motility. Am. J. Clin. Nutr. 1999, 69, 999–1006. [Google Scholar] [PubMed]
- Bauer, J.M.; Haack, A.; Winning, K.; Wirth, R.; Fischer, B.; Uter, W.; Erdmann, J.; Schusdziarra, V.; Sieber, C.C. Impaired postprandial response of active ghrelin and prolonged suppression of hunger sensation in the elderly. J. Gerontol. A Biol. Sci. Med. Sci. 2010, 65, 307–311. [Google Scholar] [CrossRef] [PubMed]
- Di Francesco, V.; Fantin, F.; Residori, L.; Bissoli, L.; Micciolo, R.; Zivelonghi, A.; Zoico, E.; Omizzolo, F.; Bosello, O.; Zamboni, M. Effect of age on the dynamics of acylated ghrelin in fasting conditions and in response to a meal. J. Am. Geriatr. Soc. 2008, 56, 1369–1370. [Google Scholar] [CrossRef] [PubMed]
- Schneider, S.M.; Al-Jaouni, R.; Caruba, C.; Giudicelli, J.; Arab, K.; Suavet, F.; Ferrari, P.; Mothe-Satney, I.; Van Obberghen, E.; Hébuterne, X. Effects of age, malnutrition and refeeding on the expression and secretion of ghrelin. Clin. Nutr. 2008, 27, 724–731. [Google Scholar] [CrossRef] [PubMed]
- Di Francesco, V.; Zamboni, M.; Zoico, E.; Mazzali, G.; Dioli, A.; Omizzolo, F.; Bissoli, L.; Fantin, F.; Rizzotti, P.; Solerte, S.B.; et al. Unbalanced serum leptin and ghrelin dynamics prolong postprandial satiety and inhibit hunger in healthy elderly: Another reason for the “anorexia of aging”. Am. J. Clin. Nutr. 2006, 83, 1149–1152. [Google Scholar] [PubMed]
- Sturm, K.; MacIntosh, C.G.; Parker, B.A.; Wishart, J.; Horowitz, M.; Chapman, I.M. Appetite, food intake, and plasma concentrations of cholecystokinin, ghrelin, and other gastrointestinal hormones in undernourished older women and well-nourished young and older women. J. Clin. Endocrinol. Metab. 2003, 88, 3747–3755. [Google Scholar] [CrossRef] [PubMed]
- Rolls, B.J.; Dimeo, K.A.; Shide, D.J. Age-related impairments in the regulation of food intake. Am. J. Clin. Nutr. 1995, 62, 923–931. [Google Scholar] [CrossRef] [PubMed]
- Roberts, S.B.; Fuss, P.; Heyman, M.B.; Evans, W.J.; Tsay, R.; Rasmussen, H.; Fiatarone, M.; Cortiella, J.; Dallal, G.E.; Young, V.R. Control of food intake in older men. JAMA 1994, 272, 1601–1606. [Google Scholar] [PubMed]
- Giezenaar, C.; Trahair, L.G.; Rigda, R.; Hutchison, A.T.; Feinle-Bisset, C.; Luscombe-Marsh, N.D.; Hausken, T.; Jones, K.L.; Horowitz, M.; Chapman, I.; et al. Lesser suppression of energy intake by orally ingested whey protein in healthy older men compared with young controls. Am. J. Physiol. Regul. Integr. Comp. Physiol. 2015, 309, R845–R854. [Google Scholar] [CrossRef] [PubMed]
- Soenen, S.; Giezenaar, C.; Hutchison, A.T.; Horowitz, M.; Chapman, I.; Luscombe-Marsh, N.D. Effects of intraduodenal protein on appetite, energy intake, and antropyloroduodenal motility in healthy older compared with young men in a randomized trial. Am. J. Clin. Nutr. 2014, 100, 1108–1115. [Google Scholar] [CrossRef] [PubMed]
- Matthews, D.R.; Hosker, J.P.; Rudenski, A.S.; Naylor, B.A.; Treacher, D.F.; Turner, R.C. Homeostasis model assessment: Insulin resistance and β-cell function from fasting plasma glucose and insulin concentrations in man. Diabetologia 1985, 28, 412–419. [Google Scholar] [CrossRef] [PubMed]
- Kalra, S.; Gupta, Y. The insulin:glucagon ratio and the choice of glucose-lowering drugs. Diabetes Ther. 2016, 7, 1–9. [Google Scholar] [CrossRef] [PubMed]
- Parker, B.A.; Doran, S.; Wishart, J.; Horowitz, M.; Chapman, I.M. Effects of small intestinal and gastric glucose administration on the suppression of plasma ghrelin concentrations in healthy older men and women. Clin. Endocrinol. 2005, 62, 539–546. [Google Scholar] [CrossRef] [PubMed]
- Wishart, J.; Morris, H.A.; Horowitz, M. Radioimmunoassay of gastric inhibitory polypeptide in plasma. Clin. Chem. 1992, 38, 2156–2157. [Google Scholar] [PubMed]
- Steinert, R.E.; Luscombe-Marsh, N.D.; Little, T.J.; Standfield, S.; Otto, B.; Horowitz, M.; Feinle-Bisset, C. Effects of intraduodenal infusion of L-tryptophan on ad libitum eating, antropyloroduodenal motility, glycemia, insulinemia, and gut peptide secretion in healthy men. J. Clin. Endocrinol. Metab. 2014, 99, 3275–3284. [Google Scholar] [CrossRef] [PubMed]
- Bland, J.M.; Altman, D.G. Calculating correlation coefficients with repeated observations: Part 1-correlation within subjects. Br. Med. J. 1995, 310, 446. [Google Scholar] [CrossRef]
- Soenen, S.; Westerterp-Plantenga, M.S. No differences in satiety or energy intake after high-fructose corn syrup, sucrose, or milk preloads. Am. J. Clin. Nutr. 2007, 86, 1586–1594. [Google Scholar] [PubMed]
- Brener, W.; Hendrix, T.R.; McHugh, P.R. Regulation of the gastric emptying of glucose. Gastroenterology 1983, 85, 76–82. [Google Scholar] [PubMed]
- Hutchison, A.T.; Piscitelli, D.; Horowitz, M.; Jones, K.L.; Clifton, P.M.; Standfield, S.; Hausken, T.; Feinle-Bisset, C.; Luscombe-Marsh, N.D. Acute load-dependent effects of oral whey protein on gastric emptying, gut hormone release, glycemia, appetite, and energy intake in healthy men. Am. J. Clin. Nutr. 2015, 102, 1574–1584. [Google Scholar] [CrossRef] [PubMed]
- Adams, R.L.; Broughton, K.S. Insulinotropic Effects of Whey: Mechanisms of Action, Recent Clinical Trials, and Clinical Applications. Ann. Nutr. Metab. 2016, 69, 56–63. [Google Scholar] [CrossRef] [PubMed]
- Giezenaar, C.; Trahair, L.G.; Luscombe-Marsh, N.D.; Hausken, T.; Standfield, S.; Jones, K.L.; Lange, K.; Horowitz, M.; Chapman, I.; Soenen, S. Effects of randomized whey-protein loads on energy intake, appetite, gastric emptying, and plasma gut-hormone concentrations in older men and women. Am. J. Clin. Nutr. 2017, 106, 865–877. [Google Scholar] [CrossRef] [PubMed]
- Soenen, S.; Rayner, C.K.; Horowitz, M.; Jones, K.L. Gastric emptying in the elderly. Clin. Geriatr. Med. 2015, 31, 339–353. [Google Scholar] [CrossRef] [PubMed]
- Hrboticky, N.; Leiter, L.A.; Anderson, G.H. Effects of L-tryptophan on short term food intake in lean men. Nutr. Res. 1985, 5, 595–607. [Google Scholar] [CrossRef]
- Belza, A.; Toubro, S.; Astrup, A. The effect of caffeine, green tea and tyrosine on thermogenesis and energy intake. Eur. J. Clin. Nutr. 2009, 63, 57–64. [Google Scholar] [CrossRef] [PubMed]
- Rigamonti, A.E.; Pincelli, A.I.; Corra, B.; Viarengo, R.; Bonomo, S.M.; Galimberti, D.; Scacchi, M.; Scarpini, E.; Cavagnini, F.; Muller, E.E. Plasma ghrelin concentrations in elderly subjects: Comparison with anorexic and obese patients. J. Endocrinol. 2002, 175, R1–R5. [Google Scholar] [CrossRef] [PubMed]
- Parker, B.A.; Chapman, I.M. Food intake and ageing—The role of the gut. Mech. Ageing Dev. 2004, 125, 859–866. [Google Scholar] [CrossRef] [PubMed]
- Trahair, L.G.; Horowitz, M.; Rayner, C.K.; Gentilcore, D.; Lange, K.; Wishart, J.M.; Jones, K.L. Comparative effects of variations in duodenal glucose load on glycemic, insulinemic, and incretin responses in healthy young and older subjects. J. Clin. Endocrinol. Metab. 2012, 97, 844–851. [Google Scholar] [CrossRef] [PubMed]
- Caldow, M.K.; Ham, D.J.; Godeassi, D.P.; Chee, A.; Lynch, G.S.; Koopman, R. Glycine supplementation during calorie restriction accelerates fat loss and protects against further muscle loss in obese mice. Clin. Nutr. 2016, 35, 1118–1126. [Google Scholar] [CrossRef] [PubMed]
- Ham, D.J.; Murphy, K.T.; Chee, A.; Lynch, G.S.; Koopman, R. Glycine administration attenuates skeletal muscle wasting in a mouse model of cancer cachexia. Clin. Nutr. 2014, 33, 448–458. [Google Scholar] [CrossRef] [PubMed]
- Dillon, E.L. Nutritionally essential amino acids and metabolic signaling in aging. Amino Acids 2013, 45, 431–441. [Google Scholar] [CrossRef] [PubMed]
- Volpi, E.; Mittendorfer, B.; Wolf, S.E.; Wolfe, R.R. Oral amino acids stimulate muscle protein anabolism in the elderly despite higher first-pass splanchnic extraction. Am. J. Physiol. Endocrinol. Metab. 1999, 277, E513–E520. [Google Scholar] [CrossRef]
- Fromentin, G.; Darcel, N.; Chaumontet, C.; Marsset-Baglieri, A.; Nadkarni, N.; Tome, D. Peripheral and central mechanisms involved in the control of food intake by dietary amino acids and proteins. Nutr. Res. Rev. 2012, 25, 29–39. [Google Scholar] [CrossRef] [PubMed]
- Heddle, R.; Dent, J.; Read, N.W.; Houghton, L.A.; Toouli, J.; Horowitz, M.; Maddern, G.J.; Downton, J. Antropyloroduodenal motor responses to intraduodenal lipid infusion in healthy volunteers. Am. J. Physiol. 1988, 254, G671–G679. [Google Scholar] [CrossRef] [PubMed]


| Younger | Older | |||||||
|---|---|---|---|---|---|---|---|---|
| Concentrations | Baseline | 15 min | 60 min | AUC | Baseline | 15 min | 60 min | AUC |
| HOMA index | 0.6 ± 0.1 | 0.5 ± 0.1 | ||||||
| Glucose (mmol/L) | 5.3 ± 0.1 | 5.3 ± 0.1 | 5.0 ± 0.1 #& | 312 ± 4 | 5.4 ± 0.1 | 5.4 ± 0.1 | 5.4 ± 0.1 #& | 323 ± 6 |
| Insulin (mU/L) | 2.6 ± 0.4 | 9 ± 1 +# | 13 ± 2 + | 824 ± 126 + | 2.3 ± 0.3 | 5 ± 1 +# | 12 ± 2 + | 593 ± 89 + |
| Glucagon (pg/mL) | 62 ± 7 | 94 ± 12 +#& | 133 ± 14 +& | 7541 ± 836 +& | 67 ± 4 | 79 ± 4 +#& | 119 ± 7 +& | 6514 ± 313 +& |
| Insulin to glucagon ratio | 0.04 ± 0.0 | 0.09 ± 0.01 +# | 0.10 ± 0.02 + | 5.1 ± 0.7 + | 0.04 ± 0.01 | 0.06 ± 0.01 +# | 0.08 ± 0.01 + | 4.1 ± 0.5 + |
| Ghrelin (pg/mL) | 1223 ± 101 | 1471 ± 153 + | 1235 ± 130 +# | 79,470 ± 8396 + | 1266 ± 120 | 1574 ± 207 + | 1313 ± 156 +# | 87,509 ± 12,176 + |
| GIP (pmol/L) | 13 ± 1 | 19 ± 3 + | 23 ± 1 +#& | 1458 ± 83 +# | 15 ± 2 | 27 ± 3 + | 34 ± 3 +#& | 2063 ± 185 +# |
| GLP-1 (pmol/L) | 26 ± 3 | 30 ± 3 + | 37 ± 3 + | 2023 ± 169 + | 23 ± 3 | 24 ± 3 + | 31 ± 4 + | 1675 ± 189 + |
| PYY (pmol/L) | 34 ± 4 | 37 ± 4 +# | 41 ± 5 + | 2276 ± 265 + | 26 ± 1 | 26 ± 1 +# | 36 ± 3 + | 1776 ± 115 + |
| Total amino acids (mmol/L) | 2.2 ± 0.01 | 2.6 ± 0.2 +& | 3.6 ± 0.2 +& | 236 ± 12 +& | 2.3 ± 0.01 | 2.4 ± 0.1 +& | 3.5 ± 0.1 +& | 225 ± 7 +& |
| Essential amino acids (mmol/L) | 0.7 ± 0.01 | 1.0 ± 0.04 +#& | 1.61 ± 0.13 +# | 106 ± 6 +& | 0.7 ± 0.01 | 0.8 ± 0.02 +#& | 1.52 ± 0.1 +# | 94 ± 5 +& |
| Concentrations | r | p |
|---|---|---|
| Glucose (mmol/L) | −0.12 | 0.35 |
| Insulin (mU/L) | 0.80 | <0.001 |
| Glucagon (pg/mL) | 0.84 | <0.001 |
| Ghrelin (pg/mL) | −0.32 | 0.013 |
| GIP (pmol/L) | 0.82 | <0.001 |
| GLP-1 (pmol/L) | 0.62 | <0.001 |
| PYY (pmol/L) | 0.45 | <0.001 |
© 2018 by the authors. Licensee MDPI, Basel, Switzerland. This article is an open access article distributed under the terms and conditions of the Creative Commons Attribution (CC BY) license (http://creativecommons.org/licenses/by/4.0/).
Share and Cite
Giezenaar, C.; Luscombe-Marsh, N.D.; Hutchison, A.T.; Standfield, S.; Feinle-Bisset, C.; Horowitz, M.; Chapman, I.; Soenen, S. Dose-Dependent Effects of Randomized Intraduodenal Whey-Protein Loads on Glucose, Gut Hormone, and Amino Acid Concentrations in Healthy Older and Younger Men. Nutrients 2018, 10, 78. https://doi.org/10.3390/nu10010078
Giezenaar C, Luscombe-Marsh ND, Hutchison AT, Standfield S, Feinle-Bisset C, Horowitz M, Chapman I, Soenen S. Dose-Dependent Effects of Randomized Intraduodenal Whey-Protein Loads on Glucose, Gut Hormone, and Amino Acid Concentrations in Healthy Older and Younger Men. Nutrients. 2018; 10(1):78. https://doi.org/10.3390/nu10010078
Chicago/Turabian StyleGiezenaar, Caroline, Natalie D Luscombe-Marsh, Amy T Hutchison, Scott Standfield, Christine Feinle-Bisset, Michael Horowitz, Ian Chapman, and Stijn Soenen. 2018. "Dose-Dependent Effects of Randomized Intraduodenal Whey-Protein Loads on Glucose, Gut Hormone, and Amino Acid Concentrations in Healthy Older and Younger Men" Nutrients 10, no. 1: 78. https://doi.org/10.3390/nu10010078