Moderation and Mediation Analysis of the Relationship between Total Protein Concentration and the Risk of Depressive Disorders in Older Adults with Function Dependence in Home Care

 ,
,  ,
,
Abstract
:1. Introduction
2. Materials and Methods
2.1. Study Design
2.2. Measurements
2.3. Anthropometric Measurements
2.4. Blood Collection and Biochemical Analysis
2.5. Statistical Analysis
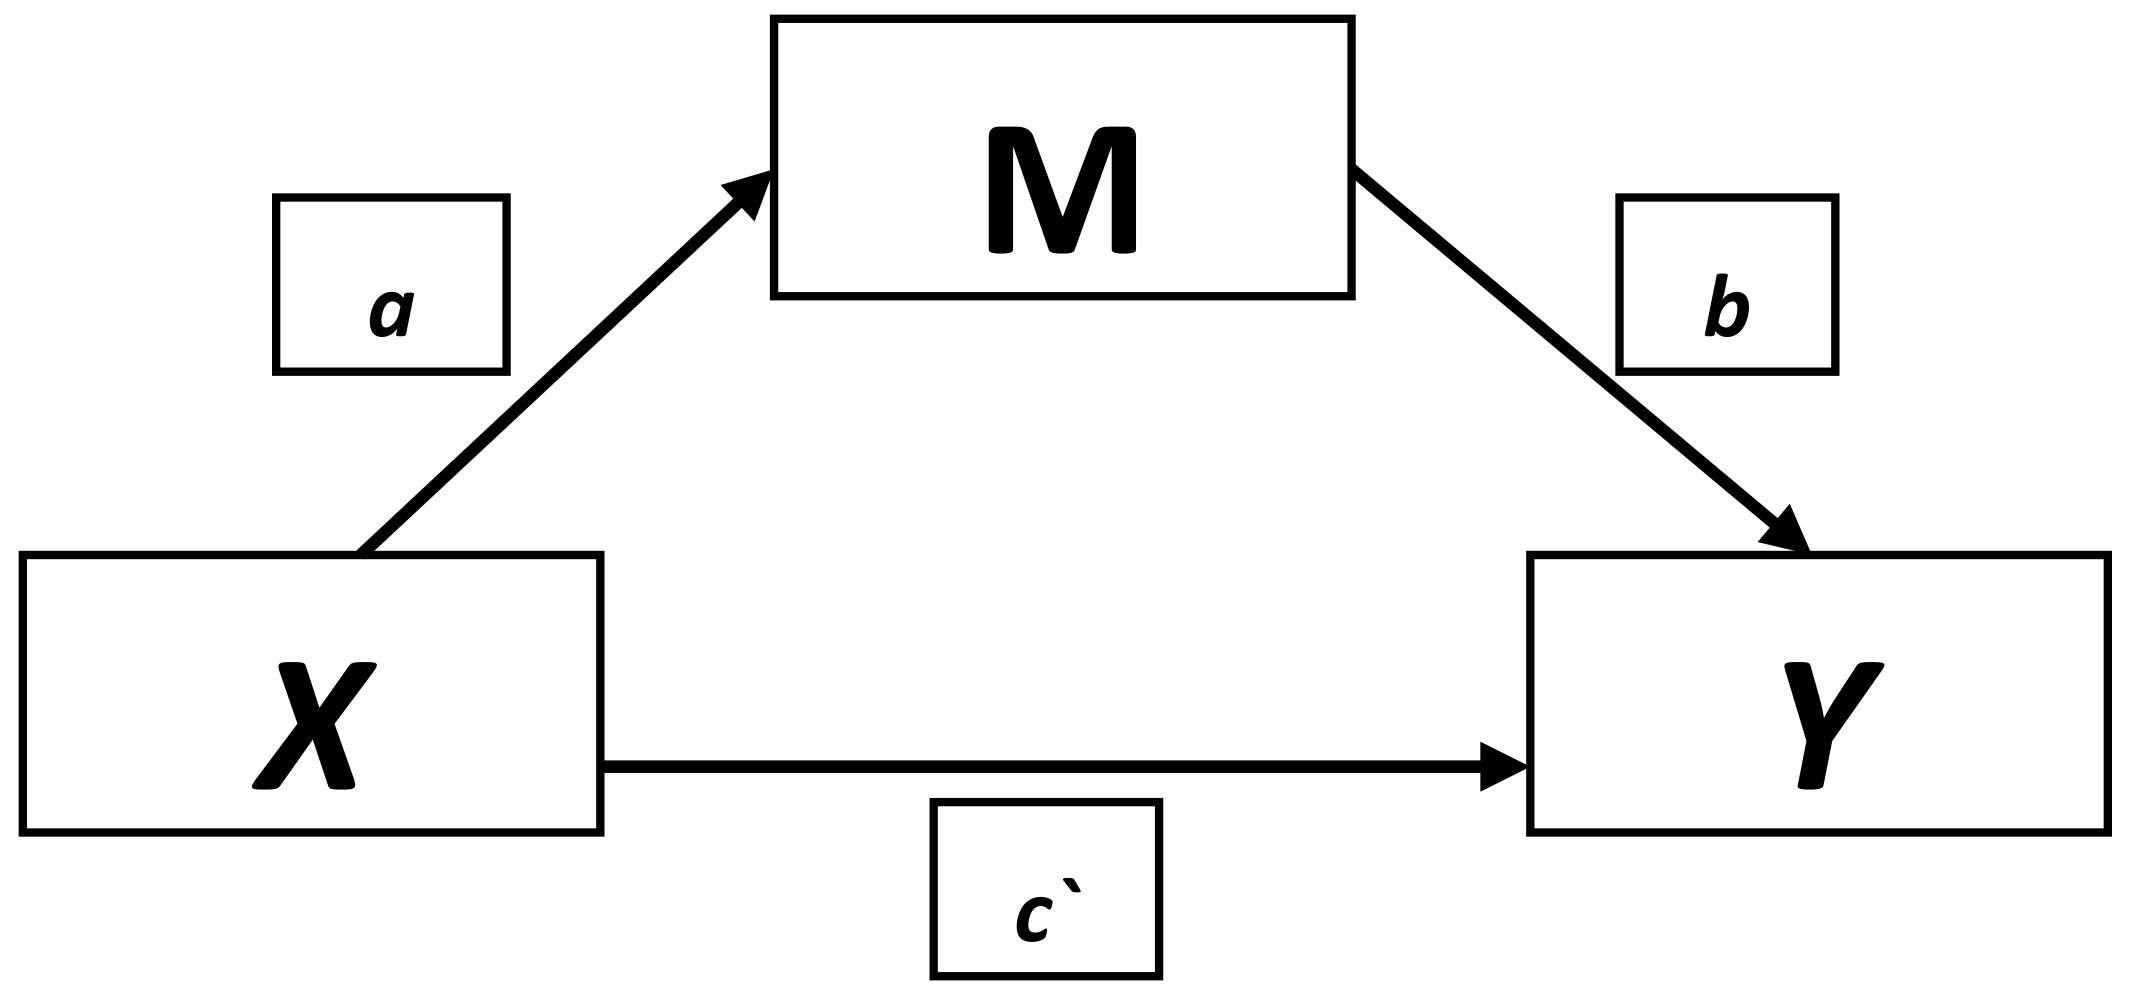
- Providing the coefficient for a given mediator (after controlling for total protein concentration) with 95% confidence interval (95% CI), path b.
- Direct effect (c`), coefficient of regression model for the total protein concentration after controlling for mediating variable (mediator) with 95% CI.
- Indirect effect with 95% CI, calculated taking into consideration “bias-corrected” and “accelerated” corrections. The effect is the product (a*b, on the attached scheme) of the coefficients (in regression model) between the total protein concentration and the studied mediating variable which examines the relationship between the coefficient (in the regression model) between the mediating variable and depression.
3. Results
3.1. Characteristics of the Studied Groups According to Sociodemographic and Medical Data
3.2. Relationship between GDS-SF and Studied Criteria
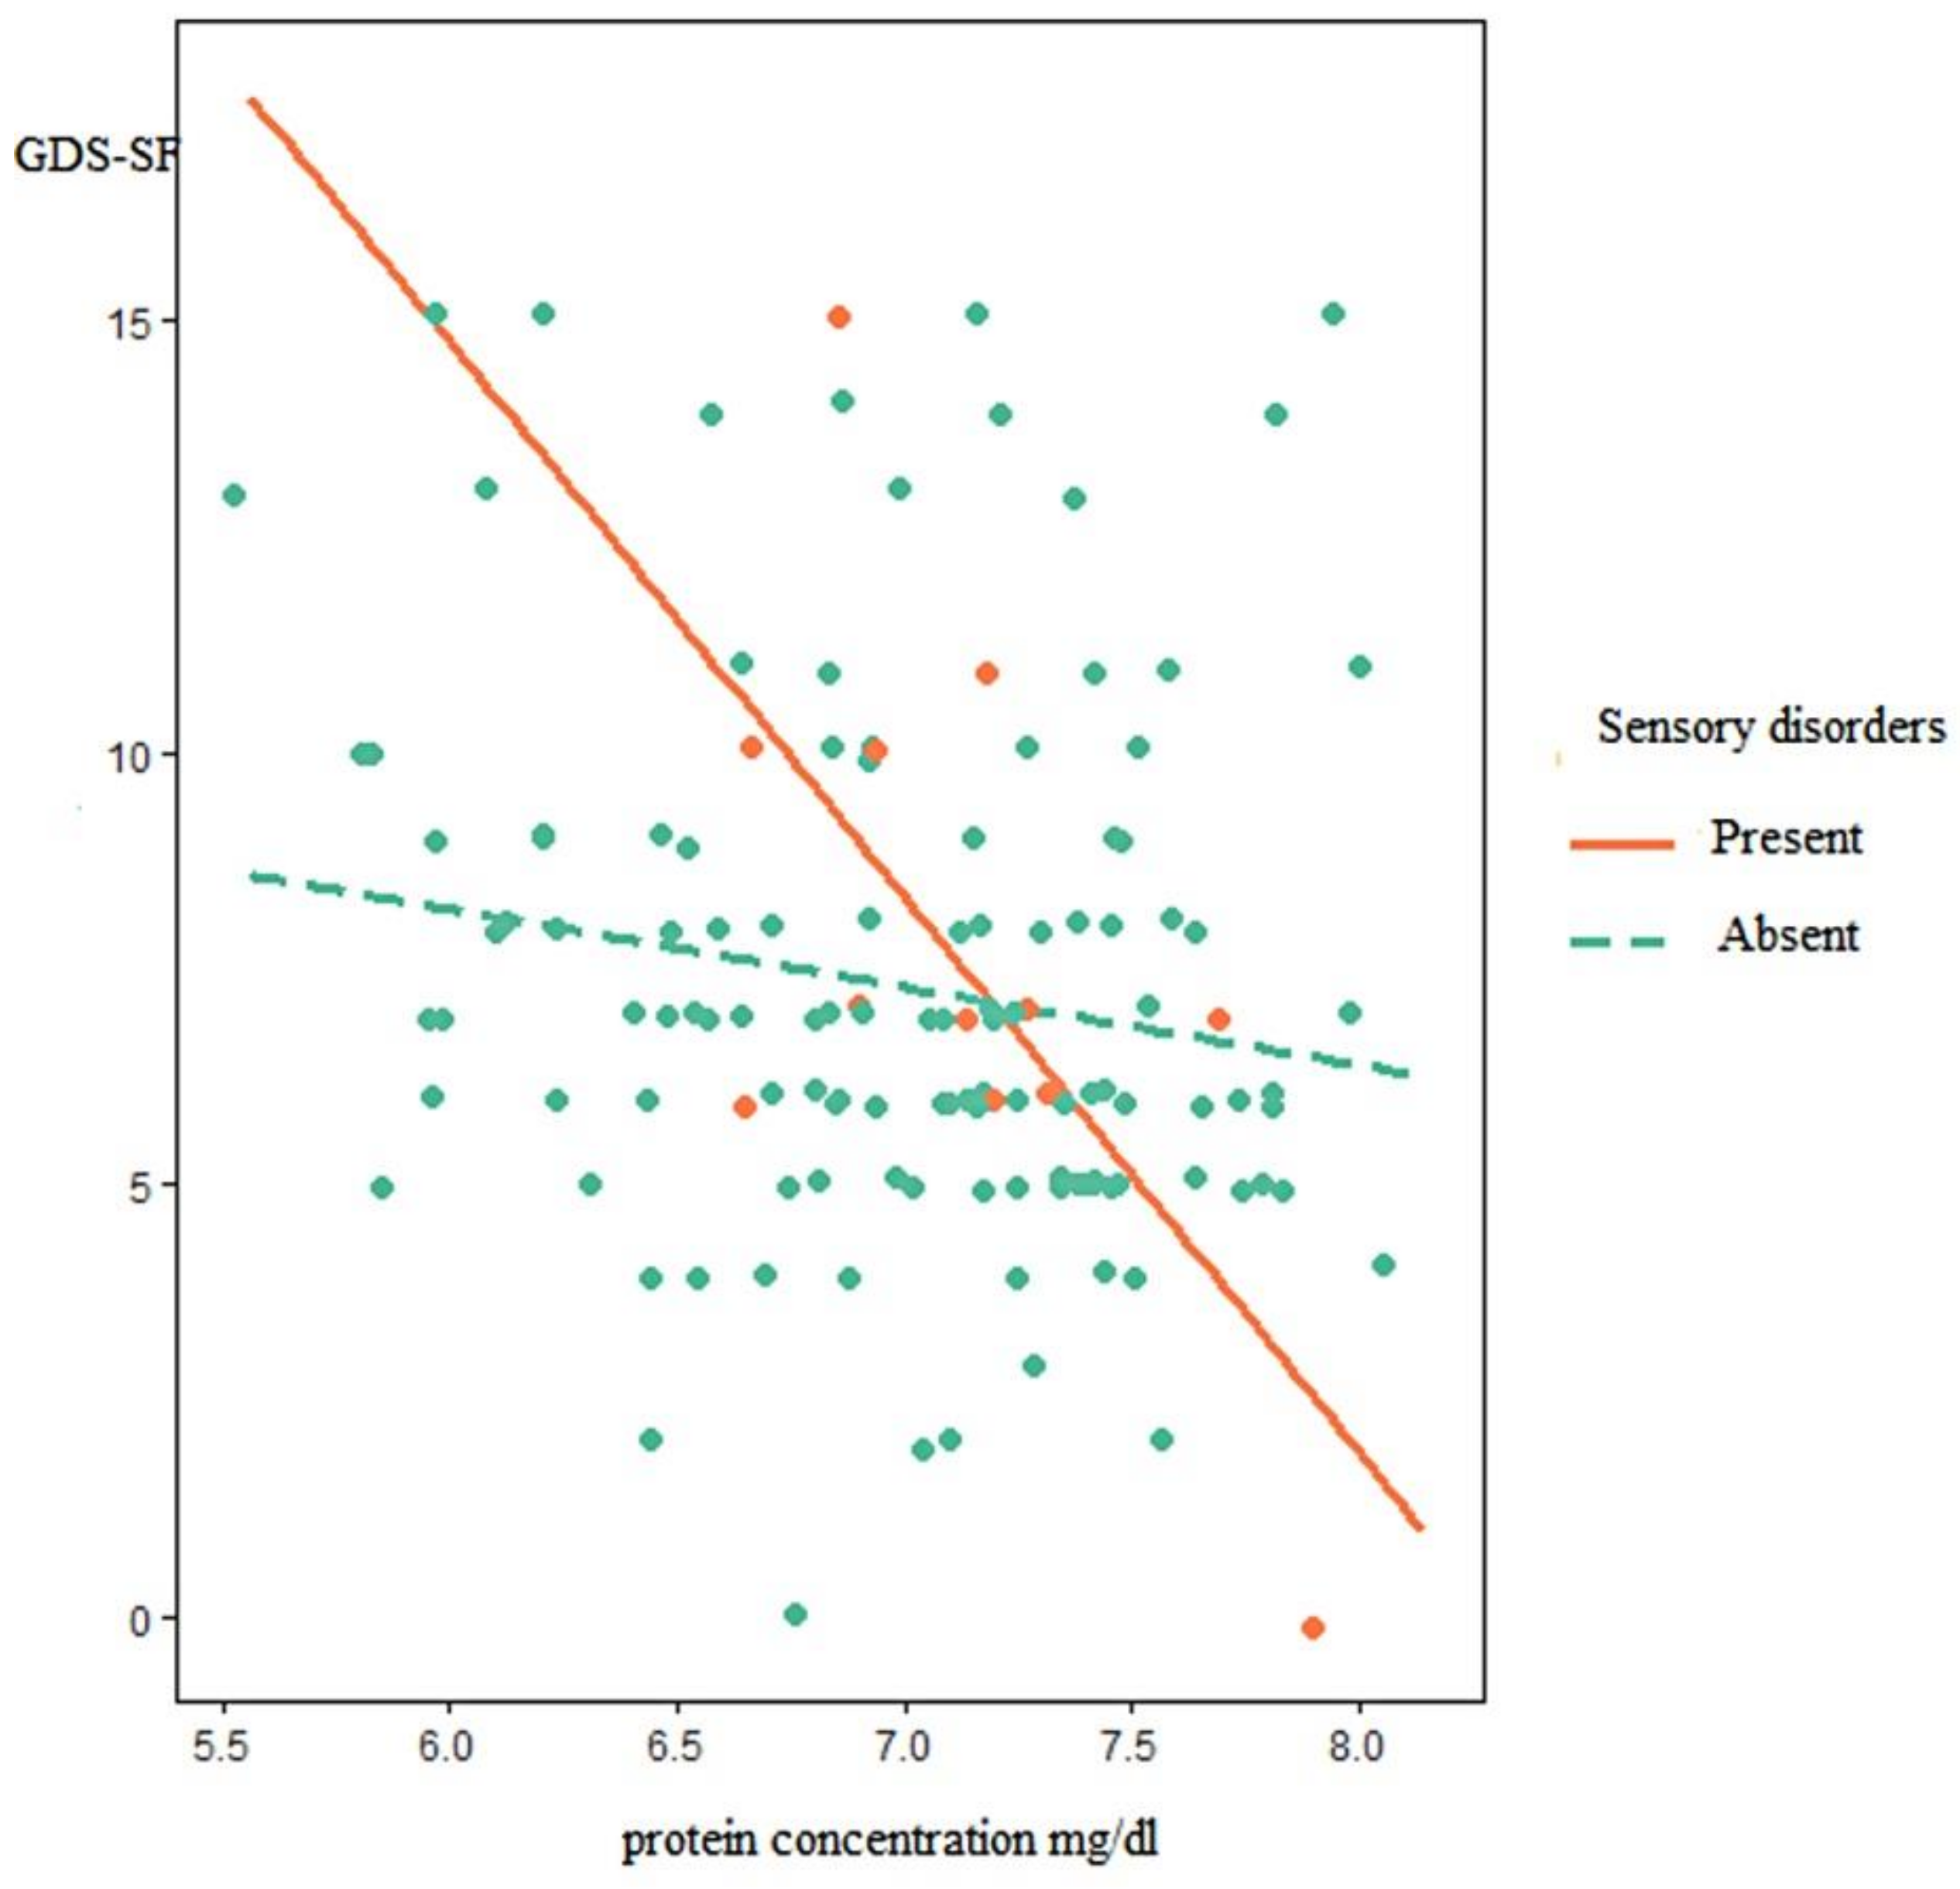
3.3. Moderation Model
3.4. Mediation Model
4. Discussion
4.1. Implications of the Present Findings
4.2. Limitations
5. Conclusions
Author Contributions
Funding
Conflicts of Interest
References
- Koyano, W.; Shibata, H.; Nakazato, K. Mortality in Relation to instrumental activities of daily living: One-year follow-up in a Japanese urban community. Soc. Sci. 1989, 3, 107–109. [Google Scholar] [CrossRef]
- Grand, A.; Grosclaude, P.; Bocquet, H.; Pous, J.; Albarede, J.L. Disability, psychosocial factors and mortality among the elderly in a rural French population. J. Clin. Epidemiol. 1990, 8, 773–782. [Google Scholar] [CrossRef]
- Tobiasz-Adamczyk, B. Psychosocial factors conditioning the life expectancy of older people. Gerontol. Pol. 1997, 1, 30–37. [Google Scholar]
- Genet, N.; Boerma, W.G.; Kringos, D.S.; Bouman, A.; Francke, A.L.; Fagerström, C.; Melchiorre, M.G.; Greco, C.; Devillé, W. Home care in Europe: A systematic literature review. BMC Health Serv. Res. 2011, 11, 207. [Google Scholar] [CrossRef] [PubMed]
- Nowak-Kapusta, Z.; Irzyniec, T.; Franek, G.; Drzazga, B. Home longterm care male and female nurses. Pielęg. Pol. 2017, 3, 409–415. [Google Scholar] [CrossRef]
- Kędziora-Kornatowska, K.; Muszalik, M.; Skolmowska, E. Nursing in Long-Term Care; PZWL: Warsaw, Poland, 2010. [Google Scholar]
- World Bank. Current Status and Future of Long-Term Care in an Aging Poland. Comments on the Need to Develop a Policy for Long-Term Care. Available online: https://das.mpips.gov.pl/source/opiekasenioralna/Opieka_dlugoterminowa_Final_POL.pdf (accessed on 28 January 2018).
- Kotowska, I.; Sztanderska, U.; Wóycicka, I. Between Home and Work. Recommendations for Politicians; Scholar: Warsaw, Poland, 2007. [Google Scholar]
- Łuczak, P. Long-term care for the elderly in Poland. In Facing the Challenges. Social Policy in Poland after 1990; Michoń, P., Żukowski, M., Eds.; University of Economics Press: Poznan, Poland, 2013; pp. 169–179. [Google Scholar]
- Irzyniec, T.; Nowak-Kapusta, Z.; Franek, G.; Drzazga, B. The elderly under the long-term home-based nursing care. Gerontol. Pol. 2016, 3, 207–213. [Google Scholar]
- Markiewicz, I.; Cebulak, M. Functional ability of patients provided with the nursing long-term domiciliary care. Probl. Pielęg. 2014, 1, 42–51. [Google Scholar]
- Mojsa, W.; Chlabicz, S.; Małyszko, J. Characteristics of “long-term home care nursing” patients in the years 2004–2008 in Podlasie Province. Gerontol. Pol. 2013, 1, 18–24. [Google Scholar]
- Miller, E. Role of nurse in prevention of chosen complications connected with patient immobilization. Probl. Pielęg. 2007, 4, 278–283. [Google Scholar]
- Ferrando, A.A.; Lane, H.W.; Stuart, C.A.; DaFvis-Street, J.; Wolfe, R. Prolonged bed rest decreases skeletal muscle and whole body protein synthesis. Am. J. Physiol. 1996, 270, E627–E633. [Google Scholar] [CrossRef] [PubMed]
- Adams, G.R.; Caizzo, V.J.; Baldwin, K.M. Skeletal muscle unweighting: Spaceflight and ground-based models. J. Appl. Physiol. 2003, 6, 2185–2201. [Google Scholar] [CrossRef] [PubMed]
- Maillet, A.; Zaouali-Ajina, M.; Vorobiev, D.; Blanc, S.; Pastouchkova, L.; Reushkina, G.; Morukov, B.; Grigoriev, A.I.; Gharbi, G.; Gauquelin-Koch, G. Orthostatic tolerance and hormonal changes in women during 120 days of head-down bed rest. Aviat. Space Environ. Med. 2000, 7, 706–714. [Google Scholar]
- Miller, E.; Rutkowski, M.; Mrowiska, M.; Matuszewski, T. Participation of reactive oxygen species in muscle damage produced by hypokinesis. Pol. Merkuriusz. Lek. 2007, 23, 314–317. [Google Scholar]
- Kostka, T.; Koziarska-Rościszewska, M. Diseases of Old Age; PZWL: Warsaw, Poland, 2009. [Google Scholar]
- Strugała, M.; Wieczorkowska-Tobis, K. The assessment of the nutritional status of patients at the Geriatric Ward in the context of their functional status. Geriatria 2011, 5, 89–93. [Google Scholar]
- Humańska, M.A.; Kędziora-Kornatowska, K. Influence of place of residence on nutrition in the elderly. Gerontol. Pol. 2009, 17, 126–128. [Google Scholar]
- Waśkiewicz, A.; Sygnowska, E.; Broda, G. Evaluation of health and nutritional status of persons aged 75+ in Polish Population WOBASZ-SENIOR project. Brom. Chem. Toksykol. 2012, 3, 614–618. [Google Scholar]
- Kvamme, J.M.; Holmen, J.; Wilsgaard, T.; Florholmen, J.; Midthjell, K.; Jacobsen, B.K. Body mass index and mortality in elderly men and women: The Tromso and HUNT studies. J. Epidemiol. Community Health 2012, 66, 611–617. [Google Scholar] [CrossRef] [PubMed] [Green Version]
- Larrieu, S.; Pérès, K.; Letenneur, L.; Berr, C.; Dartigues, J.F.; Ritchie, K.; Février, B.; Alpérovitch, A.; Barberger-Gateau, P. Relationship between body mass index and different domains of disability in older persons: The 3C study. Int. J. Obes. Relat. Metab. Disord. 2004, 28, 1555–1560. [Google Scholar] [CrossRef] [PubMed]
- Arshad, F.; Peng, K.S. Screening malnutrition the quick and easy way in order to reduce hospitalization costs. Malays. J. Med. Sci. 2007, 14 (Suppl. 1), 14. [Google Scholar]
- Heersink, J.T.; Brown, C.J.; Dimaria-Ghalili, R.A.; Locher, J.L. Undernutrition in hospitalized older adults: Patterns and correlates, outcomes, and opportunities for intervention with a focus on process of care. J. Nutr. Elder 2010, 29, 4–41. [Google Scholar] [CrossRef] [PubMed]
- Van Nes, M.C.; Herrmann, F.R.; Gold, G.; Michel, J.P.; Rizzoli, R. Does the mini nutritional assessment predict hospitalization outcomes in older people? Age Ageing 2001, 30, 221–226. [Google Scholar] [CrossRef] [PubMed]
- Saletti, A.; Johansson, L.; Yifter-Lindgren, E.; Wissing, U.; Osterberg, K.; Cederholm, T. Nutritional status and a 3-year follow-up in elderly receiving support at home. Gerontology 2005, 51, 192–198. [Google Scholar] [CrossRef] [PubMed]
- Crogan, N.L.; Pasvogel, A. The influence of protein-calorie malnutrition on quality of life in nursing homes. J. Gerontol. A. Biol. Sci. Med. Sci. 2003, 58, 159–164. [Google Scholar] [CrossRef] [PubMed]
- Albiński, R.; Kleszczewska-Albińska, A.; Bedyńska, S. Geriatric Depression Scale (GDS). Validity and reliability of different versions of the scale—Review. Psychiatr. Pol. 2011, 4, 555–562. [Google Scholar]
- Yesavage, J.A.; Brink, T.L.; Rose, T.L.; Lum, O.; Huang, V.; Adey, M.; Leirer, V.O. Development and validation of a geriatric depression screening scale: A preliminary report. J. Psychiatr. Res. 1983, 1, 37–49. [Google Scholar] [CrossRef]
- Mahoney, F.I.; Barthel, D.W. Functional evaluation: The Barthel Index. Md. State Med. J. 1965, 14, 61–65. [Google Scholar] [PubMed]
- Kuźmicz, I.; Brzostek, T.; Górkiewicz, M. Barthel questionnaire as measurement tool for physical independence of older adults. Stud. Med. 2008, 12, 17–21. [Google Scholar]
- National Health and Nutrition Examination Survey (NHANES). Anthropometry Procedures Manual. Available online: https://www.cdc.gov/nchs/data/nhanes/nhanes_07_08/manual_an.pdf (accessed on 28 January 2018).
- Martin, A.D.; Carter, J.E.L.; Hendy, K.C.; Malina, R.M. Segment lengths. In Anthropometric Standardization Reference Manual; Lohman, T.G., Roche, A.F., Martorell, R., Eds.; Human Kinetics Books: Champaign, IL, USA, 1988; pp. 9–26. [Google Scholar]
- Hayes, A.F. Introduction to Mediation, Moderation, and Conditional Process Analysis: A Regression Based Approach; Guilford Press: New York, NY, USA, 2013. [Google Scholar]
- Bauer, J.; Biolo, G.; Cederholm, T.; Cesari, M.; Cruz-Jentoft, A.J.; Morley, J.E.; Phillips, A.; Sieber, C.; Stehle, P.; Teta, D.; et al. Evidence-based recommendations for optimal dietary protein intake in older people: A position paper from the PROT-AGE Study Group. J. Am. Med. Dir. Assoc. 2013, 14, 542–559. [Google Scholar]
- Jiang, H.; Chen, S.; Li, C.; Lu, N.; Yue, Y.; Yin, Y.; Zhang, Y.; Zhi, X.; Zhang, D.; Yuan, Y. The serum protein levels of the tPA-BDNF pathway are implicated in depression and antidepressant treatment. Transl. Psychiatry 2017, 7, e1079. [Google Scholar] [CrossRef] [PubMed]
- Leber, S.L.; Llenos, I.C.; Miller, C.L.; Dulay, J.R.; Haybaeck, J.; Weis, S. Homer1a protein expression in schizophrenia, bipolar disorder, and major depression. J. Neural. Transm. (Vienna) 2017, 124, 1261–1273. [Google Scholar] [CrossRef] [PubMed]
- Milosevic, A.; Liebmann, T.; Knudsen, M.; Schintu, N.; Svenningsson, P.; Greengard, P. Cell- and region-specific expression of depression-relatedproteinp11 (S100a10) in the brain. J. Comp. Neurol. 2017, 525, 955–975. [Google Scholar] [CrossRef] [PubMed]
- Murray, C.J.; Vos, T.; Lozano, R.; Naghavi, M.; Flaxman, A.D.; Michaud, C.; Ezzati, M.; Shibuya, K.; Salomon, J.A.; Abdalla, S.; et al. Disability-adjusted life years (DALYs) for 291 diseases and injuries in 21 regions, 1990–2010; a systematic analysis for the Global Burden of Disease Study 2010. Lancet 2012, 380, 2197–2223. [Google Scholar] [CrossRef]
- Domenici, E.; Willé, D.R.; Tozzi, F.; Prokopenko, I.; Miller, S.; McKeown, A.; Brittain, C.; Rujescu, D.; Giegling, I.; Turck, C.W.; et al. Plasma protein biomarkers for depression and schizophrenia by multi analyte profiling of case-control collections. PLoS ONE 2010, 5, e9166. [Google Scholar] [CrossRef] [PubMed] [Green Version]
- Berk, M.; Williams, L.J.; Jacka, F.N.; O’Neil, A.; Pasco, J.; Moylan, S.; Allen, N.B.; Stuart, A.L.; Hayley, A.C.; Byrne, M.L.; et al. So depression is an inflammatory disease, but where does the inflammation come from? BMC Med. 2013, 11, 200. [Google Scholar] [CrossRef] [PubMed]
- Gałecki, P.; Maes, M.; Florkowski, A.; Lewiński, A.; Gałecka, E.; Bieńkiewicz, M.; Szermraj, J. Association between inducible and neuronal nitric oxide syntheses polymorphisms and recurrent depressive disorder. J. Affect Disord. 2011, 129, 175–182. [Google Scholar] [CrossRef] [PubMed]
- Maes, M.; Gałecki, P.; Chang, Y.S.; Berk, M. A review on the oxidative and nitrosative stress (O&NS) pathways in major depression and their possible contribution to the (neuro)degenerative processes in that illness. Prog. Neuropsychopharmacol. Biol. Psychiatry 2011, 3, 676–692. [Google Scholar]
- Talarowska, M.; Gałecki, P.; Maes, M.; Bobińska, K.; Kowalczyk, E. Total antioxidant status correlates with cognitive impairment in patients with recurrent depressive disorder. Neurochem. Res. 2012, 8, 1761–1767. [Google Scholar] [CrossRef] [PubMed]
- Heaney, R.P. Functional indices of vitamin D status and ramifications of vitamin D deficiency. Am. J. Clin. Nutr. 2004, 80, 1706S–1709S. [Google Scholar] [CrossRef] [PubMed]
- Mackay-Sim, A.; Féron, F.; Eyles, D.; Burne, T.; McGrath, J. Schizofrenia, vitamin D and brain development. Int. Rev. Neurobiol. 2004, 59, 351–380. [Google Scholar] [PubMed]
- Hoogendijk, W.J.; Lips, P.; Dik, M.G.; Deeg, D.J.; Beekman, A.T.; Penninx, B.W. Depression is associated with decreased 25-hydroxyvitamin D and increased parathyroid hormone levels in older adults. Arch. Gen. Psychiatry 2008, 8, 508–512. [Google Scholar] [CrossRef] [PubMed]
- Zanetidou, S.; BelvederiMurri, M.; Buffa, A.; Malavota, N.; Anzivino, F.; Bertakis, K. Vitamin D supplements in geriatric major depression. Int. J. Geriatr. Psychiatry 2011, 11, 1209–1210. [Google Scholar] [CrossRef] [PubMed]
- Chang, Y.C.; Yao, G.; Hu, S.C.; Wang, J.D. Depression affects the scores of all facets of the WHOQOL-BREF and may mediate the effects of physical disability among community-dwelling older adults. PLoS ONE 2015, 5, e0128356. [Google Scholar] [CrossRef] [PubMed]


| Variable | n = 132 |
|---|---|
| Medical interview | |
| Under long-term care (years) | 3.91 ± 2.61 a |
| Result on the Barthel index | 43.20 ± 27.06 a |
| Result on GDS-SF scale | 7.34 ± 3.10 a |
| Amount of medicinal substances taken | 7.9 ± 2.8 a |
| Comorbidities | |
| Respiratory system | 19 (14.4) b |
| Endocrine system | 54 (40.9) b |
| Nervous system | 35 (26.5) b |
| Sensory | 12 (9.1) b |
| Psychiatric | 55 (41.7) b |
| Rheumatic | 77 (58.3) b |
| Laboratory test results | |
| Total protein (g/dL) | 7.09(6.61–7.37) c |
| 25(OH)D vitamin(ng/mL) | 14.41 (8.64–26.63) c |
| B12 vitamin (pg/mL) | 390.76 ± 143.35 a |
| Folic acid (ng/mL) | 5.4 (3.74–9.92) c |
| Total cholesterol (mg/dL) | 183 (158.0–218.0) c |
| HDL Cholesterol (mg/dL) | 53.55 (42.62–64.22) c |
| LDL Cholesterol(mg/dL) | 106.5 (86.0–130.75) c |
| Triglycerides (mg/dL) | 115 (88.25–158.75) c |
| Anthropometric variables | |
| Calf circumference (cm) | 36.05 ± 5.42 a |
| Mid-upper arm circumference(cm) | 30.79 ± 7.90 a |
| Tibial bone length (cm) | 48.02 ± 5.44 a |
| Thickness of the skinfold under the shoulder (cm) | 2.6 (2.1–4.0) c |
| Skinfold of arm muscle triceps (cm) | 2.3 (2.0–3.8) c |
| Variable | b | 95% CI |
|---|---|---|
| Gender | ||
| Male | 0.40 | (−0.89; 1.70) |
| Age | 0.02 | (−0.04; 0.09) |
| Marital status | ||
| In a relationship | −0.86 | (−1.97; 0.24) |
| Cohabitant | ||
| None | 0.75 | (−0.54; 2.03) |
| Medical interview | ||
| Under long-term healthcare (years) | −0.04 | (−0.26; 0.17) |
| Results in the Barthel index | −0.02 | (−0.04; −0.004) * |
| Amount of medicinal substances taken | 0.004 | (−0.36; 0.36) |
| Comorbidities: | ||
| Respiratory system | −1.45 | (−2.95; 0.06) |
| Endocrine system | −0.33 | (−1.42; 0.76) |
| Nervous system | 0.23 | (−0.98; 1.44) |
| Sensory | −0.36 | (−2.22; 1.50) |
| Psychiatric | −0.35 | (−1.42; 0.72) |
| Rheumatic | 0.51 | (−0.58; 1.60) |
| Laboratory tests results | ||
| Total protein | −1.10 | (−2.08; −0.13) * |
| 25(OH)D Vitamin | −0.008 | (−0.02; 0.007) |
| B12 Vitamin | −0.001 | (−0.004; 0.003) |
| Folic acid | 0.001 | (−0.05; 0.06) |
| Total cholesterol | −0.004 | (−0.01; 0.007) |
| HDL Cholesterol | −0.03 | (−0.07; −0.002) * |
| LDL Cholesterol | 0.001 | (−0.01; 0.01) |
| Triglycerides | −0.001 | (−0.01; 0.009) |
| Anthropometric variables | ||
| Calf circumference | −0.08 | (−0.18; 0.02) |
| Mid-upper arm circumference | −0.079 | (−0.15; −0.01) * |
| Tibia bone length from foot base to the knee | −0.003 | (−0.10; 0.10) |
| Thickness of under the shoulder skinfold | 0.05 | (−0.007; 0.12) |
| Skinfold of arm triceps muscle | 0.06 | (−0.008; 0.12) |
| Model | Moderator Coefficient (95% CI) | Protein Coefficient (95% CI) | Interaction Coefficient | F |
|---|---|---|---|---|
| Gender | ||||
| R2 = 0.04 | 2.28 (−13.40; 17.96) | −0.77 (−3.75; 2.21) | 0.27 (−2.50; 1.97) | 1.81 |
| ΔR2 = 0.0004 | 0.42 (−0.86; 1.69) | −1.11 (−2.09; −0.13) | 2.71 | |
| Age | ||||
| R2 = 0.037 | 0.06 (−56.86; 77.60) | −0.44 (-9.94; 9.06) | −0.008 (−0.12; 0.11) | 1.66 |
| ΔR2 = 0.0001 | 0.0002 (−0.065; 0.065) | −1.1 (−2.15; −0.056) | 2.49 | |
| Comorbidities | ||||
| Respiratory system | ||||
| R2 = 0.06 | −0.67 (−18.78; 17.43) | −0.89 (−5.73; 3.95) | −0.10 (−2.69; 2.48) | 2.86 |
| ΔR2 = 0.000 | −1.41 (−2.89; 0.08) | −1.09 (−2.005; 0.12) * | 4.33 | |
| Endocrine system | ||||
| R2 = 0.05 | −8.34 (−22.14; 5.46) | −2.84 (−5.97; 0.28) | 1.17 (−0.80; 3.14) | 2.16 |
| ΔR2 = 0.01 | −0.18 (-1.26; 0.90) | −1.08 (−2.07; −0.10) | 2.55 | |
| Nervous system | ||||
| R2 = 0.04 | 6.86 (−9.29; 23.01) | 0.51 (−3.72; 4.73) | −0.93 (−3.26; 1.39) | 2.01 |
| ΔR2 = 0.005 | 0.39 (−0.81; 1.59) | −1.14 (−2.13; −0.16) * | 2.71 | |
| Sensory | ||||
| R2 = 0.075 | −39.7 (−74.85; −4.55) | −11.95 (−21.69; −2.21) * | 5.52 (0.58; 10.47) * | 3.44 |
| ΔR2 = 0.035 * | −0.49 (−2.33; 1.35) | −1.12 (−2.10; −0.14) * | 2.64 | |
| Psychiatric | ||||
| R2 = 0.043 | 0.09 (−13.69; 13.87) | −1.04 (−4.33; 2.24) | −0.05(−2.01; 1.92) | 1.89 |
| ΔR2 = 0.000 | −0.24 (−1.29; 0.82) | −1.12 (−2.08; -0.16) * | 2.86 | |
| Rheumatic | ||||
| R2 = 0.046 | 1.59 (−12.31; 15.49) | −0.93 (−3.92; 2.07) | −0.14 (−2.12; 1.83) | 2.05 |
| ΔR2 = 0.0002 | 0.58 (−0.49; 1.64) | −1.13 (−2.11; −0.16) * | 3.08 | |
| Mediator (M) A (Path b) | Direct Effect (Path c’) B of Protein→ GDS-SF | Indirect Effect (a*b) of Protein→M→GDS-SF | ||||
|---|---|---|---|---|---|---|
| b | 95% CI | b | 95% CI | b | 95% CI | |
| Laboratory parameters: | ||||||
| 25 (OH)D vitamin | −0.05 | (−0.10; −0.007) * | −0.786 | (−1.78; 0.21) | −0.162 | (−0.45; −0.01) * |
| B12 vitamin | −0.0003 | (−0.004; 0.003) | −1.09 | (−2.12; −0.06) * | −0.012 | (−0.31; 0.13) |
| Folic acid | 0.045 | (−0.05; 0.14) | −1.135 | (−2.12; −0.15) | 0.032 | (−0.04; 0.23) |
| Total Cholesterol | −0.003 | (−0.01; 0.007) | −1.078 | (−2.06; −0.09) * | −0.027 | (−0.25; 0.04) |
| HDL Cholesterol | −0.027 | (−0.06; 0.006) | −0.908 | (−1.91; −0.09) * | −0.197 | (−0.63; 0.01) |
| LDL Cholesterol | 0.0004 | (−0.13; 0.014) | −1.10 | (−2.08; −0.12) * | −0.0013 | (−0.13; 0.09) |
| Triglycerides | 0.001 | (−0.008; 0.01) | −1.132 | (−2.13; −0.13) * | 0.027 | (−0.12; 0.30) |
| Result on the Barthel index | −0.02 | (−0.04; −0.0002) * | −0.882 | (−1.87; 0.11) | −0.223 | (−0.54; −0.05) * |
| Anthropometric variables: | ||||||
| Calf circumference | −0.073 | (−0.17; 0.02) | −1.039 | (−2.01; −0.07) * | −0.035 | (−0.35; 0.07) |
| Mid-upper arm circumference | −0.141 | (−0.25; −0.035) * | −0.900 | (−1.86; 0.06) | −0.174 | (−0.50; 0.02) |
| Tibia bone length from foot base to the knee | −0.011 | (−0.11; 0.09) | −1.082 | (−2.06; −0.10) * | 0.008 | (−0.12; 0.24) |
| Thickness of under the shoulder skinfold | 0.05 | (−0.01; 0.11) | −1.014 | (−1.99; −0.04) * | −0.059 | (−0.50; 0.06) |
| Arm triceps muscle skinfold | 0.05 | (−0.01; 0.12) | −1.014 | (−1.99; −0.04) * | −0.600 | (−0.47; 0.07) |
© 2018 by the authors. Licensee MDPI, Basel, Switzerland. This article is an open access article distributed under the terms and conditions of the Creative Commons Attribution (CC BY) license (http://creativecommons.org/licenses/by/4.0/).
Share and Cite
Nowicki, G.J.; Ślusarska, B.; Bartoszek, A.; Kocka, K.; Deluga, A.; Kachaniuk, H.; Łuczyk, M. Moderation and Mediation Analysis of the Relationship between Total Protein Concentration and the Risk of Depressive Disorders in Older Adults with Function Dependence in Home Care. Nutrients 2018, 10, 1374. https://doi.org/10.3390/nu10101374
Nowicki GJ, Ślusarska B, Bartoszek A, Kocka K, Deluga A, Kachaniuk H, Łuczyk M. Moderation and Mediation Analysis of the Relationship between Total Protein Concentration and the Risk of Depressive Disorders in Older Adults with Function Dependence in Home Care. Nutrients. 2018; 10(10):1374. https://doi.org/10.3390/nu10101374
Chicago/Turabian StyleNowicki, Grzegorz Józef, Barbara Ślusarska, Agnieszka Bartoszek, Katarzyna Kocka, Alina Deluga, Hanna Kachaniuk, and Marta Łuczyk. 2018. "Moderation and Mediation Analysis of the Relationship between Total Protein Concentration and the Risk of Depressive Disorders in Older Adults with Function Dependence in Home Care" Nutrients 10, no. 10: 1374. https://doi.org/10.3390/nu10101374