Large Variations in Declared Serving Sizes of Packaged Foods in Australia: A Need for Serving Size Standardisation?


Nutrition and Dietetics, School of Life and Environmental Sciences, Charles Perkins Centre, The University of Sydney, NSW 2006, Australia
*
Author to whom correspondence should be addressed.
Nutrients 2018, 10(2), 139; https://doi.org/10.3390/nu10020139
Submission received: 11 December 2017
/
Revised: 15 January 2018
/
Accepted: 25 January 2018
/
Published: 28 January 2018
Abstract
:Declared serving sizes on food packaging are unregulated in Australia, and variations in serving size within similar products reduces the usability of this information. This study aimed to (i) assess the variations in declared serving sizes of packaged foods from the Five Food Groups, and (ii) compare declared serving sizes to the Australian Dietary Guidelines standard serves and typical portion sizes consumed by Australian adults. Product information, including serving size, was collected for 4046 products from four major Australian retailers. Within product categories from the Five Food Groups, coefficients of variation ranged from 0% to 59% for declared serving size and 9% to 64% for energy per serving. Overall, 24% of all products displayed serving sizes similar (within ±10%) to the standard serves, and 23–28% were similar to typical portion sizes consumed by adults, for females and males, respectively. In conclusion, there is substantial variation in the declared serving sizes of packaged foods from the Five Food Groups, and serving sizes are not aligned with either the Dietary Guidelines or typical portion sizes consumed. Future research into effective means of standardising serving sizes is warranted.
1. Introduction
Nutrition information labelling on packaged food items is a valuable source of information that can assist consumers to engage in more informed food choices and consumption behaviours. In Australia, most packaged foods must adhere to nutrition labelling standards set out in the Australia New Zealand Food Standards Code [1], which are enforced by law. Nutrition information panels (NIPs) on food packaging are required to display the serving size and number of servings per package of the food item, as well as the energy (in kilojoules/kJ) and key nutrients, both ‘per serving’ and ‘per 100 g’ (or 100 mL for liquids) of the food [2]. Manufacturers have access to online tools to calculate the nutrition information of their products based on the types and amounts of ingredients included. The intended purpose of per serving nutrition information is to help consumers estimate the amounts of energy and nutrients that are being consumed, while nutrition information per 100 g/100 mL can be used to compare similar products [2].
A prerequisite for the efficacy of nutrition labelling is that consumers understand how to interpret and apply this information appropriately. However, evidence shows that the use of serving size and per serving nutrient information is poorly understood by consumers [3,4,5,6]. In Australia, this is likely due, in part, to a lack of regulation regarding declared serving sizes, as the quantity of food that constitutes a serving is determined by the food manufacturer [7]. While it is suggested that declared serving sizes “should reflect a realistic portion of the food that a person might normally consume on one eating occasion” [7] (i.e., a realistic portion size), there are no official guidelines specifying what a realistic portion of different foods may be. As such, declared serving sizes and energy per serving can vary considerably between similar products [2]. This makes it difficult for consumers to effectively monitor and/or regulate their intake, and has led to suggestions to standardise serving sizes within food categories [8,9], as occurs in the USA and Canada [10,11].
Another potential source of consumer confusion is the discrepancy between manufacturer-declared serving sizes and the standard serves for different foods [4,12,13], as defined in the Australian Dietary Guidelines (ADG) [14,15,16]. The standard serves form part of a guide to help individuals choose appropriate daily amounts of different types of foods for optimal health and wellbeing. Such discrepancies may therefore confuse consumers who are trying to follow official dietary recommendations [12].
Previous Australian studies have found large variations in declared serving sizes and energy per serving within discretionary and snack food categories [14,15,17]. However, there are currently limited data on serving size variation within product categories from the Five Food Groups. This study aimed to assess the variation in serving sizes and energy per serving across packaged food categories from the Five Food Groups. A second aim was to compare the manufacturer-declared serving sizes with the ADG standard serves, and with sex-specific typical portion sizes consumed by Australian adults, as estimated from the 2011–12 National Nutrition and Physical Activity Survey (NNPAS) [18].
2. Materials and Methods
Data were collected between March and September 2017 for packaged food items available in four major supermarkets (Woolworths, Coles, Aldi, and IGA) in Sydney, Australia. Collectively, these retailers represent 92% of the grocery market share in Australia [19]. Images were captured of the front, back, NIP, ingredients list, and barcode of each product, using Android smartphones (Motorola Moto G4 Play). Different package sizes of the same product were included as separate items, as the declared serving sizes can differ. Products without an NIP were not included. Product information, including declared serving size and energy (kJ) per 100 g/100 mL, were recorded in an online spreadsheet.
Data cleaning included removal of duplicate items and screening for outliers, which were verified using the associated product images. Items missing serving size information (n = 7) or with apparent labelling error (n = 11) were excluded from analyses. For items available in multi-unit packages of different sizes (e.g., 12-pack vs. 24-pack sliced cheese), only one was included in analyses, as declared serving sizes are the same.
Products were categorised largely according to the ADG classification of foods within the Five Food Groups [16], with further sub-groupings based on expected differences in serving size, energy density and/or other nutrient composition (e.g., full- vs. reduced-fat milk). A summary of product types included in each category is provided in Appendix A Table A1. For the purpose of this study, legumes were categorised under the vegetables food group [16]. Energy per serving was calculated for all products from declared serving size and energy per 100 g/100 mL. To assess the variations in serving size, descriptive statistics (mean, standard deviation (SD), median, interquartile range (IQR), and range) for declared serving size and energy per serving were generated for each product category. Coefficients of variation (CV) were calculated using SD divided by the mean, to obtain a standard measure of variation across categories.
Declared serving sizes were compared to the ADG standard serves by calculating the percentage difference between the median declared serving size of a category and the corresponding standard serve. A difference of >25% was considered to be substantial. As per the method used by Zheng et al. [18], percentage differences were calculated as follows:
The proportion of products within each category with a declared serving size >10% below, within ±10%, or >10% above the corresponding ADG standard serve were assessed, with ±10% being taken as an ‘ideal’ range of variation about the standard serve. In the same manner, declared serving sizes were compared to sex-specific typical (median) portion sizes of foods consumed by Australian adults [18]. Portion sizes for liquids (i.e., fruit juice, milks), given in grams, were converted to millilitres using density measures provided in the AUSNUT 2011–13 food measures file [20]. A list of the categories [18] used for portion size comparison are displayed in Appendix A Table A2.
Statistical analyses were performed using IBM SPSS Statistics Version 24 (IBM Corp., Armonk, NY, USA, 2016). Ethics approval was not required for this study.
3. Results
A total of 4046 products, in 39 categories, across the Five Food Groups, were included (Table 1). The CV for declared serving size ranged from 0% to 59% across product categories. Categories with the least variation (CV < 10%) were plain dairy and non-dairy milks, while those with the most variation (CV > 50%) were tofu and cottage-/ricotta-style cheeses. Within several categories, 10-fold (or greater) differences were observed between the smallest and largest serving sizes (e.g., crispbreads, canned vegetables, nuts and seeds, and some cheeses). Energy per serving was more variable than declared serving size, with CV ranging from 9% to 64%. The largest variations (CV > 50%) were observed for frozen vegetables, canned vegetables, other seafood, tofu, and cottage-/ricotta-style cheeses.
Table 2 shows the comparison between median declared serving sizes and the ADG standard serves, as well as typical (median) portion sizes consumed by Australian adults. Thirty-seven of the 39 categories analysed had corresponding ADG standard serves (dry porridge oats and meat substitutes excepted). The median declared serving sizes for children’s cereals, frozen fruit, nuts and seeds, and all milks were equivalent to the ADG standard serves. Conversely, 21 out of 37 categories had median serving sizes that were substantially different (>25% difference) to the standard serve. Differences between median declared serving sizes and typical portion sizes were examined for 28 comparable categories. Median serving sizes for 15 out of 28 categories were substantially different (>25% difference) to the typical portion size for one or both sexes. Seven out of 28 categories showed substantial differences for both sexes; these categories were all within the meat and dairy food groups.
Figure 1 displays the distribution of products within each product category according to the similarity of their declared serving size to the corresponding ADG standard serve. Seven out of 37 categories contained a majority (≥50%) of products with declared serving size similar to (i.e., within ±10% of) the ADG standard serve. Serving sizes for plain dairy and non-dairy milks were the most consistent with the standard serves. In contrast, 17 out of 37 categories contained very few products (≤10%) with a serving size similar to the standard serve. Overall, 24% (948/3898) of all products displayed a declared serving size similar to the corresponding ADG standard serve. In general, declared serving sizes of products within vegetable and grain (cereal) food categories were substantially greater than the ADG standard serves, while those within meat (canned fish, eggs, tofu, nut and seed pastes) and dairy categories (yoghurts and cheeses) were substantially less than the standard serves, and products within fruit categories were more variable.
Figure 2 displays the distribution of products within each category according to the similarity of their declared serving size to sex-specific typical (median) portion sizes consumed by Australian adults. Four out of 28 categories for males and three out of 28 categories for females contained a majority of products with a declared serving size similar to the typical portion size. In contrast, 13 out of 28 categories for males, and 14 out of 28 categories for females, contained very few products with serving sizes similar to the typical portion size. Overall, 23% (744/3247) of all products displayed a declared serving size similar to the corresponding typical portion size for females, and 28% (899/3247) for males. For females, declared serving sizes were generally greater than typical portion sizes, while for males this was more variable.
4. Discussion
In this analysis of over 4000 packaged food products from the Five Food Groups, substantial variation in declared serving sizes and energy per serving was observed. Within product categories, coefficients of variation ranged from 0% to 59% for declared serving size, and 9% to 64% for energy per serving. Ten-fold differences were observed between the smallest and largest serving sizes within some product categories. In general, larger variations in energy per serving were observed for categories with highly variable serving sizes. In addition, for many categories, declared serving sizes were substantially different to both the ADG standard serves and to typical portion sizes consumed. Only one quarter of all products analysed displayed a serving size similar (within ±10%) to the corresponding ADG standard serve or typical portion size.
These results are consistent with findings in other food categories (i.e., discretionary foods and snack foods) that observed large variations in declared serving sizes within categories, as well as discrepancies with the ADG standard serves [14,15,17]. Our results highlight the general discrepancies between all three sets of measures—declared serving sizes, ADG standard serves, and typical portion sizes—and suggest that in the absence of serving size regulation, manufacturer-declared serving sizes do not have a consistent basis for determination. Large variations in serving size between similar products confounds the usability of this information for all stakeholders, and particularly as a tool for consumers to monitor and/or regulate their dietary intake. In addition, the observed discrepancies between declared serving sizes and the ADG standard serves do not support consumers in efforts to follow dietary recommendations. Standardising declared serving sizes may be one way to help overcome some of these issues [14,15].
Our data shows that declared serving sizes often differs for similar products between brands, and sometimes within the same brand. Serving sizes were also inconsistent between different package sizes of the same item; this was evident for categories such as baked beans, canned fruit, yoghurts and cheeses. For some food categories, serving sizes were largely based on the weight of a discrete unit/s (e.g., two crispbreads, two slices of bread, or one bread roll) that differed across products and brands. For other categories, the variability in declared serving sizes may be partly derived from the way in which these items are consumed—for example, asparagus spears (20 g serving size) compared to canned tomatoes (100–200 g serving size) within the canned vegetables category. Whether different serving sizes are set by manufacturers with the intent of influencing consumer perceptions [21] or for more practical reasons (e.g., easy division within total package size) is unclear. However, it is clear that these variations are confusing for consumers, and should be addressed with appropriate changes to labelling regulation.
In this study, the smallest variations in serving sizes (CV < 10%) were observed for plain dairy and non-dairy milks. This is likely due to the presence of Australian industry agreed standardised serving sizes for beverages—that is, serving size equals total package size if total package size is ≤600 mL, and serving size is 250 mL if total package size is >600 mL [22]. As plain milks are predominantly sold in package sizes of 1 L or greater, declared serving sizes within these categories are largely consistent. On the other hand, flavoured milks and fruit juices are commonly sold in single-serving (≤600 mL) packages as well as larger packs, and therefore have greater variation in declared serving sizes. Aside from chocolate/sugar confectionery, for which the industry agreed standard is 25 g ± 5 g, standardised serving sizes have not been set for any other product categories at present [22].
In the USA and Canada, declared serving sizes are regulated to reflect typical portion sizes consumed [10,11]. However, as portion sizes vary widely, both between sexes and across individuals [18], using typical portion sizes as the basis for serving size regulation may not be helpful for a large proportion of the population who do not consume the typical portion size. Additionally, due to the high likelihood of inaccuracies in portion size estimation and/or intentional misreporting [23,24,25], self-reported portion size data may not provide a true reflection of portion sizes consumed. It has also been shown that many consumers interpret declared serving size as the recommended amount of food to consume at one time [5,26]. However, national health survey results indicate that typical portion sizes do not reflect dietary recommendations [27]. Australians consume excessive amounts of energy from discretionary foods, and have inadequate intake of foods from the Five Food Groups, such as vegetables, fruit, wholegrain cereals and dairy products [27,28]. This can lead to weight gain as well as inadequate intake of key micronutrients [28,29].
In the USA, recent updates to serving size regulations, intended to make serving sizes more reflective of current portion sizes [10], have resulted in an increase in the reference amounts (upon which serving sizes are regulated) for some foods, and a decrease for others. For instance, the reference amount for ice cream has increased from 1/2 cup to 2/3 cup, and for soda from 240 mL to 360 mL, while for yoghurt has decreased from 225 g to 170 g [10,30,31]. Although the effects of these changes on population consumption patterns are not yet clear [26,32], they highlight a potential problem with serving size regulation if portion sizes continue to diverge from dietary recommendations. Given the current focus on promoting improved food choices and appropriate portion sizes, it appears counterintuitive to base serving size regulations on the same component that public health efforts are attempting to address.
An alternative option could be to regulate serving sizes based on the ADG standard serves. Standardising serving sizes according to the dietary guidelines may assist consumers in understanding how their intake aligns with dietary recommendations, and improve consistency and clarity within nutrition education tools. This may help to challenge distorted consumption norms [4,33], and moderate the portion-size effect, where larger portions or packages have been shown to promote increased consumption [34,35]. It is important to note that the ADG standard serves are not intended as a guide for recommendeding portion sizes [36]. For instance, grain/cereal foods are commonly consumed in portions larger than the ADG standard serve [18]. This is acceptable in the context of an overall intake that aligns with the recommended daily number of serves from each food group [16]. However, reviewing the ADG standard serves to reflect more appropriate and realistic amounts of foods could further improve the usability of nutrition labelling.
Effective standardisation of declared serving sizes may also provide other benefits, such as improving the accuracy of front-of-pack labelling initiatives based on per serving nutrient information [14]. It would also reduce the potential for manufacturer manipulation of serving sizes [21]. For instance, declaring a smaller serving size results in a lower energy per serving, thus consumers may perceive the food as healthier and consume more [37,38].
While there are clear advantages to standardising serving sizes, there are several challenges to creating such a system. For example, standard serves would need to be developed for all food categories, and an acceptable range of variation in serving size would need to be defined. Nonetheless, improved regulations for declared serving sizes should be seen as an integral aspect of public health strategies to improve population nutrition knowledge and consumption behaviours. Further research should be undertaken to better characterise consumer understanding and use of serving size and per serving nutrient information [9]. Any changes to food labelling policy will need to be accompanied by education campaigns to ensure that consumers understand how to interpret and utilise this information correctly and effectively.
To our knowledge, this study is the first to investigate serving size variations in a wide range of packaged foods from the Five Food Groups in Australia. Data for over 4000 products were collected from the major Australian retailers, providing a good representation of the number and range of products available to consumers within the assessed categories. A limitation was that many foods from the Five Food Groups (predominantly vegetables, fruit, and meats) are unpackaged and/or do not display nutrition information; therefore, these food groups are under-represented in the data. Our data reflect the Australian grocery market; thus, results may not be generalisable to other countries.
5. Conclusions
The present study demonstrated substantial variation in manufacturer-declared serving sizes of packaged foods from the Five Food Groups in Australia, as well as discrepancies with the ADG standard serves and typical portion sizes consumed. Standardising declared serving sizes may improve the usability of nutrition information on packaged foods. Standardisation based on the dietary guidelines may assist consumers in following dietary recommendations and improve portion size selections. Any changes to labelling regulation should be accompanied by consumer education campaigns to ensure correct understanding and effective use of the information. Future research is needed to determine how best to proceed with addressing the inconsistencies in declared serving sizes and resulting consumer confusion.
Acknowledgments
The authors would like to thank Wing Gi Amanda Liu, Eaden Rountree, Irene Sangadi, Stephanie Liang, Ho Chun Terence Tong, Dong Hun Kim, and Melissa Meier, who were involved in data collection and data cleaning. This study received no funding from any source.
Author Contributions
All authors jointly conceived and designed the study; S.Y. collected and analysed the data and wrote the first draft; all authors provided critical review and commentary on the draft manuscript, and approved the final manuscript.
Conflicts of Interest
The authors declare no conflict of interest.
Appendix A

Table A1.
Summary of product types included and/or excluded in each product category analysed.
| Product Categories | Product Types Included/Excluded |
|---|---|
| Frozen vegetables | Includes all plain and lightly seasoned frozen vegetables, including minted peas. Excludes frozen potato products, vegetables with grains, vegetable bake (e.g., cauliflower, broccoli), vegetables with cheese sauce. |
| Canned vegetables | Includes all varieties of canned vegetables—added or no added salt/sugar, canned tomatoes, pickled beetroot, and dried vegetables with nutrition information given for rehydrated product. |
| Canned legumes | All varieties of canned legumes, both salted and unsalted. Examples include chickpeas, lentils, cannellini beans, kidney beans, black beans, butter beans, four bean mix. |
| Baked beans | All varieties of canned baked beans—in tomato, cheesy tomato, ham, BBQ, or other flavoured sauce; baked beans and bacon, baked beans and sausages. |
| Frozen fruit | Includes all frozen whole, diced, pureed frozen fruit, and smoothie mixes, e.g., frozen berries, mango, pineapple, banana, mixed fruit, acai puree, tropical smoothie mix. |
| Canned fruit | All varieties of canned fruit—in juice or syrup; whole, halved, sliced, diced/pieces, crushed, pulp, puree. Also includes fruit cups in juice or syrup base. Excludes fruit in jelly, fruit and custard. |
| Fruit juice | Includes all no-added-sugar fruit juices, 100% sparkling fruit juice, juice-based fruit smoothies, fruit and vegetable juice blends with majority (≥50%) fruit juice. Includes both chilled and shelf stable juices—bottled, Tetra Pak, pop-top etc. Excludes vegetable juices, coconut water, fruit and vegetable juice blends with majority (>50%) vegetable juice. |
| Dried fruit | Includes all regular dried fruit, sweetened dried fruit (e.g., cranberries, mango, pineapple), glacé cherries, banana chips. Excludes freeze-dried fruit/fruit crisps, trail mix, chocolate-/yoghurt-coated dried fruit, mixed peel. |
| Bread, loaf-style | All white, wholemeal, multi-grain, rye, and gluten free bread loaves—including regular sliced and unsliced bread, sourdough, fruit bread, sandwich thins, pumpernickel, Turkish bread, baguette, French stick. Excludes brioche bread. |
| Bread rolls | All white, wholemeal, multi-grain, rye, and gluten free bread rolls—including regular dinner rolls, burger buns, hot-dog buns, damper rolls, Turkish bread rolls, bagels. |
| Wraps & flat-breads | Includes wraps, flat-breads (pita bread, Lebanese bread), tortillas, naan, roti, chappati. Excludes pizza bases, pappadums. |
| Breakfast cereal, ready to eat (excluding children’s cereals and muesli/granola) | Includes cereal flakes and other extruded cereals, puffed cereals, mixed flakes and clusters, bran sticks, Weet-Bix, and any of the aforementioned with added nuts/seeds/fruit. Excludes plain wheat/oat bran, wheat germ, breakfast biscuits, e.g., Belvita, Weet-Bix Go. |
| Breakfast cereal, children’s | Breakfast cereals marketed at children; indicated by packaging displaying cartoon/fantasy characters or brand mascots, statements referring to, e.g., “kids” or “children”, referral to childhood themes, e.g., sports, and/or use of language aimed at children. |
| Muesli/granola | Includes products labelled as “muesli” or “granola”, and cereal clusters without added flakes. Muesli includes natural, toasted, and Bircher varieties. |
| Porridge oats (dry) | Includes products labelled as “porridge” or “oatmeal”, products displaying porridge images or with preparation directions on packaging, dry oats (rolled oats, quick oats, steel cut oats) and quick oat sachets—both unflavoured and flavoured varieties. Excludes ready-to-eat porridge, porridge oats with nutrition information given only for prepared product. |
| Crispbreads | Includes all crispbreads, wholemeal or wholegrain wheat/rye/rice crackers (e.g., Vita-Weat and similar products, brown rice crackers), water crackers, wafer crackers, plain lavosh, plain rice/corn cakes, Ryvita cracker bread, SAO crackers, melba toast. Excludes plain refined snack crackers (e.g., Ritz, Jatz), grissini/breadsticks, pastry twists, pita/bagel crisps, cheese or other flavoured biscuits, crackers, rice/corn cakes, lavosh. |
| Fish, raw | Includes all fresh and frozen (uncooked) fish—plain, marinated, or with sauce/dressing. Excludes battered/crumbed fish, and fish products, e.g., fish patties/cakes, fish balls, fish paste, dried salted fish, and roe/caviar. |
| Fish, smoked/cured | Includes all chilled hot- and cold-smoked, ‘wood roasted’, salt-cured, and pickled fish—primarily salmon, trout and herring. |
| Other seafood | Includes all fresh, frozen, and ready-to-eat seafood—plain, marinated, with sauce/dressing. Excludes battered/crumbed seafood, and seafood products, e.g., surimi, shrimp paste, seafood salad. |
| Canned fish/seafood | Includes all canned fish and seafood—in water, brine, oil, sauce; both unflavoured and flavoured, e.g., tuna, salmon, anchovies, mackerel, sardines, mussels, oysters. Excludes ‘snack packs’ of canned fish with crackers, fish ready meals, i.e., with rice/beans. |
| Eggs | All whole chicken, duck, or quail eggs—raw, cooked/boiled, preserved, salted. |
| Tofu | All tofu and tempeh—firm, soft, silken, fried, smoked, and flavoured/marinated varieties |
| Meat substitutes | All chilled, frozen, and canned meat alternative or substitute products. Examples include vegetarian patties and burger patties, mince, nuggets, meat-free strips/pieces, fillets, schnitzel, ‘fish’ fingers, sausages, hot dogs, veggie ‘roast’, deli slices, bacon, falafels and other vegetable bites. |
| Nuts & seeds | Includes all raw, blanched, dry-roasted, oil-roasted, unsalted, salted, smoked, seasoned/flavoured nuts and seeds—whole, halves, pieces, flaked, slivered, ground (e.g., almond meal). Includes LSA, mixed nuts and/or seeds. Excludes coconut products, trail mix, snack mixes containing nuts/seeds, coated nuts (e.g., sugar-coated, chocolate-coated, deli-style crispy coated nuts). |
| Nut & seed butters/pastes | All spreads/pastes consisting of a majority of ground nuts/seeds, e.g., peanut, almond, cashew, brazil nut, sesame seed (tahini). Includes all varieties—smooth, crunchy, unsalted, salted, unsweetened, sweetened, with added oil, flavoured (e.g., chocolate, honey, cinnamon), added grains. Excludes nut/seed spreads consisting of <50% nuts/seeds. |
| Dairy milk—regular fat | Includes all full cream fresh, UHT, and powdered dairy milks*. ‘Dairy’ includes cow, goat, and sheep milks. Includes lactose-free varieties. * Excludes powdered milk products for which serving size and nutrition information are given only for dry powder. Note: all products included contained >3% fat. |
| Dairy milk—reduced fat | Includes all reduced-fat, semi-skim, skim, ‘lite’/light, and no-fat fresh, UHT, and powdered dairy milks* and buttermilk. ‘Dairy’ includes cow, goat, and sheep milks. Includes lactose-free varieties. * Excludes powdered milk products for which serving size and nutrition information are given only for dry powder. Note: all included products contained ≤2% fat. |
| Non-dairy milk | All plain (unflavoured) alternative/non-dairy milks with at least 100 mg/100 mL of added calcium [16]. Varieties include soy, rice, oat, almond, coconut. Includes all regular fat, reduced fat, unsweetened and sweetened varieties. |
| Flavoured milk | Includes dairy and non-dairy flavoured milks, milkshakes, milk-based iced coffee and smoothies, and other milk-based drinks with at least 100 mg/100 mL of calcium (labelled). Includes lactose-free varieties. |
| Yoghurt—plain, regular fat | Includes all plain/natural, unsweetened yoghurts with ≥2.5% fat. Includes soy yoghurt with added calcium. |
| Yoghurt—plain, low-fat | As above, but varieties with <2.5% fat. |
| Yoghurt—flavoured, regular fat | Includes all flavoured and fruit yoghurts with ≥2.5% fat. Includes soy yoghurt with added calcium. Excludes yoghurt with added grains, oats, muesli, nuts, seeds, biscuit pieces, etc., and non-dairy yoghurts without added calcium. |
| Yoghurt—flavoured, low-fat | As above, but varieties with <2.5% fat. |
| Yoghurt, children’s | Yoghurt marketed at children; indicated by packaging displaying cartoon/fantasy characters or brand mascots, statements referring to, e.g., “kids”, “children”, “lunch boxes”, referral to childhood themes, e.g., sports, and/or use of language aimed at children. |
| Cheese—hard, regular fat | Varieties include Parmesan, Grana Padano, Cheddar (mild, tasty, sharp), Edam, Babybel, Colby, Swiss, Emmental, Jarlsberg, Maasdam, manchego, provolone, Gruyere, Gouda, Red Leicester, processed cheese (slices, sticks, string cheese). Includes both plain and flavoured varieties. Includes soy-based cheeses with added calcium, and pizza blends with >50% cheddar cheese. Excludes non-dairy cheese without added calcium. |
| Cheese—hard, reduced fat | As above, but labelled as ‘light’/‘lite’, ‘reduced fat’, or otherwise indicating reduced fat content. |
| Cheese—semi-soft, ripened | Varieties include brie, camembert, Havarti, blue cheese (including Gorgonzola, Stilton)—both plain and flavoured varieties. |
| Cheese—fresh, cottage/ricotta | Includes cottage cheese, ricotta, and quark—both regular fat and reduced fat, plain and flavoured varieties. |
| Cheese—fresh, other | Other fresh unripened cheeses. Varieties include cream cheese, mascarpone, spreadable cheese, feta (fetta), soft goat and sheep cheeses, mozzarella, bocconcini, burrata, halloumi—both regular fat and reduced fat, plain and flavoured. Includes fruit and nut cream cheeses, soy-based cheeses with added calcium, pizza blends consisting of >50% mozzarella cheese. Excludes crumbed cheese, and non-dairy cheese without added calcium. |
Table A2.
Product categories analysed and names of corresponding categories [18] used for comparisons to typical portion sizes consumed by Australian adults.
Table A2.
Product categories analysed and names of corresponding categories [18] used for comparisons to typical portion sizes consumed by Australian adults.
| Product Categories | Corresponding Categories |
|---|---|
| Frozen vegetables | Mixed vegetables, nonleafy |
| Canned vegetables | Mixed vegetables, nonleafy |
| Canned legumes | Cooked legumes and pulses |
| Baked beans | Baked beans, canned |
| Fruit juice | Fruit juices |
| Dried fruit | Sultanas/Raisins |
| Bread, loaf-style | Bread, white |
| Bread rolls | Rolls, white |
| Wraps & flat-breads | Flat-breads |
| Breakfast cereal, ready to eat | Breakfast cereal, ready to eat |
| Muesli/granola | Breakfast cereal, muesli, untoasted |
| Other seafood | Other seafood, cooked |
| Canned fish/seafood | Fish and seafood, canned |
| Eggs | Eggs, whole |
| Tofu | Meat alternatives (tofu) |
| Nuts & seeds | Nuts, whole |
| Nut & seed butters/pastes | Peanut butter |
| Dairy milk—regular fat | Milk—full fat |
| Dairy milk—reduced fat | Milk—reduced fat |
| Non-dairy milk | Milk substitutes |
| Flavoured milk | Flavoured milk |
| Yoghurt—plain, regular fat | Yoghurt—plain |
| Yoghurt—flavoured, regular fat | Yoghurt—flavoured, full fat |
| Yoghurt—flavoured, low-fat | Yoghurt—flavoured, reduced fat |
| Cheese—hard, regular fat | Cheese, cheddar-type, full fat |
| Cheese—hard, reduced fat | Cheese, cheddar-type, reduced fat |
| Cheese—semi-soft, ripened | Cheese, brie or camembert |
| Cheese—fresh, cottage/ricotta | Cheese, cottage or ricotta |
References
- Federal Registrar of Legislation. Australia New Zealand Food Standards Code—Standard 1.2.8—Nutrition Information Requirements. Available online: https://www.legislation.gov.au/Details/F2017C00311 (accessed on 10 August 2017).
- Food Standards Australia New Zealand. Nutrition Information Panels. Available online: http://www.foodstandards.gov.au/consumer/labelling/panels/Pages/default.aspx (accessed on 10 August 2017).
- Campos, S.; Doxey, J.; Hammond, D. Nutrition labels on pre-packaged foods: A systematic review. Public Health Nutr. 2011, 14, 1496–1506. [Google Scholar] [CrossRef] [PubMed]
- Faulkner, G.P.; Pourshahidi, L.K.; Wallace, J.M.; Kerr, M.A.; McCrorie, T.A.; Livingstone, M.B. Serving size guidance for consumers: Is it effective? Proc. Nutr. Soc. 2012, 71, 610–621. [Google Scholar] [CrossRef] [PubMed]
- Zhang, Y.; Kantor, M.A.; Juan, W. Usage and understanding of serving size information on food labels in the United States. Am. J. Health Promot. 2016, 30, 181–187. [Google Scholar] [CrossRef] [PubMed]
- Vanderlee, L.; Goodman, S.; Yang, W.S.; Hammond, D. Consumer understanding of calorie amounts and serving size: Implications for nutritional labelling. Can. J. Public Health 2012, 103, e327–e331. [Google Scholar] [PubMed]
- Food Standards Australia New Zealand. Nutrition Information: User Guide to Standard 1.2.8—Nutrition Information Requirements; FSANZ: Canberra, Australia, 2013; p. 16. Available online: https://www.foodstandards.gov.au/code/userguide/Documents/Userguide_Prescribed%20Nutrition%20Information%20Nov%2013%20Dec%202013.pdf (accessed on 11 August 2017).
- Dietitians Association of Australia. DAA Submission: Labelling Review Recommendation 17; DAA: Deakin, ACT, Australia, 2015; Available online: https://daa.asn.au/wp-content/uploads/2017/01/Labelling-Review-Recommendation-17.pdf (accessed on 29 November 2017).
- Public Health Association Australia. Submission to Consultation Paper—Labelling Review Recommendation 17: Per Serving Declarations in the Nutrition Information Panel; PHAA: Deakin, ACT, Australia, 2015; Available online: https://www.phaa.net.au/documents/item/372 (accessed on 23 October 2017).
- U.S. Food & Drug Administration. Changes to the Nutrition Facts Label. Available online: https://www.fda.gov/Food/GuidanceRegulation/GuidanceDocumentsRegulatoryInformation/LabelingNutrition/ucm385663.htm (accessed on 23 October 2017).
- Health Canada. Food Labelling Changes. Available online: https://www.canada.ca/en/health-canada/services/food-labelling-changes.html (accessed on 23 October 2017).
- Hunter, B.T. Serving size confusion. Consum. Res. Mag. 2002, 85, 8–9. [Google Scholar]
- Young, L.R.; Nestle, M. The contribution of expanding portion sizes to the US obesity epidemic. Am. J. Public Health 2002, 92, 246–249. [Google Scholar] [CrossRef] [PubMed]
- Haskelberg, H.; Neal, B.; Dunford, E.; Flood, V.; Rangan, A.; Thomas, B.; Cleanthous, X.; Trevena, H.; Zheng, J.M.; Louie, J.C.Y.; et al. High variation in manufacturer-declared serving size of packaged discretionary foods in Australia. Br. J. Nutr. 2016, 115, 1810–1818. [Google Scholar] [CrossRef] [PubMed]
- Watson, W.L.; Kury, A.; Wellard, L.; Hughes, C.; Dunford, E.; Chapman, K. Variations in serving sizes of Australian snack foods and confectionery. Appetite 2016, 96, 32–37. [Google Scholar] [CrossRef] [PubMed]
- National Health and Medical Research Council. Australian Dietary Guidelines—Summary; NHMRC: Canberra, Australia, 2013; pp. 15–25. Available online: https://www.nhmrc.gov.au/_files_nhmrc/file/your_health/healthy/nutrition/n55a_australian_dietary_guidelines_summary_131014_1.pdf (accessed on 11 August 2017).
- George Institute. Examination of Serving Sizes of Selected Food Products in Australia; The George Institute: Newtown, NSW, Australia, 2011; Available online: https://www.choice.com.au/~/media/360a0cc22dcd47bc9e85b81382fcdae8.ashx?la=en (accessed on 20 October 2017).
- Zheng, M.; Wu, J.H.Y.; Louie, J.C.Y.; Flood, V.M.; Gill, T.; Thomas, B.; Cleanthous, X.; Neal, B.; Rangan, A. Typical food portion sizes consumed by Australian adults: Results from the 2011–2012 Australian National Nutrition and Physical Activity Survey. Sci. Rep. 2016, 6, 19596. [Google Scholar] [CrossRef] [PubMed] [Green Version]
- Roy Morgan Research. Supermarket weep: Woolies’ Share Continues to Fall and Coles and Aldi Split the Proceeds. Available online: http://www.roymorgan.com/findings/7021-woolworths-coles-aldi-iga-supermarket-market-shares-australia-september-2016--201610241542 (accessed on 11 August 2017).
- Food Standards Australia New Zealand. AUSNUT 2011–2013 Food Measures Database; FSANZ: Canberra, Australia, 2015. Available online: http://www.foodstandards.gov.au/science/monitoringnutrients/ausnut/ausnutdatafiles/Pages/foodmeasures.aspx (accessed on 10 October 2017).
- Chan, J.Y.M.; Scourboutakos, M.J.; L’Abbé, M.R. Unregulated serving sizes on the Canadian nutrition facts table—An invitation for manufacturer manipulations. BMC Public Health 2017, 17, 418. [Google Scholar] [CrossRef] [PubMed]
- Australian Government Department of Health. Health Star Rating System Style Guide; Commonwealth of Australia: Canberra, ACT, Australia, 2016. Available online: http://healthstarrating.gov.au/internet/healthstarrating/publishing.nsf/Content/style-guide (accessed on 28 November 2017).
- Howat, P.M.; Mohan, R.; Champagne, C.; Monlezun, C.; Wozniak, P.; Bray, G.A. Validity and reliability of reported dietary intake data. J. Am. Diet. Assoc. 1994, 94, 169–173. [Google Scholar] [CrossRef]
- Hernández, T.; Wilder, L.; Kuehn, D.; Rubotzky, K.; Moser-Veillon, P.; Godwin, S.; Thompson, C.; Wang, C. Portion size estimation and expectation of accuracy. J. Food Compos. Anal. 2006, 19, S14–S21. [Google Scholar] [CrossRef]
- Macdiarmid, J.; Blundell, J. Assessing dietary intake: Who, what and why of under-reporting. Nutr. Res. Rev. 1998, 11, 231–253. [Google Scholar] [CrossRef] [PubMed]
- Dallas, S.K.; Liu, P.J.; Ubel, P.A. Potential problems with increasing serving sizes on the Nutrition Facts label. Appetite 2015, 95, 577–584. [Google Scholar] [CrossRef] [PubMed]
- Australian Bureau of Statistics. 4364.0.55.007—Australian Health Survey: Nutrition First Results—Foods and Nutrients, 2011–2012: Key Findings. Available online: http://www.abs.gov.au/ausstats/[email protected]/Lookup/by%20Subject/4364.0.55.007~2011-12~Main%20Features~Key%20Findings~1 (accessed on 27 October 2017).
- Rangan, A.M.; Schindeler, S.; Hector, D.J.; Gill, T.P.; Webb, K.L. Consumption of ‘extra’ foods by Australian adults: Types, quantities and contribution to energy and nutrient intakes. Eur. J. Clin. Nutr. 2009, 63, 865–871. [Google Scholar] [CrossRef] [PubMed]
- Australian Bureau of Statistics. 4364.0.55.008—Australian Health Survey: Usual Nutrient Intakes, 2011–2012: Key Findings. Available online: http://www.abs.gov.au/ausstats/[email protected]/Lookup/by%20Subject/4364.0.55.008~2011-12~Main%20Features~Key%20findings~100 (accessed on 24 October 2017).
- Food and Drug Administration. CFR Title 21—§101.12: Reference Amounts Customarily Consumed Per Eating Occasion; GPO: Washington DC, USA, 2013. Available online: https://www.gpo.gov/fdsys/pkg/CFR-2013-title21-vol2/pdf/CFR-2013-title21-vol2-sec101-12.pdf (accessed on 27 October 2017).
- U.S. Government Publishing Office. Electronic Code of Federal Regulations—Title 21: Food and Drugs—Part 101—Food Labeling—§101.12: Reference Amounts Customarily Consumed Per Eating Occasion. Available online: https://www.ecfr.gov/cgi-bin/retrieveECFR?gp=1&SID=4bf49f997b04dcacdfbd637db9aa5839&ty=HTML&h=L&mc=true&n=pt21.2.101&r=PART#se21.2.101_112 (accessed on 27 October 2017).
- Hydock, C.; Wilson, A.; Easwar, K. The effects of increased serving sizes on consumption. Appetite 2016, 101, 71–79. [Google Scholar] [CrossRef] [PubMed]
- Wansink, B.; van Ittersum, K. Portion Size Me: Downsizing our consumption norms. J. Am. Diet. Assoc. 2007, 107, 1103–1106. [Google Scholar] [CrossRef] [PubMed]
- English, L.; Lasschuijt, M.; Keller, K.L. Mechanisms of the portion size effect. What is known and where do we go from here? Appetite 2015, 88, 39–49. [Google Scholar] [CrossRef] [PubMed]
- Spanos, S.; Kenda, A.S.; Vartanian, L.R. Can serving-size labels reduce the portion-size effect? A pilot study. Eat. Behav. 2015, 16, 40–42. [Google Scholar] [CrossRef] [PubMed]
- Eat For Health. What Is a Serve? Available online: https://www.eatforhealth.gov.au/food-essentials/how-much-do-we-need-each-day/what-serve (accessed on 26 October 2017).
- Mohr, G.S.; Lichtenstein, D.R.; Janiszewski, J. The effect of marketer-suggested serving sizes on consumer responses: The unintended consequences of consumer attention to calorie information. J. Mark. 2012, 76, 59–75. [Google Scholar] [CrossRef]
- Cleanthous, X.; Mackintosh, A.; Anderson, S. Comparison of reported nutrients and serve size between private label products and branded products in Australian supermarkets. Nutr. Diet. 2011, 68, 120–126. [Google Scholar] [CrossRef]
Figure 1.
Distribution of products within each food category from the Five Food Groups according to the similarity of their declared serving size to the corresponding Australian Dietary Guidelines (ADG) standard serve. Note: the category ‘Breakfast cereal, ready to eat’ excludes children’s cereals and muesli/granola.
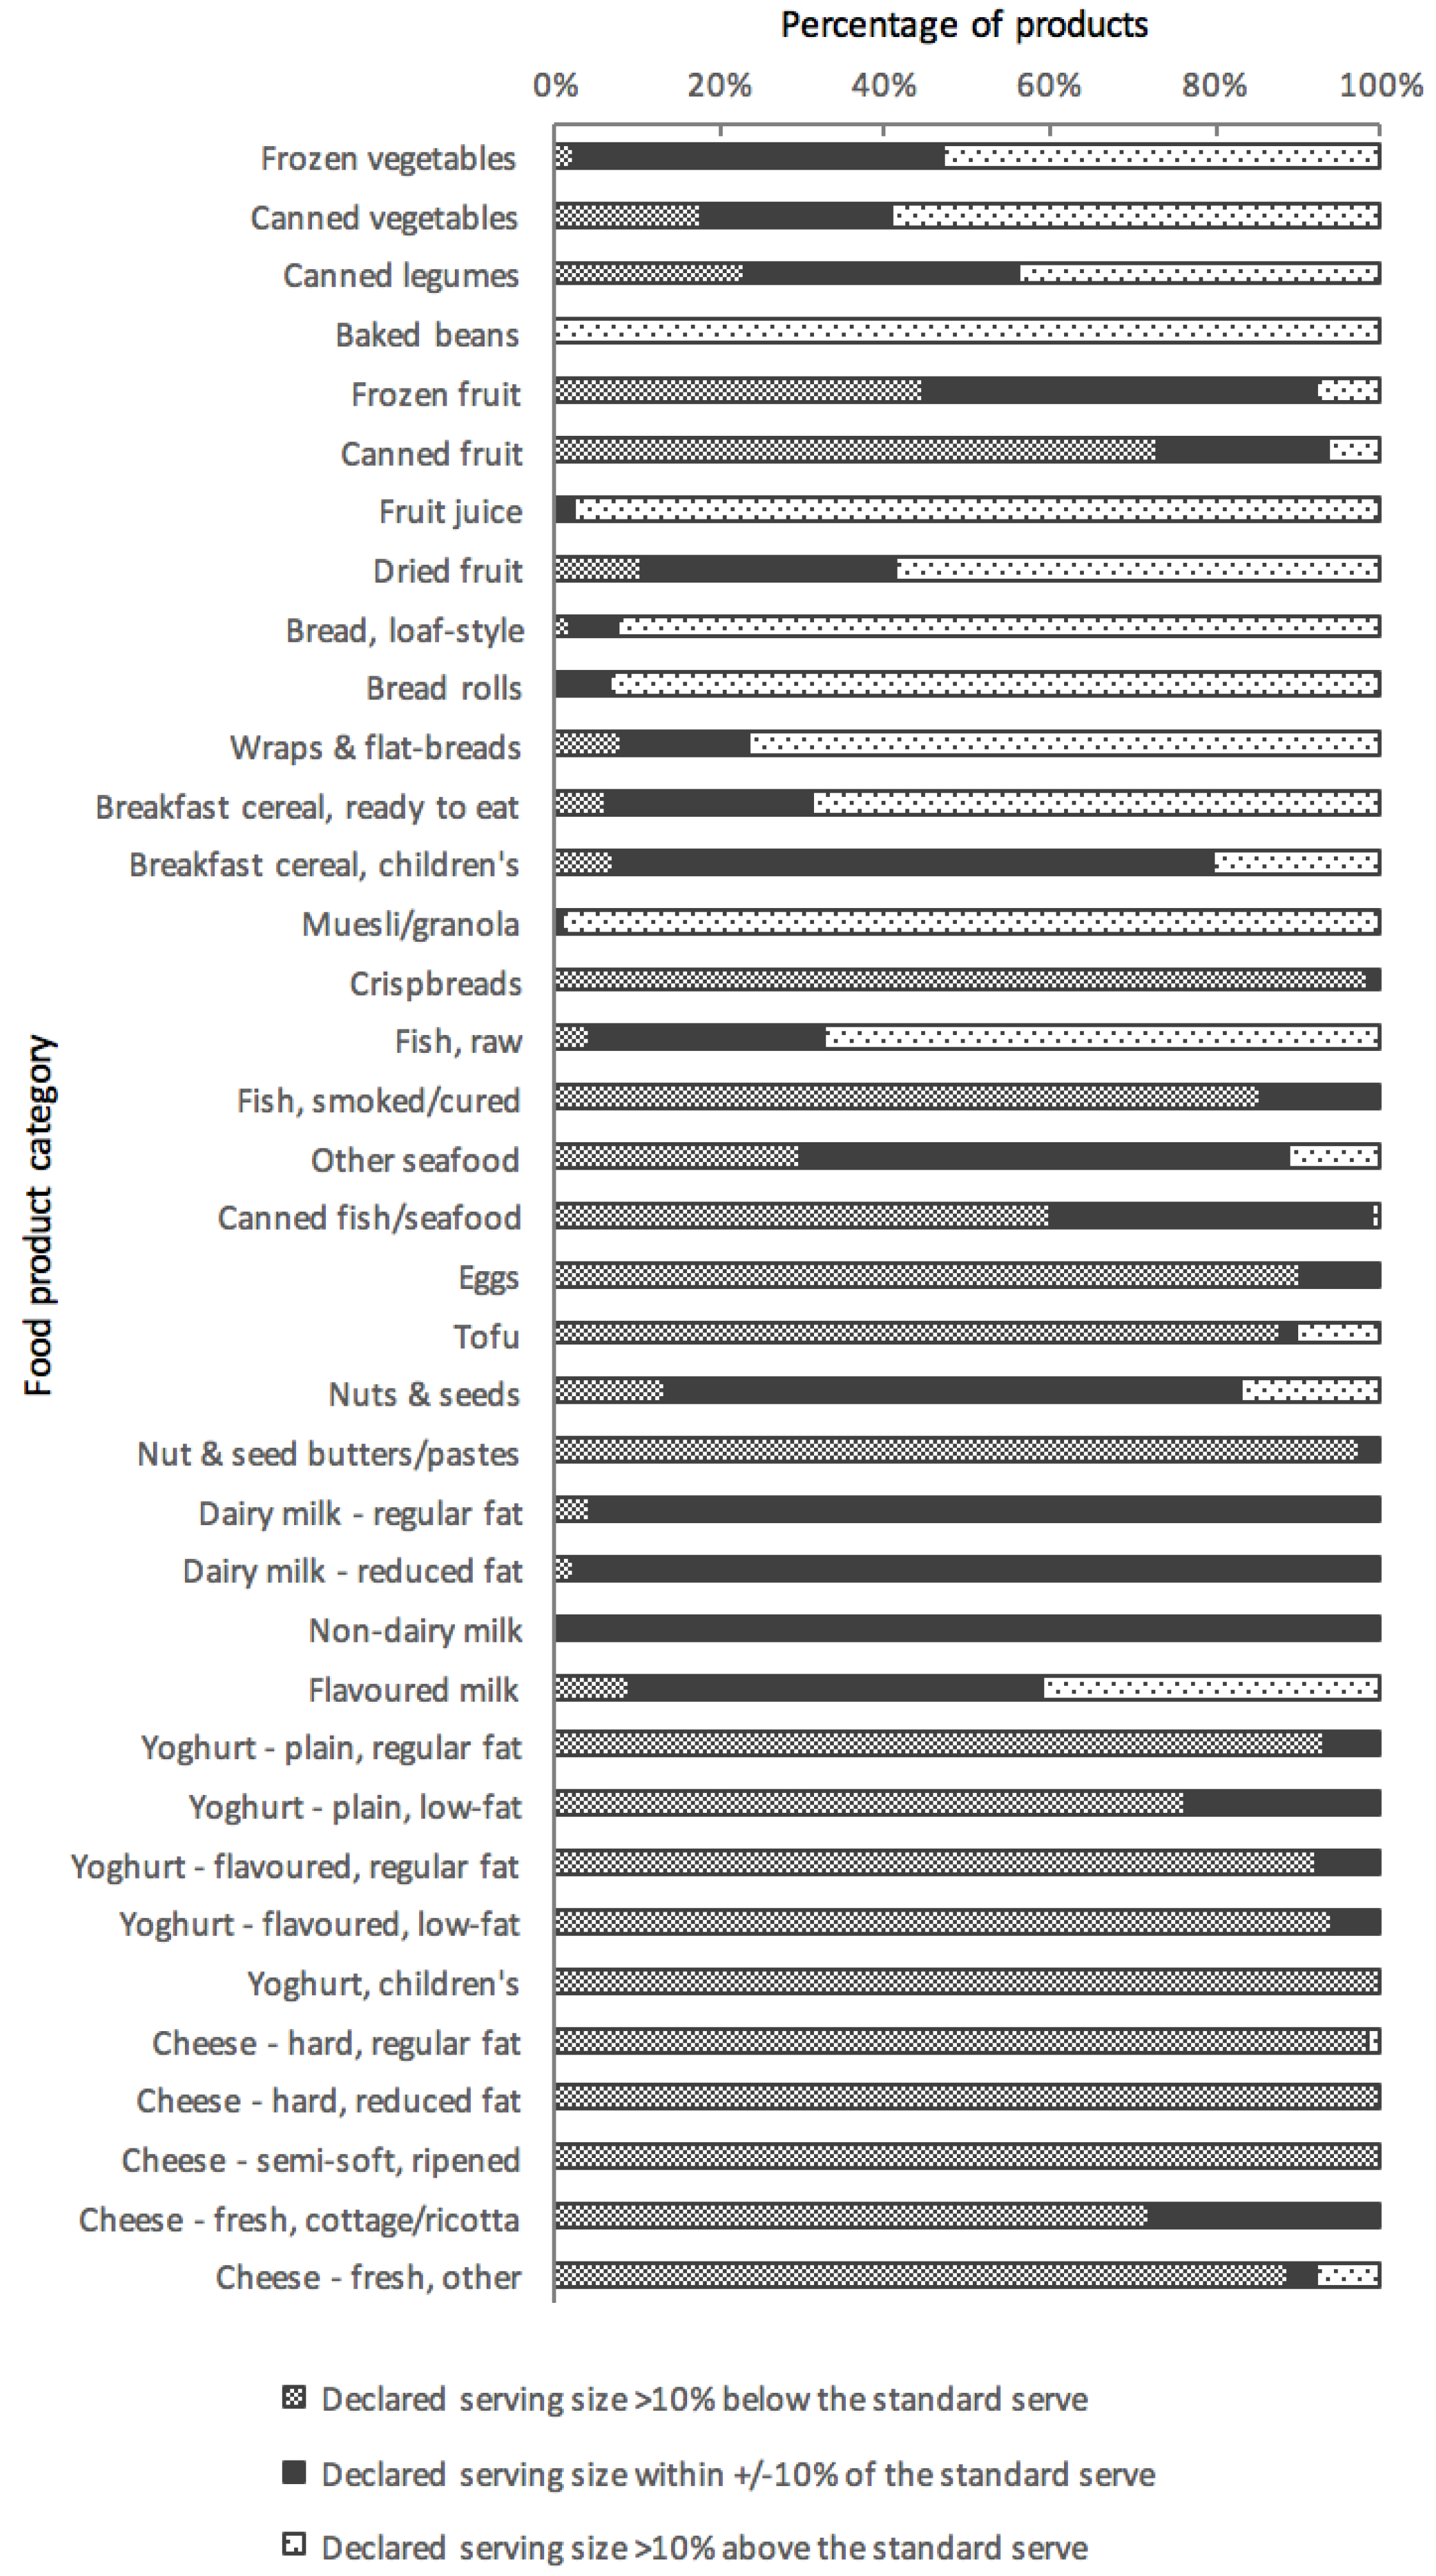
Figure 2.
Distribution of products within each food category according to the similarity of their declared serving size to the corresponding typical (median) portion size consumed by Australian adults, for males (A) and females (B). Note: the category ‘Breakfast cereal, ready to eat’ excludes children’s cereals and muesli/granola.
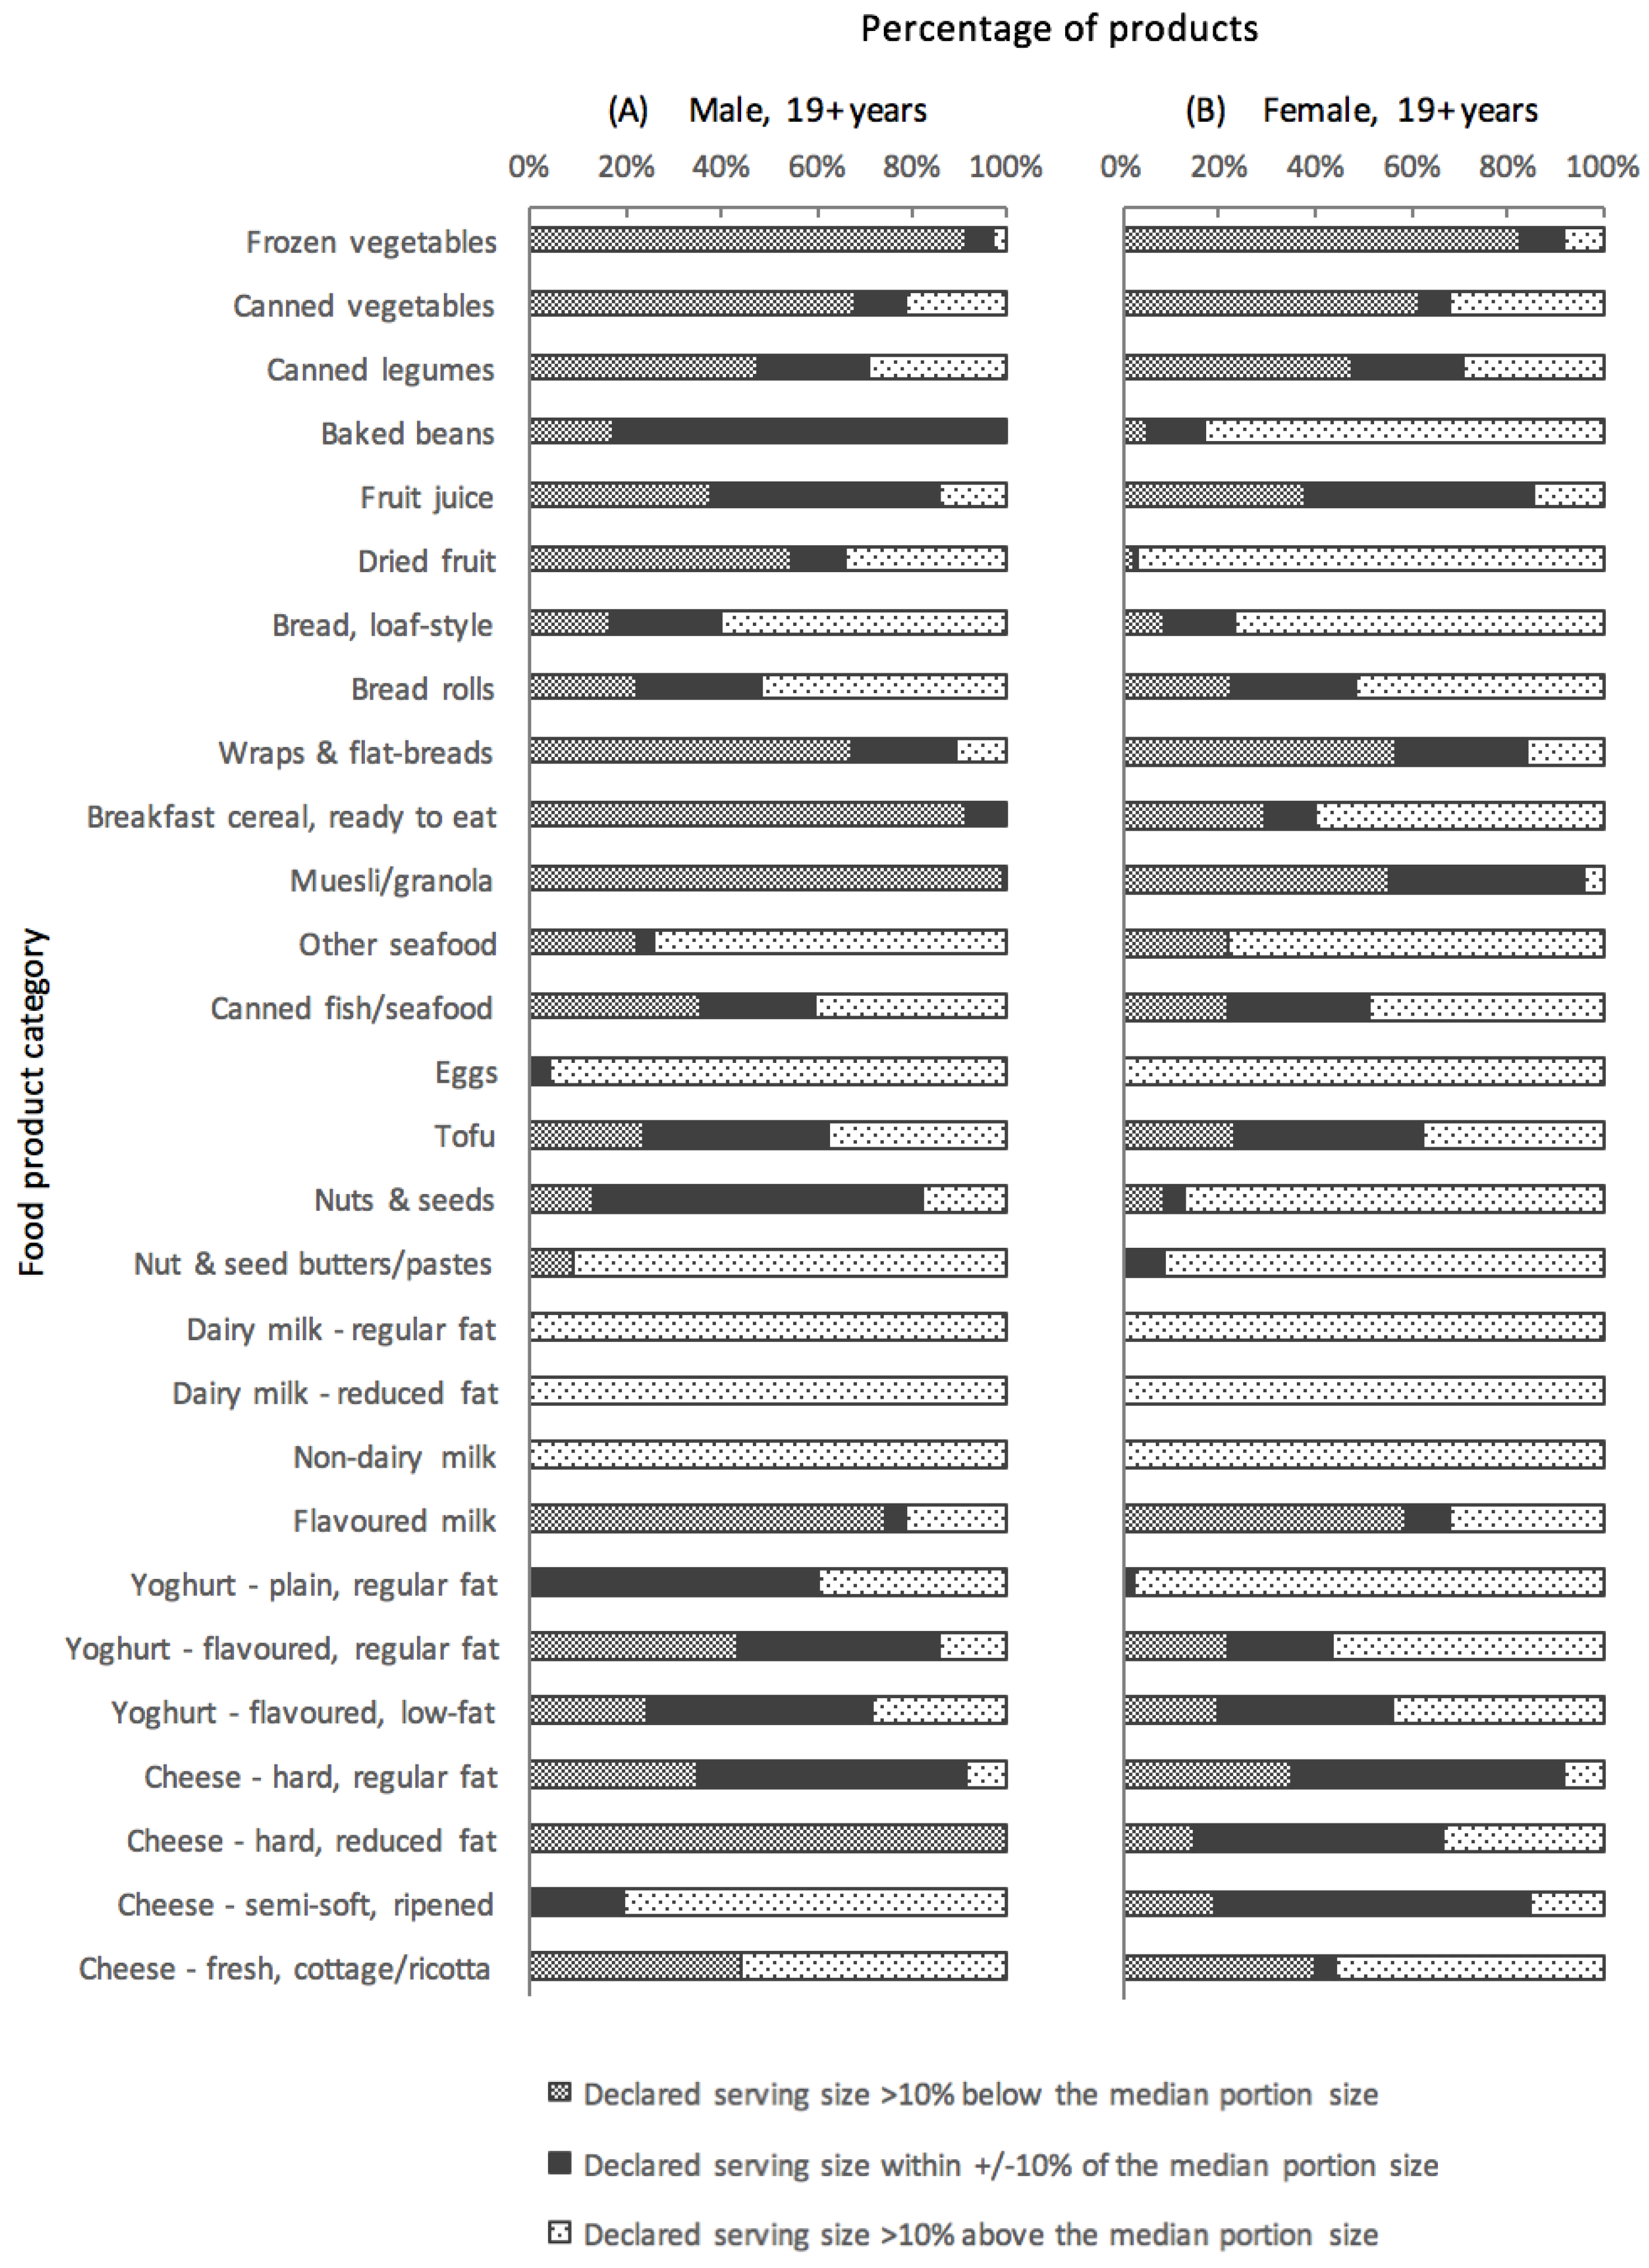
Table 1.
Descriptive statistics for manufacturer-declared serving sizes and energy per serving for 4046 packaged food products identified from four major Australian supermarkets, in 39 categories, across the Five Food Groups.
Table 1.
Descriptive statistics for manufacturer-declared serving sizes and energy per serving for 4046 packaged food products identified from four major Australian supermarkets, in 39 categories, across the Five Food Groups.
| Product Categories | n | Declared Serving Size | Energy (kJ) Per Serving | ||||
|---|---|---|---|---|---|---|---|
| Median (IQR) 1 | Range 1 | CV (%) | Median (IQR) 1 | Range 1 | CV (%) | ||
| Vegetables | |||||||
| Frozen vegetables | 138 | 100 (75, 100) | 40–200 | 30 | 176 (117, 247) | 47–930 | 63 |
| Canned vegetables | 158 | 100 (75, 135) | 20–200 | 47 | 178 (122, 218) | 22–642 | 53 |
| Canned legumes | 48 | 80 (75, 100) | 60–125 | 25 | 352 (267, 415) | 199–696 | 33 |
| Baked beans | 41 | 210 (206, 220) | 100–220 | 19 | 829 (737, 898) | 370–1214 | 26 |
| Fruit | |||||||
| Frozen fruit | 38 | 150 (100, 150) | 100–220 | 26 | 330 (224, 379) | 135–527 | 32 |
| Canned fruit | 147 | 125 (113, 135) | 35–170 | 22 | 305 (269, 366) | 111–882 | 29 |
| Fruit juice | 292 | 250 (200, 250) | 125–500 | 25 | 433 (370, 503) | 202–1001 | 30 |
| Dried fruit | 126 | 35 (30, 50) | 10–75 | 29 | 448 (392, 553) | 123–893 | 29 |
| Grain (Cereal) Foods | |||||||
| Bread, loaf-style | 184 | 74 (61, 83) | 31–144 | 27 | 765 (637, 866) | 275–1392 | 27 |
| Bread rolls | 31 | 80 (69, 90) | 37–170 | 37 | 885 (656, 1044) | 379–1644 | 36 |
| Wraps & flat-breads | 86 | 51 (45, 70) | 21–105 | 32 | 623 (533, 858) | 225–1082 | 32 |
| Breakfast cereal, ready to eat 2 | 171 | 40 (30, 42) | 14–50 | 22 | 603 (488, 648) | 225–960 | 22 |
| Breakfast cereal, children’s | 44 | 30 (30, 30) | 25–45 | 13 | 483 (474, 497) | 388–797 | 13 |
| Muesli/granola | 178 | 45 (45, 50) | 30–100 | 13 | 799 (731, 869) | 380–1560 | 20 |
| Porridge oats (dry) | 72 | 40 (35, 46) | 30–100 | 25 | 631 (560, 731) | 435–1530 | 23 |
| Crispbreads | 114 | 21 (12, 25) | 3–38 | 40 | 371 (206, 463) | 60–650 | 42 |
| Meat and Alternatives | |||||||
| Fish, raw | 49 | 140 (125, 150) | 100–187 | 15 | 1090 (608, 1236) | 200–1590 | 40 |
| Fish, smoked/cured | 41 | 50 (50, 50) | 25–100 | 30 | 440 (358, 464) | 110–944 | 34 |
| Other seafood | 27 | 94 (75, 100) | 10–150 | 38 | 458 (280, 555) | 36–1179 | 58 |
| Canned fish/seafood | 320 | 80 (70, 95) | 4–125 | 24 | 494 (365, 605) | 35–1110 | 38 |
| Eggs | 72 | 100 (90, 104) | 55–118 | 14 | 570 (503, 581) | 378–672 | 11 |
| Tofu | 90 | 100 (100, 150) | 13–350 | 51 | 526 (395, 671) | 110–2888 | 53 |
| Meat substitutes | 76 | 85 (75, 100) | 25–150 | 29 | 672 (519, 843) | 136–1140 | 35 |
| Nuts & seeds | 273 | 30 (30, 30) | 10–100 | 28 | 780 (738, 875) | 140–2442 | 31 |
| Nut & seed butters/pastes | 78 | 20 (20, 20) | 10–32 | 21 | 512 (485, 564) | 240–857 | 22 |
| Dairy and Alternatives | |||||||
| Dairy milk—regular fat | 76 | 250 (250, 250) | 150–250 | 6 | 674 (656, 702) | 389–785 | 9 |
| Dairy milk—reduced fat | 88 | 250 (250, 250) | 200–250 | 3 | 466 (380, 489) | 304–625 | 16 |
| Non-dairy milk | 44 | 250 (250, 250) | 250–250 | 0 | 513 (310, 610) | 173–753 | 38 |
| Flavoured milk | 66 | 250 (250, 425) | 150–600 | 38 | 868 (689, 1378) | 372–2166 | 43 |
| Yoghurt—plain, regular fat | 45 | 100 (100, 125) | 90–200 | 24 | 509 (380, 639) | 286–1080 | 33 |
| Yoghurt—plain, low-fat | 17 | 100 (100, 175) | 100–200 | 29 | 338 (231, 467) | 220–590 | 36 |
| Yoghurt—flavoured, regular fat | 152 | 140 (120, 160) | 70–200 | 22 | 721 (565, 861) | 331–1344 | 26 |
| Yoghurt—flavoured, low-fat | 116 | 150 (150, 175) | 100–200 | 16 | 539 (390, 632) | 237–740 | 28 |
| Yoghurt, children’s | 64 | 90 (70, 109) | 70–150 | 28 | 334 (252, 429) | 188–555 | 31 |
| Cheese—hard, regular fat | 217 | 25 (21, 25) | 10–100 | 42 | 405 (340, 430) | 158–1500 | 37 |
| Cheese—hard, reduced fat | 27 | 21 (20, 25) | 15–25 | 14 | 260 (201, 350) | 164–360 | 25 |
| Cheese—semi-soft, ripened | 78 | 25 (25, 25) | 20–30 | 12 | 379 (326, 408) | 240–540 | 17 |
| Cheese—fresh, cottage/ricotta | 25 | 100 (25, 125) | 25–125 | 59 | 355 (149, 454) | 103–848 | 64 |
| Cheese—fresh, other | 137 | 25 (25, 28) | 10–100 | 36 | 328 (259, 371) | 82–1164 | 43 |
| Total | 4046 | ||||||
1 All units in grams (g) except for fruit juice and milks (regular fat dairy, reduced fat dairy, non-dairy, flavoured), which are in millilitres (mL). 2 Excludes children’s cereals and muesli/granola, which were assessed as separate categories. IQR = interquartile range; CV = coefficient of variation. All values rounded to the nearest whole number.
Table 2.
Comparison of manufacturer-declared serving sizes with the Australian Dietary Guidelines (ADG) standard serves [16] and sex-specific typical (median) portion sizes consumed by Australian adults [18], for 37 categories of packaged food products across the Five Food Groups.
| Product Categories | Declared Serving Size | ADG Standard Serves | Typical Portion Sizes | |||||
|---|---|---|---|---|---|---|---|---|
| Male, 19+ Years | Female, 19+ Years | |||||||
| n | Median 1 | Standard Serve 1 | Percent Difference 2 | Median 1 | Percent Difference 2 | Median 1 | Percent Difference 2 | |
| Vegetables | ||||||||
| Frozen vegetables | 138 | 100 | 75 | 33 | 143 | −30 | 114 | −12 |
| Canned vegetables | 158 | 100 | 75 | 33 | 143 | −30 | 114 | −12 |
| Canned legumes | 48 | 80 | 75 | 7 | 87 | −8 | 86 | −7 |
| Baked beans | 41 | 210 | 75 | 180 | 201 | 4 | 138 | 52 |
| Fruit | ||||||||
| Frozen fruit | 38 | 150 | 150 | 0 | ||||
| Canned fruit | 147 | 125 | 150 | −17 | ||||
| Fruit juice | 292 | 250 | 125 | 100 | 260 | −4 | 250 | 0 |
| Dried fruit | 126 | 35 | 30 | 17 | 40 | −13 | 16 | 119 |
| Grain (Cereal) Foods | ||||||||
| Bread, loaf-style | 184 | 74 | 40 | 85 | 64 | 16 | 54 | 37 |
| Bread rolls | 31 | 80 | 40 | 100 | 69 | 16 | 69 | 16 |
| Wraps & flat-breads | 86 | 51 | 40 | 28 | 71 | −28 | 66 | −23 |
| Breakfast cereal, ready to eat 3 | 171 | 40 | 30 | 33 | 51 | −22 | 35 | 14 |
| Breakfast cereal, children’s | 44 | 30 | 30 | 0 | ||||
| Muesli/granola | 178 | 45 | 30 | 50 | 87 | −48 | 52 | −13 |
| Crispbreads | 114 | 21 | 35 | −40 | ||||
| Meat and Alternatives | ||||||||
| Fish, raw | 49 | 140 | 115 | 22 | ||||
| Fish, smoked/cured | 41 | 50 | 100 | −50 | ||||
| Other seafood | 27 | 94 | 100 | −6 | 72 | 31 | 66 | 42 |
| Canned fish/seafood | 320 | 80 | 100 | −20 | 80 | 0 | 76 | 5 |
| Eggs | 72 | 100 | 120 | −17 | 51 | 96 | 49 | 104 |
| Tofu | 90 | 100 | 170 | −41 | 100 | 0 | 105 | −5 |
| Nuts & seeds | 273 | 30 | 30 | 0 | 28 | 7 | 27 | 11 |
| Nut & seed butters/pastes | 78 | 20 | 30 | −33 | 13 | 54 | 10 | 100 |
| Dairy and Alternatives | ||||||||
| Dairy milk—regular fat | 76 | 250 | 250 | 0 | 70 | 257 | 50 | 400 |
| Dairy milk—reduced fat | 88 | 250 | 250 | 0 | 80 | 213 | 55 | 355 |
| Non-dairy milk | 44 | 250 | 250 | 0 | 178 | 40 | 127 | 97 |
| Flavoured milk | 66 | 250 | 250 | 0 | 453 | −45 | 350 | −29 |
| Yoghurt—plain, regular fat | 45 | 100 | 200 | −50 | 92 | 9 | 83 | 20 |
| Yoghurt—plain, low-fat | 17 | 100 | 200 | −50 | ||||
| Yoghurt—flavoured, regular fat | 152 | 140 | 200 | −30 | 154 | 9 | 123 | 14 |
| Yoghurt—flavoured, low-fat | 116 | 150 | 200 | −25 | 156 | −4 | 149 | 1 |
| Yoghurt, children’s | 64 | 90 | 200 | −55 | ||||
| Cheese—hard, regular fat | 217 | 25 | 40 | −38 | 25 | 0 | 25 | 0 |
| Cheese—hard, reduced fat | 27 | 21 | 40 | −48 | 28 | −25 | 21 | 0 |
| Cheese—semi-soft, ripened | 78 | 25 | 40 | −38 | 20 | 25 | 24 | 4 |
| Cheese—fresh, cottage/ricotta | 25 | 100 | 120 | −17 | 89 | 12 | 40 | 150 |
| Cheese—fresh, other | 137 | 25 | 40 | −38 | ||||
1 All units in grams (g) except for fruit juice and milks (regular fat dairy, reduced fat dairy, non-dairy, flavoured), which are in millilitres (mL). 2 Percent difference calculated as (median serving size − [standard serve OR median portion size])/(standard serve OR median portion size) × 100. 3 Excludes children’s cereals and muesli/granola, which were assessed as separate categories. All values rounded to the nearest whole number. Blank cells indicate categories for which no equivalent National Nutrition and Physical Activity Survey (NNPAS) category was identified.
© 2018 by the authors. Licensee MDPI, Basel, Switzerland. This article is an open access article distributed under the terms and conditions of the Creative Commons Attribution (CC BY) license (http://creativecommons.org/licenses/by/4.0/).
Share and Cite
MDPI and ACS Style
Yang, S.; Gemming, L.; Rangan, A. Large Variations in Declared Serving Sizes of Packaged Foods in Australia: A Need for Serving Size Standardisation? Nutrients 2018, 10, 139. https://doi.org/10.3390/nu10020139
AMA Style
Yang S, Gemming L, Rangan A. Large Variations in Declared Serving Sizes of Packaged Foods in Australia: A Need for Serving Size Standardisation? Nutrients. 2018; 10(2):139. https://doi.org/10.3390/nu10020139
Chicago/Turabian StyleYang, Suzie, Luke Gemming, and Anna Rangan. 2018. "Large Variations in Declared Serving Sizes of Packaged Foods in Australia: A Need for Serving Size Standardisation?" Nutrients 10, no. 2: 139. https://doi.org/10.3390/nu10020139
Note that from the first issue of 2016, this journal uses article numbers instead of page numbers. See further details here.