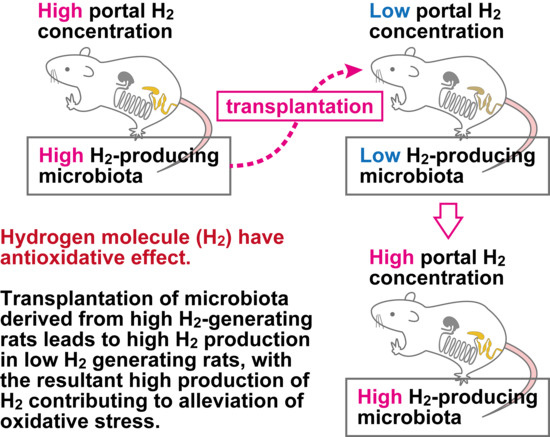
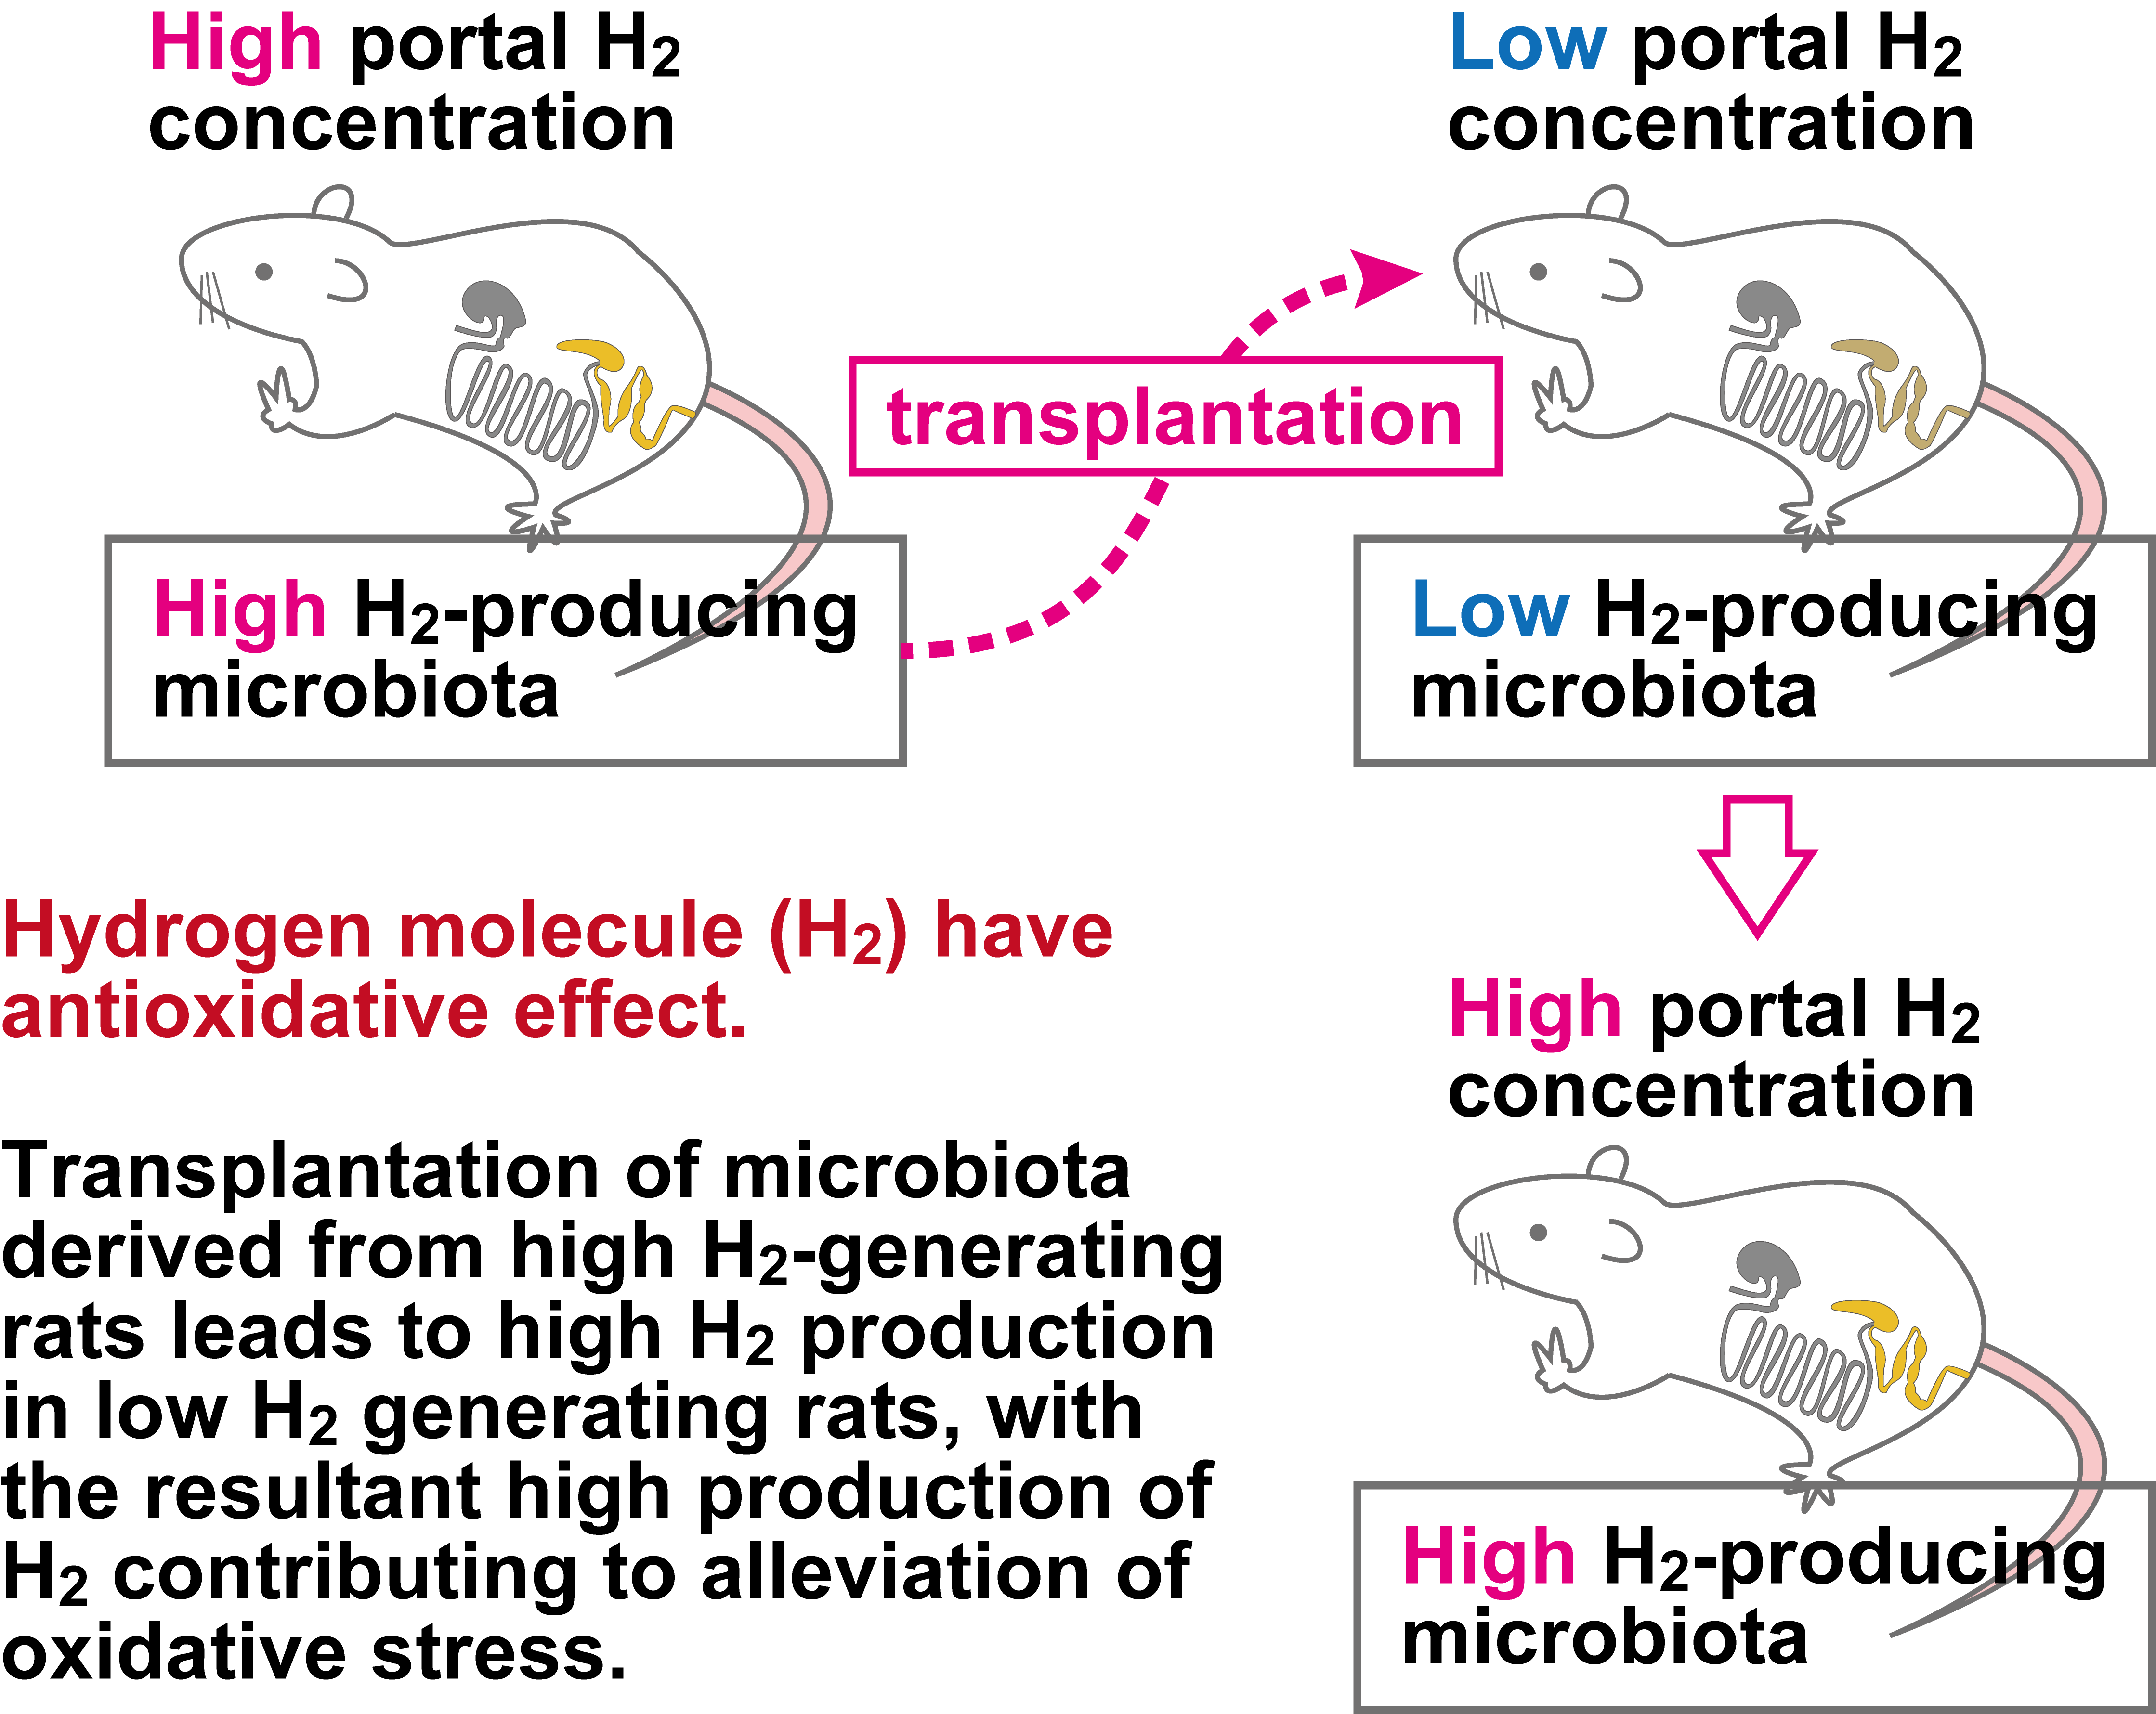
Transplantation of High Hydrogen-Producing Microbiota Leads to Generation of Large Amounts of Colonic Hydrogen in Recipient Rats Fed High Amylose Maize Starch

 , and
, and
Abstract
:
1. Introduction
2. Materials and Methods
2.1. High Amylose Maize Starch
2.2. Animals and Diets
2.3. Portal H2 Concentration and Alleviation of Oxidative Stress among Individual Rats (Experiment 1)
2.4. Sampling
2.5. Assessment of Oxidative Stress and Damage in the Liver
2.6. SCFA Analysis
2.7. Preparation of Inoculum from the Cecal Contents of High H2-Generating Rats (Experiment 2)
2.8. Effects of Transplantation of HG Cecal Microbiota into LG on Portal H2 Concentration (Experiment 2)
2.9. Total Anaerobe Count in the Inoculum and Cecal Contents (Experiments 2)
2.10. Bacterial DNA Extraction from the Inoculum and the Cecal Content (Experiments 2)
2.11. Library Preparation and DNA Sequencing
2.12. Statistical Analysis
3. Results
3.1. Experiment 1
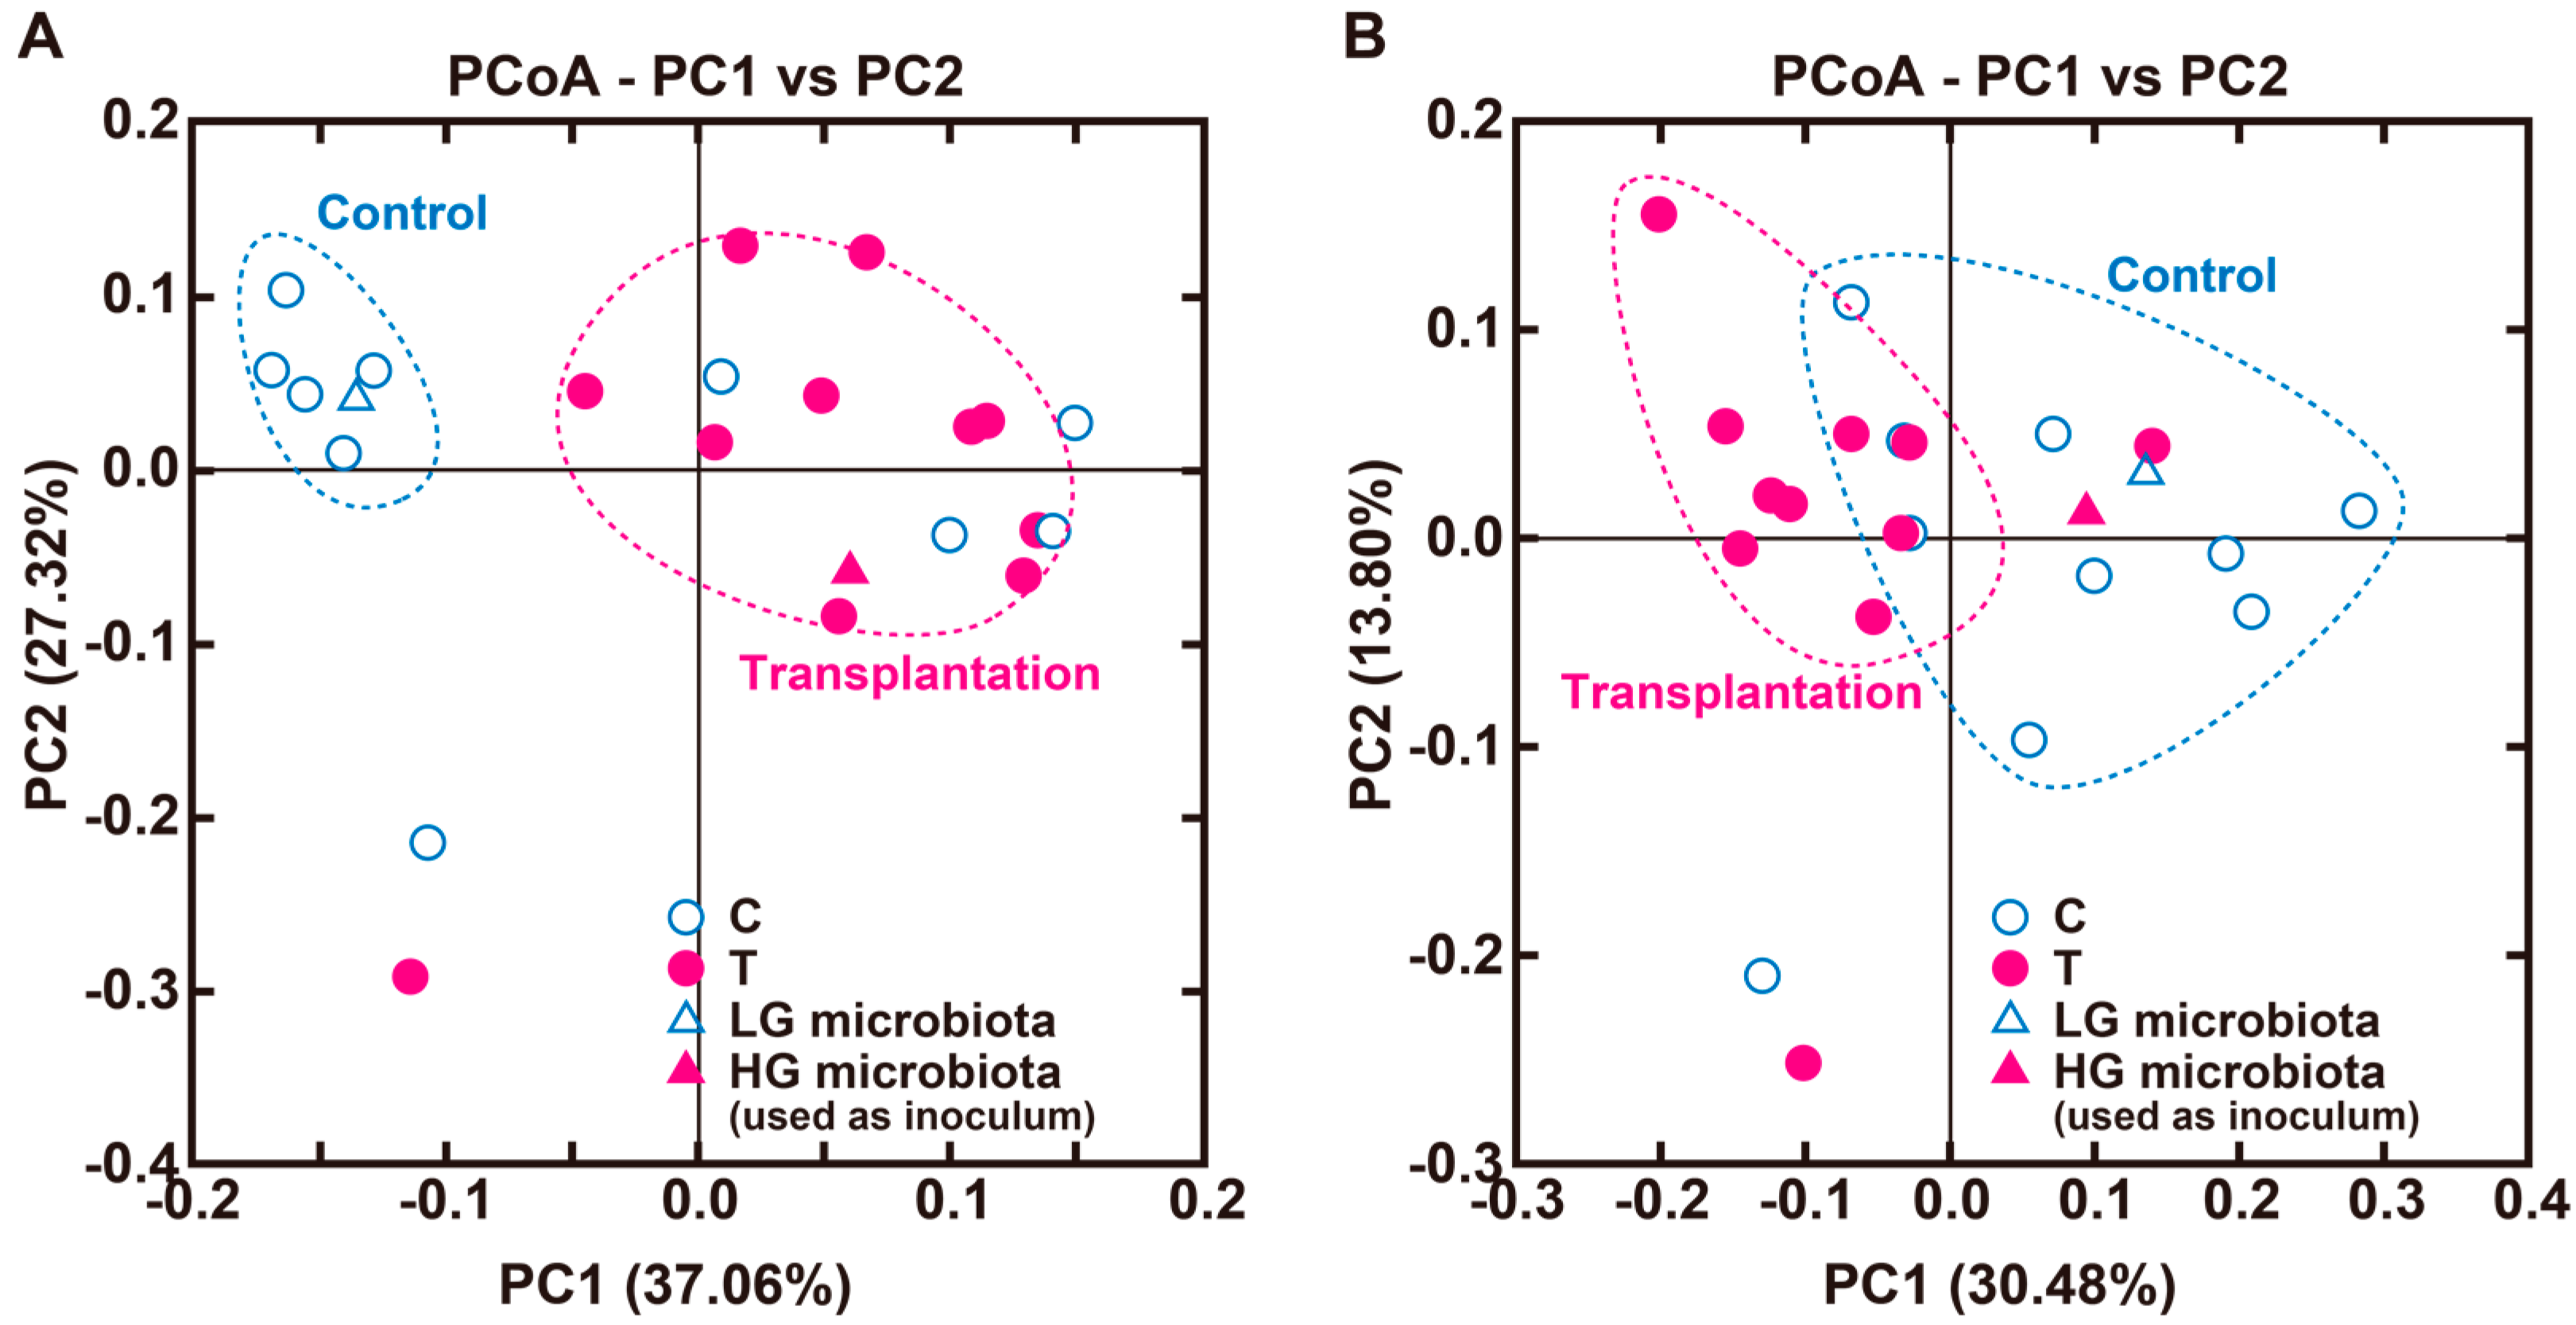
3.2. Experiment 2
4. Discussion
Supplementary Materials
Acknowledgments
Author Contributions
Conflicts of Interest
References
- Macfarlane, G.T.; Cummings, J.H. The colonic flora, fermentation and large bowel digestive function. In The Large Intestine: Physiology, Pathophysiology and Disease; Phillips, S.F., Pemberton, J.H., Shorter, R.G., Eds.; Raven Press: New York, NY, USA, 1991; pp. 51–92. [Google Scholar]
- Ohsawa, I.; Ishikawa, M.; Takahashi, K.; Watanabe, M.; Nishimaki, K.; Yamagata, K.; Katsura, K.; Katayama, Y.; Asoh, S.; Ohta, S. Hydrogen acts as a therapeutic antioxidant by selectively reducing cytotoxic oxygen radicals. Nat. Med. 2007, 13, 688–694. [Google Scholar] [CrossRef] [PubMed]
- Wu, F.; Qiu, Y.; Ye, G.; Luo, H.; Jiang, J.; Yu, F.; Zhou, W.; Zhang, S.; Feng, J. Treatment with hydrogen molecule attenuates cardiac dysfunction in streptozotocin-induced diabetic mice. Cardiovasc. Pathol. 2015, 24, 294–303. [Google Scholar] [CrossRef] [PubMed]
- Hayashida, K.; Sano, M.; Ohsawa, I.; Shinmura, K.; Tamaki, K.; Kimura, K.; Endo, J.; Katayama, T.; Kawamura, A.; Kohsaka, S.; et al. Inhalation of hydrogen gas reduces infarct size in the rat model of myocardial ischemia-reperfusion injury. Biochem. Biophys. Res. Commun. 2008, 373, 30–35. [Google Scholar] [CrossRef] [PubMed]
- Nishimura, N.; Tanabe, H.; Sasaki, Y.; Makita, Y.; Ohata, M.; Yokoyama, S.; Asano, M.; Yamamoto, T.; Kiriyama, S. Pectin and high-amylose maize starch increase caecal hydrogen production and relieve hepatic ischaemia-reperfusion injury in rats. Br. J. Nutr. 2012, 107, 485–492. [Google Scholar] [CrossRef] [PubMed]
- Nishimura, N.; Tanabe, H.; Adachi, M.; Yamamoto, T.; Fukushima, M. Colonic hydrogen generated from fructan diffuses into the abdominal cavity and reduces adipose mrna abundance of cytokines in rats. J. Nutr. 2013, 143, 1943–1949. [Google Scholar] [CrossRef] [PubMed]
- Matsumoto, M.; Fujita, A.; Yamashita, A.; Kameoka, S.; Shimomura, Y.; Kitada, Y.; Tamada, H.; Nakamura, S.; Tsubota, K. Effects of functional milk containing galactooligosaccharide, maltitol, and glucomannan on the production of hydrogen gas in the human intestine. J. Funct. Foods 2017, 35, 13–23. [Google Scholar] [CrossRef]
- Carbonero, F.; Benefiel, A.C.; Gaskins, H.R. Contributions of the microbial hydrogen economy to colonic homeostasis. Nat. Rev. Gastroenterol. Hepatol. 2012, 9, 504–518. [Google Scholar] [CrossRef] [PubMed]
- Ohashi, Y.; Hiraguchi, M.; Ushida, K. The composition of intestinal bacteria affects the level of luminal iga. Biosci. Biotechnol. Biochem. 2006, 70, 3031–3035. [Google Scholar] [CrossRef] [PubMed]
- Van Nood, E.; Vrieze, A.; Nieuwdorp, M.; Fuentes, S.; Zoetendal, E.G.; de Vos, W.M.; Visser, C.E.; Kuijper, E.J.; Bartelsman, J.F.; Tijssen, J.G.; et al. Duodenal infusion of donor feces for recurrent clostridium difficile. N. Engl. J. Med. 2013, 368, 407–415. [Google Scholar] [CrossRef] [PubMed]
- Di Luccia, B.; Crescenzo, R.; Mazzoli, A.; Cigliano, L.; Venditti, P.; Walser, J.C.; Widmer, A.; Baccigalupi, L.; Ricca, E.; Iossa, S. Rescue of fructose-induced metabolic syndrome by antibiotics or faecal transplantation in a rat model of obesity. PLoS ONE 2015, 10, e0134893. [Google Scholar] [CrossRef] [PubMed] [Green Version]
- McCleary, B.V.; Monaghan, D.A. Measurement of resistant starch. J. AOAC Int. 2002, 85, 665–675. [Google Scholar] [PubMed]
- Nishimura, N.; Tanabe, H.; Yamamoto, T. Sufficient intake of high amylose cornstarch maintains high colonic hydrogen production for 24 h in rats. Biosci. Biotechnol. Biochem. 2017, 81, 173–180. [Google Scholar] [CrossRef] [PubMed]
- Anderson, M.E. Determination of glutathione and glutathione disulfide in biological samples. Methods Enzymol. 1985, 113, 548–555. [Google Scholar] [PubMed]
- Rahman, I.; Kode, A.; Biswas, S.K. Assay for quantitative determination of glutathione and glutathione disulfide levels using enzymatic recycling method. Nat. Protoc. 2006, 1, 3159–3165. [Google Scholar] [CrossRef] [PubMed]
- Hoshi, S.; Sakata, T.; Mikuni, K.; Hashimoto, H.; Kimura, S. Galactosylsucrose and xylosylfructoside alter digestive tract size and concentrations of cecal organic acids in rats fed diets containing cholesterol and cholic acid. J. Nutr. 1994, 124, 52–60. [Google Scholar] [PubMed]
- Tanaka, Y.; Benno, Y. Application of a single-colony coculture technique to the isolation of hitherto unculturable gut bacteria. Microbiol. Immunol. 2015, 59, 63–70. [Google Scholar] [CrossRef] [PubMed]
- Manichanh, C.; Reeder, J.; Gibert, P.; Varela, E.; Llopis, M.; Antolin, M.; Guigo, R.; Knight, R.; Guarner, F. Reshaping the gut microbiome with bacterial transplantation and antibiotic intake. Genome Res. 2010, 20, 1411–1419. [Google Scholar] [CrossRef] [PubMed]
- Inoue, R.; Ohue-Kitano, R.; Tsukahara, T.; Tanaka, M.; Masuda, S.; Inoue, T.; Yamakage, H.; Kusakabe, T.; Hasegawa, K.; Shimatsu, A.; et al. Prediction of functional profiles of gut microbiota from 16s rrna metagenomic data provides a more robust evaluation of gut dysbiosis occurring in japanese type 2 diabetic patients. J. Clin. Biochem. Nutr. 2017, 61, 217–221. [Google Scholar] [CrossRef] [PubMed]
- Caporaso, J.G.; Kuczynski, J.; Stombaugh, J.; Bittinger, K.; Bushman, F.D.; Costello, E.K.; Fierer, N.; Pena, A.G.; Goodrich, J.K.; Gordon, J.I.; et al. Qiime allows analysis of high-throughput community sequencing data. Nat. Methods 2010, 7, 335–336. [Google Scholar] [CrossRef] [PubMed]
- Edgar, R.C. Search and clustering orders of magnitude faster than blast. Bioinformatics 2010, 26, 2460–2461. [Google Scholar] [CrossRef] [PubMed]
- Edgar, R.C.; Haas, B.J.; Clemente, J.C.; Quince, C.; Knight, R. Uchime improves sensitivity and speed of chimera detection. Bioinformatics 2011, 27, 2194–2200. [Google Scholar] [CrossRef] [PubMed]
- Wolf, P.G.; Biswas, A.; Morales, S.E.; Greening, C.; Gaskins, H.R. H2 metabolism is widespread and diverse among human colonic microbes. Gut Microbes 2016, 7, 235–245. [Google Scholar] [CrossRef] [PubMed]
- Saxelin, M.; Pessi, T.; Salminen, S. Fecal recovery following oral administration of lactobacillus strain gg (atcc 53103) in gelatine capsules to healthy volunteers. Int. J. Food Microbiol. 1995, 25, 199–203. [Google Scholar] [CrossRef]
- Li, S.S.; Zhu, A.; Benes, V.; Costea, P.I.; Hercog, R.; Hildebrand, F.; Huerta-Cepas, J.; Nieuwdorp, M.; Salojarvi, J.; Voigt, A.Y.; et al. Durable coexistence of donor and recipient strains after fecal microbiota transplantation. Science 2016, 352, 586–589. [Google Scholar] [CrossRef] [PubMed]
- Nishimura, N.; Tanabe, H.; Yamamoto, T. Isomaltodextrin, a highly branched alpha-glucan, increases rat colonic H2 production as well as indigestible dextrin. Biosci. Biotechnol. Biochem. 2016, 80, 554–563. [Google Scholar] [CrossRef] [PubMed]
- Regmi, P.R.; Metzler-Zebeli, B.U.; Ganzle, M.G.; van Kempen, T.A.; Zijlstra, R.T. Starch with high amylose content and low in vitro digestibility increases intestinal nutrient flow and microbial fermentation and selectively promotes bifidobacteria in pigs. J. Nutr. 2011, 141, 1273–1280. [Google Scholar] [CrossRef] [PubMed]
- Wang, X.; Conway, P.L.; Brown, I.L.; Evans, A.J. In vitro utilization of amylopectin and high-amylose maize (amylomaize) starch granules by human colonic bacteria. Appl. Environ. Microbiol. 1999, 65, 4848–4854. [Google Scholar] [PubMed]
- Ze, X.; Duncan, S.H.; Louis, P.; Flint, H.J. Ruminococcus bromii is a keystone species for the degradation of resistant starch in the human colon. ISME J 2012, 6, 1535–1543. [Google Scholar] [CrossRef] [PubMed]
- Falony, G.; Lazidou, K.; Verschaeren, A.; Weckx, S.; Maes, D.; De Vuyst, L. In vitro kinetic analysis of fermentation of prebiotic inulin-type fructans by bifidobacterium species reveals four different phenotypes. Appl. Environ. Microbiol. 2009, 75, 454–461. [Google Scholar] [CrossRef] [PubMed]
- Duncan, S.H.; Louis, P.; Flint, H.J. Lactate-utilizing bacteria, isolated from human feces, that produce butyrate as a major fermentation product. Appl. Environ. Microbiol. 2004, 70, 5810–5817. [Google Scholar] [CrossRef] [PubMed]
- Kamlage, B.; Gruhl, B.; Blaut, M. Isolation and characterization of two new homoacetogenic hydrogen-utilizing bacteria from the human intestinal tract that are closely related to clostridium coccoides. Appl. Environ. Microbiol. 1997, 63, 1732–1738. [Google Scholar] [PubMed]
- Chinda, D.; Nakaji, S.; Fukuda, S.; Sakamoto, J.; Shimoyama, T.; Nakamura, T.; Fujisawa, T.; Terada, A.; Sugawara, K. The fermentation of different dietary fibers is associated with fecal clostridia levels in men. J. Nutr. 2004, 134, 1881–1886. [Google Scholar] [CrossRef] [PubMed]
- Agler, M.T.; Wrenn, B.A.; Zinder, S.H.; Angenent, L.T. Waste to bioproduct conversion with undefined mixed cultures: The carboxylate platform. Trends Biotechnol. 2011, 29, 70–78. [Google Scholar] [CrossRef] [PubMed]
- Mathur, R.; Kim, G.; Morales, W.; Sung, J.; Rooks, E.; Pokkunuri, V.; Weitsman, S.; Barlow, G.M.; Chang, C.; Pimentel, M. Intestinal methanobrevibacter smithii but not total bacteria is related to diet-induced weight gain in rats. Obesity 2013, 21, 748–754. [Google Scholar] [CrossRef] [PubMed]
- Samuel, B.S.; Gordon, J.I. A humanized gnotobiotic mouse model of host-archaeal-bacterial mutualism. Proc. Natl. Acad. Sci. USA 2006, 103, 10011–10016. [Google Scholar] [CrossRef] [PubMed]


| Q1 (Low) | Q2 | Q3 | Q4 | Q5 (High) | χ2 (p) | |
|---|---|---|---|---|---|---|
| Haruno colony | 4 | 1 | 3 | 12 | 13 | <0.0001 |
| Ohara colony | 9 | 12 | 10 | 1 | 1 | <0.0001 |
| Ptrend | ||||||
| Portal H2, μmol/L | 1.54 (0.771–1.89) | 3.39 (2.75–3.92) | 6.08 ** (5.02–6.56) | 8.45 *** (8.02–9.06) | 17.4 *** (13.2–19.9) | <0.0001 |
| Food intake, g/10 day | 198 (190–204) | 192 (182–208) | 199 (188–206) | 202 (187–209) | 196 (190–200) | 0.4594 |
| HAS intake, g/10 day | 39.6 (38.1–40.9) | 38.3 (36.4–41.7) | 39.7 (37.7–41.3) | 40.3 (37.5–41.9) | 39.2 (37.9–40.0) | 0.4752 |
| Body weight gain, g/10 day | 70 (61–85) | 78 (68–84) | 72 (64–77) | 72 (66–78) | 71 (60–82) | 0.2687 |
| Liver, μmol/g tissue | ||||||
| GSSG | 0.137 (0.111–0.157) | 0.171 * (0.139–0.185) | 0.157 (0.143–0.174) | 0.145 (0.123–0.159) | 0.122 (0.106–0.135) | 0.0314 |
| GSH | 7.20 (6.77–7.88) | 7.13 (6.92–7.93) | 7.22 (6.91–8.40) | 6.83 (6.31–7.30) | 7.01 (6.74–7.25) | 0.1087 |
| GSH/GSSG | 55.4 (46.4–69.5) | 45.9 (40.1–48.6) | 47.9 (40.8–55.2) | 48.1 (42.2–58.2) | 59.6 (50.8–67.2) | 0.0928 |
| Plasma ALT, μkat/L | 7.96 (3.84–8.90 | 6.33 (0.717–9.43) | 3.54 * (0.526–4.92) | 2.03 (0.582–7.88) | 3.99 (0.750–9.88) | 0.0422 |
| Cecal organic acid, μmol/g | ||||||
| Acetate | 42.1 (37.4–59.3) | 41.6 (35.8–43.4) | 47.2 (33.3–60.6) | 71.4 * (60.0–78.5) | 87.7 *** (66.0–97.0) | <0.0001 |
| Propionate | 8.77 (8.01–10.3) | 11.4 (7.90–15.3) | 8.75 (5.60–10.0) | 4.13 ** (3.32–6.23) | 4.83 ** (3.59–5.55) | <0.0001 |
| Butyrate | 4.79 (2.97–6.84) | 4.25 (3.56–5.88) | 6.60 (3.85–9.64) | 9.34 * (7.15–12.1) | 12.3 *** (10.3–15.7) | <0.0001 |
| Succinate | 60.8 (38.9–69.3) | 45.3 (41.6–48.5) | 45.4 (27.5–51.2) | 25.8 ** (18.8–35.0) | 30.7 ** (24.9–37.0) | <0.0001 |
| Control | Transplantation | p Value | |
|---|---|---|---|
| Initial body weight (g on day 0) | 238 ± 2 | 237 ± 2 | 0.9753 |
| Body weight gain (g/13 day) | 87 ± 4 | 78 ± 4 | 0.1348 |
| Food intake (g/13 day) | 287 ± 7 | 261 ± 8 * | 0.0493 |
| Net H2 excretion (μmol/5 min) | |||
| Day 0 | 0.103 (0.064–0.338) | 0.146 (0.101–0.176) | 0.8931 |
| Day 3 | 0.579 (0.447–1.13) | 0.405 (0.196–0.830) | 0.1690 |
| Day 6 | 0.334 (0.212–0.679) | 0.304 (0.151–0.622) | 0.8786 |
| Day 10 | 0.554 (0.199–0.878) | 1.13 (0.252–2.92) | 0.1734 |
| Day 13 | 0.721 (0.347–3.55) | 2.34 (1.65–2.96) | 0.3910 |
| AUCday 6–13 (mmol) | 0.966 (0.665–2.64) | 3.04 (1.41–6.06) | 0.1627 |
| Portal H2 (μmol/L) | 3.07 ± 1.00 | 9.95 ± 1.78 ** | 0.0041 |
| Cecum (g) | |||
| Contents | 9.31 ± 0.58 | 9.59 ± 0.61 | 0.7443 |
| Tissue | 1.87 ± 0.11 | 1.81 ± 0.10 | 0.7253 |
| Cecal organic acids (μmol/g) | |||
| Acetate | 43.5 ± 3.3 | 57.8 ± 2.7 ** | 0.0038 |
| Propionate | 9.80 ± 0.98 | 8.17 ± 1.07 | 0.2777 |
| n-Butyrate | 5.65 ± 1.05 | 7.06 ± 0.80 | 0.2999 |
| Succinate | 61.4 ± 4.2 | 48.5 ± 5.2 | 0.0701 |
| Cecal bacteria | |||
| Total anaerobes (log10cfu/g) | 12.7 ± 0.5 | 12.6 ± 0.3 | 0.7592 |
| Correlation ‡ (vs. Portal H2) | ||||||
|---|---|---|---|---|---|---|
| Order | Family | Genus | C (%) | T (%) | r | p |
| Actinobacteria | 12.0 ± 5.5 | 18.3 ± 4.4 | 0.789 | 4.82 × 10⁻⁵ | ||
| Bifidobacteriales | Bifidobacteriaceae | Bifidobacterium | 12.0 ± 5.4 | 18.0 ± 4.3 | 0.791 | 4.49 × 10⁻⁵ |
| Bacteroidetes | 58.0 ± 7.3 | 39.8 ± 4.1 * | −0.408 | 0.0757 | ||
| Bacteroidales | Bacteroidaceae | Bacteroides | 40.2 ± 9.0 | 8.0 ± 3.1 ** | −0.507 | 0.0240 |
| Bacteroidales | s24-7 | 15.7 ± 2.7 | 30.7 ± 4.7 * | −0.084 | 0.724 | |
| Bacteroidales | Porphyromonadaceae | Parabacteroides | 1.7 ± 0.5 | 1.0 ± 0.4 | 0.316 | 0.0190 |
| Firmicutes | 23.8 ± 3.2 | 34.3 ± 4.6 † | −0.0992 | 0.677 | ||
| Lactobacillales | Lactobacillaceae | Lactobacillus | 9.3 ± 3.1 | 9.1 ± 1.9 | 0.368 | 0.111 |
| Clostridiales | Lachnospiraceae | Blautia | 1.1 ± 0.2 | 3.1 ± 0.9 | −0.107 | 0.653 |
| Clostridiales | Lachnospiraceae | Clostridium | 1.2 ± 0.3 | 2.1 ± 0.5 | 0.383 | 0.0957 |
| Clostridiales | Lachnospiraceae | Other | 5.8 ± 0.9 | 1.9 ± 0.8 | −0.397 | 0.0841 |
| Clostridiales | Ruminococcaceae | Ruminococcus | 1.1 ± 0.5 | 6.8 ± 4.9 | −0.567 | 0.0103 |
| Clostridiales | Ruminococcaceae | Oscillospira | 1.1 ± 0.1 | 2.1 ± 0.3 * | −0.0391 | 0.871 |
| Clostridiales | Ruminococcaceae | Other | 1.2 ± 0.2 | 0.6 ± 0.1 | −0.112 | 0.678 |
| Erysipelotrichales | Erysipelotrichaceae | Allobaculum | 1.2 ± 0.4 | 6.1 ± 2.5 | 0.666 | 1.77 × 10⁻³ |
| Erysipelotrichales | Erysipelotrichaceae | Eubacterium | 0.1 ± 0.0 | 0.1 ± 0.0 | −0.405 | 0.0780 |
| Proteobacteria | 4.1 ± 1.2 | 4.4 ± 0.7 | −0.370 | 0.109 | ||
| Enterobacteriale | Enterobacteriaceae | Escherichia | 0.3 ± 0.2 | 3.1 ± 0.7 ** | −0.453 | 0.0466 |
| Enterobacteriales | Enterobacteriaceae | Other | 3.0 ± 1.3 | 0.0 ± 0.0 | − | − |
| Burkholderiales | Alcaligenaceae | Sutterella | 0.8 ± 0.3 | 1.3 ± 0.2 | 0.341 | 0.141 |
| Verrucomicrobia | 1.9 ± 1.9 | 3.1 ± 2.7 | −0.383 | 0.0960 | ||
| Verrucomicrobiales | Verrucomicrobiaceae | Akkermansia | 1.9 ± 1.9 | 3.1 ± 2.7 | −0.383 | 0.0960 |
© 2018 by the authors. Licensee MDPI, Basel, Switzerland. This article is an open access article distributed under the terms and conditions of the Creative Commons Attribution (CC BY) license (http://creativecommons.org/licenses/by/4.0/).
Share and Cite
Nishimura, N.; Tanabe, H.; Komori, E.; Sasaki, Y.; Inoue, R.; Yamamoto, T. Transplantation of High Hydrogen-Producing Microbiota Leads to Generation of Large Amounts of Colonic Hydrogen in Recipient Rats Fed High Amylose Maize Starch. Nutrients 2018, 10, 144. https://doi.org/10.3390/nu10020144
Nishimura N, Tanabe H, Komori E, Sasaki Y, Inoue R, Yamamoto T. Transplantation of High Hydrogen-Producing Microbiota Leads to Generation of Large Amounts of Colonic Hydrogen in Recipient Rats Fed High Amylose Maize Starch. Nutrients. 2018; 10(2):144. https://doi.org/10.3390/nu10020144
Chicago/Turabian StyleNishimura, Naomichi, Hiroki Tanabe, Erika Komori, Yumi Sasaki, Ryo Inoue, and Tatsuro Yamamoto. 2018. "Transplantation of High Hydrogen-Producing Microbiota Leads to Generation of Large Amounts of Colonic Hydrogen in Recipient Rats Fed High Amylose Maize Starch" Nutrients 10, no. 2: 144. https://doi.org/10.3390/nu10020144