Article

Markers of Iron Status Are Associated with Risk of Hyperuricemia among Chinese Adults: Nationwide Population-Based Study

1
Peking University School of Nursing, No.38 Xueyuan Road, Haidian District, Beijing 100191, China
2
Department of Nutrition & Food Hygiene, School of Public Health, Peking University Health Science Center, No.38 Xueyuan Road, Haidian District, Beijing 100191, China
3
CAS Key Laboratory of Pathogenic Microbiology and Immunology, Institute of Microbiology, Chinese Academy of Science, No.1 Beichen West Road, Chaoyang District, Beijing 100101, China
*
Authors to whom correspondence should be addressed.
Nutrients 2018, 10(2), 191; https://doi.org/10.3390/nu10020191
Submission received: 27 November 2017 / Revised: 26 January 2018 / Accepted: 6 February 2018 / Published: 9 February 2018
(This article belongs to the Special Issue Nutrients and Renal Function)

Abstract

:
Background: Elevated serum uric acid (SUA) involved in iron metabolism, has been increasingly recognized as a risk factor for gout and cardiovascular diseases. The objective of this study was to examine the associations between markers of iron status with risk of hyperuricemia (HU) in Chinese adult population. Methods: Data were extracted from the 2009 wave of the China Health and Nutrition Survey, consisting of 7946 apparently healthy adults. Serum ferritin (SF), transferrin, soluble transferrin receptors (sTfR), hemoglobin (Hb), high-sensitivity C-reactive protein (hs-CRP), and SUA were measured. Diet was assessed with three consecutive 24 h recalls. Demographic characteristics, smoking status, alcohol consumption, and physical activities were investigated using a structured questionnaire. Multilevel mixed-effects models were constructed to estimate the associations of SF, transferrin, sTfR, and Hb with SUA and the risk of HU. Results: The crude prevalence of HU was 16.1%. SF, transferrin, and Hb levels were positively associated with SUA and the risk of HU after adjustment for cluster effects and potential confounders (all p-trend < 0.05). Compared with participants in the lowest quartile of SF, those in the highest quartile had significantly higher SUA concentrations (β = 0.899 mg/dL, 95% confidence interval (CI): 0.788, 1.010; p < 0.001) and higher risk of HU (odds ratio (OR) = 3.086, 95% CI: 2.450, 3.888; p < 0.001). Participants with the highest quartile of transferrin had significantly higher SUA concentrations (β = 0.488 mg/dL, 95% CI: 0.389, 0.587; p < 0.001) and higher risk of HU (OR: 1.900; 95% CI: 1.579, 2.286; p < 0.001) when compared with those with the lowest quartile. In male participants, those in the highest quartile of Hb had significantly higher risk of HU when compared to the reference group (OR: 1.401, 95% CI: 1.104, 1.777; p < 0.01); however, this association was not found in female participants (OR: 1.093; 95% CI: 0.821, 1.455; p = 0.544). Conclusion: SF, transferrin, and Hb levels were positively associated with the risk of HU, and additional studies are needed to confirm the findings, as well as to elucidate their underlying mechanisms.

1. Introduction

Serum uric acid (SUA), the end product from purine degradation in humans and higher primates, has not been defined, but it can function as an antioxidant [1,2]. The accumulating epidemiologic data have demonstrated that hyperuricemia (HU) or elevated SUA levels are not only critical to gout [3], but also found to be potential pathogenic factors for some other chronic non-communicable diseases (NCDs), such as diabetes mellitus [4], cardiovascular diseases [5], nonalcoholic fatty liver disease [6], and cancer [7]. In the past few decades, the prevalence of HU has rapidly increased both in western countries and China [8,9]. Several risk factors of HU have been implicated, including older age, menopause, family history of NCDs, lack of physical activity, inadequate dietary intake, higher levels of inflammatory cytokines, such as interleukin-6 (IL-6), tumor necrosis factor alpha (TNF-α), and high-sensitivity C-reactive protein (hs-CRP), and some genetic variations [3,10,11,12,13,14].
Increasing evidence shows that body iron metabolism plays an important role in the development of HU [2,15,16,17,18]. Serum ferritin (SF) is the most widely used biomarker in clinical and epidemiological studies to evaluate body iron stores, despite being affected by inflammation status. Several studies [2,15,16,17] have assessed the relationship between SF and the risk of HU, but few studies have adjusted for some important lifestyle factors, such as cigarette smoking, physical activity, and dietary factors, which are associated with the risk of HU [11,12,19,20,21]. As such, it is still not clear whether the relationship between SF and the risk of HU is independent of these risk factors. Moreover, it is well known that the monosodium urate crystals, which are caused by increased SUA, can lead to inflammation in joints and surrounding tissues [13]. Previous studies showed that the concentrations of SF increase rapidly on exposure to trauma or infection [22], and remain high during the chronic phases of inflammatory process [23], so it is necessary to exclude those participants with acute inflammation, and adjust for the confounders of chronic inflammation. However, only a few studies had adjusted for the parameters of inflammation status, such as C-reactive protein (CRP) [15] or white blood cell count (WBC) [17]. Furthermore, the associations between other important proteins involved in iron metabolism, in addition to SF, such as transferrin and soluble transferrin receptors (sTfR), and SUA, have not been widely investigated. Hemoglobin (Hb) is the most commonly used hematological test to assess iron status, although some studies have demonstrated that Hb is not a good indicator of iron stores [24]. A previous study reported that Hb was significantly, positively correlated with the risk of HU [18]; however, it is still not clear whether this association between Hb and the risk of HU is independent of lifestyle factors and inflammation markers.
To date, no nationwide population-based studies have been conducted in China to explore the relationship between markers of body iron status and the risk of HU. Therefore, our nationwide population-based study, which regarded SF, transferrin, sTfR, and Hb as the primary exposures, with control for clustering of data at multiple levels (individual, household, community, and province), and adjustment for potential confounders, including age, gender, body mass index (BMI), dietary factors, physical activity, and inflammation status, was performed on a sample from a nationwide cross-sectional study. The purpose of the present study was to explore the aforementioned associations based on the following hypothesis: markers of iron status are associated with SUA concentrations and the risk of HU in the Chinese adult population.

2. Materials and Methods

2.1. Study Population

The data were extracted from the 2009 wave of the China Health and Nutrition Survey (CHNS), during which fasting blood collection and assessment were conducted for the first time. The CHNS, as an observational cohort study based on all community-dwelling subjects in 9 diverse provinces (Guangxi, Guizhou, Heilongjiang, Henan, Hubei, Hunan, Jiangsu, Liaoning, and Shandong) throughout China, aimed to understand the association between social and economic transformation of Chinese society, and the health and nutritional status of its population [25]. So far, there have been a total of nine waves of nutritional surveys, conducted in 1989, 1991, 1993, 1997, 2000, 2004, 2006, 2009, and 2011, respectively. For each wave, two cities in urban sites and four counties in rural sites were selected randomly in each selected province according to a weighted sampling scheme, and then primary sampling units (including urban and suburban neighborhoods within the selected cities, and villages and townships within the selected counties) were selected randomly. Twenty randomly selected households were surveyed within each unit, and all individuals within a household were interviewed. Details of the CHNS have been described elsewhere [25,26,27]. In the 2009 wave of CHNS, a total of 11,929 apparently healthy participants from 36 urban neighborhoods, 37 suburban neighborhoods, 37 towns, and 108 villages were enrolled. In the present study, our analyses were focused on the adult population aged 18 years and over (n = 10,081). We excluded 1434 participants without blood collection, 78 without blood assessments on SUA, SF, transferrin, sTfR, or Hb, 308 with acute inflammation (i.e., hs-CRP levels > 10 mg/L) [28,29], 4 with missing information on drinking and smoking, 150 without physical examination, 106 without assessing dietary intake, and 55 with pregnancy status, resulting in 7946 participants (3710 men and 4236 women) in the final analysis. All participants signed their written informed consent before participation in the study, and the research was reviewed and approved by the Institute Review Board of the University of North Carolina at Chapel Hill, and the National Institute of Nutrition and Food Safety, China Center for Disease Control and Prevention.

2.2. Laboratory Data

After at least 12 h of overnight fasting, a blood sample (12 mL) was collected by venipuncture in the morning. The blood sample (4 mL) was collected into a red-stoppered tube with separating gel, and was centrifuged 30 min after blood collection, at 3000× g for 15 min; serum samples were frozen and stored at −86 °C for later laboratory analysis. Another blood sample (500 μL) was collected into a lavender-stoppered tube with EDTA for routine blood examination. All samples were verified and analyzed in a national central lab in Beijing (medical laboratory accreditation certificate ISO 15189:2007) according to strict quality control standards [30,31,32]. SUA concentrations were measured with the use of an enzymatic colorimetric method on a Hitachi 7600 automated analyzer (Hitachi Inc., Tokyo, Japan) by determiner regents (Randox Laboratories Ltd., Crumlin, UK). SF concentrations were measured via radioimmunology on a gamma counter XH-6020 (North Institute of Bio-Tech, Beijing, China). Previous studies [28,29] have shown that hs-CRP > 10 mg/L is usually considered indicative of acute inflammatory processes, and an artificially higher SF concentration would be caused by inflammation, so we excluded those participants with an hs-CRP > 10 m/L, and multiplied SF values in the rest of the participants with an hs-CRP > 5 mg/L by 0.85 for male and 0.68 for female [33]. Serum transferrin and sTfR concentrations were both measured via nephelometry on a Siemens B-type natriuretic peptide assay (Siemens, Erlangen, Germany). Serum hs-CRP concentrations were measured with the use of a high-sensitivity immunoturbidimetric method on a Hitachi 7600 automated analyzer by determiner regents (Denka Seiken Co., Ltd., Niigata, Japan). Hb concentrations in whole blood were measured on a LH75 hematology analyzer (Beckman Coulter, Brea, CA, USA). The concentrations of SUA, SF, transferrin, sTfR, hs-CRP, and Hb measured in CHNS study have been used in previous studies [31,32,34,35,36,37]. HU was defined as SUA concentrations ≥ 7 mg/dL in men and ≥6 mg/dL in women [12,38].

2.3. Assessment of Dietary Intake

The dietary assessment in the CHNS was performed using a combination of three consecutive 24 h dietary recalls (including two weekdays and one weekend) at the individual level, and a food inventory weighting at the household level over the same three-day period. During one 24 h dietary assessment at household level, all foods and condiments remaining after the last meal of previous day, all foods purchased from markets or picked from gardens, food waste, as well as food inventory at the last meal of current day, were weighed using a digital kitchen scale with a minimum limit of 1 g and a maximum of 3 kg. Household food consumption on each day was determined by examining alterations of the inventory from the beginning to the end of the day. All the members of a household were asked to report all of the food consumed at home and away from home during the previous day, with the aid of food models and picture. The necessary information of each food consumed was collected and recorded by trained interviewers, including the types, amounts, types of meal, and locations of the meal. Individual amounts of food in each dish were estimated using the proportion of each dish consumed by each person combined with the household inventory. Detailed information of dietary data collection has been described elsewhere [26,39,40,41]. Dietary intakes of total energy, carbohydrate, protein, and fat, carbohydrate (E%, percentage of energy), protein (E%), and fat (E%) were calculated by CHNS based on means of the three 24 h recalls and the Chinese Food Composition Table 2004 and 2009 [42,43], and categorized into four groups according to their quartiles.

2.4. Assessment of Physical Activity and Other Covariates

Comprehensive data on physical activities were collected in the CHNS by staff-administered questionnaires, including four categories: domestic, occupational, transportation, and leisure physical activities. All activities were reported in average hours per week spent in the past year. The level of physical activity was assessed by using metabolic equivalent (MET)-hours-per-week, which was pooled by the total multiplications of time spent in each activity and specific MET value based on the Compendium of Physical Activities [44]. Using the measurement method of physical activity in the CHNS, a series of research findings of high quality have been published [26,45,46].
Measurement of weight without heavy clothes and shoes was taken by trained health workers, using a calibrated beam balance, to the nearest 0.1 kg. Measurement of height without shoes was taken using a portable SECA stadiometer to the nearest 0.1 cm. BMI was calculated as weight (kg) divided by height squared (m2). Other socioeconomic and lifestyle covariates, including age, gender, nationality, education, current smoking, and alcohol consumption, were measured with a structured questionnaire by trained and experienced interviewers.

2.5. Statistical Analyses
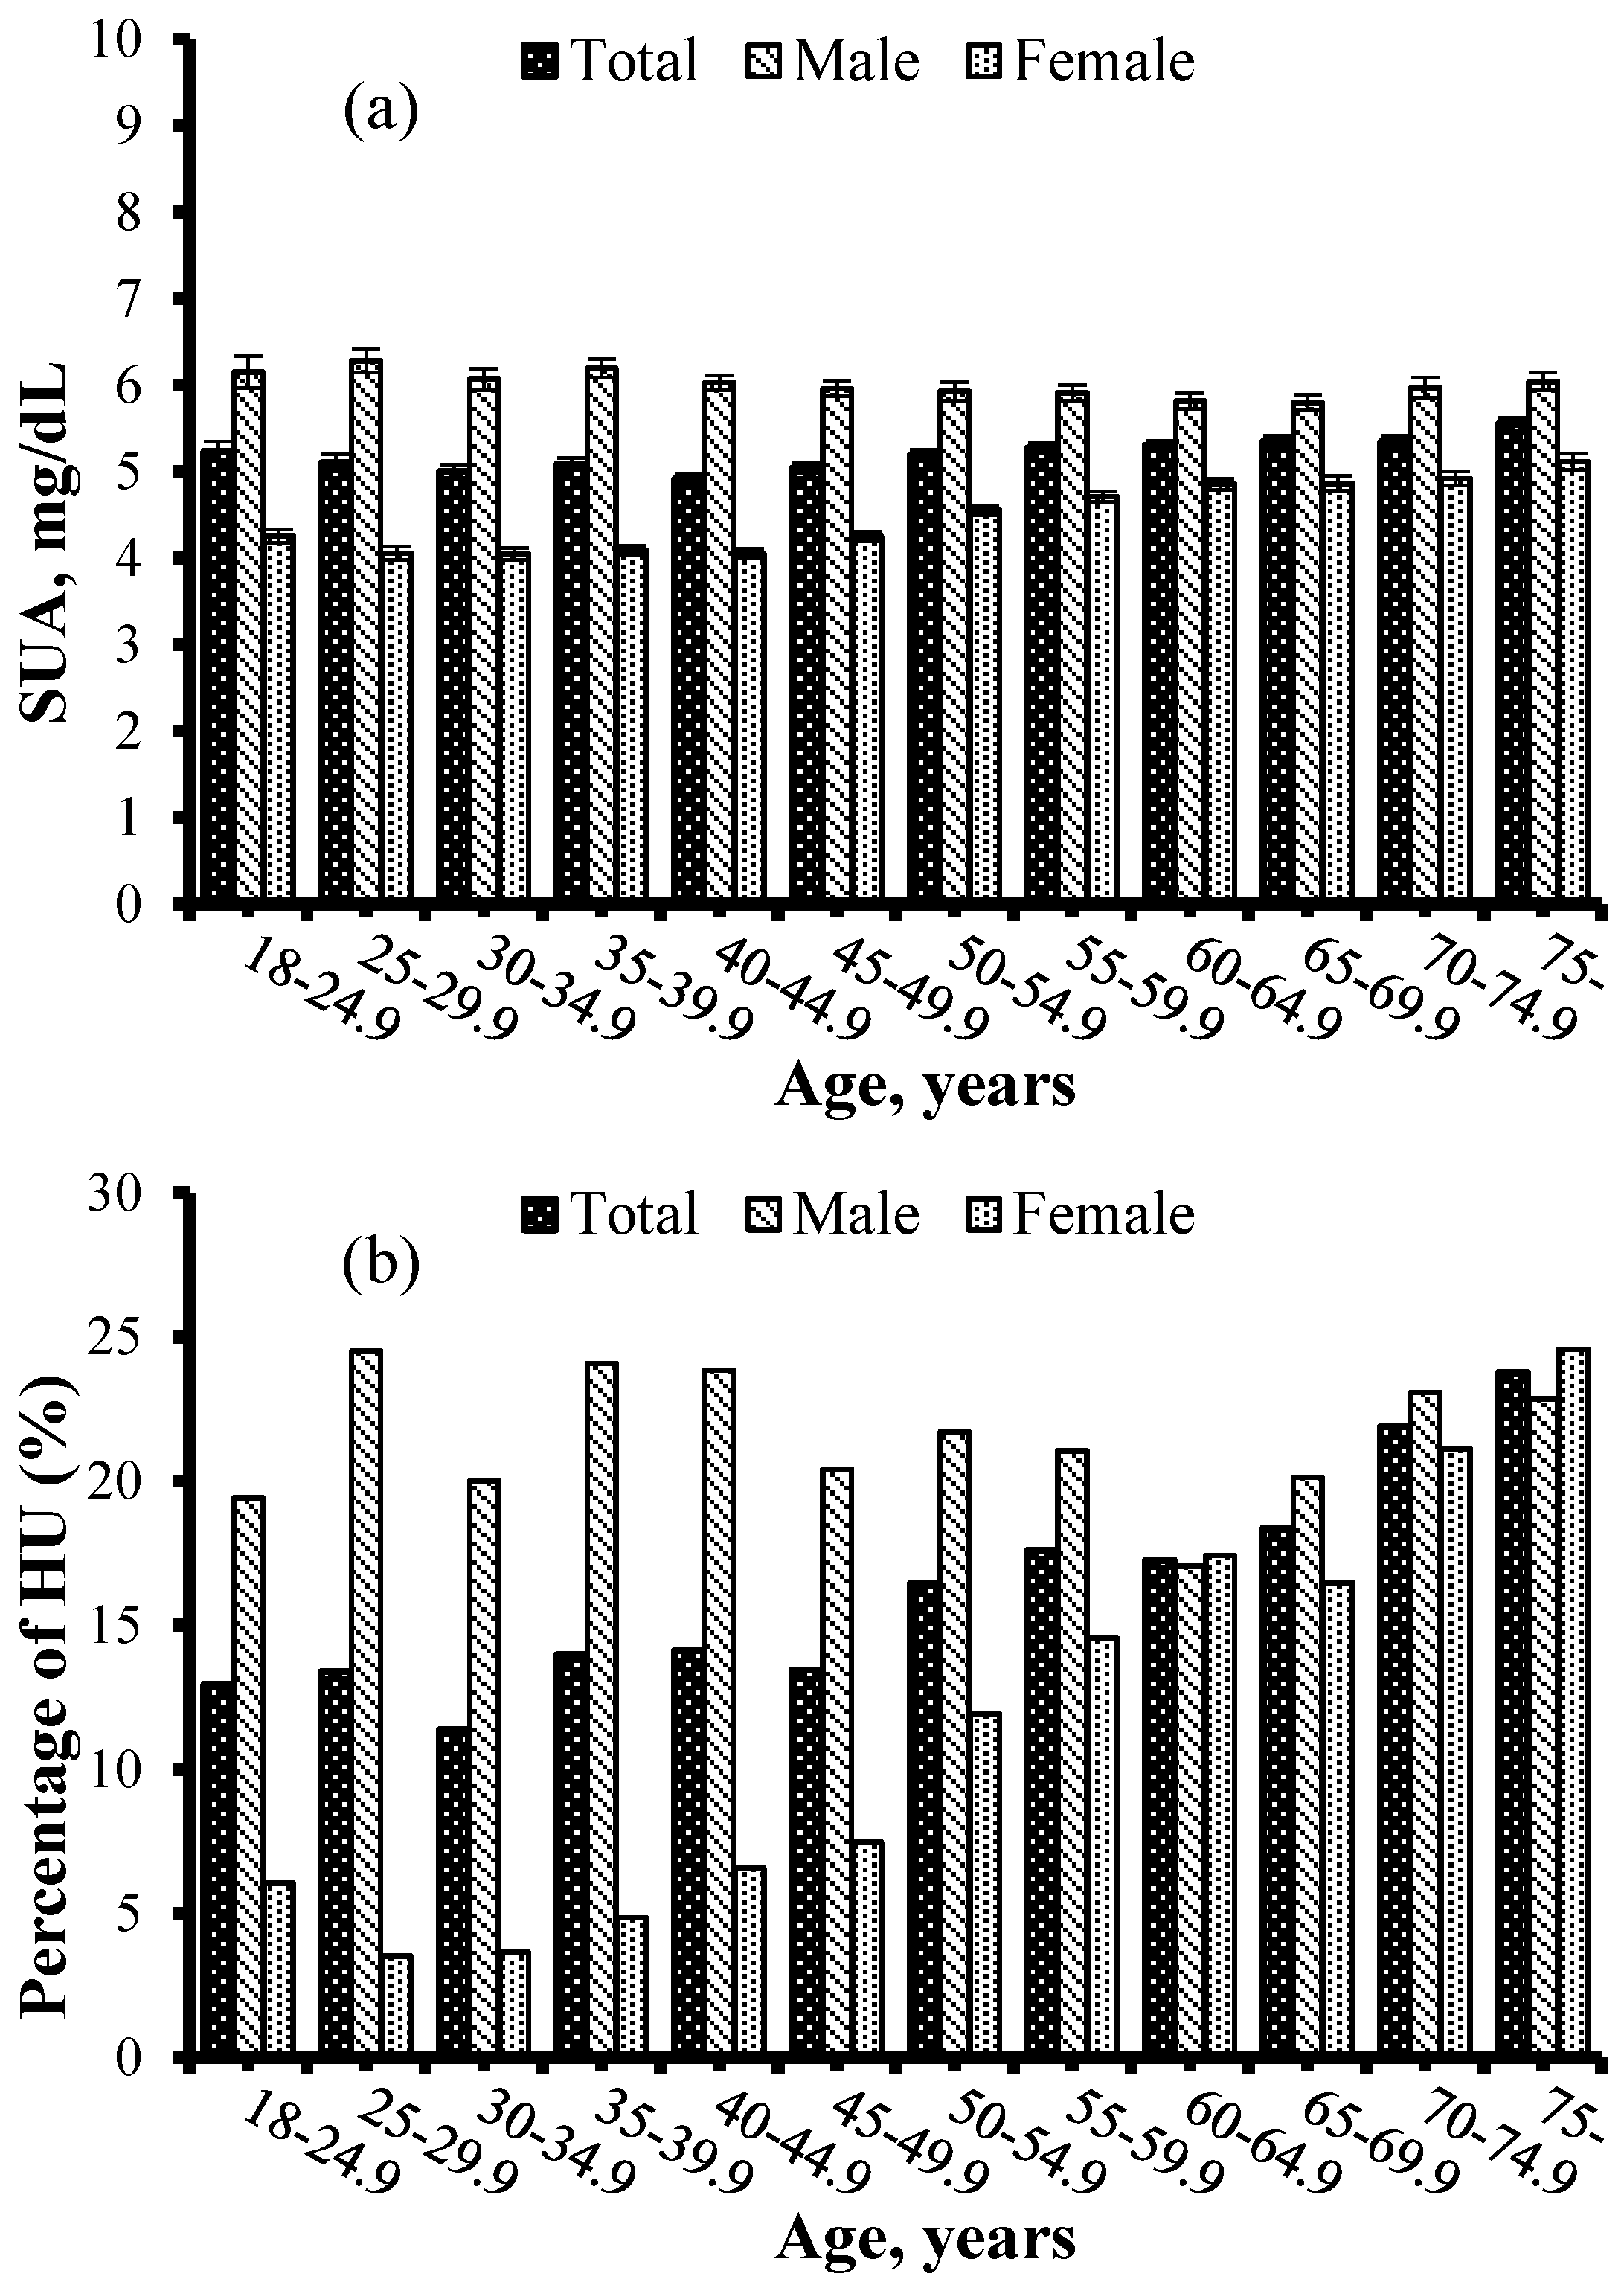
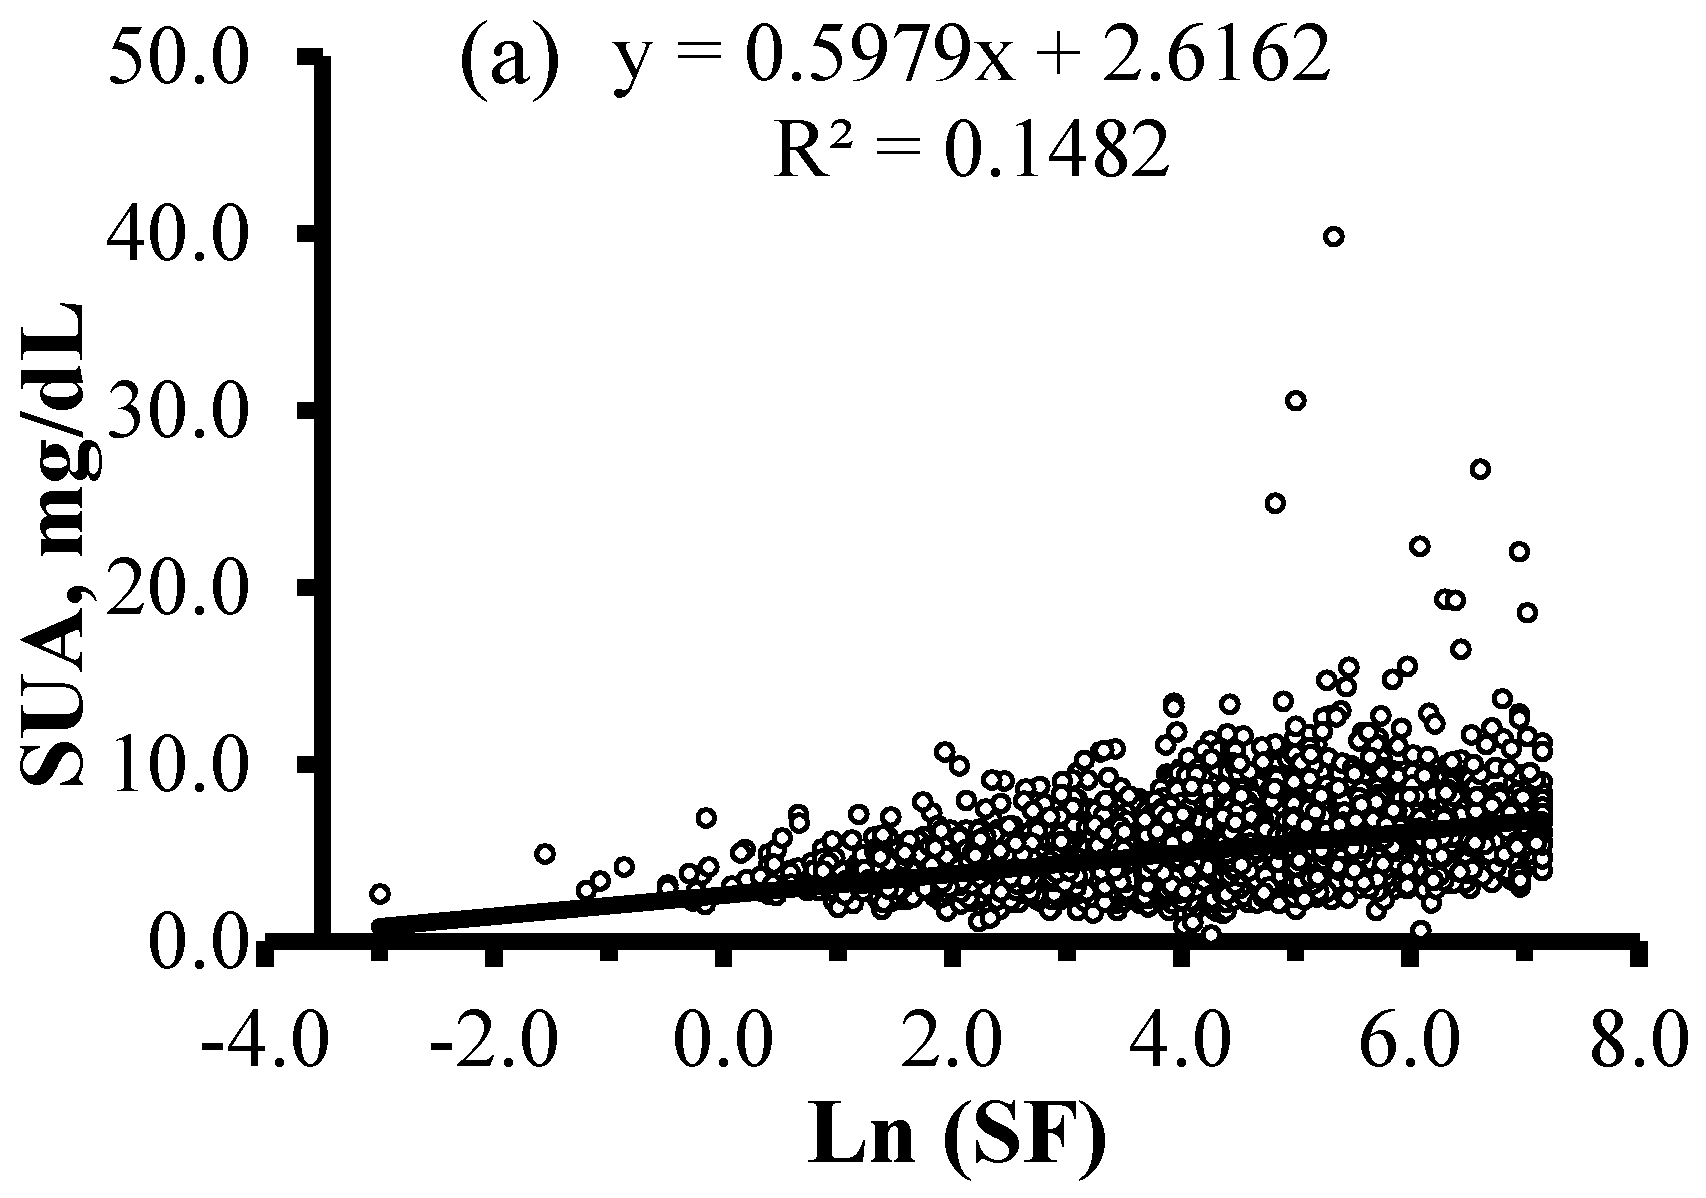
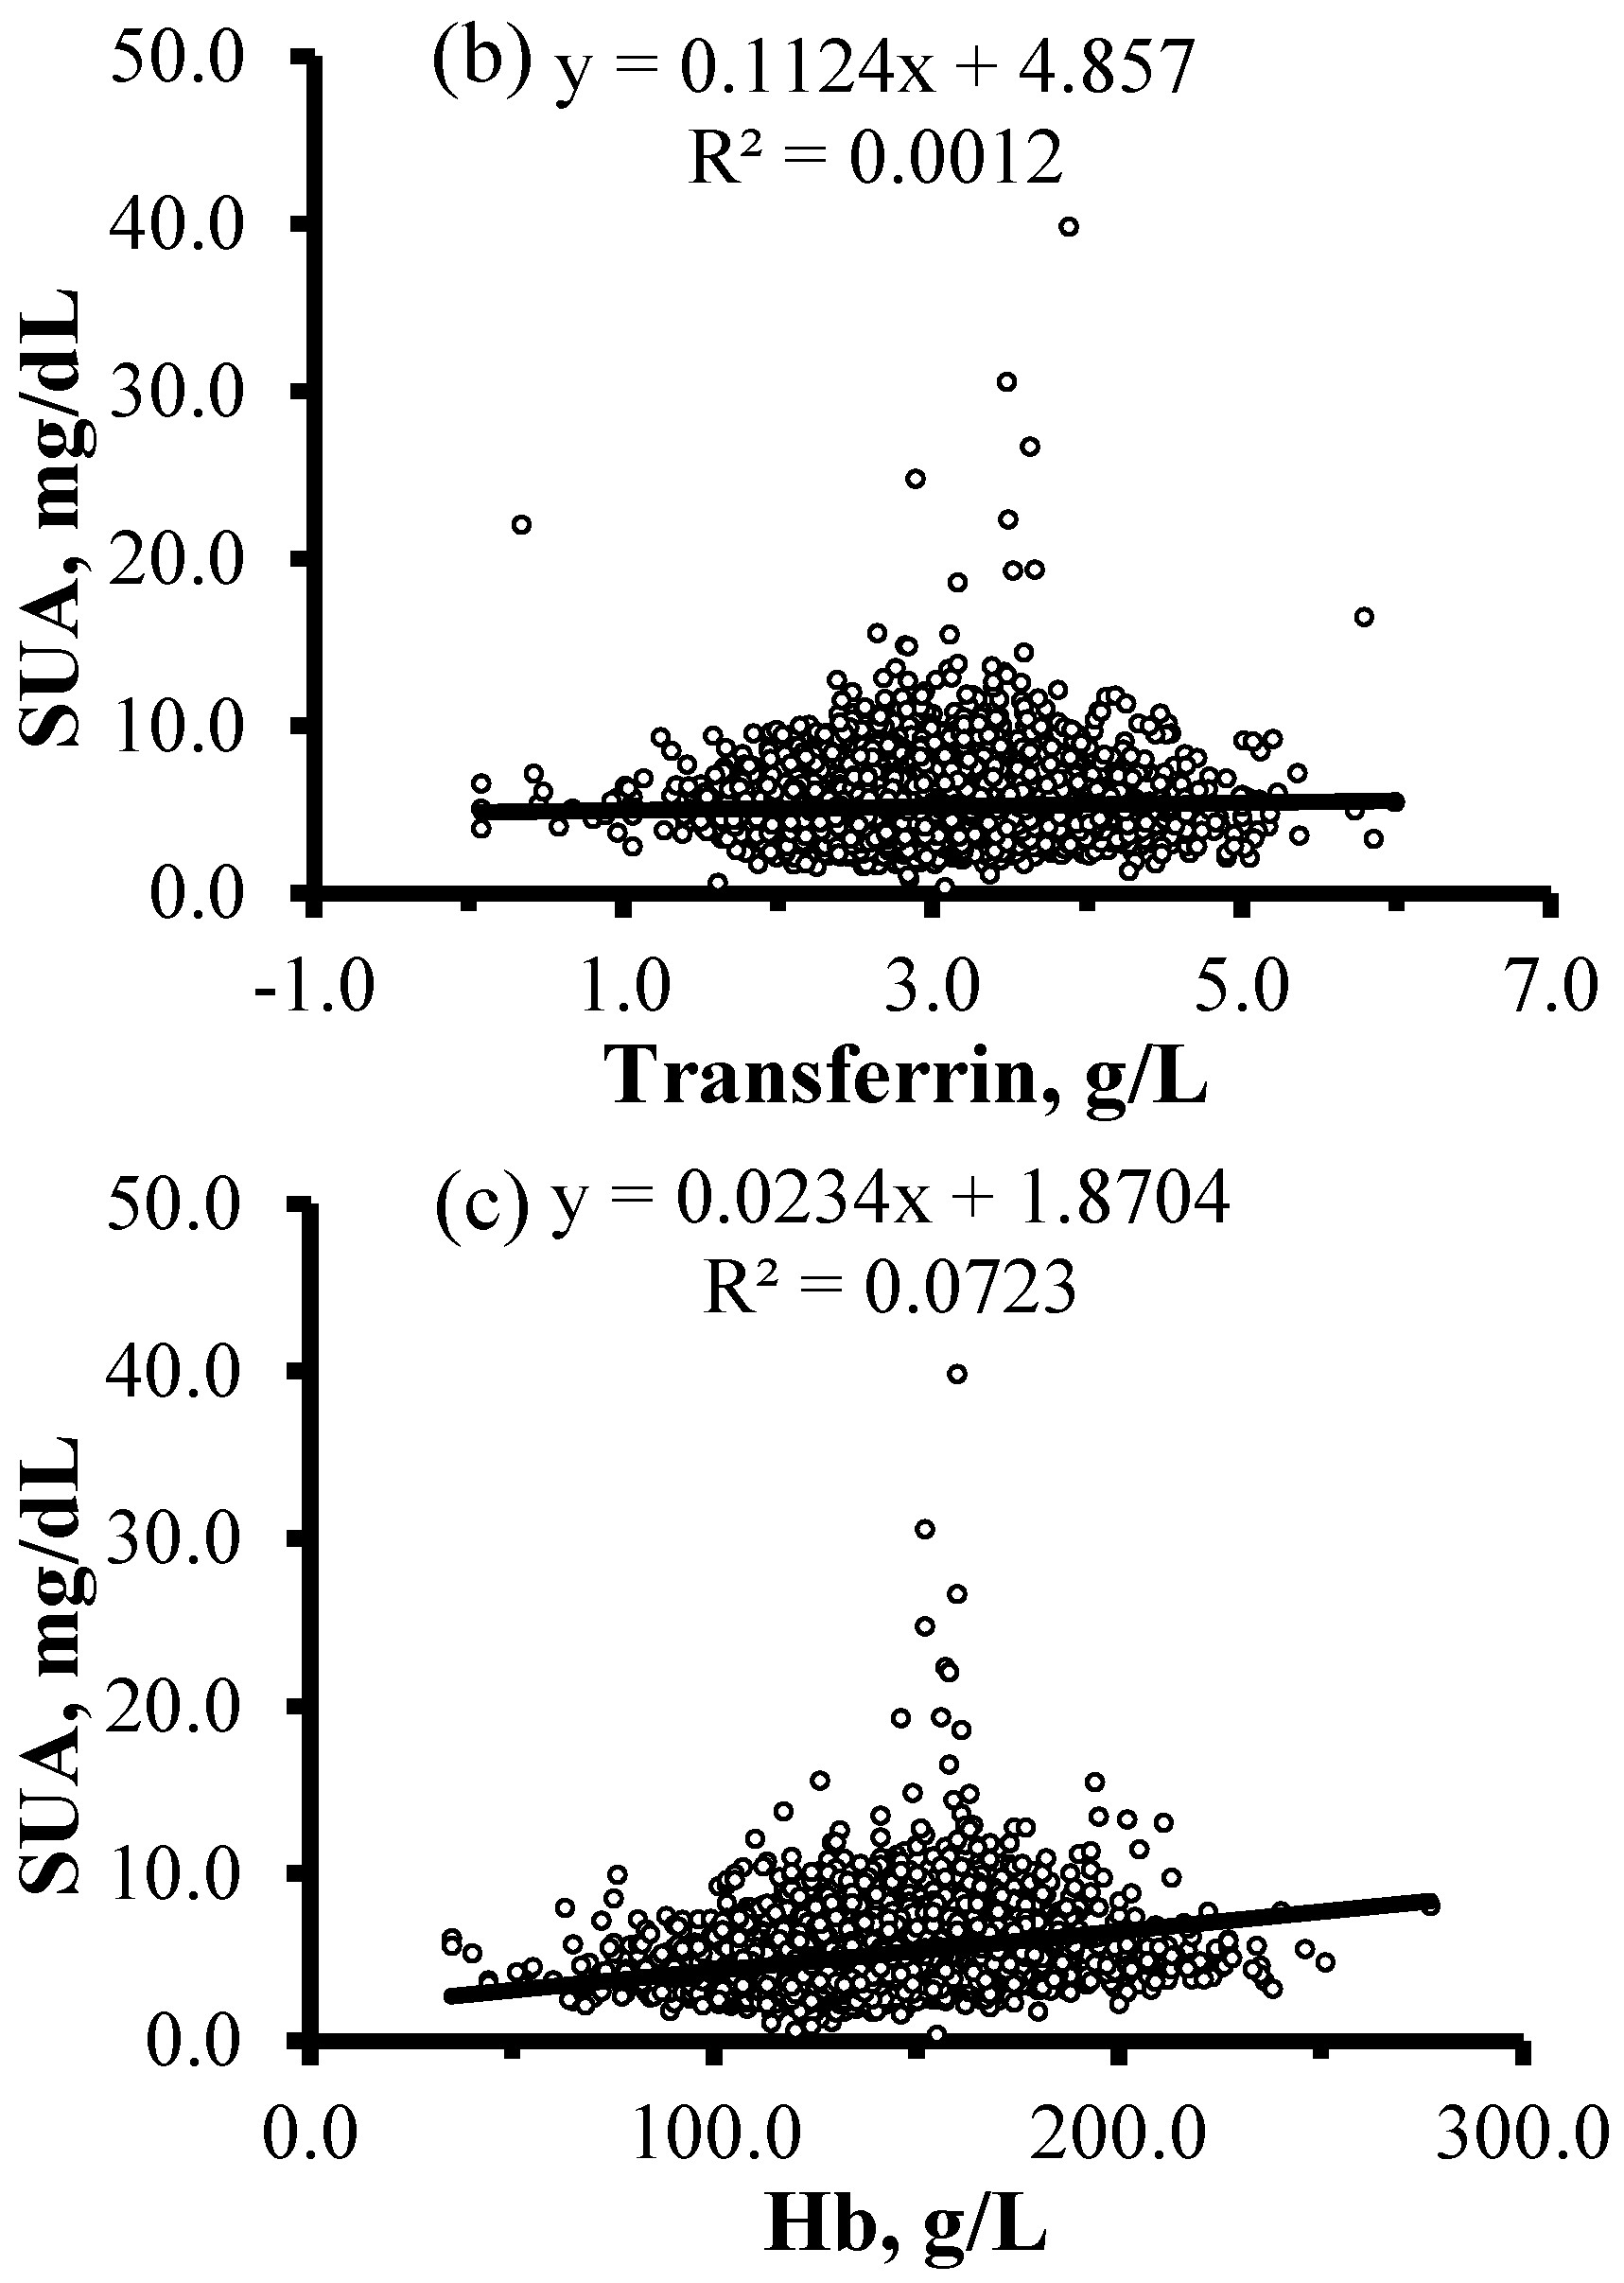
Before the progress of data analysis, Shapiro–Wilk test was used to determine whether characteristics of participants had a normal distribution or not. The characteristics of participants are presented as means ± standard deviation (SD), or medians (interquartile ranges) for quantitative variables with or without normal distribution, respectively, and percentages (n) for categorical variables, and were compared between participants with HU and the others by using Student’s t tests, Mann–Whitney U tests, or Chi-squared tests. Pearson’s correlations were explored to examine the correlations of SF, transferrin, and Hb with SUA after ln transformation of SF. To assess the associations of SF, transferrin, and Hb levels with SUA concentrations, the multilevel (four levels) mixed-effects linear regression models (SF, transferrin, and Hb levels) with individuals (level 1) nested within household (level 2), community (level 3), and province (level 4) were constructed using the statistical software MLwiN 2.36. Furthermore, multilevel mixed-effects logistic regression models were constructed to assess their associations with the risk of HU. β regression coefficients (and 95% confidence intervals (CIs)) in the linear regression and prospective odds ratios (ORs) (and 95% CIs) in the logistic regression were calculated for SUA and the risk of HU, respectively. We considered three sequential models in the aforementioned analyses: model 1 without any adjustments; model 2 adjusted for age, gender, BMI (<18.5 kg/m2, 18.5–24.9 kg/m2, 25.0–29.9 kg/m2, or ≥30 kg/m2), nationality (Han or others), education (≤6 years, 6.1–9.0 years, or >9 years), smoking status (current or not current), alcohol consumption (yes or no), and physical activity (quartile); model 3 adjusted as for model 2 plus total energy intake (quartile), protein intake (quartile), fat intake (quartile), carbohydrate (E%) (quartile), protein (E%) (quartile), fat (E%) (quartile), and inflammation status (hs-CRP levels < 1 mg/L, 1–3 mg/L, or 4–10 mg/L) [47]. Descriptive and correlation analyses were carried out using the Statistical Package for the Social Sciences (SPSS Inc., Chicago, IL, USA). All statistical tests were 2-sided, and p < 0.05 was considered statistically significant.

3. Results

Participant characteristics in the present study are displayed in Table 1. Compared with participants without HU, those with HU were more likely to belong to urban residents, be older, be male, have higher education, have higher BMI, smoke tobacco, consume alcohol, have lower levels of physical activity, and more likely to have higher intakes of total energy, protein, and fat. The percentages of energy intake from protein and fat were significantly higher, and the percentage of energy intake from carbohydrate was significantly lower in participants with HU when compared to the others. Remarkably, participants with HU had significantly higher concentrations of SF, transferrin, Hb, and hs-CRP when compared to those without HU. However, there were no significant differences in nationality, dietary carbohydrate intake, and sTfR levels between the two groups.
Figure 1 presents mean concentrations of SUA and the prevalence of HU according to age and gender. The mean concentrations of SUA were 5.2 ± 1.8 mg/dL, and male subjects had significantly higher concentrations of SUA than female participants (6.0 ± 1.9 mg/dL vs. 4.5 ± 1.3 mg/dL, p < 0.001). The crude prevalence of HU in the study population was 16.1% (21.4% in male and 11.4% in female). The concentrations of SUA and the prevalence of HU increased together with age in the total sample (all p-trend < 0.001). The concentrations of SUA decreased along with age in the male participants (p-trend = 0.010), whereas increased in the female participants (p-trend < 0.001). The prevalence of participants with HU increased in the female participants (p-trend < 0.001), but remained almost stable in male participants (p-trend = 0.531). Prior to controlling for an effect of any variable, there were significant, positive correlations of SUA with ln(SF), transferrin, and Hb (r = 0.385, p < 0.001; r = 0.035, p = 0.002; r = 0.269, p < 0.001, respectively) (Figure 2).
The concentrations of SF, transferrin, and Hb were significantly, positively associated with SUA concentrations in a dose–response manner (all p-trend < 0.001) after controlling for clustering of data at multiple levels (individual, household, community, and province) and adjustment for potential confounders, including age, gender, nationality, education, BMI, smoking status, alcohol consumption, and physical activity (Table 2). Those dose–response associations did not change when further adjusted for dietary intakes of total energy, protein, and fat, carbohydrate (E%), protein (E%), fat (E%), and inflammation status, or when restricted to men or women (Tables S1 and S2). Compared with participants with the lowest quartile of SF, those with the highest quartile showed significantly higher SUA concentrations (by 0.899 mg/dL, 95% CI: 0.788, 1.010; p < 0.001). Similarly, participants with the highest quartiles of transferrin or Hb presented significantly higher SUA concentrations by 0.488 mg/dL (95% CI: 0.389, 0.587; p < 0.001) or 0.353 mg/dL (95% CI: 0.235, 0.471; p < 0.001), respectively, when compared to those in the reference groups.
To examine the associations of SF, transferrin, and Hb with the prevalence of HU, we applied multilevel logistic regression models. The concentrations of SF and transferrin were significantly, positively associated with the prevalence of HU in a dose–response manner (all p-trend < 0.05) after controlling for cluster effects and adjustment for potential confounders, including age, gender, nationality, education, BMI, smoking status, alcohol consumption, and physical activity (Table 3). Those dose–response associations did not change when further adjusted for intakes of total energy, protein, and fat, carbohydrate (E%), protein (E%), fat (E%), and inflammation status, or when restricted to men or women (Tables S3 and S4). Compared with participants with the lowest quartile of SF levels, those with the highest quartile had significantly increased the risk of HU (OR: 3.086; 95% CI: 2.450, 3.888; p < 0.001). Similarly, compared with participants with the lowest quartile of transferrin levels, those with the highest quartile had significantly increased risk of HU (OR: 1.900; 95% CI: 1.579, 2.286; p < 0.001). Though significant, positive associations between Hb and the risk of HU were found in total participants and male participants (p-trend < 0.05), those associations were not found in female participants (p-trend > 0.05). Compared with participants with the lowest quartile of Hb levels, those with the highest quartile tended to have increased the risk of HU (OR: 1.218; 95% CI: 0.984, 1.507; p = 0.070). In male participants, those with the highest quartile of Hb levels had significantly higher risk of HU when compared to the reference group (OR: 1.401; 95% CI: 1.104, 1.777; p < 0.01); however, this association was not found in female participants (OR: 1.093; 95% CI: 0.821, 1.455; p = 0.544).

4. Discussion

This nationwide population-based study suggested that HU was one of the common metabolic disorders in Chinese adults, and its prevalence increased along with age, especially in female adults. It was found that ln(SF), transferrin, and Hb levels were significantly, positively correlated with SUA concentrations in our study. Furthermore, we found that levels of SF, transferrin, and Hb were positively associated with SUA concentrations and risk of HU, after controlling for cluster effects and adjustment for potential confounders. However, a significant association between Hb levels and the risk of HU was not found in female participants.
The data for this study were derived from CHNS, a large-scale longitudinal, household-based survey in China. The CHNS was designed to represent a set of large provinces which cover approximately 56% of the Chinese population, and those chosen provinces represented a range of demographic and economic variation in China [31]. The crude prevalence rate of HU (16.1% overall, 21.4% in male, and 11.4% in female) was highly comparable to the Australian population-based study (16.6% overall, 17.8% in male, and 15.4% in female) [48], and close to the 15.6% overall prevalence (20.6% in male and 13.5% in female) in the Mexican population [49]. It was lower than the longitudinal, nationwide databases of selected populations in the US (21.4% overall, 21.2% in male and 21.6% in female) [38] and Japan (25.8% overall, 34.5% in male and 11.6% in female) [50]. From a systematic review and meta-analysis [51] on relevant articles from 2000 to 2014, population-based Chinese studies reported a prevalence ranging from 7.5% to 23.6%, and the pooled prevalence of HU was 13.3% (19.4% in male and 7.9% in female), which was in accordance with our study. Our result showed that the prevalence of HU increased with advancing age, and was higher in men than women, which was consistent with many previous studies [38,48,50,52]. The analysis has shown the prevalence of HU among females was positively associated with age, whereas among males, this significant association was not found. Those gender-specific associations between HU and age agreed with findings from previous studies [50,52].
Based on existing evidence, this is the first study conducted on a large nationwide population, which aims to explore the association of SF, transferrin, and Hb levels with SUA concentrations and prevalence of HU in the Chinese population. In this study, we observed that SF levels were significantly, positively associated with SUA concentrations, and the prevalence of HU after controlling for cluster effects and adjustment for potential confounders. Such findings were consistent with several previous studies. For example, Ghio et al. [2] found that SF concentrations correlated positively with SUA concentrations after adjustment of confounding factors in 9726 healthy Americans. Mainous et al. [16] reached a similar conclusion in the same cohort that elevated levels of SUA were associated with elevated levels of SF, and might serve as a risk stratification variable for presence of iron overload. Flais et al. [15] reported that the increase in uricemia was associated with the increase in SF in 738 French patients with hemochromatosis. Zhang et al. [17] conducted a 3-year study on a large company-based cohort of Chinese employees, and found that high SF levels increased the risk of HU. The associations of dietary factors, physical activity, and hs-CRP with SUA concentrations, were reported in a substantial number of previous studies [12,13,53,54,55,56]. Thus, we constructed a series of statistical models to control the influences from the aforementioned potential confounders. Our results indicated that the positive associations of SF levels with SUA concentrations and the prevalence of HU were stable in the large-scale human study, and were independent of effects of the survey area, age, gender, BMI, race/nationality, smoking, drinking, physical activity, dietary intake, and inflammation status. Iron transport in the plasma is performed by transferrin, which transfers iron into cells through its interaction with transferrin receptors (TfR) [57]. In our study, we firstly reported that transferrin levels were associated with SUA concentrations and the risk of HU, which was involved in iron metabolism. In the present study, we found that Hb levels were significantly, positively associated with SUA concentrations and the risk of HU, in agreement with the findings from previous studies with small sample size [18,58].
The details of the underlying mechanism about the effects of SF, transferrin, and Hb on SUA remain to be determined. Ferritin can convert Fe2+ to Fe3+, due to its high iron-binding capacity and ferroxidase activity. The majority of intracellular iron is stored in ferritin as a compact, safe way to prevent the toxic effects of iron and make iron available when necessary; therefore, SF is widely used to evaluate iron status in clinical practice [59]. About 70% of the body’s iron is found in red blood cells, which constitutes the crucial part of Hb. SUA, as a major antioxidant in human blood, can form a 2:1 complex with Fe3+ ions to inhibit iron-catalyzed oxidations [60,61]. The relationships of SF and Hb with HU could be a response to oxidative stress linked with the visceral toxicity of excess non-transferrin bound iron via the antioxidant properties of SUA [15]. Xanthine oxidase (XO), one of the key purine metabolism enzymes responsible for producing SUA, may be involved in this process. Elevated expression and activity of XO following exposure to iron was observed in both in vivo and in vitro studies [62,63,64]. On the contrary, lung XO and total xanthine oxidoreductase activities were reduced in rats fed an iron-depleted diet [64]. The production of pro-inflammatory cytokines (including TNF-α, IL-1, and IL-6) secondary to oxidative stress induced by iron overload, could also take part in increasing XO activity [65]. Another underlying mechanism of the relationship between SF and SUA might be due to insulin sensitivity. Accumulating evidence suggests that elevated SF levels is associated with higher fasting insulin levels, insulin resistance, and an increased risk of diabetes [66,67,68]. Contrarily, a protective factor for the development of diabetes was observed in healthy people with frequent blood donation, leading to decreased iron stores [69]. Higher insulin levels and insulin resistance can reduce renal excretion of urate, and contribute to increase uric acid synthesis [70,71,72]. Therefore, the link between SF and insulin sensitivity may be translated into an independent association between elevated SF and the pathogenesis of HU.
There are several limitations in our study. First, with regard to the cross-sectional nature, it is not appropriate to establish a causal relationship in our study, and the temporal effects of SF, transferrin, and Hb on the development of HU remains to be understood. Second, even though numbers of confounders were adjusted, we cannot rule out the possibility that unmeasured factors or residual confounding might contribute to the observed associations given the nature of our observational study. The third limitation was the lack of information on the menopausal status, but a soaring increase of HU in female aged 50 years or over was observed in our study.

5. Conclusions

Our findings indicated that SF, transferrin, and Hb were positively associated with SUA concentrations and the prevalence of HU in the Chinese adult population. Additional studies are needed to confirm these findings, as well as to elucidate their underlying mechanisms. To prevent or delay the progression of gout and some other NCDs, substantial attention has been devoted in recent years to controlling their potentially modifiable risk factors. Thus, further studies are warranted to determine whether SF, transferrin, and Hb reduction may improve the HU risk factors, and thereby reduce the risk of developing gout, diabetes mellitus, cardiovascular diseases, nonalcoholic fatty liver disease, and cancer.

Supplementary Materials

The following are available online at https://www.mdpi.com/2072-6643/10/2/191/s1, Table S1: Multilevel-adjusted associations of SF, transferrin, and Hb levels with SUA concentrations in male adult population (n = 3710), Table S2: Multilevel-adjusted associations of SF, transferrin, and Hb levels with SUA concentrations in female adult population (n = 4236), Table S3: Multilevel-adjusted associations of SF, transferrin, and Hb levels with the risk of HU in male adult population (n = 3710), Table S4: Multilevel-adjusted associations of SF, transferrin, and Hb with the risk of HU in female adult population (n = 4236).

Acknowledgments

This research was based on the data from the 2009 wave of the CHNS. The authors are indebted to all subjects who participated in the nationwide population-based study. The authors also thank the team at the National Institute for Nutrition and Health, Chinese Center for Disease Control and Prevention, the Carolina Population Center, University of North Carolina at Chapel Hill, and the China–Japan Friendship Hospital, Ministry of Health who support for CHNS 2009.

Author Contributions

Yong Xue, Guifang Guo and Qian Lu contributed to the conception and design of the research. Yong Xue and Kai Yu performed statistical analyses. Xiangping Li, Yong Xue, Tingchao He and Rashad Alkasir drafted the manuscript. Yong Xue acquired the data from the open database for CHNS (http://www.cpc.unc.edu/projects/china/data/datasets/longitudinal/datasets). All the authors critically revised the paper and approved the final version of the manuscript.

Conflicts of Interest

All authors declare that there is no conflict of interest. No funding to declare. This research received no specific grant from any funding agency in the public, commercial, or non-profit sectors.

Abbreviations

BMIbody mass index
CHNSthe China Health and Nutrition Survey
CIconfidence interval
CRPC-reactive protein
E%percentage of energy
Hbhemoglobin
hs-CRPhigh-sensitivity C-reactive protein
HUhyperuricemia
IL-6interleukin-6
METmetabolic equivalent
NCDsnon-communicable diseases
ORodds ratio
Ref.reference
SDstandard deviation
SEstandard error
SFserum ferritin
sTfRsoluble transferrin receptors
SUAserum uric acid
TfRtransferrin receptors
TNF-αtumor necrosis factor alpha
WBCwhite blood cell count
XOxanthine oxidase

References

  1. Ames, B.N.; Cathcart, R.; Schwiers, E.; Hochstein, P. Uric acid provides an antioxidant defense in humans against oxidant- and radical-caused aging and cancer: A hypothesis. Proc. Natl. Acad. Sci. USA 1981, 78, 6858–6862. [Google Scholar] [CrossRef] [PubMed]
  2. Ghio, A.J.; Ford, E.S.; Kennedy, T.P.; Hoidal, J.R. The association between serum ferritin and uric acid in humans. Free Radic. Res. 2005, 39, 337–342. [Google Scholar] [CrossRef] [PubMed]
  3. Nakayama, A.; Nakaoka, H.; Yamamoto, K.; Sakiyama, M.; Shaukat, A.; Toyoda, Y.; Okada, Y.; Kamatani, Y.; Nakamura, T.; Takada, T.; et al. Gwas of clinically defined gout and subtypes identifies multiple susceptibility loci that include urate transporter genes. Ann. Rheum. Dis. 2017, 76, 869–877. [Google Scholar] [CrossRef] [PubMed]
  4. Sluijs, I.; Beulens, J.W.; van der A, D.L.; Spijkerman, A.M.; Schulze, M.B.; van der Schouw, Y.T. Plasma uric acid is associated with increased risk of type 2 diabetes independent of diet and metabolic risk factors. J. Nutr. 2013, 143, 80–85. [Google Scholar] [CrossRef] [PubMed]
  5. Zhao, G.; Huang, L.; Song, M.; Song, Y. Baseline serum uric acid level as a predictor of cardiovascular disease related mortality and all-cause mortality: A meta-analysis of prospective studies. Atherosclerosis 2013, 231, 61–68. [Google Scholar] [CrossRef] [PubMed]
  6. Gong, S.; Song, J.; Wang, L.; Zhang, S.; Wang, Y. Hyperuricemia and risk of nonalcoholic fatty liver disease: A systematic review and meta-analysis. Eur. J. Gastroenterol. Hepatol. 2016, 28, 132–138. [Google Scholar] [CrossRef] [PubMed]
  7. Fini, M.A.; Elias, A.; Johnson, R.J.; Wright, R.M. Contribution of uric acid to cancer risk, recurrence, and mortality. Clin. Transl. Med. 2012, 1, 16. [Google Scholar] [CrossRef] [PubMed]
  8. Trifiro, G.; Morabito, P.; Cavagna, L.; Ferrajolo, C.; Pecchioli, S.; Simonetti, M.; Bianchini, E.; Medea, G.; Cricelli, C.; Caputi, A.P.; et al. Epidemiology of gout and hyperuricaemia in italy during the years 2005–2009: A nationwide population-based study. Ann. Rheum. Dis. 2013, 72, 694–700. [Google Scholar] [CrossRef] [PubMed]
  9. Guan, S.; Tang, Z.; Fang, X.; Wu, X.; Liu, H.; Wang, C.; Hou, C. Prevalence of hyperuricemia among Beijing post-menopausal women in 10 years. Arch. Gerontol. Geriatr. 2016, 64, 162–166. [Google Scholar] [CrossRef] [PubMed]
  10. Kamdem, F.; Doualla, M.S.; Lekpa, F.K.; Temfack, E.; Nouga, Y.N.; Donfack, O.S.; Dzudie, A.; Kingue, S. Prevalence and factors associated with hyperuricaemia in newly diagnosed and untreated hypertensives in a sub-Saharan african setting. Arch. Cardiovasc. Dis. 2016, 109, 527–532. [Google Scholar] [CrossRef] [PubMed]
  11. Xie, D.X.; Xiong, Y.L.; Zeng, C.; Wei, J.; Yang, T.; Li, H.; Wang, Y.L.; Gao, S.G.; Li, Y.S.; Lei, G.H. Association between low dietary zinc and hyperuricaemia in middle-aged and older males in China: A cross-sectional study. BMJ Open 2015, 5, e008637. [Google Scholar] [CrossRef] [PubMed]
  12. Veronese, N.; Stubbs, B.; Trevisan, C.; Bolzetta, F.; De Rui, M.; Maggi, S.; Sartori, L.; Musacchio, E.; Zambon, S.; Perissinotto, E.; et al. Results of a observational cohort study of Hyperuricemia as a predictor of poor physical performance in the Elderly. Arthritis Care Res. (Hoboken) 2017, 69, 1238–1244. [Google Scholar] [CrossRef] [PubMed]
  13. Yang, T.; Ding, X.; Wang, Y.L.; Zeng, C.; Wei, J.; Li, H.; Xiong, Y.L.; Gao, S.G.; Li, Y.S.; Lei, G.H. Association between high-sensitivity C-reactive protein and hyperuricemia. Rheumatol. Int. 2016, 36, 561–566. [Google Scholar] [CrossRef] [PubMed]
  14. Voruganti, V.S.; Laston, S.; Haack, K.; Mehta, N.R.; Cole, S.A.; Butte, N.F.; Comuzzie, A.G. Serum uric acid concentrations and SLC2A9 genetic variation in Hispanic children: The Viva La Familia Study. Am. J. Clin. Nutr. 2015, 101, 725–732. [Google Scholar] [CrossRef] [PubMed]
  15. Flais, J.; Bardou-Jacquet, E.; Deugnier, Y.; Coiffier, G.; Perdriger, A.; Chales, G.; Ropert, M.; Loreal, O.; Guggenbuhl, P. Hyperferritinemia increases the risk of hyperuricemia in HFE-hereditary hemochromatosis. Jt. Bone Spine 2017, 84, 293–297. [Google Scholar] [CrossRef] [PubMed]
  16. Mainous, A.G., III; Knoll, M.E.; Everett, C.J.; Matheson, E.M.; Hulihan, M.M.; Grant, A.M. Uric acid as a potential cue to screen for iron overload. J. Am. Board Fam. Med. 2011, 24, 415–421. [Google Scholar] [CrossRef] [PubMed]
  17. Zhang, Y.N.; Xu, C.; Xu, L.; Yu, C.; Miao, M.; Xie, J.; Li, Y. High serum ferritin levels increase the risk of hyperuricemia: A cross-sectional and longitudinal study. Ann. Nutr. Metab. 2014, 64, 6–12. [Google Scholar] [CrossRef] [PubMed]
  18. Su, P.; Hong, L.; Zhao, Y.; Sun, H.; Li, L. The association between hyperuricemia and hematological indicators in a Chinese adult population. Medicine (Baltimore) 2016, 95, e2822. [Google Scholar] [CrossRef] [PubMed]
  19. Beyl, R.N., Jr.; Hughes, L.; Morgan, S. Update on importance of diet in gout. Am. J. Med. 2016, 129, 1153–1158. [Google Scholar] [CrossRef] [PubMed]
  20. Liu, L.; Lou, S.; Xu, K.; Meng, Z.; Zhang, Q.; Song, K. Relationship between lifestyle choices and hyperuricemia in Chinese men and women. Clin. Rheumatol. 2013, 32, 233–239. [Google Scholar] [CrossRef] [PubMed]
  21. Yang, T.; Zhang, Y.; Wei, J.; Zeng, C.; Li, L.J.; Xie, X.; Wang, Y.L.; Xie, D.X.; Li, H.; Yang, C.; et al. Relationship between cigarette smoking and hyperuricemia in middle-aged and elderly population: A cross-sectional study. Rheumatol. Int. 2017, 37, 131–136. [Google Scholar] [CrossRef] [PubMed]
  22. Feelders, R.A.; Vreugdenhil, G.; Eggermont, A.M.; Kuiper-Kramer, P.A.; van Eijk, H.G.; Swaak, A.J. Regulation of iron metabolism in the acute-phase response: Interferon gamma and tumour necrosis factor alpha induce hypoferraemia, ferritin production and a decrease in circulating transferrin receptors in cancer patients. Eur. J. Clin. Investig. 1998, 28, 520–527. [Google Scholar] [CrossRef]
  23. Northrop-Clewes, C.A. Interpreting indicators of iron status during an acute phase response—Lessons from malaria and human immunodeficiency virus. Ann. Clin. Biochem. 2008, 45, 18–32. [Google Scholar] [CrossRef] [PubMed]
  24. Asobayire, F.S.; Adou, P.; Davidsson, L.; Cook, J.D.; Hurrell, R.F. Prevalence of iron deficiency with and without concurrent anemia in population groups with high prevalences of malaria and other infections: A study in cote d’ivoire. Am. J. Clin. Nutr. 2001, 74, 776–782. [Google Scholar] [PubMed]
  25. Popkin, B.M.; Du, S.; Zhai, F.; Zhang, B. Cohort profile: The China Health and Nutrition Survey—Monitoring and understanding socio-economic and health change in China, 1989–2011. Int. J. Epidemiol. 2010, 39, 1435–1440. [Google Scholar] [CrossRef] [PubMed]
  26. He, K.; Du, S.; Xun, P.; Sharma, S.; Wang, H.; Zhai, F.; Popkin, B. Consumption of monosodium glutamate in relation to incidence of overweight in Chinese adults: China Health and Nutrition Survey (CHNS). Am. J. Clin. Nutr. 2011, 93, 1328–1336. [Google Scholar] [CrossRef] [PubMed]
  27. Attard, S.M.; Herring, A.H.; Mayer-Davis, E.J.; Popkin, B.M.; Meigs, J.B.; Gordon-Larsen, P. Multilevel examination of diabetes in modernising China: What elements of urbanisation are most associated with diabetes? Diabetologia 2012, 55, 3182–3192. [Google Scholar] [CrossRef] [PubMed] [Green Version]
  28. Martins, O.M.; Fonseca, V.F.; Borges, I.; Martins, V.; Portal, V.L.; Pellanda, L.C. C-Reactive protein predicts acute myocardial infarction during high-risk noncardiac and vascular surgery. Clinics (Sao Paulo) 2011, 66, 773–776. [Google Scholar] [PubMed]
  29. Pearson, T.A.; Mensah, G.A.; Alexander, R.W.; Anderson, J.L.; Cannon, R.O., 3rd; Criqui, M.; Fadl, Y.Y.; Fortmann, S.P.; Hong, Y.; Myers, G.L.; et al. Markers of inflammation and cardiovascular disease: Application to clinical and public health practice: A statement for healthcare professionals from the centers for disease control and prevention and the American heart association. Circulation 2003, 107, 499–511. [Google Scholar] [CrossRef] [PubMed]
  30. Zhan, Y.; Chen, R.; Zheng, W.; Guo, C.; Lu, L.; Ji, X.; Chi, Z.; Yu, J. Association between serum magnesium and anemia: China health and nutrition survey. Biol. Trace Elem. Res. 2014, 159, 39–45. [Google Scholar] [CrossRef] [PubMed]
  31. Yan, S.; Li, J.; Li, S.; Zhang, B.; Du, S.; Gordon-Larsen, P.; Adair, L.; Popkin, B. The expanding burden of cardiometabolic risk in China: The China health and nutrition survey. Obes. Rev. 2012, 13, 810–821. [Google Scholar] [CrossRef] [PubMed]
  32. Han, L.L.; Wang, Y.X.; Li, J.; Zhang, X.L.; Bian, C.; Wang, H.; Du, S.; Suo, L.N. Gender differences in associations of serum ferritin and diabetes, metabolic syndrome, and obesity in the China health and nutrition survey. Mol. Nutr. Food Res. 2014, 58, 2189–2195. [Google Scholar] [CrossRef] [PubMed]
  33. Thurnham, D.I.; McCabe, L.D.; Haldar, S.; Wieringa, F.T.; Northrop-Clewes, C.A.; McCabe, G.P. Adjusting plasma ferritin concentrations to remove the effects of subclinical inflammation in the assessment of iron deficiency: A meta-analysis. Am. J. Clin. Nutr. 2010, 92, 546–555. [Google Scholar] [CrossRef] [PubMed]
  34. Du, T.; Zhang, J.; Yuan, G.; Zhang, M.; Zhou, X.; Liu, Z.; Sun, X.; Yu, X. Nontraditional risk factors for cardiovascular disease and visceral adiposity index among different body size phenotypes. Nutr. Metab. Cardiovasc. Dis. 2015, 25, 100–107. [Google Scholar] [CrossRef] [PubMed]
  35. He, J.; Shen, X.; Fang, A.; Song, J.; Li, H.; Guo, M.; Li, K. Association between predominantly plant-based diets and iron status in Chinese adults: A cross-sectional analysis. Br. J. Nutr. 2016, 116, 1621–1632. [Google Scholar] [CrossRef] [PubMed]
  36. Thompson, A.L.; Adair, L.; Gordon-Larsen, P.; Zhang, B.; Popkin, B. Environmental, dietary, and behavioral factors distinguish Chinese adults with high waist-to-height ratio with and without inflammation. J. Nutr. 2015, 145, 1335–1344. [Google Scholar] [CrossRef] [PubMed]
  37. Hu, P.J.; Ley, S.H.; Bhupathiraju, S.N.; Li, Y.; Wang, D.D. Associations of dietary, lifestyle, and sociodemographic factors with iron status in Chinese adults: A cross-sectional study in the China health and nutrition survey. Am. J. Clin. Nutr. 2017, 105, 503–512. [Google Scholar] [CrossRef] [PubMed]
  38. Zhu, Y.; Pandya, B.J.; Choi, H.K. Prevalence of gout and hyperuricemia in the US general population: The national health and nutrition examination survey 2007–2008. Arthritis Rheum. 2011, 63, 3136–3141. [Google Scholar] [CrossRef] [PubMed]
  39. Xu, X.; Hall, J.; Byles, J.; Shi, Z. Dietary pattern is associated with obesity in older people in China: Data from China Health and Nutrition Survey (CHNS). Nutrients 2015, 7, 8170–8188. [Google Scholar] [CrossRef] [PubMed]
  40. Xu, X.; Hall, J.; Byles, J.; Shi, Z. Assessing dietary quality of older Chinese people using the Chinese Diet Balance Index (DBI). PLoS ONE 2015, 10, e0121618. [Google Scholar] [CrossRef] [PubMed]
  41. Su, C.; Zhao, J.; Wu, Y.; Wang, H.; Wang, Z.; Wang, Y.; Zhang, B. Temporal trends in dietary macronutrient intakes among adults in rural China from 1991 to 2011: Findings from the CHNS. Nutrients 2017, 9, 227. [Google Scholar] [CrossRef] [PubMed]
  42. Yang, Y.X.; Wang, G.Y.; Pan, X.C. China Food Composition Tables 2004 (Book 2), 2nd ed.; Beijing Medical University Press: Beijing, China, 2005. [Google Scholar]
  43. Yang, Y.X.; Wang, G.Y.; Pan, X.C. China Food Composition Tables (Book 1), 2nd ed.; Beijing Medical University Press: Beijing, China, 2009. [Google Scholar]
  44. Ainsworth, B.E.; Haskell, W.L.; Whitt, M.C.; Irwin, M.L.; Swartz, A.M.; Strath, S.J.; O’Brien, W.L.; Bassett, D.R., Jr.; Schmitz, K.H.; Emplaincourt, P.O.; et al. Compendium of physical activities: An update of activity codes and met intensities. Med. Sci. Sports Exerc. 2000, 32, S498–S504. [Google Scholar] [CrossRef] [PubMed]
  45. Ng, S.W.; Norton, E.C.; Popkin, B.M. Why have physical activity levels declined among Chinese adults? Findings from the 1991–2006 China health and nutrition surveys. Soc. Sci. Med. 2009, 68, 1305–1314. [Google Scholar] [CrossRef] [PubMed]
  46. Zuo, H.; Shi, Z.; Yuan, B.; Dai, Y.; Hu, G.; Wu, G.; Hussain, A. Interaction between physical activity and sleep duration in relation to insulin resistance among non-diabetic Chinese adults. BMC Public Health 2012, 12, 247. [Google Scholar] [CrossRef] [PubMed] [Green Version]
  47. Roberts, W.L. Centers for Disease Control and Prevention (CDC); American Heart Association (AHA). CDC/AHA workshop on markers of inflammation and cardiovascular disease: Application to clinical and public health practice: Laboratory tests available to assess inflammation—Performance and standardization: A background paper. Circulation 2004, 110, e572–e576. [Google Scholar] [PubMed]
  48. Ting, K.; Gill, T.K.; Keen, H.; Tucker, G.R.; Hill, C.L. Prevalence and associations of gout and hyperuricaemia: Results from an Australian population-based study. Intern. Med. J. 2016, 46, 566–573. [Google Scholar] [CrossRef] [PubMed]
  49. Meneses-Leon, J.; Denova-Gutierrez, E.; Castanon-Robles, S.; Granados-Garcia, V.; Talavera, J.O.; Rivera-Paredez, B.; Huitron-Bravo, G.G.; Cervantes-Rodriguez, M.; Quiterio-Trenado, M.; Rudolph, S.E.; et al. Sweetened beverage consumption and the risk of hyperuricemia in Mexican adults: A cross-sectional study. BMC Public Health 2014, 14, 445. [Google Scholar] [CrossRef] [PubMed]
  50. Nagahama, K.; Iseki, K.; Inoue, T.; Touma, T.; Ikemiya, Y.; Takishita, S. Hyperuricemia and cardiovascular risk factor clustering in a screened cohort in Okinawa, Japan. Hypertens. Res. 2004, 27, 227–233. [Google Scholar] [CrossRef] [PubMed]
  51. Liu, R.; Han, C.; Wu, D.; Xia, X.; Gu, J.; Guan, H.; Shan, Z.; Teng, W. Prevalence of hyperuricemia and gout in mainland China from 2000 to 2014: A systematic review and meta-analysis. Biomed. Res. Int. 2015, 2015, 762820. [Google Scholar] [CrossRef] [PubMed]
  52. Zhang, Q.; Lou, S.; Meng, Z.; Ren, X. Gender and age impacts on the correlations between hyperuricemia and metabolic syndrome in Chinese. Clin. Rheumatol. 2011, 30, 777–787. [Google Scholar] [CrossRef] [PubMed]
  53. Wasilewska, A.; Tenderenda, E.; Taranta-Janusz, K.; Tobolczyk, J.; Stypulkowska, J. Markers of systemic inflammation in children with hyperuricemia. Acta Paediatr. 2012, 101, 497–500. [Google Scholar] [CrossRef] [PubMed]
  54. Zykova, S.N.; Storhaug, H.M.; Toft, I.; Chadban, S.J.; Jenssen, T.G.; White, S.L. Cross-sectional analysis of nutrition and serum uric acid in two Caucasian cohorts: The ausdiab study and the tromso study. Nutr. J. 2015, 14, 49. [Google Scholar] [CrossRef] [PubMed] [Green Version]
  55. Park, C.; Obi, Y.; Streja, E.; Rhee, C.M.; Catabay, C.J.; Vaziri, N.D.; Kovesdy, C.P.; Kalantar-Zadeh, K. Serum uric acid, protein intake and mortality in hemodialysis patients. Nephrol. Dial. Transplant. 2017, 32, 1750–1757. [Google Scholar] [CrossRef] [PubMed]
  56. Beavers, K.M.; Hsu, F.C.; Serra, M.C.; Yank, V.; Pahor, M.; Nicklas, B.J. The effects of a long-term physical activity intervention on serum uric acid in older adults at risk for physical disability. J. Aging Phys. Act. 2014, 22, 25–33. [Google Scholar] [CrossRef] [PubMed]
  57. Suarez-Ortegon, M.F.; McLachlan, S.; Wild, S.H.; Fernandez-Real, J.M.; Hayward, C.; Polasek, O. Soluble transferrin receptor levels are positively associated with insulin resistance but not with the metabolic syndrome or its individual components. Br. J. Nutr. 2016, 116, 1165–1174. [Google Scholar] [CrossRef] [PubMed]
  58. Lewis, J.G.; Gardner, J.E. The relation of serum uric acid to haemoglobin level in patients with cardiac and respiratory disease. J. Clin. Pathol. 1960, 13, 502–505. [Google Scholar] [CrossRef] [PubMed]
  59. Arosio, P.; Ingrassia, R.; Cavadini, P. Ferritins: A family of molecules for iron storage, antioxidation and more. Biochim. Biophys. Acta 2009, 1790, 589–599. [Google Scholar] [CrossRef] [PubMed]
  60. Davies, K.J.; Sevanian, A.; Muakkassah-Kelly, S.F.; Hochstein, P. Uric acid-iron ion complexes. A new aspect of the antioxidant functions of uric acid. Biochem. J. 1986, 235, 747–754. [Google Scholar] [CrossRef] [PubMed]
  61. Miura, T.; Muraoka, S.; Ogiso, T. Inhibitory effect of urate on oxidative damage induced by adriamycin-Fe3+ in the presence of H2O2. Res. Commun. Chem. Pathol. Pharmacol. 1993, 79, 75–85. [Google Scholar] [PubMed]
  62. Furth-Walker, D.; Amy, N.K. Regulation of xanthine oxidase activity and immunologically detectable protein in rats in response to dietary protein and iron. J. Nutr. 1987, 117, 1697–1703. [Google Scholar] [CrossRef] [PubMed]
  63. Martelin, E.; Lapatto, R.; Raivio, K.O. Regulation of xanthine oxidoreductase by intracellular iron. Am. J. Physiol. Cell Physiol. 2002, 283, C1722–C1728. [Google Scholar] [CrossRef] [PubMed]
  64. Ghio, A.J.; Kennedy, T.P.; Stonehuerner, J.; Carter, J.D.; Skinner, K.A.; Parks, D.A.; Hoidal, J.R. Iron regulates xanthine oxidase activity in the lung. Am. J. Physiol. Lung Cell. Mol. Physiol. 2002, 283, L563–L572. [Google Scholar] [CrossRef] [PubMed]
  65. Pfeffer, K.D.; Huecksteadt, T.P.; Hoidal, J.R. Xanthine dehydrogenase and xanthine oxidase activity and gene expression in renal epithelial cells. Cytokine and steroid regulation. J. Immunol. 1994, 153, 1789–1797. [Google Scholar] [PubMed]
  66. Jehn, M.; Clark, J.M.; Guallar, E. Serum ferritin and risk of the metabolic syndrome in U.S. Adults. Diabetes Care 2004, 27, 2422–2428. [Google Scholar] [CrossRef] [PubMed]
  67. Lee, B.K.; Kim, Y.; Kim, Y.I. Association of serum ferritin with metabolic syndrome and diabetes mellitus in the south Korean general population according to the Korean national health and nutrition examination survey 2008. Metabolism 2011, 60, 1416–1424. [Google Scholar] [CrossRef] [PubMed]
  68. Ford, E.S.; Cogswell, M.E. Diabetes and serum ferritin concentration among U.S. Adults. Diabetes Care 1999, 22, 1978–1983. [Google Scholar] [CrossRef] [PubMed]
  69. Facchini, F.S. Effect of phlebotomy on plasma glucose and insulin concentrations. Diabetes Care 1998, 21, 2190. [Google Scholar] [CrossRef] [PubMed]
  70. Modan, M.; Halkin, H.; Karasik, A.; Lusky, A. Elevated serum uric acid—A facet of hyperinsulinaemia. Diabetologia 1987, 30, 713–718. [Google Scholar] [CrossRef] [PubMed]
  71. Tang, W.; Fu, Q.; Zhang, Q.; Sun, M.; Gao, Y.; Liu, X.; Qian, L.; Shan, S.; Yang, T. The association between serum uric acid and residual β-cell function in type 2 diabetes. J. Diabetes Res. 2014, 2014, 709691. [Google Scholar] [CrossRef] [PubMed]
  72. Facchini, F.; Chen, Y.D.; Hollenbeck, C.B.; Reaven, G.M. Relationship between resistance to insulin-mediated glucose uptake, urinary uric acid clearance, and plasma uric acid concentration. JAMA 1991, 266, 3008–3011. [Google Scholar] [CrossRef] [PubMed]
Figure 1. SUA concentrations (a) and crude prevalence of HU (b) for 7946 participants according to their age and gender. Data of SUA concentrations were expressed as means ± standard error (SE). SUA, serum uric acid; HU, hyperuricemia.
Nutrients 10 00191 g001
Figure 2. Correlations between SUA concentrations and levels of ln(SF), transferrin, and Hb in 7946 adult participants. (a) Positive correlation between ln(SF) and SUA (r = 0.385, p < 0.001); (b) positive correlation between transferrin and SUA (r = 0.035, p = 0.002); (c) positive correlation between Hb and SUA (r = 0.269, p < 0.001). SUA, serum uric acid; SF, serum ferritin; Hb, hemoglobin.
Nutrients 10 00191 g002aNutrients 10 00191 g002b
Table 1. Characteristics of the study participants from the China Health and Nutrition Survey in 2009.
CharacteristicsHU
(n = 1276)
Non-HU
(n = 6670)
Total
(n = 7946)
p
SUA, mg/dL7.9 ± 2.14.7 ± 1.15.2 ± 1.8<0.001
Rural area <0.001
  Yes785 (61.5)4546 (68.2)5331 (67.1)
  No491 (38.5)2124 (31.8)2615 (32.9)
Age, years53.4 ± 15.250.3 ± 14.850.8 ± 14.9<0.001
Gender <0.001
  Male793 (62.1)2917 (43.7)3710 (46.7)
  Female483 (37.9)3753 (56.3)4236 (53.3)
Nationality 0.205
  Han1123 (88.0)5951 (89.2)7074 (89.0)
  Others153 (12.0)719 (10.8)872 (11.0)
Education, years9 (5, 12)9 (5, 9)9 (5, 9)0.032
BMI, kg/m224.8 ± 3.623.1 ± 3.423.4 ± 3.5<0.001
Current smoker <0.001
  Yes438 (34.3)1759 (26.4)2197 (27.6)
  No838 (65.7)4911 (73.6)5749 (72.4)
Alcohol consumption <0.001
  Yes560 (43.9)2047 (30.7)2607 (32.8)
  No716 (56.1)4623 (69.3)5339 (67.2)
Physical activities, MET-h/week73.6 (31.5, 147.4)87.3 (37.0, 182.0)84.5 (35.9, 177.0)<0.001
Total energy intake, kcal/day2167.4 (1772.0, 2580.1)2063.1 (1669.1, 2499.2)2081.6 (1680.7, 2512.3)<0.001
Carbohydrate intake, g/day281.4 (219.3, 354.2)282.4 (224.2, 354.8)282.3 (223.4, 354.7)0.860
Carbohydrate (E%)54.2 ± 10.756.3 ± 10.755.9 ± 10.7<0.001
Protein intake, g/day66.0 (52.9, 82.3)61.9 (49.6, 77.8)62.6 (50.1, 78.6)<0.001
Protein (E%)12.9 ± 3.012.6 ± 2.912.6 ± 2.9<0.001
Fat intake, g/day75.7 (54.2, 99.2)68.3 (48.7, 93.1)69.5 (49.5, 94.4)<0.001
Fat (E%)32.9 ± 10.831.2 ± 10.731.4 ± 10.7<0.001
SF, μg/L119.3 (71.0, 212.4)71.1 (34.9, 131.0)78.0 (39.4, 143.3)<0.001
Transferrin, g/L3.0 ± 0.62.9 ± 0.52.9 ± 0.5<0.001
sTfR, mg/L1.33 (1.07, 1.68)1.34 (1.09, 1.65)1.34 (1.09, 1.65)0.407
Hb, g/L146.3 ± 20.9140.6 ± 20.3141.5 ± 20.5<0.001
Hs-CRP, mg/L2.0 (1.0, 3.0)1.0 (0.0, 2.0)1.0 (0.0, 2.0)<0.001
HU, hyperuricemia; SUA, serum uric acid; BMI, body mass index; MET-h, metabolic equivalent hours; E%, percentage of energy; SF, serum ferritin; sTfR, soluble transferrin receptor; Hs-CRP, high-sensitivity C-reactive protein; Hb, hemoglobin. Data were expressed as means ± standard deviation or medians (interquartile ranges) for continuous variables with or without normal distribution respectively and counts (percentages) for categorical variables. Comparisons between participants with hyperuricemia and the other participants were performed by using Student’s t tests, Mann–Whitney U tests, or Chi-squared tests.
Table 2. Multilevel-adjusted associations of SF, transferrin, and Hb levels with SUA concentrations in Chinese adult population (n = 7946).
SUA, mg/dLβ (95% CI) 1Adjust β (95% CI) 2Adjust β (95% CI) 3
SFQ14.26 ± 1.25Ref.Ref.Ref.
Q24.91 ± 1.460.658 (0.555, 0.761)0.310 (0.209, 0.411)0.267 (0.167, 0.367)
Q35.46 ± 1.571.202 (1.099, 1.305)0.587 (0.481, 0.693)0.529 (0.423, 0.635)
Q46.10 ± 2.191.842 (1.739, 1.945)0.991 (0.879, 1.103)0.899 (0.788, 1.010)
p-trend<0.001<0.001<0.001<0.001
TransferrinQ15.05 ± 1.54Ref.Ref.Ref.
Q25.15 ± 1.610.094 (−0.017, 0.205)0.196 (0.098, 0.294)0.208 (0.112, 0.304)
Q35.27 ± 1.730.216 (0.105, 0.327)0.334 (0.235, 0.433)0.351 (0.254, 0.448)
Q45.26 ± 2.190.209 (0.098, 0.320)0.457 (0.357, 0.557)0.488 (0.389, 0.587)
p-trend<0.001<0.001<0.001<0.001
HbQ14.58 ± 1.50Ref.Ref.Ref.
Q24.79 ± 1.470.213 (0.109, 0.317)0.046 (−0.051, 0.143)0.029 (−0.066, 0.124)
Q35.45 ± 1.730.876 (0.769, 0.983)0.148 (0.039, 0.257)0.114 (0.006, 0.222)
Q45.98 ± 2.081.402 (1.294, 1.510)0.388 (0.269, 0.507)0.353 (0.235, 0.471)
p-trend<0.001<0.001<0.001<0.001
SUA, serum uric acid; CI, confidence interval; SF, serum ferritin; Ref., reference; Hb, hemoglobin; BMI, body mass index; E%, percentage of energy; Hs-CRP, high-sensitivity C-reactive protein. All of the models were constructed by using multilevel (four levels) mixed-effects linear regression with the iterative generalized least-squares method. The medians (interquartile ranges) or means ± standard deviation for quartiles of SF, transferrin, and Hb were as follows—SF: 20.3 (11.3, 29.3), 58.0 (48.7, 67.8), 104.5 (90.7, 121.7), and 237.8 (174.6, 446.5) μg/L; transferrin: 2.3 ± 0.3, 2.7 ± 0.1, 3.0 ± 0.1, 3.6 ± 0.4 g/L; Hb: 116.9 ± 11.8, 135.0 ± 3.8, 147.8 ± 3.7, 167.8 ± 13.9 g/L. 1 Original model without any adjustments. 2 Adjusted for age, gender (male or female), nationality (Han or others), education (≤6 years, 6.1–9.0 years, or >9 years), smoking status (current or not current), alcohol consumption (yes or no), BMI (<18.5 kg/m2, 18.5–24.9 kg/m2, 25.0–29.9 kg/m2, or ≥30 kg/m2), and physical activity (quartile). 3 Adjusted as for model 2 plus total energy intake (quartile), protein intake (quartile), fat intake (quartile), carbohydrate (E%) (quartile), protein (E%) (quartile), fat (E%) (quartile), and inflammation status (hs-CRP levels < 1 mg/L, 1–3 mg/L or 4–10 mg/L).
Table 3. Multilevel-adjusted associations of SF, transferrin, and Hb levels with the risk of HU in Chinese adult population (n = 7946).
Cases/Total, nβ (95% CI) 1Adjust OR (95% CI) 2Adjust OR (95% CI) 3
SFQ1126/1987Ref.Ref.Ref.
Q2248/19872.106 (1.684, 2.635)1.726 (1.368, 2.179)1.618 (1.280, 2.044)
Q3376/19873.449 (2.790, 4.263)2.550 (2.030, 3.203)2.344 (1.863, 2.951)
Q4526/19855.323 (4.332, 6.540)3.487 (2.773, 4.384)3.086 (2.450, 3.888)
p-trend<0.001<0.001<0.001<0.001
TransferrinQ1261/2016Ref.Ref.Ref.
Q2307/19911.226 (1.026, 1.465)1.298 (1.080, 1.560)1.318 (1.094, 1.587)
Q3333/19531.383 (1.160, 1.649)1.496 (1.246, 1.797)1.539 (1.279, 1.852)
Q4375/19861.565 (1.318, 1.859)1.817 (1.514, 2.179)1.900 (1.579, 2.286)
p-trend<0.001<0.001<0.001<0.001
HbQ1237/1949Ref.Ref.Ref.
Q2277/21821.050 (0.873, 1.264)0.948 (0.784, 1.147)0.918 (0.757, 1.113)
Q3336/19241.528 (1.276, 1.829)1.054 (0.862, 1.289)0.996 (0.812, 1.221)
Q4426/18912.100 (1.766, 2.497)1.288 (1.044, 1.589)1.218 (0.984, 1.507)
p-trend<0.001<0.0010.0080.036
HU, hyperuricemia; SF, serum ferritin; CI, confidence interval; OR, odds ratio; Hb, hemoglobin; Ref., reference; BMI, body mass index; E%, percentage of energy; Hs-CRP, high-sensitivity C-reactive protein. All of the models were constructed by using multilevel (four levels) mixed-effects logistic regression with the restricted iterative generalized least-squares estimation method. The medians (interquartile ranges) or means ± standard deviation for quartiles of SF, transferrin, and Hb were as follows—SF: 20.3 (11.3, 29.3), 58.0 (48.7, 67.8), 104.5 (90.7, 121.7), and 237.8 (174.6, 446.5) μg/L; transferrin: 2.3 ± 0.3, 2.7 ± 0.1, 3.0 ± 0.1, 3.6 ± 0.4 g/L; Hb: 116.9 ± 11.8, 135.0 ± 3.8, 147.8 ± 3.7, 167.8 ± 13.9 g/L. 1 Original model without any adjustments. 2 Adjusted for age, gender (male or female), nationality (Han or others), education (≤6 years, 6.1–9.0 years, or >9 years), smoking status (current or not current), alcohol consumption (yes or no), BMI (<18.5 kg/m2, 18.5–24.9 kg/m2, 25.0–29.9 kg/m2, or ≥30 kg/m2), and physical activity (quartile). 3 Adjusted as for model 2 plus total energy intake (quartile), protein intake (quartile), fat intake (quartile), carbohydrate (E%) (quartile), protein (E%) (quartile), fat (E%) (quartile), and inflammation status (hs-CRP levels < 1 mg/L, 1–3 mg/L or 4–10 mg/L).

