The Impact of a Single Dose of a Polyphenol-Rich Seaweed Extract on Postprandial Glycaemic Control in Healthy Adults: A Randomised Cross-Over Trial


Abstract
:1. Introduction
2. Materials and Methods
2.1. Trial Design
2.2. Participants
2.3. Randomisation and Blinding
2.4. Test Products
2.5. Procedure
2.6. Outcome Measures
2.6.1. Biochemical Measurements
2.6.2. Anthropometric Data
2.6.3. Intolerance Symptoms
2.6.4. Diaries and Questionnaires
2.7. Quantification of Soluble Phlorotannins
2.8. Statistical Analysis
3. Results
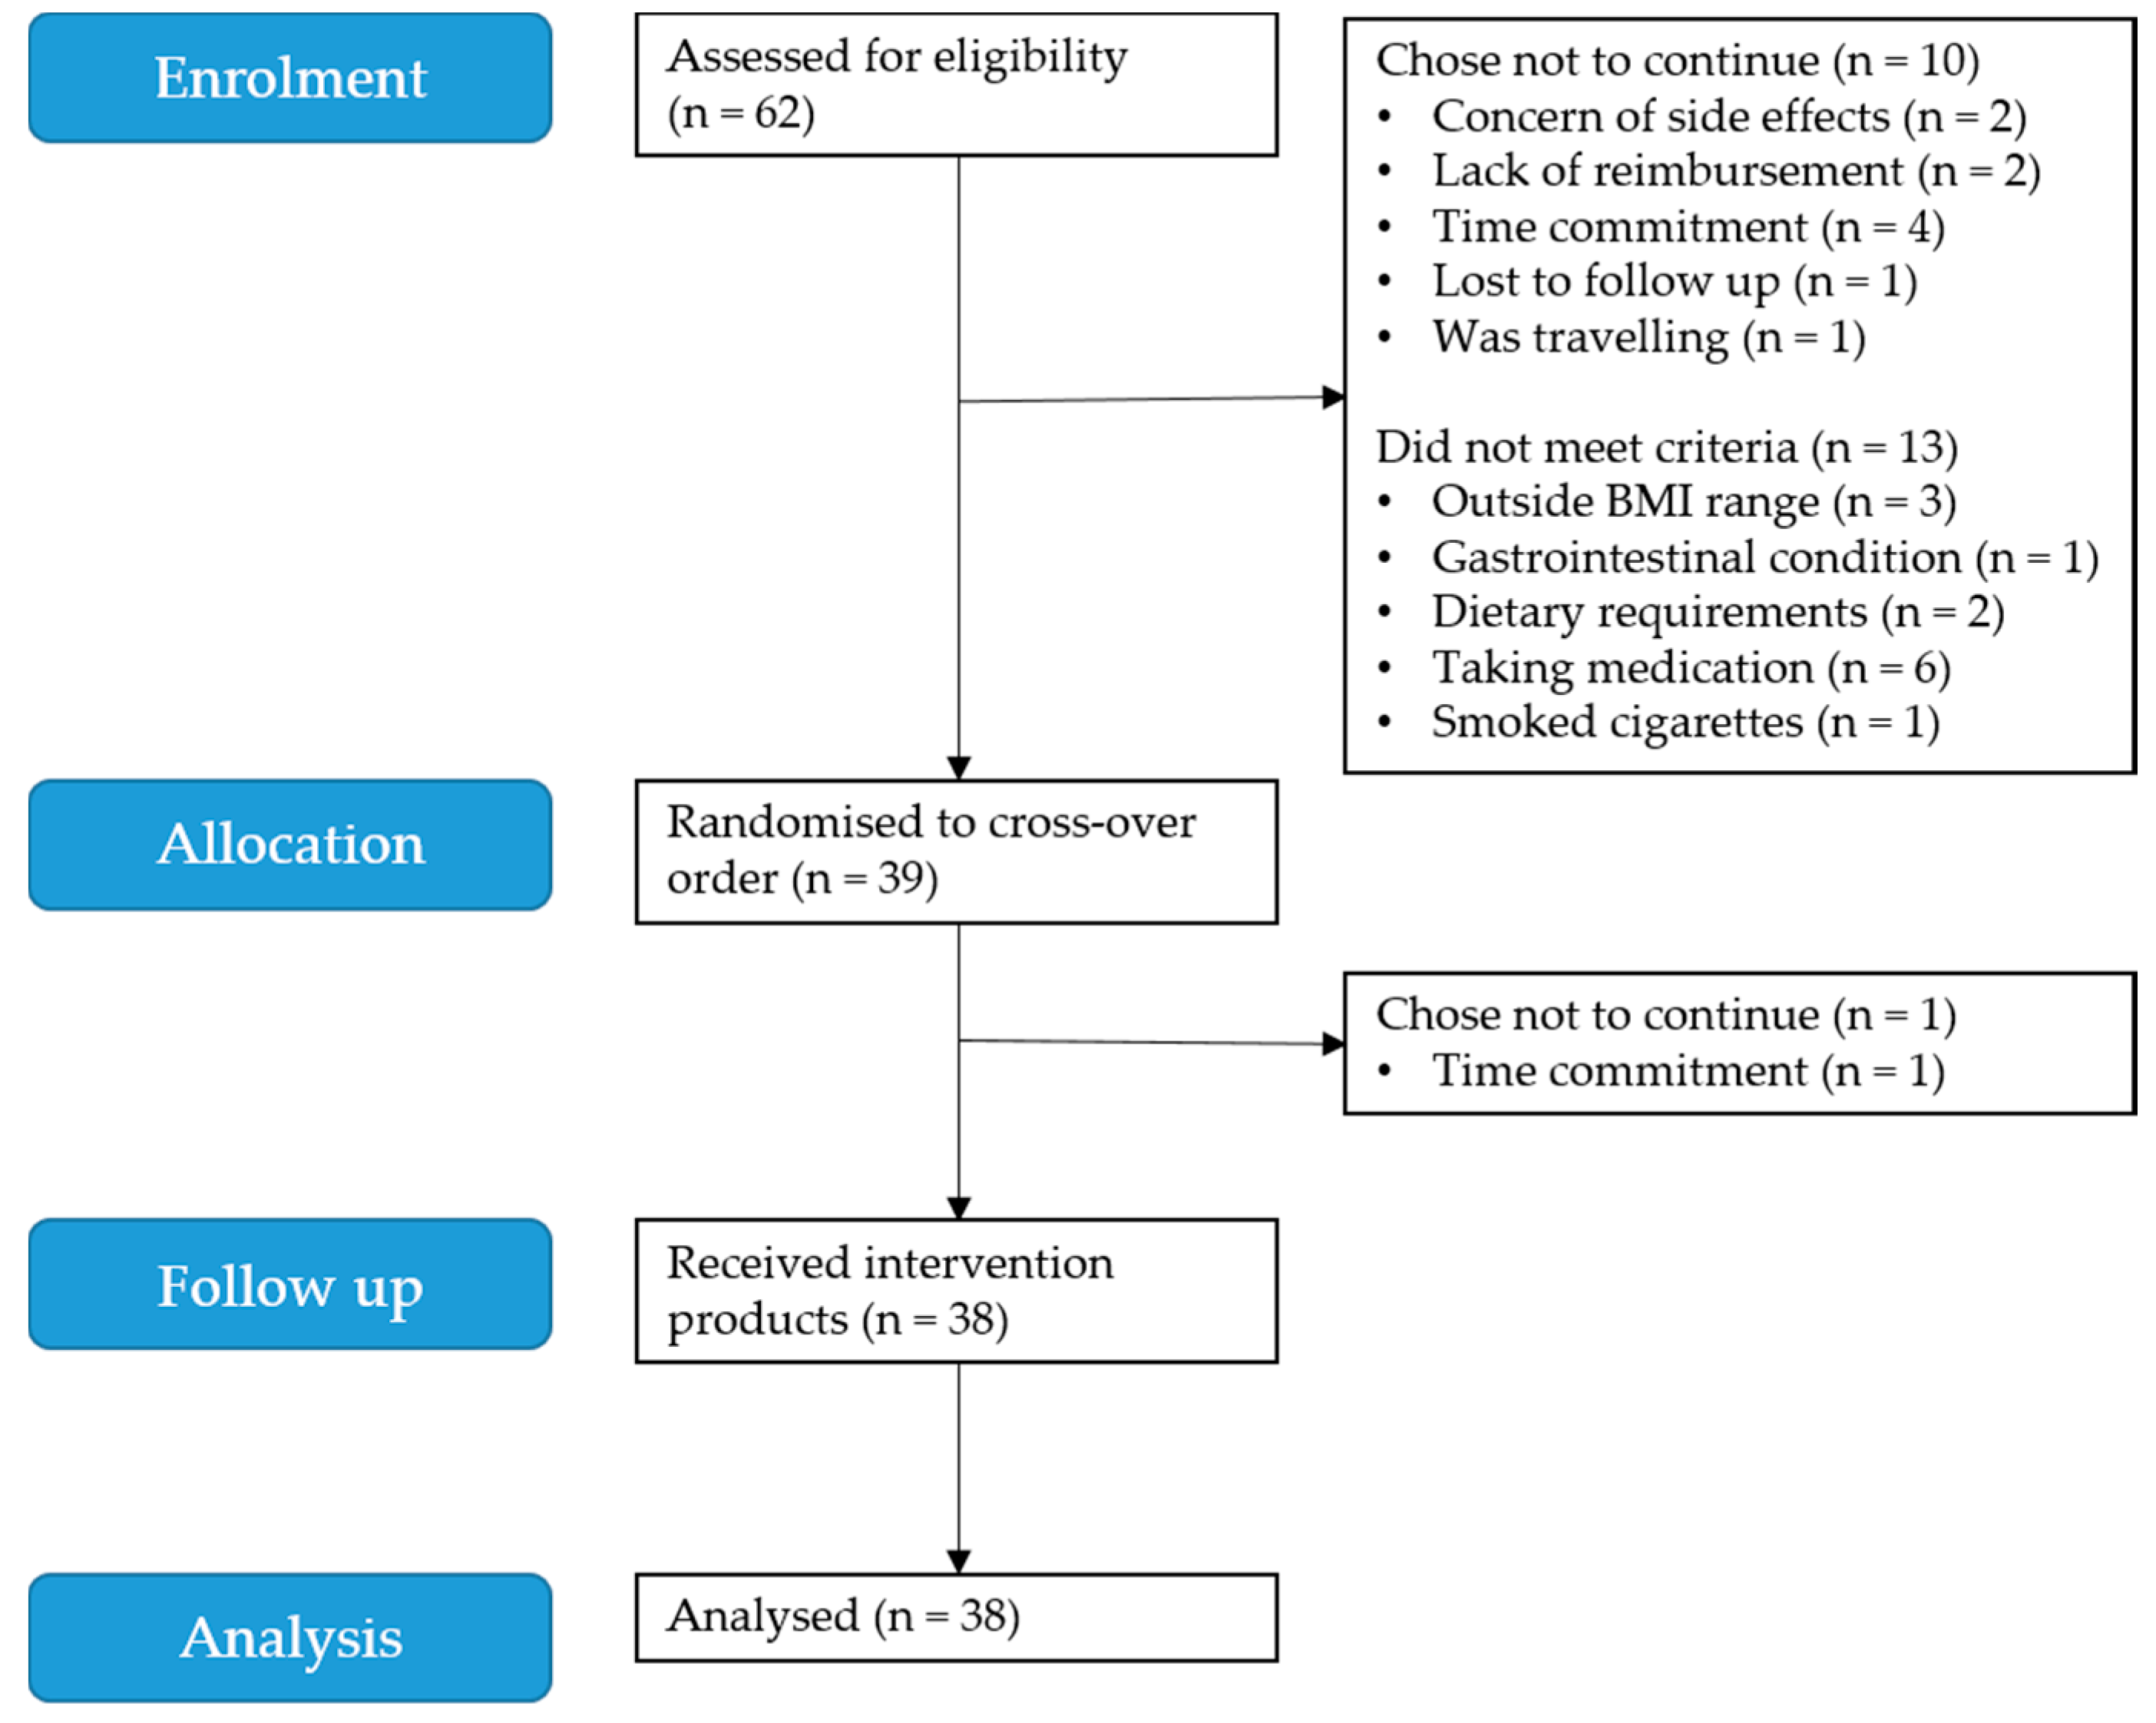
3.1. Participants
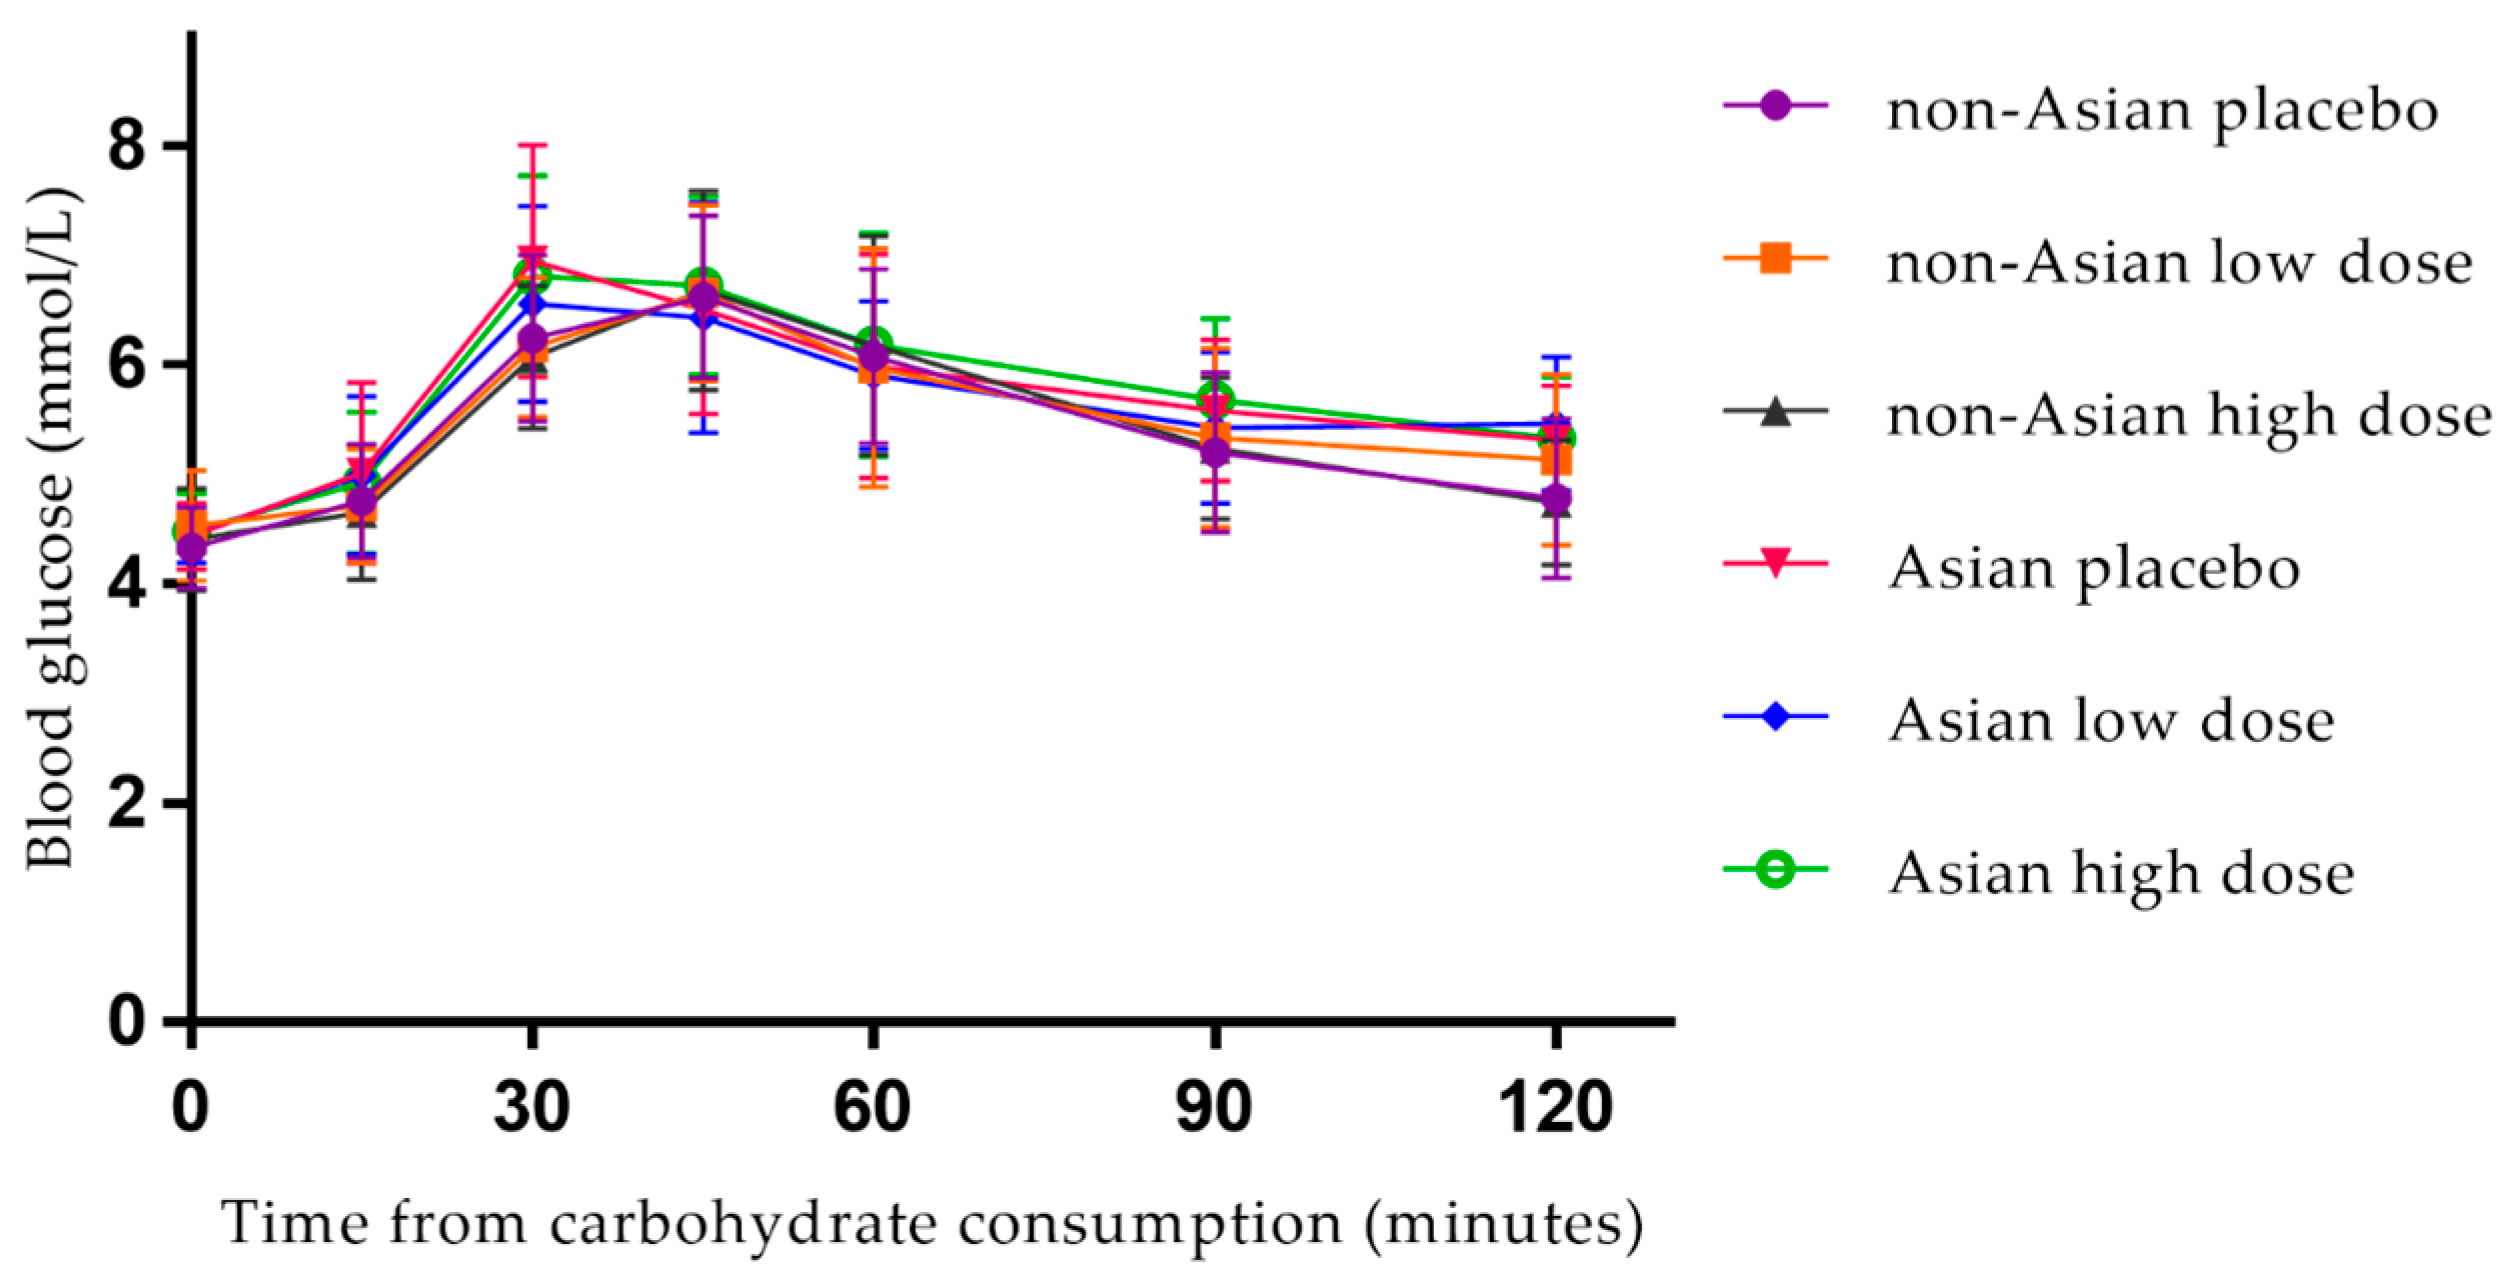
3.2. Postprandial Blood Glucose
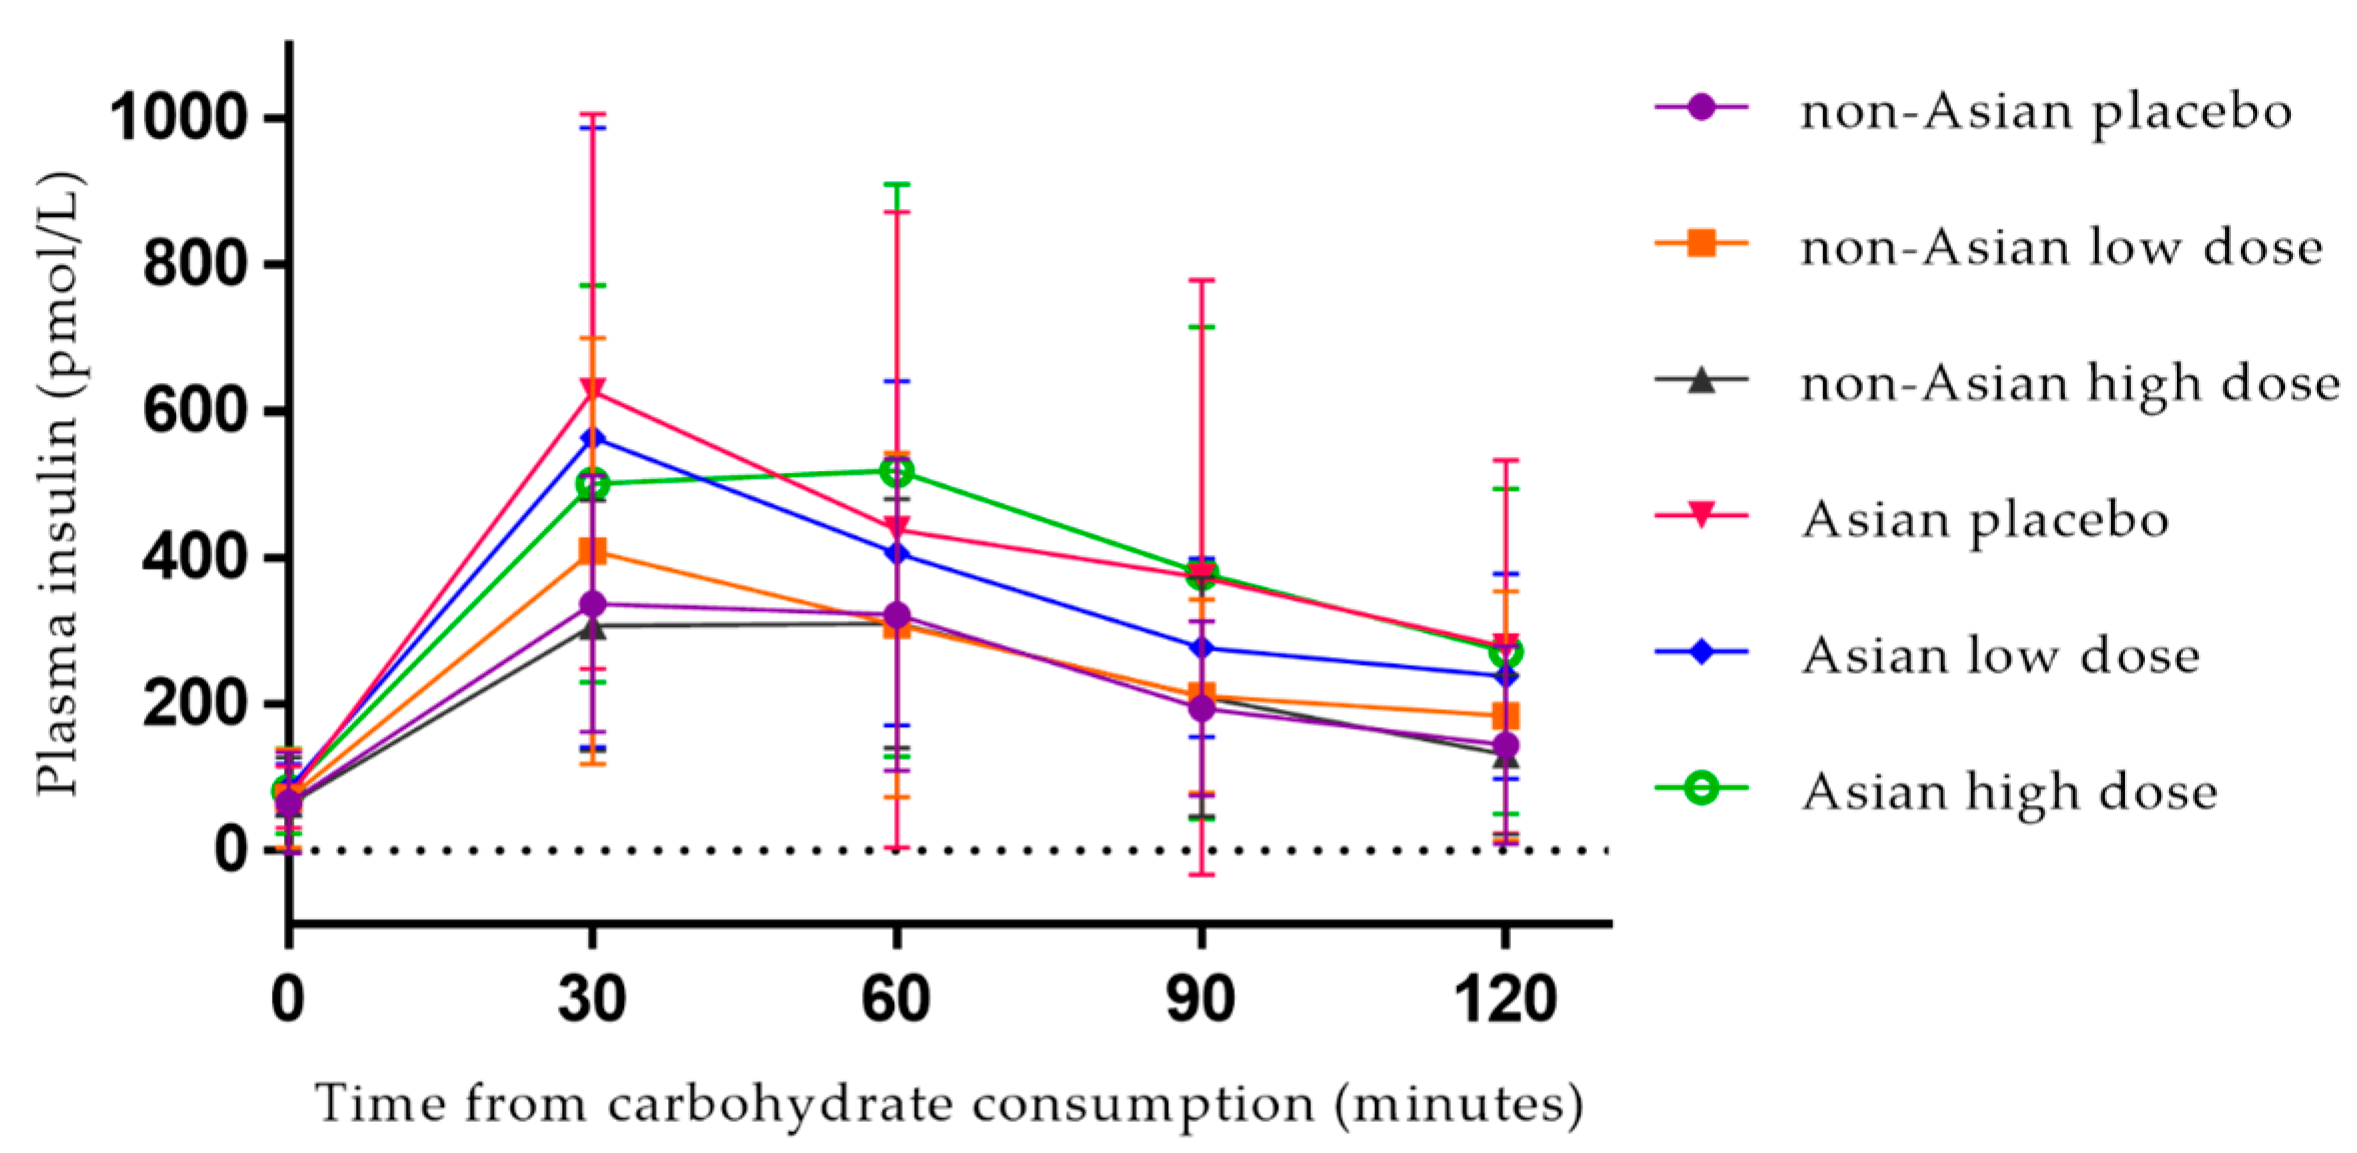
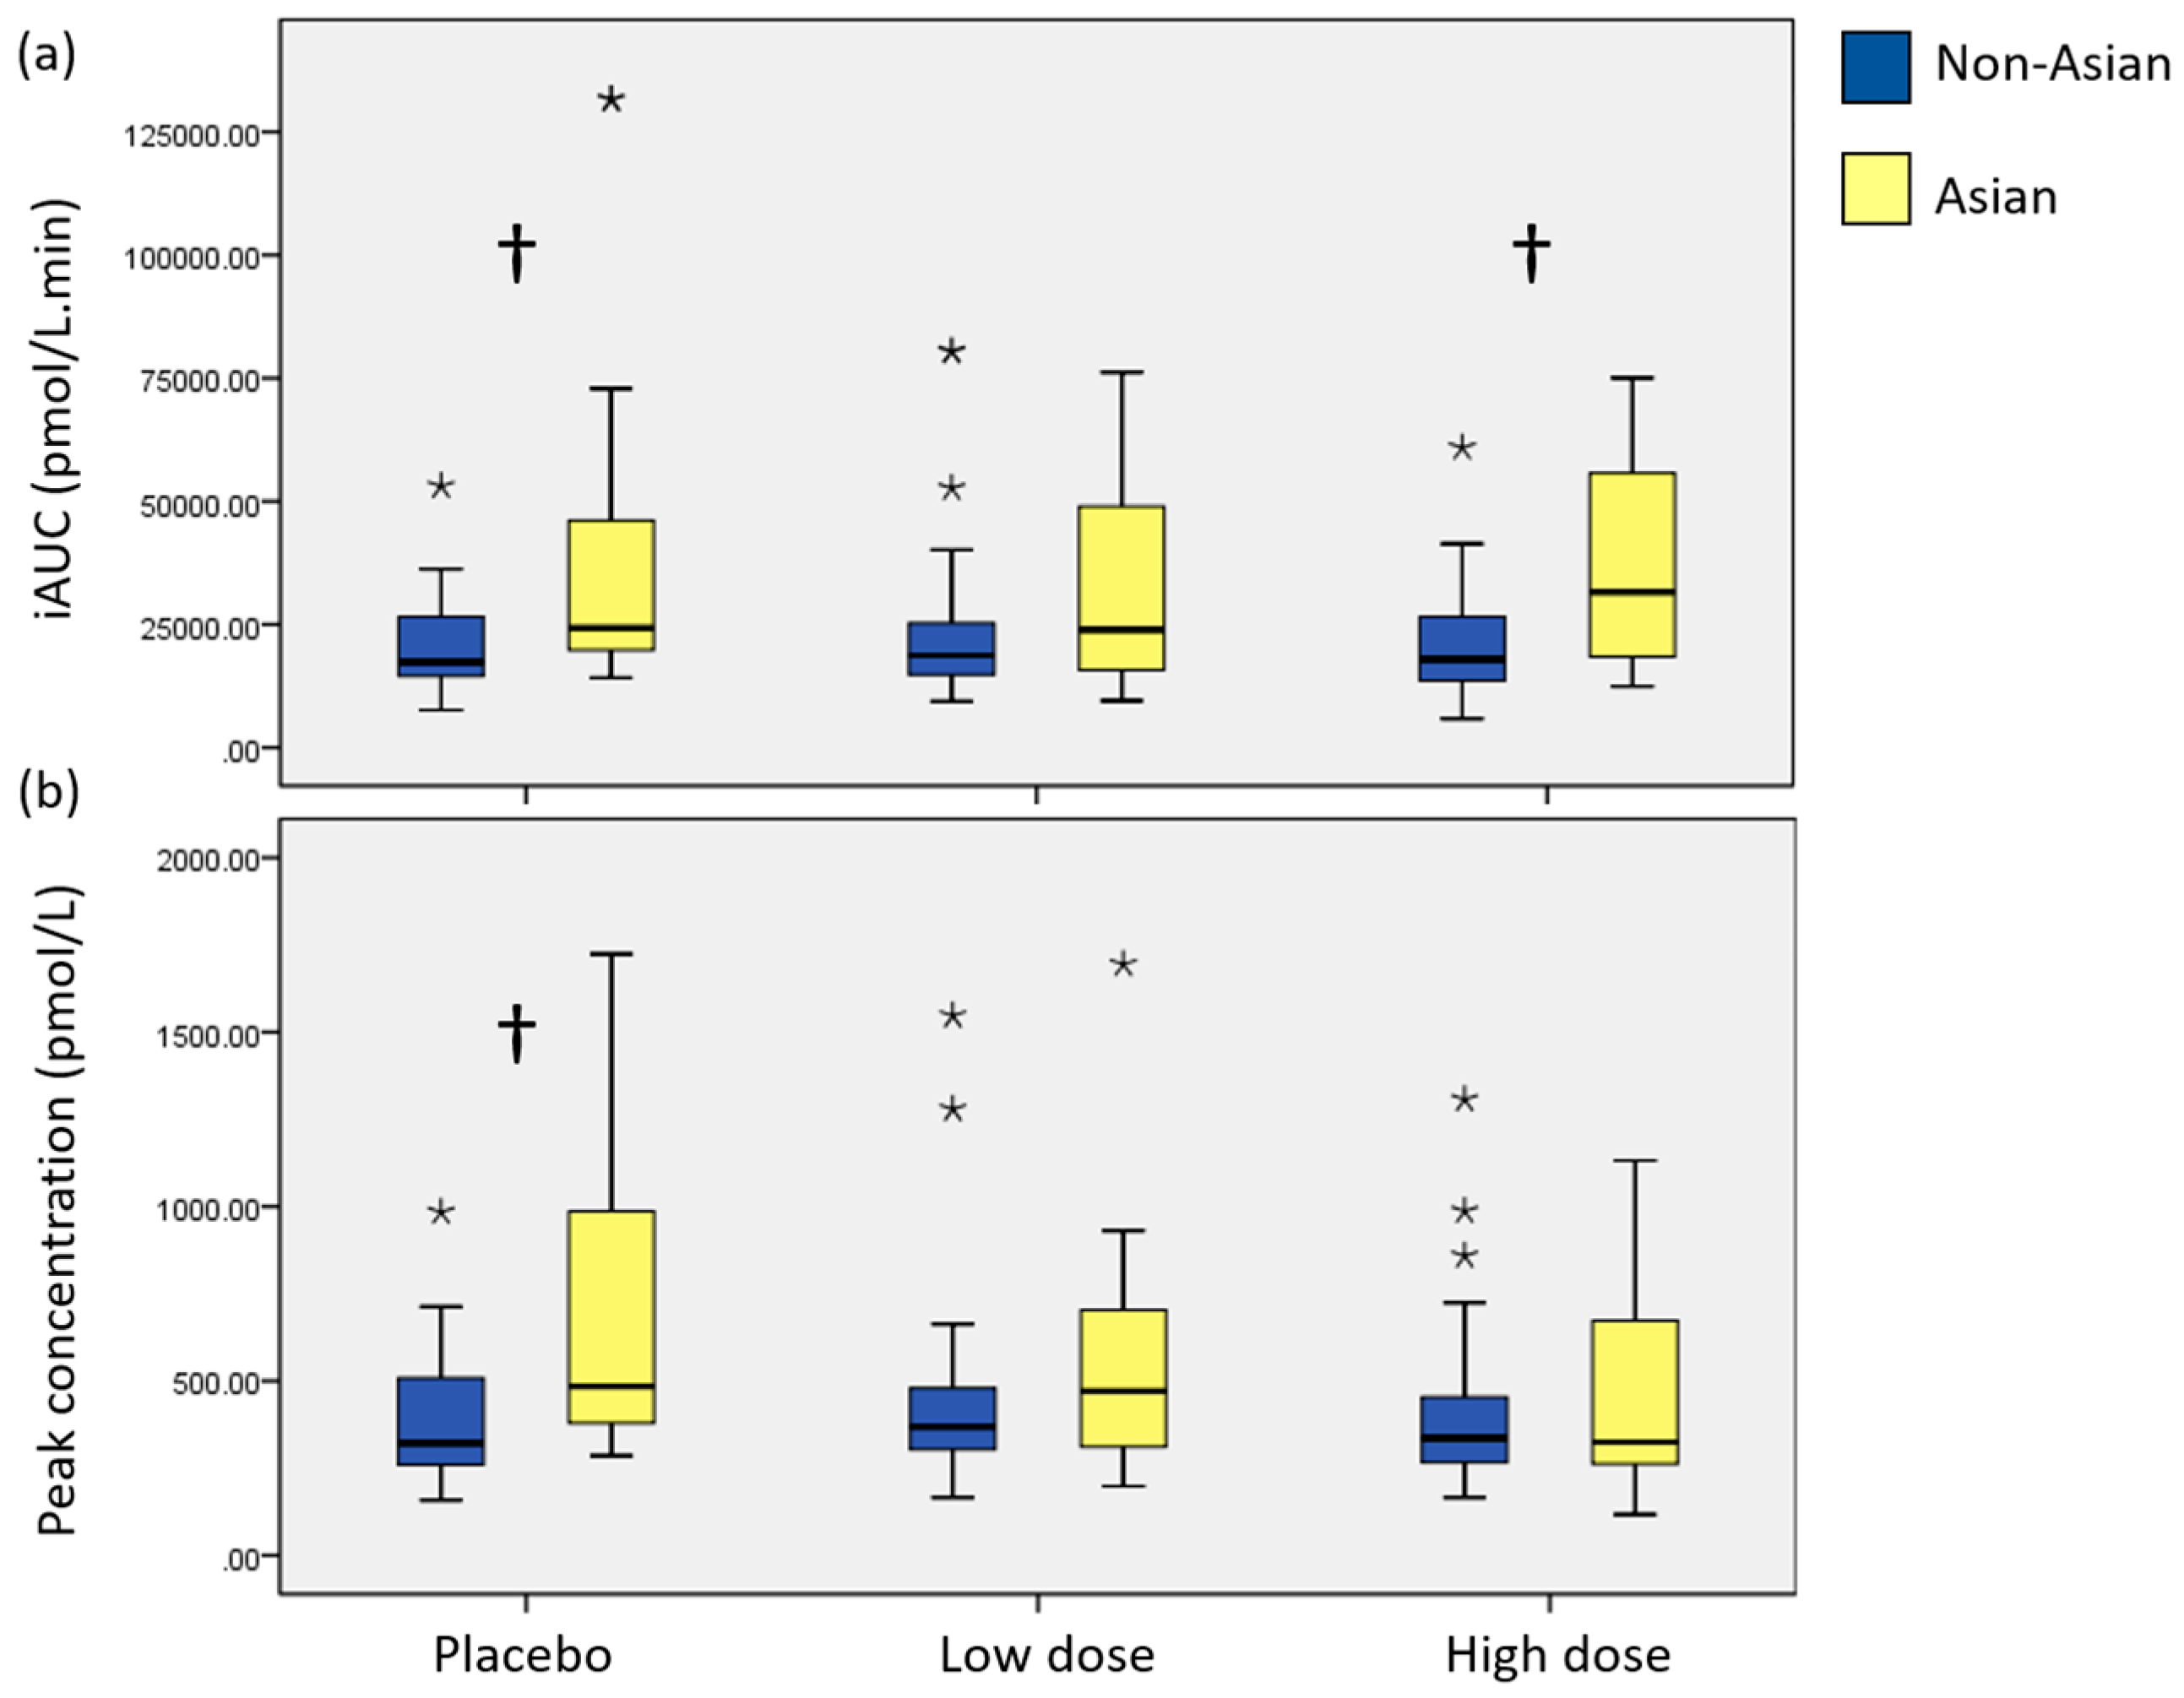
3.3. Postprandial Plasma Insulin
3.4. Intolerance Symptoms
3.5. Phlorotannin Contents
4. Discussion
5. Conclusions
Supplementary Materials
Acknowledgments
Author Contributions
Conflicts of Interest
References
- Diabetes Fact Sheet No312. Available online: http://www.who.int/mediacentre/factsheets/fs312/en/ (accessed on 14 July 2015).
- Kataoka, M.; Venn, B.J.; Williams, S.M.; Morenga, L.A.T.; Heemels, I.M.; Mann, J.I. Glycaemic responses to glucose and rice in people of Chinese and European ethnicity. Diabet. Med. 2013, 30, E101–E107. [Google Scholar] [CrossRef] [PubMed]
- McBean, A.M.; Li, S.; Gilbertson, D.T.; Collins, A.J. Differences in Diabetes Prevalence, Incidence, and Mortality among the Elderly of Four Racial/Ethnic Groups: Whites, Blacks, Hispanics, and Asians. Diabetes Care 2004, 27, 2317–2324. [Google Scholar] [CrossRef] [PubMed]
- Murugan, A.C.; Karim, M.R.; Yusoff, M.B.M.; Tan, S.H.; Asras, M.F.B.F.; Rashid, S.S. New insights into seaweed polyphenols on glucose homeostasis. Pharm. Biol. 2015, 53, 1087–1097. [Google Scholar] [CrossRef] [PubMed]
- Duckworth, W.C. Hyperglycemia and cardiovascular disease. Curr. Artheroscler. Rep. 2001, 3, 383–391. [Google Scholar] [CrossRef]
- Grundy, S.M.; Cleeman, J.I.; Daniels, S.R.; Donato, K.A.; Eckel, R.H.; Franklin, B.A.; Gordon, D.J.; Krauss, R.M.; Savage, P.J.; Smith, S.C.; et al. Diagnosis and Management of the Metabolic Syndrome. Circulation 2005, 112, 2735–2752. [Google Scholar] [CrossRef] [PubMed]
- Klein, S.; Sheard, N.F.; Pi-Sunyer, X.; Daly, A.; Wylie-Rosett, J.; Kulkarni, K.; Clark, N.G. Weight Management Through Lifestyle Modification for the Prevention and Management of Type 2 Diabetes: Rationale and Strategies. Diabetes Care 2004, 27, 2067–2073. [Google Scholar] [CrossRef] [PubMed]
- Jeffery, R.W.; Epstein, L.H.; Wilson, G.T.; Drewnowski, A.; Stunkard, A.J.; Wing, R.R.; Hill, D.R. Long-term maintenance of weight loss: Current status. Health Psychol. 2000, 19 (Suppl. 1), 5–16. [Google Scholar] [CrossRef] [PubMed]
- Wing, R.R.; Phelan, S. Long-term weight loss maintenance. Am. J. Clin. Nutr. 2005, 82 (Suppl. 1), 222S–225S. [Google Scholar] [CrossRef] [PubMed]
- Murray, M.; Dordevic, A.; Ryan, L.; Bonham, M. An emerging trend in functional foods for the prevention of cardiovascular disease and diabetes: Marine algal polyphenols. Crit. Rev. Food Sci. Nutr. 2016, 1–17. [Google Scholar] [CrossRef] [PubMed]
- Miyagi, S.; Iwama, N.; Kawabata, T.; Hasegawa, K. Longevity and Diet in Okinawa, Japan: The Past, Present and Future. Asia Pac. J. Public Health 2003, 15 (Suppl. 1), S3–S9. [Google Scholar] [CrossRef] [PubMed]
- Willcox, D.C.; Willcox, B.J.; Todoriki, H.; Suzuki, M. The Okinawan Diet: Health Implications of a Low-Calorie, Nutrient-Dense, Antioxidant-Rich Dietary Pattern Low in Glycemic Load. J. Am. Coll. Nutr. 2009, 28 (Suppl. 4), 500S–516S. [Google Scholar] [CrossRef] [PubMed]
- Plaza, M.; Cifuentes, A.; Ibanez, E. In the search of new functional food ingredients from algae. Trends Food Sci. Technol. 2008, 19, 31–39. [Google Scholar] [CrossRef]
- Lee, S.-H.; Jeon, Y.-J. Anti-diabetic effects of brown algae derived phlorotannins, marine polyphenols through diverse mechanisms. Fitoterapia 2013, 86, 129–136. [Google Scholar] [CrossRef] [PubMed]
- Wijesekara, I.; Yoon, N.Y.; Kim, S.-K. Phlorotannins from Ecklonia cava (Phaeophyceae): Biological activities and potential health benefits. BioFactors 2010, 36, 408–414. [Google Scholar] [CrossRef] [PubMed]
- Lorenzati, B.; Zucco, C.; Miglietta, S.; Lamberti, F.; Bruno, G. Oral Hypoglycemic Drugs: Pathophysiological Basis of Their Mechanism of Action. Pharmaceuticals 2010, 3, 3005–3020. [Google Scholar] [CrossRef] [PubMed]
- Coe, S.; Ryan, L. Impact of polyphenol-rich sources on acute postprandial glycaemia: A systematic review. J. Nutr. Sci. 2016, 5, 1–11. [Google Scholar] [CrossRef] [PubMed]
- Apostolidis, E.; Lee, C. In Vitro Potential of Ascophyllum nodosum Phenolic Antioxidant-Mediated α-Glucosidase and α-Amylase Inhibition. J. Food Sci. 2010, 75, H97–H102. [Google Scholar] [CrossRef] [PubMed]
- Heo, S.-J.; Hwang, J.-Y.; Choi, J.-I.; Han, J.-S.; Kim, H.-J.; Jeon, Y.-J. Diphlorethohydroxycarmalol isolated from Ishige okamurae, a brown algae, a potent α-glucosidase and α-amylase inhibitor, alleviates postprandial hyperglycemia in diabetic mice. Eur. J. Pharmacol. 2009, 615, 252–256. [Google Scholar] [CrossRef] [PubMed]
- Iwai, K. Antidiabetic and Antioxidant Effects of Polyphenols in Brown Alga Ecklonia stolonifera in Genetically Diabetic KK-Ay Mice. Plant Foods Hum. Nutr. 2008, 63, 163–169. [Google Scholar] [CrossRef] [PubMed]
- Zhang, J.; Tiller, C.; Shen, J.; Wang, C.; Girouard, G.S.; Dennis, D.; Barrow, C.J.; Miao, M.; Ewart, H.S. Antidiabetic properties of polysaccharide- and polyphenolic-enriched fractions from the brown seaweed Ascophyllum nodosum. Can. J. Physiol. Pharmacol. 2007, 85, 1116–1123. [Google Scholar] [CrossRef] [PubMed]
- Roy, M.-C.; Anguenot, R.; Fillion, C.; Beaulieu, M.; Bérubé, J.; Richard, D. Effect of a commercially-available algal phlorotannins extract on digestive enzymes and carbohydrate absorption in vivo. Food Res. Int. 2011, 44, 3026–3029. [Google Scholar] [CrossRef]
- Lee, S.-H.; Jeon, Y.-J. Efficacy and safety of a dieckol-rich extract (AG-dieckol) of brown algae, Ecklonia cava, in pre-diabetic individuals: A double-blind, randomized, placebo-controlled clinical trial. J. Funct. Foods 2015, 6, 853–858. [Google Scholar] [CrossRef] [PubMed]
- Paradis, M.-E.; Couture, P.; Lamarche, B. A randomised crossover placebo-controlled trial investigating the effect of brown seaweed (Ascophyllum nodosum and Fucus vesiculosus) on postchallenge plasma glucose and insulin levels in men and women. Appl. Physiol. Nutr. Metab. 2011, 36, 913–919. [Google Scholar] [CrossRef] [PubMed]
- Chiu, K.C.; Cohan, P.; Lee, N.P.; Chuang, L.-M. Insulin Sensitivity Differs Among Ethnic Groups with a Compensatory Response in Beta-Cell Function. Diabetes Care 2000, 23, 1353–1358. [Google Scholar] [CrossRef] [PubMed]
- Murray, M.; Dordevic, A.; Bonham, M.; Ryan, L. Do marine algal polyphenols have antidiabetic, anti-hyperlipidaemic or anti-inflammatory effects in humans? A systematic review. Crit. Rev. Food Sci. Nutr. 2017. [Google Scholar] [CrossRef] [PubMed]
- 3412.0 Migration, Australia, 2015–16. Available online: http://www.abs.gov.au/ausstats/[email protected]/Latestproducts/3412.0Media%20Release12015-16?opendocument&tabname=Summary&prodno=3412.0&issue=2015-16&num=&view= (accessed on 20 June 2017).
- Bryans, J.A.; Judd, P.A.; Ellis, P.R. The Effect of Consuming Instant Black Tea on Postprandial Plasma Glucose and Insulin Concentrations in Healthy Humans. J. Am. Coll. Nutr. 2007, 26, 471–477. [Google Scholar] [CrossRef] [PubMed]
- Shin, H.C.; Kim, S.H.; Park, Y.; Lee, B.H.; Hwang, H.J. Effects of 12-week oral supplementation of Ecklonia cava polyphenols on anthropometric and blood lipid parameters in overweight Korean individuals: A double-blind randomized clinical trial. Phytother. Res. 2012, 26, 363–368. [Google Scholar] [CrossRef] [PubMed]
- Phillips, P. Oral glucose tolerance testing. Aust. Fam. Physician 2012, 41, 391–393. [Google Scholar] [PubMed]
- Bosy-Westphal, A.; Schautz, B.; Later, W.; Kehayias, J.; Gallagher, D.; Muller, M. What makes a BIA equation unique? Validity of eight-electrode multifrequency BIA to estimate body composition in a healthy adult population. Eur. J. Clin. Nutr. 2013, 67, S14–S21. [Google Scholar] [CrossRef] [PubMed]
- International Society for the Advancement of Kinanthropometry. International Standards for Anthropometric Assessment; International Society for the Advancement of Kinanthropometry: Sydney, Australia, 2001. [Google Scholar]
- Wootton-Beard, P.C.; Brandt, K.; Fell, D.; Warner, S.; Ryan, L. Effects of a beetroot juice with high neobetanin content on the early-phase insulin response in healthy volunteers. J. Nutr. Sci. 2014, 3, 1–9. [Google Scholar] [CrossRef] [PubMed]
- Phenol-Explorer: An Online Comprehensive Database on Polyphenol Contents in Foods. Available online: http://phenol-explorer.eu/ (accessed on 17 February 2017).
- USDA Database for the Flavonoid Content of Selected Foods, Release 3.1. Available online: https://www.ars.usda.gov/northeast-area/beltsville-md/beltsville-human-nutrition-research-center/nutrient-data-laboratory/docs/usda-database-for-the-flavonoid-content-of-selected-foods-release-31-december-2013/ (accessed on 17 February 2017).
- Craig, C.; Marshall, A.; Sjöström, M.; Bauman, A.; Booth, M.; Ainsworth, B.; Pratt, M.; Ekelund, U.; Yngve, A.; Sallis, J.; Oja, P. International physical activity questionnaire: 12-country reliability and validity. Med. Sci. Sports Exerc. 2003, 35, 1381–1395. [Google Scholar] [CrossRef] [PubMed]
- Zhang, Q.; Zhang, J.; Shen, J.; Silva, A.; Dennis, D.A.; Barrow, C.J. A simple 96-well microplate method for estimation of total polyphenol content in seaweeds. J. Appl. Phycol. 2006, 18, 445–450. [Google Scholar] [CrossRef]
- Pallant, J. SPSS Survival Manual: A Step by Step Guide to Data Analysis Using IBM SPSS, 6th ed.; Allen & Unwin: Crows Nest, Australia, 2016. [Google Scholar]
- Crozier, A.; Jaganath, I.B.; Clifford, M.N. Dietary phenolics: Chemistry, bioavailability and effects on health. Nat. Prod. Rep. 2009, 26, 1001–1043. [Google Scholar] [CrossRef] [PubMed]
- Lee, C.Y. Challenges in providing credible scientific evidence of health benefits of dietary polyphenols. J. Funct. Foods 2013, 5, 524–526. [Google Scholar] [CrossRef]
- Riccardi, G.; Rivellese, A.A. Effects of dietary fiber and carbohydrate on glucose and lipoprotein metabolism in diabetic patients. Diabetes Care 1991, 14, 1115–1125. [Google Scholar] [CrossRef] [PubMed]
- Weickert, M.O.; Mohlig, M.; Koebnick, C.; Holst, J.J.; Namsolleck, P.; Ristow, M.; Osterhoff, M.; Rochlitz, H.; Rudovich, N.; Spranger, J.; et al. Impact of cereal fibre on glucose-regulating factors. Diabetologia 2005, 48, 2343–2353. [Google Scholar] [CrossRef] [PubMed]
- Murray, M.; Dordevic, A.; Ryan, L.; Bonham, M. Phlorotannins and macroalgal polyphenols: Potential as functional food ingredients and role in health promotion. In Functional Food in Human Health; Rani, V., Yadav, U., Eds.; Springer: New Delhi, India, 2018. [Google Scholar]
- Al-Naimi, S.; Hampton, S.M.; Richard, P.; Tzung, C.; Morgan, L.M. Postprandial Metabolic Profiles Following Meals and Snacks Eaten during Simulated Night and Day Shift Work. Chronobiol. Int. 2004, 21, 937–947. [Google Scholar] [CrossRef] [PubMed]
- Gibbs, M.; Harrington, D.; Starkey, S.; Williams, P.; Hampton, S. Diurnal postprandial responses to low and high glycaemic index mixed meals. Clin. Nutr. 2014, 33, 889–894. [Google Scholar] [CrossRef] [PubMed]
- Kalsbeek, A.; la Fleur, S.; Fliers, E. Circadian control of glucose metabolism. Mol. Metab. 2014, 3, 372–383. [Google Scholar] [CrossRef] [PubMed]
- Leung, G.K.W.; Huggins, C.E.; Bonham, M.P. Effect of meal timing on postprandial glucose responses to a low glycemic index meal: A crossover trial in healthy volunteers. Clin. Nutr. 2017. [Google Scholar] [CrossRef] [PubMed]
- Pan, A.; Schernhammer, E.S.; Sun, Q.; Hu, F.B. Rotating Night Shift Work and Risk of Type 2 Diabetes: Two Prospective Cohort Studies in Women. PLoS Med. 2011, 8, E1001141. [Google Scholar] [CrossRef] [PubMed]
- AIHW; Holdenson, Z.; Catanzariti, L.; Phillips, G.; Waters, A. A Picture of Diabetes in Overseas-Born Australians; Bulletin No. 9; Australian Institute of Health and Welfare: Canberra, Australia, 2003.
- Abate, N.; Chandalia, M. Ethnicity and type 2 diabetes Focus on Asian Indians. J. Diabetes Complic. 2001, 15, 320–327. [Google Scholar] [CrossRef]
- Frayn, K.N. Visceral fat and insulin resistance—Causative or correlative? Br. J. Nutr. 2000, 83, S71–S77. [Google Scholar] [CrossRef] [PubMed]
- Petersen, K.F.; Dufour, S.; Feng, J.; Befroy, D.; Dziura, J.; Man, C.D.; Cobelli, C.; Shulman, G.I. Increased prevalence of insulin resistance and nonalcoholic fatty liver disease in Asian-Indian men. Proc. Natl. Acad. Sci. USA 2006, 103, 18273–18277. [Google Scholar] [CrossRef] [PubMed]


| Characteristic | Total Population | Non-Asian Background | Asian Background |
|---|---|---|---|
| Median (IQR 1) | Median (IQR) | Median (IQR) | |
| Age (years) | 23 (11) | 24 (17) | 21 (5) |
| BMI (kg/m2) | 21.9 (3.0) | 23.0 (2.3) | 21.0 (1.9) |
| Waist circumference (cm) | 72.0 (8.3) | 73.0 (7.5) | 68.5 (12.5) |
| Total fat mass (%)—females | 27.6 (4.7) | 27.3 (4.8) | 27.6 (7.8) |
| Total fat mass (%)—males | 13.9 (7.5) | 13.4 (7.1) | 14.1 (13.2 *) |
| Estimated daily polyphenol intake (mg) | 801 (732) | 930 (561) | 375 (362) |
| Estimated daily energy intake (kJ) | 9443 (4233) | 9214 (4150) | 9739 (7427) |
| Systolic blood pressure (mmHg) | 121 (15) | 125 (13) | 115 (11) |
| Diastolic blood pressure (mmHg) | 76 (7) | 76 (8) | 77 (7) |
| Visceral fat (L) | 0.6 (0.8) | 0.3 (0.5) | 1.1 (0.4) |
| n (frequency) | n (frequency) | n (frequency) | |
| Female | 29 (76%) | 20 (77%) | 9 (75%) |
| Male | 9 (24%) | 6 (23%) | 3 (25%) |
| Physical Activity level | |||
| Low | 6 (16%) | 5 (19%) | 1 (8%) |
| Moderate | 10 (26%) | 3 (12%) | 7 (58%) |
| High | 22 (58%) | 18 (69%) | 4 (34%) |
| Outcome | Ethnic Background | n | Placebo | Low Dose | High Dose | p (Effect of Supplement) | p (Effect of Ethnicity) |
|---|---|---|---|---|---|---|---|
| Blood glucose | |||||||
| Fasting (mmol/L) | Total | 38 | 4.4 (0.3) | 4.5 (0.4) | 4.4 (0.4) | 0.157 | NA |
| non-Asian | 26 | 4.3 (0.4) | 4.5 (0.5) | 4.4 (0.5) | 0.154 | 0.787 | |
| Asian | 12 | 4.4 (0.3) | 4.5 (0.3) | 4.5 (0.4) | 0.914 | ||
| iAUC (mmol/L·min) | Total | 38 | 151.9 (61.1) | 136.2 (57.5) | 145.7 (62.8) | 0.798 | NA |
| non-Asian | 26 | 145.6 (61.3) | 129.8 (63.5) | 136.3 (62.3) | 0.168 | 0.208 | |
| Asian | 12 | 165.6 (61.0) | 150.2 (40.7) | 166.1 (61.6) | 0.972 | ||
| Peak concentration (mmol/L) | Total | 38 | 6.9 (0.8) | 6.9 (0.8) | 6.9 (0.8) | 0.555 | NA |
| non-Asian | 26 | 6.8 (0.7) | 6.9 (0.8) | 6.8 (0.8) | 0.402 | 0.393 | |
| Asian | 12 | 7.1 (1.0) | 6.9 (0.9) | 7.1 (0.8) | 0.602 | ||
| Plasma insulin | |||||||
| Fasting (pmol/L) a | Total | 38 | 53.5 (54.0) | 71.7 (50.2) | 56.5 (57.3) | 0.302 | NA |
| non-Asian | 26 | 50.9 (38.8) | 69.6 (55.5) | 52.1 (55.2) | 0.721 | 0.198 | |
| Asian | 12 | 73.2 (85.1) | 80.6 (50.1) | 64.1 (73.8) | 0.103 | ||
| iAUC (pmol/L·min) a | Total | 38 | 19,451 (16722) | 20,421 (13207) | 19,967 (15917) | 0.920 | NA |
| non-Asian | 26 | 17,380 (13357) b | 18,702 (11095) | 17,874 (13279) b | 0.278 | 0.016 | |
| Asian | 12 | 24,231 (28205) b | 23,923 (34482) | 31,573 (40005) b | 0.306 | ||
| Peak concentration (pmol/L) a | Total | 38 | 382.5 (367.7) | 373.3 (257.1) | 325.8 (305.1) | 0.145 | NA |
| non-Asian | 26 | 321.6(279.8) b | 368.9 (180.9) | 336.1 (189.5) | 0.755 | 0.065 | |
| Asian | 12 | 484.1 (637.8) b | 471.3 (413.7) | 324.5 (433.8) | 0.158 | ||
© 2018 by the authors. Licensee MDPI, Basel, Switzerland. This article is an open access article distributed under the terms and conditions of the Creative Commons Attribution (CC BY) license (http://creativecommons.org/licenses/by/4.0/).
Share and Cite
Murray, M.; Dordevic, A.L.; Ryan, L.; Bonham, M.P. The Impact of a Single Dose of a Polyphenol-Rich Seaweed Extract on Postprandial Glycaemic Control in Healthy Adults: A Randomised Cross-Over Trial. Nutrients 2018, 10, 270. https://doi.org/10.3390/nu10030270
Murray M, Dordevic AL, Ryan L, Bonham MP. The Impact of a Single Dose of a Polyphenol-Rich Seaweed Extract on Postprandial Glycaemic Control in Healthy Adults: A Randomised Cross-Over Trial. Nutrients. 2018; 10(3):270. https://doi.org/10.3390/nu10030270
Chicago/Turabian StyleMurray, Margaret, Aimee L. Dordevic, Lisa Ryan, and Maxine P. Bonham. 2018. "The Impact of a Single Dose of a Polyphenol-Rich Seaweed Extract on Postprandial Glycaemic Control in Healthy Adults: A Randomised Cross-Over Trial" Nutrients 10, no. 3: 270. https://doi.org/10.3390/nu10030270