Article

Higher Dietary Magnesium Intake and Higher Magnesium Status Are Associated with Lower Prevalence of Coronary Heart Disease in Patients with Type 2 Diabetes

by
Christina M. Gant
1,2,
Sabita S. Soedamah-Muthu
3,4,
S. Heleen Binnenmars
2,
Stephan J. L. Bakker
2,
Gerjan Navis
2 and
Gozewijn D. Laverman
1,*
1
Department of Internal Medicine/Nephrology, ZGT Hospital, 7609 PP Almelo, The Netherlands
2
Department of Internal Medicine, Division of Nephrology, University of Groningen, University Medical Centre Groningen, 9713EZ Groningen, The Netherlands
3
Centre of Research on Psychology in Somatic Diseases (CORPS), Department of Medical and Clinical Psychology, Tilburg University, 5037 AB Tilburg, The Netherlands
4
Institute for Food, Nutrition and Health, University of Reading, Reading RG1 5EX, UK
*
Author to whom correspondence should be addressed.
Nutrients 2018, 10(3), 307; https://doi.org/10.3390/nu10030307
Submission received: 23 January 2018 / Revised: 24 February 2018 / Accepted: 1 March 2018 / Published: 5 March 2018
(This article belongs to the Special Issue Magnesium Intake and Human Health)

Abstract

:
In type 2 diabetes mellitus (T2D), the handling of magnesium is disturbed. Magnesium deficiency may be associated with a higher risk of coronary heart disease (CHD). We investigated the associations between (1) dietary magnesium intake; (2) 24 h urinary magnesium excretion; and (3) plasma magnesium concentration with prevalent CHD in T2D patients. This cross-sectional analysis was performed on baseline data from the DIAbetes and LifEstyle Cohort Twente-1 (DIALECT-1, n = 450, age 63 ± 9 years, 57% men, and diabetes duration of 11 (7–18) years). Prevalence ratios (95% CI) of CHD by sex-specific quartiles of magnesium indicators, as well as by magnesium intake per dietary source, were determined using multivariable Cox proportional hazard models. CHD was present in 100 (22%) subjects. Adjusted CHD prevalence ratios for the highest compared to the lowest quartiles were 0.40 (0.20, 0.79) for magnesium intake, 0.63 (0.32, 1.26) for 24 h urinary magnesium excretion, and 0.62 (0.32, 1.20) for plasma magnesium concentration. For every 10 mg increase of magnesium intake from vegetables, the prevalence of CHD was, statistically non-significantly, lower (0.75 (0.52, 1.08)). In this T2D cohort, higher magnesium intake, higher 24 h urinary magnesium excretion, and higher plasma magnesium concentration are associated with a lower prevalence of CHD.

1. Introduction

Coronary heart disease (CHD) is one of the most prevalent and high-impact complications related to type 2 diabetes mellitus (T2D) [1,2]. In the general population, magnesium (Mg) deficiency might be associated with a greater risk of CHD; however, data on the inverse associations between Mg status and intake and CHD are inconsistent [3,4,5,6,7,8,9]. In T2D, the prevalence of hypomagnesemia is increased 14–48%, compared with 3–15% in those without T2D [10,11]. This could partly be due to increased urinary Mg excretion caused by insulin resistance, and partly due to poor dietary Mg intake [10,11,12,13]. However, surprisingly few studies report on the association between Mg and CHD in patients with established T2D [14,15].
In the DIAbetes and LifEstyle Cohort Twente (DIALECT), we collected extensive data on dietary Mg intake, 24 h urinary Mg excretion, and plasma Mg concentration. We aimed to study the association between the parameters of Mg (i.e., dietary Mg intake, 24 h urinary Mg excretion, and serum Mg concentration) and CHD. When we found that dietary Mg intake was inversely associated with CHD risk, we also explored whether there was an association between Mg intake from specific dietary sources (i.e., cereals, potatoes, etc.) and CHD risk.

2. Materials and Methods

2.1. Study Design

This was a cross-sectional analysis performed in the DIAbetes and LifEstyle Cohort Twente-1 (DIALECT-1). The study population and study procedures have been described previously [16]. The study has been approved by the relevant institutional review boards (METC-Twente, NL57219.044.16; METC-Groningen, 1009.68020), is registered in the Netherlands Trial Register (NTR trial code 5855), and is performed according to the guidelines of good clinical practice and the declaration of Helsinki.

2.2. Participants

All patients with T2D treated in the outpatient clinic of our hospital, aged 18+ years, were eligible for the study. Exclusion criteria were inability to understand the informed consent procedure, insufficient command of the Dutch language, or dialysis dependency. The inclusion flowchart has been described previously [16]. In total, 1082 patients were eligible for the study, of which 470 agreed to participate. The most important reasons for non-participation were no interest in the trial (n = 123), inability due to co-morbidity (n = 62), and no transport options (n = 58). After the baseline visit, 20 patients were excluded due to the fact that their diabetes diagnosis changed from type 2 diabetes to type 1 diabetes. Therefore, a total of 450 patients with type 2 diabetes were included in DIALECT-1. Missing values for specific variables are listed in Table 1.

2.3. Study Procedures

Eligible patients with type 2 diabetes were selected from the electronic patient file. At the clinic, sociodemographic characteristics, medical history, lifestyle behaviors, and current medications were recorded and anthropometric dimension were measured. Blood pressure was measured in a supine position by an automated device (Dinamap®; GE Medical systems, Milwaukee, WI, USA) for 15 min with a one-minute interval. The mean systolic and diastolic pressure of the final three measurements was used for further analysis. Physical activity was assessed using the Short QUestionnaire to ASses Health enhancing physical activity (SQUASH) questionnaire, which was previously validated and is commonly used in the Netherlands for population research [17].
Blood was drawn from venipuncture, for measurement of Mg and other variables relevant for diabetes. 24-h urine collections were performed as prescribed previously [16]. Samples of blood and urine were stored at −80 °C for later analysis.

2.4. Magnesium Measurements

We calculated dietary Mg intake using a semi-quantitative food frequency questionnaire (FFQ), inquiring about the intake of 177 items during the last month, taking seasonal variations into account [18]. The FFQ was developed and validated at the Wageningen University, and has been updated several times. For each food item, the frequency was recorded in times per day, week, or month. The number of servings was expressed in natural units (e.g., a slice of bread or a whole apple) or household measures (e.g., cup or spoon). Both questionnaires were self-administered and filled in at home. The filled-in questionnaires were checked for completeness by a trained researcher, and inconsistent answers were verified with the patients. If the patient could not remember an exact number, the trained researcher approximated the intake as closely as possible during the interview. Dietary data was converted into daily nutrient intake using the Dutch Food Composition Table of 2013 [19]. We calculated the average intake of Mg by multiplying the frequency of consumption of each food item by its Mg content in the Dutch Food Composition Table of 2013 [19], and summing the amount of Mg across all food items. We calculated Mg intake from different food categories by multiplying the frequency of consumption of each food item in that specific category by its Mg content, and summing across all food items in that category. Food items of the FFQ included in each category are listed in supplementary Table S1.
Plasma and urinary Mg were measured in stored plasma samples in routine laboratory measurements using the xylidyl blue method. Buffer/Ethylenediaminetetraacetic acid was added to mask calcium. After incubation, xylidyl blue was added to form a purple complex with Mg. Mg concentration was determined by the photometric measurement of xylidyl blue extinction. The detection range for plasma Mg was 0.1–5 mmol/L, and for 24 h urinary Mg the range was 0.5–25 mmol/L. There were no patients with values outside of the detection ranges. Hypomagnesemia was defined as serum Mg concentration <0.70 mmol/L.

2.5. Main Study Outcome

Coronary heart disease (CHD) is defined as physician-diagnosed unstable angina pectoris or myocardial infarction, percutaneous coronary intervention, or a coronary artery bypass graft in the medical history. Medical history was checked for CHD during the interview at the baseline visit, and was later reviewed in the hospital electronic patient files on three different occasions, by three different physician researchers, who were unware of the magnesium data.

2.6. Statistics

All statistical analyses were performed using the Statistical Package for the Social Sciences (SPSS), version 23.0. Normally-distributed data are presented as mean ± standard deviation. Skewed variables are expressed as median (interquartile range). Dichotomous variables are presented in number and percentage. Dietary intake of Mg was adjusted for energy intake by the residual method [20].
Differences between T2D patients with and without CHD were determined using the Student t (normal distribution), Mann–Whitney U (skewed distribution), or Chi-Square (categorical variables) test. In order to examine parameters associated with magnesium intake, we divided the population into sex-specific quartiles of adjusted magnesium intake. Differences between the quartiles were assessed using one-way ANOVA (normal distribution), Kruskal–Wallis (skewed distribution), or Chi-Square (categorical variables) analysis.
Correlations between Mg parameters were assessed using Pearson’s correlation coefficient.
We calculated the prevalence ratio (95% CI) of CHD by sex-specific quartiles of (1) dietary Mg intake; (2) 24 h urinary Mg excretion; and (3) plasma Mg concentration, using multivariable Cox proportional hazard models, with the time to event set at 1 for all patients. The models were adjusted for the potential confounding of lifestyle parameters (BMI, smoking, alcohol, and physical activity) and nutritional intake (24 h urinary sodium excretion and 24 h urinary potassium excretion) [3,21]. There was a strong correlation between dietary calcium and Mg intake (R = 0.70), therefore we did not adjust for calcium intake in the final model. Effect modification was checked for gender, BMI, smoking, and alcohol, and no significant effect modification was found (p > 0.20 for all interaction terms). Sensitivity analyses were performed by excluding patients with diabetic kidney disease, and prevalence ratios were similar as in the primary analyses.
Additionally, we performed multivariable Cox proportional hazard models, and calculated the prevalence ratios of CHD for each 10 mg increment of dietary Mg intake from different sources (cereals, dairy, coffee, potatoes, meat, legumes and nuts, fruit, vegetables, and other). The models were adjusted for potential confounding of lifestyle parameters (age, BMI, smoking, alcohol, and physical activity) and Mg intake from the miscellaneous sources.

3. Results

In total, 450 patients with T2D were included in DIALECT-1. Baseline characteristics are shown in Table 1. In short, patients were 63 ± 9 years old, and the majority of the population was male (57%). The population represents T2D in secondary health care, with a median diabetes duration of 11 (7–18) years, and a high prevalence of diabetic nephropathy (42%).
There were 100 (22%) CHD cases diagnosed in our population (Table 1). T2D patients with CHD were older (66 ± 7 vs. 62 ± 9 years, p < 0.001), were more often men (71% vs. 54%, p = 0.003), and more often had peripheral artery disease (44% vs. 20%, p < 0.001), and nephropathy (58% vs. 38%, p < 0.001) than patients without CHD. There were no differences in lifestyle parameters between those with and without CHD. Regarding pharmacological treatment, those with CHD more often used beta-blockers (77% vs. 37%, p < 0.001), and loop diuretics (33% vs. 14%, p < 0.001) than those without CHD. This was paralleled by a lower diastolic blood pressure (72 ± 10 mmHg vs. 75 ± 9 mmHg, p = 0.01) and heart rate (69 ± 11 beats/min vs. 75 ± 13 beats/min, p < 0.001) in patients with CHD. Systolic blood pressure was 136 ± 16 mmHg, and did not differ between the groups. Although patients with CHD more often used statins (86% vs. 73%, p = 0.006), serum LDL was similar in the groups (2.0 ± 0.7 mmol/L), and serum HDL cholesterol was lower in those with CHD (1.0 ± 0.3 mmol/L vs. 1.2 ± 0.4 mmol/L, p < 0.001) compared to those without CHD.
Mean energy-adjusted dietary Mg intake was 305 ± 46 mg/day, and was lower in those with CHD (adjusted standardized beta = −0.14, p = 0.003). Mean 24 h urinary Mg excretion was 3.94 ± 2.05 mmol/24 h, and mean plasma Mg concentration was 0.77 ± 0.09 mmol/L; neither differed statistically significantly between those with and without CHD (Table 1). Hypomagnesemia (plasma Mg < 0.7 mmol/L) was present in 73 patients (17%), of which 11 patients (3%) had a plasma Mg of <0.6 mmol/L.
Dietary Mg intake was significantly correlated with 24 h urinary Mg excretion (Pearson R = 0.24, p < 0.001), but not with plasma Mg (R = 0.02, p = 0.64). 24 h urinary Mg excretion was significantly correlated with plasma Mg (R = 0.13, p < 0.008).
Systolic blood pressure was lowest in the highest gender-specific quartile of energy-adjusted magnesium intake (4th quartile 133 ± 13 vs. 1st quartile 137 ± 17 mmHg; Supplementary Table S2), and the number of antihypertensive drugs used was lowest in this quartile as well (4th quartile 2 (0–3) vs. 2 (1–3) in other quartiles, p = 0.008). Serum HbA1c and cholesterol levels were similar in all Mg intake quartiles. There was a trend towards higher urinary potassium excretion, dietary calcium, fiber, protein, and carbohydrate intake, as well as a lower dietary intake of fat in each of the higher quartiles of magnesium intake.

3.1. Association between Dietary Magnesium Intake, 24 h Urinary Magnesium Excretion, Plasma Magnesium Concentration, and the Prevalence of Coronary Heart Disease

The highest quartile of Mg intake was significantly associated with a lower prevalence ratio (PR) of CHD than the lowest quartile of Mg intake (0.40 (0.20, 0.77); Table 2). When adjusting for age and lifestyle parameters (BMI, smoking, alcohol, and physical activity), the PR remained largely unchanged (0.42 (0.22, 0.82)). After adjustment for dietary intake of other micronutrients (total energy intake, sodium, and potassium), the PR became (0.40 (0.20, 0.79)), and the p-trend was 0.01.
There was a similar trend towards a lower prevalence of CHD in the highest quartile of 24 h urinary Mg excretion, which was not statistically significant (PR 0.63 (0.33, 1.19)). After adjustment for lifestyle and nutritional factors, the PR remained similar (0.63 (0.32, 1.26)). Also, the highest quartile of plasma Mg concentration had a non-significant trend towards a lower prevalence of CHD (unadjusted PR 0.60 (0.31, 1.14), adjusted PR 0.62 (0.32, 1.20)). The PR ratios for dietary Mg intake, urinary Mg excretion and plasma Mg concentration did not change after further adjustment for other classic CHD risk factors, namely systolic blood pressure and LDL cholesterol (data not shown).

3.2. Analysis on Source of Magnesium Intake and Prevalence of CHD

We performed an explorative analysis whether there was an association between Mg intake from specific dietary sources and CHD. The largest dietary contributors to total dietary Mg intake for patients with T2D (Figure 1) were cereals at 22% (16–26%), dairy at 14% (10–20%), coffee at 9% (6–13%), potatoes at 7% (4–10%), meat at 6% (5–8%), legumes and nuts at 6% (4–11%), fruit at 5% (3–8%), and vegetables with 3% (2–5%). We found no statistically significant association between Mg intake from specific food groups and CHD (Table 3). However, there was a non-significant trend towards a lower prevalence of CHD for every 10 mg increase of dietary Mg intake derived from vegetables (PR 0.75 (0.52, 1.08)).

4. Discussion

We found inverse associations for dietary Mg intake, 24 h urinary Mg excretion, and plasma Mg concentration with the prevalence of CHD in patients with T2D. As far as we know, this is the first study in T2D patients which simultaneously reports on these three Mg parameters in relation to CHD. The inverse association between dietary Mg intake and the prevalence of CHD we found was strongest for Mg intake derived from vegetables, albeit not statistically significant.
The mean dietary Mg intake we report (305 ± 46 mg/day) was somewhat lower than the median Mg intake in the general Dutch population, which is around 350 mg/day [22], but was comparable to median Mg intake of population studies in the U.S. (308 mg/day) [4]. We found that in the Dutch population, cereals, dairy, and coffee intake were the largest contributors to total Mg intake, at 22%, 14%, and 9% respectively. This was somewhat different from the U.K. population, where cereals (34%), meat (19%), and dairy (18%) intake were the most important contributors [23]. In contrast, in the U.S. population the most important food groups were vegetables (13%), milk (8%), and meat (7%) [24]. It should be noted that different groupings of food products renders a head-to-head comparison between these percentages difficult. The 24 h urinary Mg excretion we report (4.0 ± 2.1 mmol/24 h) was in line with the general population the Netherlands (4.2 ± 1.7 mmol/24 h for men and 3.5 ± 1.4 mmol/24 h for women) [5]. Plasma Mg concentration (0.77 ± 0.09 mmol/L) was similar to an earlier report about Dutch diabetes patients (0.74 ± 0.10 mmol/L) [25]. The prevalence of hypomagnesemia we found (17%) was in the range of the reported prevalence of hypomagnesemia in patients with T2D, between 14% and 48% [10,11], and emphasizes that clinical vigilance for hypomagnesemia is warranted in T2D, because it is associated with increased insulin resistance and faster renal function decline [26].
We are the first to report an inverse association between dietary Mg intake and the prevalence of CHD in T2D. In contrast, a large meta-analysis in non-T2D patients demonstrated no association between dietary Mg intake and incident CHD [9]. However, low dietary Mg intake was associated with a higher risk of stroke, heart failure, new-onset diabetes, and all-cause mortality [9]. It is known that in T2D renal wasting of Mg occurs [27]. Additionally, Mg supplementation in T2D can improve insulin sensitivity and metabolic control [28]. Possibly, an adequate Mg intake in patients with T2D is even more important than in those without T2D, in order to maintain an adequate Mg status and prevent diabetes-related complications. These data fuel the hypothesis that magnesium intake is beneficial in T2D patients.
In addition, when investigating Mg intake from specific food sources, we found the strongest inverse association between Mg derived from vegetables and CHD, albeit not quite reaching statistical significance. To our knowledge, the association with vegetable-derived Mg intake and CHD has not been described before. When studying Mg intake and Mg status, it is important to consider bioavailability of ingested Mg for intestinal uptake, as this might vary considerably depending on the source of Mg intake [29]. Possibly, bioavailability from Mg in vegetables is greater than from other food sources; however, this issue would have to be addressed an in-depth mechanistic study. Nevertheless, our data illustrate that when studying the association between micronutrients and outcomes, intake of different food groups is also important. As vegetable intake in our population was low [30], and vegetable intake only accounted for 3% of total Mg intake in this population, increasing vegetable intake is a good opportunity to not only increase Mg intake, but also to improve overall diet quality. It should be noted that in our study, it is difficult to distinguish between the protective effects of overall vegetable intake and those from vegetable-derived Mg intake. Other vegetable-derived components like antioxidants, but also potassium and vitamin K, might contribute to or interact with Mg in the eventual association with CHD [31,32,33,34]. Maybe the possible cohort effect from these micronutrients and Mg could amplify such protection. Since such an analysis is beyond the scope and available data of the current study, future studies are necessary to further investigate mechanisms behind vegetable intake and risk of coronary heart disease.
Additionally, we found that lower 24 h urinary Mg excretion was associated with more prevalent CHD. In line with this finding, in the general population an inverse association between Mg excretion and CHD was reported [5]. Potential renal Mg wasting in T2D renders the interpretation of urinary Mg excretion difficult. High urinary Mg excretion could, on the one hand, reflect a high dietary Mg intake; on the other hand, though, it could reflect the hypermagnesuria found in T2D [10,11]. This could explain why, in our cohort, dietary Mg intake is more strongly associated with CHD than 24 h urinary excretion.
In parallel, lower plasma Mg concentration was also associated with prevalent CHD. In T2D, the association between plasma Mg concentration and CHD was investigated previously, and conflicting results were reported [14,15]. In non-T2D subjects, conflicting results on the association between plasma Mg have been reported as well; however, a meta-analysis demonstrated an inverse association between plasma Mg and incident CHD [8]. As Mg is mainly an intracellular cation, and therefore plasma Mg only reflects 1% of bodily Mg stores, the validity of using plasma Mg as a marker for Mg status has been questioned; Mg deficiency has been reported in patients without overt hypomagnesemia [11,35].
Our paper was not designed to unravel mechanisms behind the inverse associations between Mg intake, Mg status, and CHD. However, several mechanisms have been proposed that could underlie this association. First, animal studies have consistently shown that higher Mg status inhibits vascular calcification [36,37]. In human subjects, serum Mg and dietary Mg intake were inversely associated with the degree of coronary calcification [4,6]. Second, low Mg status might be associated with cardiac arrhythmias [38]. Lastly, increased CHD risk might be mediated through the association between low Mg status or intake and increased traditional CHD risk factors, such as blood pressure [39] and insulin resistance [12].
Our paper is the first to simultaneously report the association between dietary Mg intake, factors of Mg status (24 h urinary Mg excretion and plasma Mg), and CHD in patients with established T2D. The robustness of our findings is established through the fact that all three Mg parameters were inversely associated with CHD. The main limitation of our paper is the cross-sectional design, which only allowed us to study associations and not causality, and therefore there is a risk of reverse causality bias. Another limitation is that the FFQ we used in our study was not validated to estimate magnesium intake. However, because there was a moderate correlation between dietary Mg intake and urinary Mg excretion, we deemed the results sufficiently valid.
Our study has several clinical implications. First, we show that Mg intake is of the utmost importance with relation to T2D. Patients with T2D are at risk of developing hypomagnesemia, as Mg intake in our population was somewhat lower in comparison to the general population. Additionally, patients with T2D have increased renal Mg excretion [27]. We show that Mg intake and Mg status is reduced in those with CHD, possibly indicating that higher Mg intake is associated with a lower risk of CHD. The best opportunity to increase Mg intake is to increase intake of Mg-rich vegetables. As Mg intake in the highest quartile is approximately 100 mg/day higher than in the lowest quartile, in clinical practice this could correspond with increasing vegetable intake by, for example, 200 g spinach, or 100 g rucola lettuce and two avocados per day. Alternatively, previous research has shown that several dietary patterns might reduce CHD risk or improve cardiac function, such as the Mediterranean diet; the Dietary Approaches to Stop Hypertension diet; or a high-protein, intermittent fasting, low-calorie diet [40,41,42]. We add to these findings by illustrating that Mg is an important component in such diets. For future studies, it would be of interest to investigate how Mg and other beneficial nutritional approaches could reinforce each other in the pursuit of the reduction of CHD in diabetes patients. Additionally, future mechanistic studies should be done to investigate how vegetable-derived nutrients, particularly Mg, might reduce CHD risk.

5. Conclusions

In a cohort of patients with established T2D, dietary magnesium intake, 24 h urinary magnesium excretion, and plasma magnesium concentration were inversely associated with the prevalence of coronary heart disease. Increasing dietary magnesium intake, especially through increasing vegetable intake, may reduce the risk of CHD in patients with established T2D.

Supplementary Materials

The following are available online at https://www.mdpi.com/2072-6643/10/3/307/s1, Table S1: Overview of food items included in each food category, Table S2: Baseline characteristics of patients with T2D by a breakup of dietary magnesium intake.

Acknowledgments

We thank Else van den Berg, Willeke van Kampen, Sanne van Huizen, Anne Davina, Manon Harmelink and Jolien Jaspers for their contribution to patient inclusion. We thank Jelle Sanderman for supervising laboratory measurements. This work was performed without external financial support.

Author Contributions

S.H.B., G.N., S.S.S.-M. and G.D.L. conceived and designed the study; C.M.G. and S.H.B. included patients; C.M.G. and S.S.S.-M. analyzed the data; S.J.L.B., G.N. and G.D.L. contributed reagents/materials/analysis tools; C.G. wrote the paper.

Conflicts of Interest

The authors declare no conflict of interest.

References

  1. Rana, J.S.; Liu, J.Y.; Moffet, H.H.; Jaffe, M.; Karter, A.J. Diabetes and Prior Coronary Heart Disease are Not Necessarily Risk Equivalent for Future Coronary Heart Disease Events. J. Gen. Intern. Med. 2016, 31, 387–393. [Google Scholar] [CrossRef] [PubMed]
  2. Emerging Risk Factors Collaboration; Sarwar, N.; Gao, P.; Seshasai, S.R.; Gobin, R.; Kaptoge, S.; Di Angelantonio, E.; Ingelsson, E.; Lawlor, D.A.; Selvin, E.; et al. Diabetes Mellitus, Fasting Blood Glucose Concentration, and Risk of Vascular Disease: A Collaborative Meta-Analysis of 102 Prospective Studies. Lancet 2010, 375, 2215–2222. [Google Scholar] [PubMed]
  3. Chiuve, S.E.; Sun, Q.; Curhan, G.C.; Taylor, E.N.; Spiegelman, D.; Willett, W.C.; Manson, J.E.; Rexrode, K.M.; Albert, C.M. Dietary and Plasma Magnesium and Risk of Coronary Heart Disease among Women. J. Am. Heart Assoc. 2013, 2, e000114. [Google Scholar] [CrossRef] [PubMed]
  4. Hruby, A.; O’Donnell, C.J.; Jacques, P.F.; Meigs, J.B.; Hoffmann, U.; McKeown, N.M. Magnesium Intake is Inversely Associated with Coronary Artery Calcification: The Framingham Heart Study. JACC Cardiovasc. Imaging 2014, 7, 59–69. [Google Scholar] [CrossRef] [PubMed]
  5. Joosten, M.M.; Gansevoort, R.T.; Mukamal, K.J.; van der Harst, P.; Geleijnse, J.M.; Feskens, E.J.; Navis, G.; Bakker, S.J.; PREVEND Study Group. Urinary and Plasma Magnesium and Risk of Ischemic Heart Disease. Am. J. Clin. Nutr. 2013, 97, 1299–1306. [Google Scholar] [CrossRef] [PubMed]
  6. Posadas-Sanchez, R.; Posadas-Romero, C.; Cardoso-Saldana, G.; Vargas-Alarcon, G.; Villarreal-Molina, M.T.; Perez-Hernandez, N.; Rodriguez-Perez, J.M.; Medina-Urrutia, A.; Jorge-Galarza, E.; Juarez-Rojas, J.G.; et al. Serum Magnesium is Inversely Associated with Coronary Artery Calcification in the Genetics of Atherosclerotic Disease (GEA) Study. Nutr. J. 2016, 15, 22. [Google Scholar] [CrossRef] [PubMed]
  7. Sakaguchi, Y.; Hamano, T.; Nakano, C.; Obi, Y.; Matsui, I.; Kusunoki, Y.; Mori, D.; Oka, T.; Hashimoto, N.; Takabatake, Y.; et al. Association between Density of Coronary Artery Calcification and Serum Magnesium Levels among Patients with Chronic Kidney Disease. PLoS ONE 2016, 11, e0163673. [Google Scholar] [CrossRef] [PubMed]
  8. Wu, J.; Xun, P.; Tang, Q.; Cai, W.; He, K. Circulating Magnesium Levels and Incidence of Coronary Heart Diseases, Hypertension, and Type 2 Diabetes Mellitus: A Meta-Analysis of Prospective Cohort Studies. Nutr. J. 2017, 16, 60. [Google Scholar] [CrossRef] [PubMed]
  9. Fang, X.; Wang, K.; Han, D.; He, X.; Wei, J.; Zhao, L.; Imam, M.U.; Ping, Z.; Li, Y.; Xu, Y.; et al. Dietary Magnesium Intake and the Risk of Cardiovascular Disease, Type 2 Diabetes, and all-Cause Mortality: A Dose-Response Meta-Analysis of Prospective Cohort Studies. BMC Med. 2016, 14, 210. [Google Scholar] [CrossRef] [PubMed]
  10. Gommers, L.M.; Hoenderop, J.G.; Bindels, R.J.; de Baaij, J.H. Hypomagnesemia in Type 2 Diabetes: A Vicious Circle? Diabetes 2016, 65, 3–13. [Google Scholar] [CrossRef] [PubMed]
  11. Pham, P.C.; Pham, P.M.; Pham, S.V.; Miller, J.M.; Pham, P.T. Hypomagnesemia in Patients with Type 2 Diabetes. Clin. J. Am. Soc. Nephrol. 2007, 2, 366–373. [Google Scholar] [CrossRef] [PubMed]
  12. Fang, X.; Han, H.; Li, M.; Liang, C.; Fan, Z.; Aaseth, J.; He, J.; Montgomery, S.; Cao, Y. Dose-Response Relationship between Dietary Magnesium Intake and Risk of Type 2 Diabetes Mellitus: A Systematic Review and Meta-Regression Analysis of Prospective Cohort Studies. Nutrients 2016, 8, 739. [Google Scholar] [CrossRef] [PubMed]
  13. Hruby, A.; Meigs, J.B.; O’Donnell, C.J.; Jacques, P.F.; McKeown, N.M. Higher Magnesium Intake Reduces Risk of Impaired Glucose and Insulin Metabolism and Progression from Prediabetes to Diabetes in Middle-Aged Americans. Diabetes Care 2014, 37, 419–427. [Google Scholar] [CrossRef] [PubMed]
  14. Liao, F.; Folsom, A.R.; Brancati, F.L. Is Low Magnesium Concentration a Risk Factor for Coronary Heart Disease? The Atherosclerosis Risk in Communities (ARIC) Study. Am. Heart J. 1998, 136, 480–490. [Google Scholar] [CrossRef]
  15. Peters, K.E.; Chubb, S.A.; Davis, W.A.; Davis, T.M. The Relationship between Hypomagnesemia, Metformin Therapy and Cardiovascular Disease Complicating Type 2 Diabetes: The Fremantle Diabetes Study. PLoS ONE 2013, 8, e74355. [Google Scholar] [CrossRef] [PubMed]
  16. Gant, C.M.; Binnenmars, S.H.; Berg, E.V.D.; Bakker, S.J.L.; Navis, G.; Laverman, G.D. Integrated Assessment of Pharmacological and Nutritional Cardiovascular Risk Management: Blood Pressure Control in the DIAbetes and LifEstyle Cohort Twente (DIALECT). Nutrients 2017, 9, 709. [Google Scholar] [CrossRef] [PubMed]
  17. Wendel-Vos, G.C.; Schuit, A.J.; Saris, W.H.; Kromhout, D. Reproducibility and Relative Validity of the Short Questionnaire to Assess Health-Enhancing Physical Activity. J. Clin. Epidemiol. 2003, 56, 1163–1169. [Google Scholar] [CrossRef]
  18. Feunekes, G.I.; Van Staveren, W.A.; De Vries, J.H.; Burema, J.; Hautvast, J.G. Relative and Biomarker-Based Validity of a Food-Frequency Questionnaire Estimating Intake of Fats and Cholesterol. Am. J. Clin. Nutr. 1993, 58, 489–496. [Google Scholar] [CrossRef] [PubMed]
  19. Rijksinstituut voor Volksgezondheid en Milieu. NEVO-Tabel (Dutch Food Composition Table): Nederlands Voedingsstoffenbestand, version 4.0; Rijksinstituut voor Volksgezondheid en Milieu: Bilthoven, The Netherlands, 2013.
  20. Willett, W.C.; Stampfer, M. Implications of total energy intake for epidemiologic analyses. In Nutritional Epidemology; Willett, W.C., Ed.; Oxford University Press: New York, NY, USA, 1998; pp. 273–301. [Google Scholar]
  21. Zhang, W.; Iso, H.; Ohira, T.; Date, C.; Tamakoshi, A.; JACC Study Group. Associations of Dietary Magnesium Intake with Mortality from Cardiovascular Disease: The JACC Study. Atherosclerosis 2012, 221, 587–595. [Google Scholar] [CrossRef] [PubMed]
  22. Van Rossum, C.; Fransen, H.; Verkaik-Kloosterman, J.; Buurma-Rethans, E.; Ocke, M. Dutch National Food Consumption Survey 2007–2010: Diet of Children and Adults Aged 7 to 69 Years; National Institute for Public Health and the Environment: Bilthoven, The Netherlands, 2011.
  23. Davies, B.E. The UK Geochemical Environment and Cardiovascular Diseases: Magnesium in Food and Water. Environ. Geochem. Health 2015, 37, 411–427. [Google Scholar] [CrossRef] [PubMed]
  24. Ford, E.S.; Mokdad, A.H. Dietary Magnesium Intake in a National Sample of US Adults. J. Nutr. 2003, 133, 2879–2882. [Google Scholar] [CrossRef] [PubMed]
  25. Kurstjens, S.; de Baaij, J.H.; Bouras, H.; Bindels, R.J.; Tack, C.J.; Hoenderop, J.G. Determinants of Hypomagnesemia in Patients with Type 2 Diabetes Mellitus. Eur. J. Endocrinol. 2017, 176, 11–19. [Google Scholar] [CrossRef] [PubMed]
  26. Grober, U.; Schmidt, J.; Kisters, K. Magnesium in Prevention and Therapy. Nutrients 2015, 7, 8199–8226. [Google Scholar] [CrossRef] [PubMed]
  27. McNair, P.; Christensen, M.S.; Christiansen, C.; Madsbad, S.; Transbol, I. Renal Hypomagnesaemia in Human Diabetes Mellitus: Its Relation to Glucose Homeostasis. Eur. J. Clin. Investig. 1982, 12, 81–85. [Google Scholar] [CrossRef]
  28. Rodriguez-Moran, M.; Guerrero-Romero, F. Oral Magnesium Supplementation Improves Insulin Sensitivity and Metabolic Control in Type 2 Diabetic Subjects: A Randomized Double-Blind Controlled Trial. Diabetes Care 2003, 26, 1147–1152. [Google Scholar] [CrossRef] [PubMed]
  29. Schuchardt, J.P.; Hahn, A. Intestinal Absorption and Factors Influencing Bioavailability of Magnesium-an Update. Curr. Nutr. Food Sci. 2017, 13, 260–278. [Google Scholar] [CrossRef] [PubMed]
  30. Gant, C.M.; Binnenmars, S.H.; Harmelink, M.; Soedamah-Muthu, S.S.; Bakker, S.J.L.; Navis, G.J.; Laverman, G.D. Real-Life Achievement of Lipid-Lowering Treatment Targets in the DIAbetes and LifEstyle Cohort Twente: Systemic Assessment of Pharmacological and Nutritional Factors. Nutr. Diabetes 2018, in press. [Google Scholar]
  31. Zhu, X.; Zuo, L. Characterization of Oxygen Radical Formation Mechanism at Early Cardiac Ischemia. Cell Death Dis. 2013, 4, e787. [Google Scholar] [CrossRef] [PubMed]
  32. Keyzer, C.A.; Vermeer, C.; Joosten, M.M.; Knapen, M.H.; Drummen, N.E.; Navis, G.; Bakker, S.J.; de Borst, M.H. Vitamin K Status and Mortality After Kidney Transplantation: A Cohort Study. Am. J. Kidney Dis. 2015, 65, 474–483. [Google Scholar] [CrossRef] [PubMed]
  33. Riphagen, I.J.; Keyzer, C.A.; Drummen, N.E.A.; de Borst, M.H.; Beulens, J.W.J.; Gansevoort, R.T.; Geleijnse, J.M.; Muskiet, F.A.J.; Navis, G.; Visser, S.T.; et al. Prevalence and Effects of Functional Vitamin K Insufficiency: The PREVEND Study. Nutrients 2017, 9, 1334. [Google Scholar] [CrossRef] [PubMed]
  34. Kieneker, L.M.; Gansevoort, R.T.; Mukamal, K.J.; de Boer, R.A.; Navis, G.; Bakker, S.J.; Joosten, M.M. Urinary Potassium Excretion and Risk of Developing Hypertension: The Prevention of Renal and Vascular End-Stage Disease Study. Hypertension 2014, 64, 769–776. [Google Scholar] [CrossRef] [PubMed]
  35. Barbagallo, M.; Di Bella, G.; Brucato, V.; D’Angelo, D.; Damiani, P.; Monteverde, A.; Belvedere, M.; Dominguez, L.J. Serum Ionized Magnesium in Diabetic Older Persons. Metabolism 2014, 63, 502–509. [Google Scholar] [CrossRef] [PubMed] [Green Version]
  36. Alesutan, I.; Tuffaha, R.; Auer, T.; Feger, M.; Pieske, B.; Lang, F.; Voelkl, J. Inhibition of Osteo/Chondrogenic Transformation of Vascular Smooth Muscle Cells by MgCl2 Via Calcium-Sensing Receptor. J. Hypertens. 2017, 35, 523–532. [Google Scholar] [CrossRef] [PubMed]
  37. Kircelli, F.; Peter, M.E.; Sevinc Ok, E.; Celenk, F.G.; Yilmaz, M.; Steppan, S.; Asci, G.; Ok, E.; Passlick-Deetjen, J. Magnesium Reduces Calcification in Bovine Vascular Smooth Muscle Cells in a Dose-Dependent Manner. Nephrol. Dial. Transplant. 2012, 27, 514–521. [Google Scholar] [CrossRef] [PubMed]
  38. Verduyn, S.C.; Vos, M.A.; van der Zande, J.; van der Hulst, F.F.; Wellens, H.J. Role of Interventricular Dispersion of Repolarization in Acquired Torsade-De-Pointes Arrhythmias: Reversal by Magnesium. Cardiovasc. Res. 1997, 34, 453–463. [Google Scholar] [CrossRef]
  39. Dibaba, D.T.; Xun, P.; Song, Y.; Rosanoff, A.; Shechter, M.; He, K. The Effect of Magnesium Supplementation on Blood Pressure in Individuals with Insulin Resistance, Prediabetes, or Noncommunicable Chronic Diseases: A Meta-Analysis of Randomized Controlled Trials. Am. J. Clin. Nutr. 2017, 106, 921–929. [Google Scholar] [CrossRef] [PubMed]
  40. Rosato, V.; Temple, N.J.; La Vecchia, C.; Castellan, G.; Tavani, A.; Guercio, V. Mediterranean Diet and Cardiovascular Disease: A Systematic Review and Meta-Analysis of Observational Studies. Eur. J. Nutr. 2017. [Google Scholar] [CrossRef] [PubMed]
  41. Fung, T.T.; Chiuve, S.E.; McCullough, M.L.; Rexrode, K.M.; Logroscino, G.; Hu, F.B. Adherence to a DASH-Style Diet and Risk of Coronary Heart Disease and Stroke in Women. Arch. Intern. Med. 2008, 168, 713–720. [Google Scholar] [CrossRef] [PubMed]
  42. Zuo, L.; He, F.; Tinsley, G.M.; Pannell, B.K.; Ward, E.; Arciero, P.J. Comparison of High-Protein, Intermittent Fasting Low-Calorie Diet and Heart Healthy Diet for Vascular Health of the Obese. Front. Physiol. 2016, 7, 350. [Google Scholar] [CrossRef] [PubMed]
Figure 1. Sources of magnesium intake from different food product categories in patients with T2D.
Nutrients 10 00307 g001
Table 1. Baseline characteristics of patients with type 2 diabetes mellitus (T2D) by a breakup of prevalent coronary heart disease (CHD).
Total PopulationNo CHDCHDp-Value
nn = 450n = 350 (78%)n = 100 (22%)
Patient characteristics
Age, years45063 ± 962 ± 966 ± 7<0.001
Male, n (%)450261 (58)190 (54)71 (71)0.003
Diabetes duration, years45011 (7–18)11 (7–17)13 (7–20)0.15
Systolic blood pressure, mmHg449136 ± 16136 ± 16136 ± 190.81
Diastolic blood pressure, mmHg44974 ± 975 ± 972 ± 100.01
Heart rate, beats/min44474 ± 1375 ± 1369 ± 11<0.001
Body surface area, m24482.10 ± 0.222.10 ± 0.232.07 ± 0.190.27
Urinary creatinine excretion, µmol/24 h44613.8 ± 4.813.8 ± 5.013.8 ± 4.20.97
Complications
Cerebrovascular disease, n (%)45047 (11)87 (22)13 (27)0.44
Peripheral artery disease, n (%)45044 (10)80 (20)20 (44)<0.001
Retinopathy, n (%)447106 (24)78 (23)32 (32)0.05
Neuropathy, n (%)450157 (36)116 (33)46 (46)0.02
Diabetic nephropathy, n (%)446183 (42)131 (38)58 (58)<0.001
eGFR < 60 mL/min·1.73 m2450101 (23)74 (21)30 (30)0.06
Microalbuminuria, n (%)445131 (30)92 (27)44 (44)0.001
Lifestyle
Body mass index, kg/m244832.8 ± 6.233.1 ± 6.432.1 ± 5.60.15
Body mass index ≥ 30 kg/m2, n (%)448290 (65)233 (67)57 (58)0.12
Smoking, former or current, n (%)450306 (70)235 (67)78 (78)0.04
Alcohol424
No alcohol, n (%) 148 (36)123 (37)32 (34)0.80
0–13 units per week, n (%) 206 (50)159 (48)49 (52)
≥14 units per week, n (%) 61 (15)47 (14)14 (15)
Adherence guideline physical activity, n (%)433249 (59)201 (60)52 (54)0.34
Pharmacological treatment
Insulin use, n (%)450275 (63)218 (62)68 (68)0.30
Statin use, n (%)450331 (76)254 (73)86 (86)0.006
Beta blocker treatment, n (%)450202 (46)131 (37)77 (77)<0.001
RAAS inhibition, n (%)450289 (66)225 (64)73 (73)0.10
Calcium antagonists, n (%)45098 (22)66 (19)36 (36)<0.001
Thiazide diuretics, n (%)450136 (31)108 (31)29 (29)0.72
Loop diuretics, n (%)45075 (17)48 (14)33 (33)<0.001
Number of antihypertensives4502 (1–3)2 (1–3)3 (2–4)<0.001
Magnesium parameters
Dietary magnesium intake *, mg/day438305 ± 46309 ± 47292 ± 400.001
Urinary magnesium excretion, mmol/24 h4023.94 ± 2.054.03 ± 2.053.66 ± 2.020.13
Plasma magnesium concentration, mmol/L4320.77 ± 0.090.78 ± 0.080.76 ± 0.090.06
Hypomagnesemia, n (%)43273 (17)53 (16)20 (20)0.35
Serum values
Total cholesterol, mmol/L4474.0 ± 0.94.1 ± 0.93.8 ± 1.10.04
HDL cholesterol, mmol/L4451.1 ± 0.31.2 ± 0.41.0 ± 0.3<0.001
LDL cholesterol, mmol/L4282.0 ± 0.72.0 ± 0.71.9 ± 0.80.25
HbA1c, mmol/mol44857 ± 1257 ± 1258 ± 120.43
Dietary intake
Total energy intake, kcal/day4381922 ± 6291904 ± 6491932 ± 6300.71
Urinary sodium excretion, mmol/24 h444185 ± 79183 ± 67197 ± 840.14
Urinary potassium excretion, mmol/24 h43977 ± 2578 ± 2677 ± 210.87
Calcium intake, mg/day438969 ± 441979 ± 467905 ± 3580.16
Fiber intake, g/day43820.9 ± 6.620.8 ± 7.020.4 ± 6.10.60
Cholesterol, g/day438194 ± 96195 ± 101188 ± 790.51
Total fat intake, g/day43879 ± 3978 ± 3481 ± 340.52
Total protein intake, g/day43879 ± 2379 ± 2476 ± 220.18
Total carbohydrate intake, g/day438207 ± 69205 ± 72209 ± 670.61
CHD: coronary heart disease, eGFR: estimated glomerular filtration rate (CKD-EPI), HDL: high density lipoprotein, LDL: low density lipoprotein, HbA1c: glycated hemoglobin. * Dietary magnesium intake was adjusted for total energy intake using the residual method.
Table 2. Prevalence ratios (95% CI) for associations between dietary, urinary and plasma Magnesium and coronary heart disease in type 2 diabetes from the DIAbetes and LifEstyle Cohort Twente (DIALECT) (n = 450).
Quartile 1Quartile 2Quartile 3Quartile 4p-Trend
Dietary Mg intake *, mg/day254 ± 25291 ± 7315 ± 8361 ± 39
n cases/n total33/10925/11023/11013/109
Model 1 a1.000.71 (0.42, 1.22)0.64 (0.37, 1.10)0.40 (0.20, 0.77)0.005
Model 2 b1.000.72 (0.42, 1.23)0.69 (0.40, 1.21)0.42 (0.22, 0.82)0.01
Model 3 c1.000.71 (0.41, 1.23)0.72 (0.41, 1.27)0.40 (0.20, 0.79)0.01
Urinary Mg excretion, mmol/24 h1.81 ± 0.633.05 ± 0.324.32 ± 0.576.64 ± 1.75
n cases/n total24/10124/10019/10115/100
Model 1 a1.000.95 (0.54, 1.67)0.73 (0.39, 1.35)0.63 (0.33, 1.19)0.24
Model 2 b1.001.28 (0.71, 2.30)0.96 (0.51, 1.82)0.74 (0.39, 1.42)0.33
Model 3 c1.001.27 (0.70, 2.30)0.85 (0.44, 1.65)0.63 (0.32, 1.26)0.13
Plasma Mg concentration, mmol/L0.67 ± 0.060.75 ± 0.020.80 ± 0.020.88 ± 0.04
n cases/n total29/11322/10627/11116/102
Model 1 a1.000.91 (0.52, 1.60)1.03 (0.60, 1.77)0.60 (0.31, 1.14)0.15
Model 2 b1.000.91 (0.51, 1.62)1.09 (0.63, 1.89)0.58 (0.30, 1.12)0.17
Model 3 c1.000.91 (0.51, 1.63)1.12 (0.65, 1.94)0.62 (0.32, 1.20)0.26
a Model 1: Crude model b Model 2: Adjusted for age (years), BMI (kg/m2), smoking (never, former or current), alcohol consumption (none, 1–13 units per week, ≥14 units per week), physical activity (not adherent to guideline, adherent to guideline).c Model 3: Model 2 + Total energy intake (kcal), 24 h urinary sodium excretion (mmol/24 h) and 24 h urinary potassium excretion (mmol/24 h).* Dietary magnesium intake was adjusted for total energy intake using the residual method.
Table 3. Prevalence ratios (95% CI) for associations between magnesium intake from different food sources in type 2 diabetes patients from the DIALECT cohort (n = 450).
Model 1 aModel 2 bModel 3 c
Source of magnesium intakePR (95% CI)PR (95% CI)PR (95% CI)
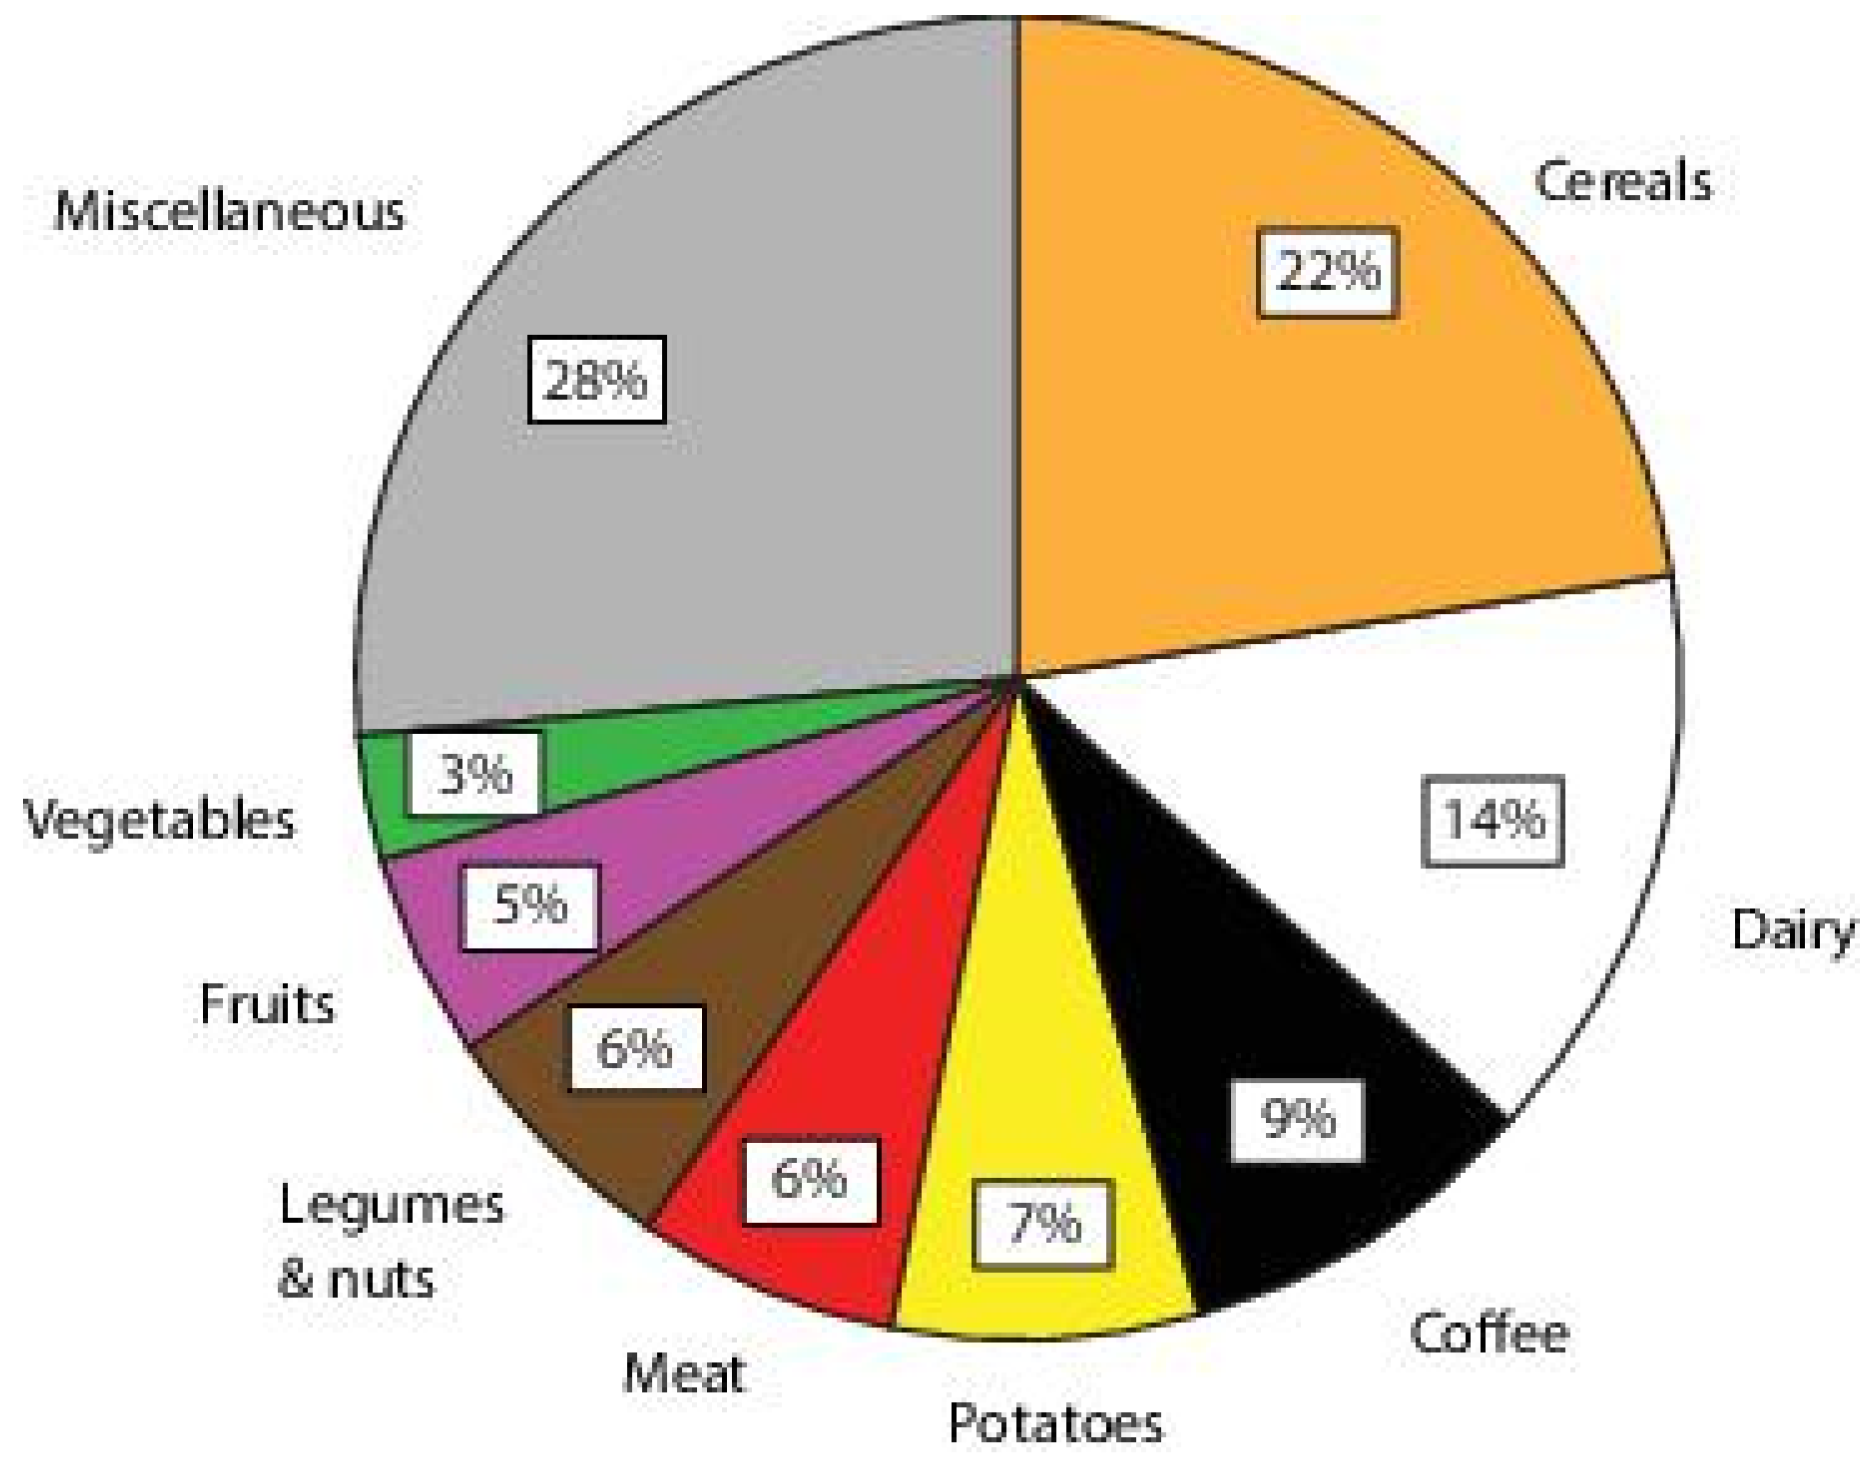
Magnesium intake from cereals *, 10 mg/day1.02 (0.94, 1.10)1.02 (0.94, 1.10)0.95 (0.86, 1.05)
Magnesium intake from dairy *, 10 mg/day0.95 (0.87, 1.03)0.95 (0.87, 1.03)0.92 (0.84, 1.01)
Magnesium intake from coffee *, 10 mg/day0.95 (0.83, 1.06)0.95 (0.83, 1.08)0.96 (0.84, 1.10)
Magnesium intake from potatoes *, 10 mg/day1.03 (0.87, 1.22)1.02 (0.86, 1.21)0.97 (0.80, 1.16)
Magnesium intake from meat *, 10 mg/day0.91 (0.70, 1.20)0.91 (0.69, 1.19)0.80 (0.59, 1.09)
Magnesium intake from legumes & nuts *, 10 mg/day0.96 (0.89, 1.05)0.96 (0.88, 1.06)0.95 (0.86, 1.05)
Magnesium intake from fruit *, 10 mg/day1.00 (0.81, 1.23)0.98 (0.79, 1.20)0.96 (0.78, 1.19)
Magnesium intake from vegetables *, 10 mg/day0.71 (0.51, 1.01)0.71 (0.50, 1.01)0.75 (0.52, 1.08)
Magnesium intake from miscellaneous sources *, 10 mg/day0.95 (0.89, 1.02)0.95 (0.89, 1.03)0.90 (0.82, 0.99)
a Model 1: Crude model b Model 2: Adjusted for age (years), BMI (kg/m2), smoking (never, former/current), alcohol consumption (none, 1–13 units per week, ≥14 units per week), physical activity (not adherent to guideline, adherent to guideline).c Model 3: Model 2 + Total energy intake (kcal), magnesium intake from the other sources (cereals (mg/day), dairy (mg/day), coffee (mg/day), potatoes (mg/day), meat (mg/day), legumes and nuts (mg/day), fruit (mg/day), vegetables (mg/day), and other (mg/day)). * Magnesium intake from food sources was adjusted for total energy intake using the residual method. An increment of 10 mg magnesium intake per day was used to calculate PR.PR, prevalence ratio; CI, confidence interval.

