Bioelectrical Impedance Phase Angle as an Indicator of Malnutrition in Hospitalized Children with Diagnosed Inflammatory Bowel Diseases—A Case Control Study

 ,
,  and
and
Abstract
:1. Introduction
2. Materials and Methods
2.1. Ethics
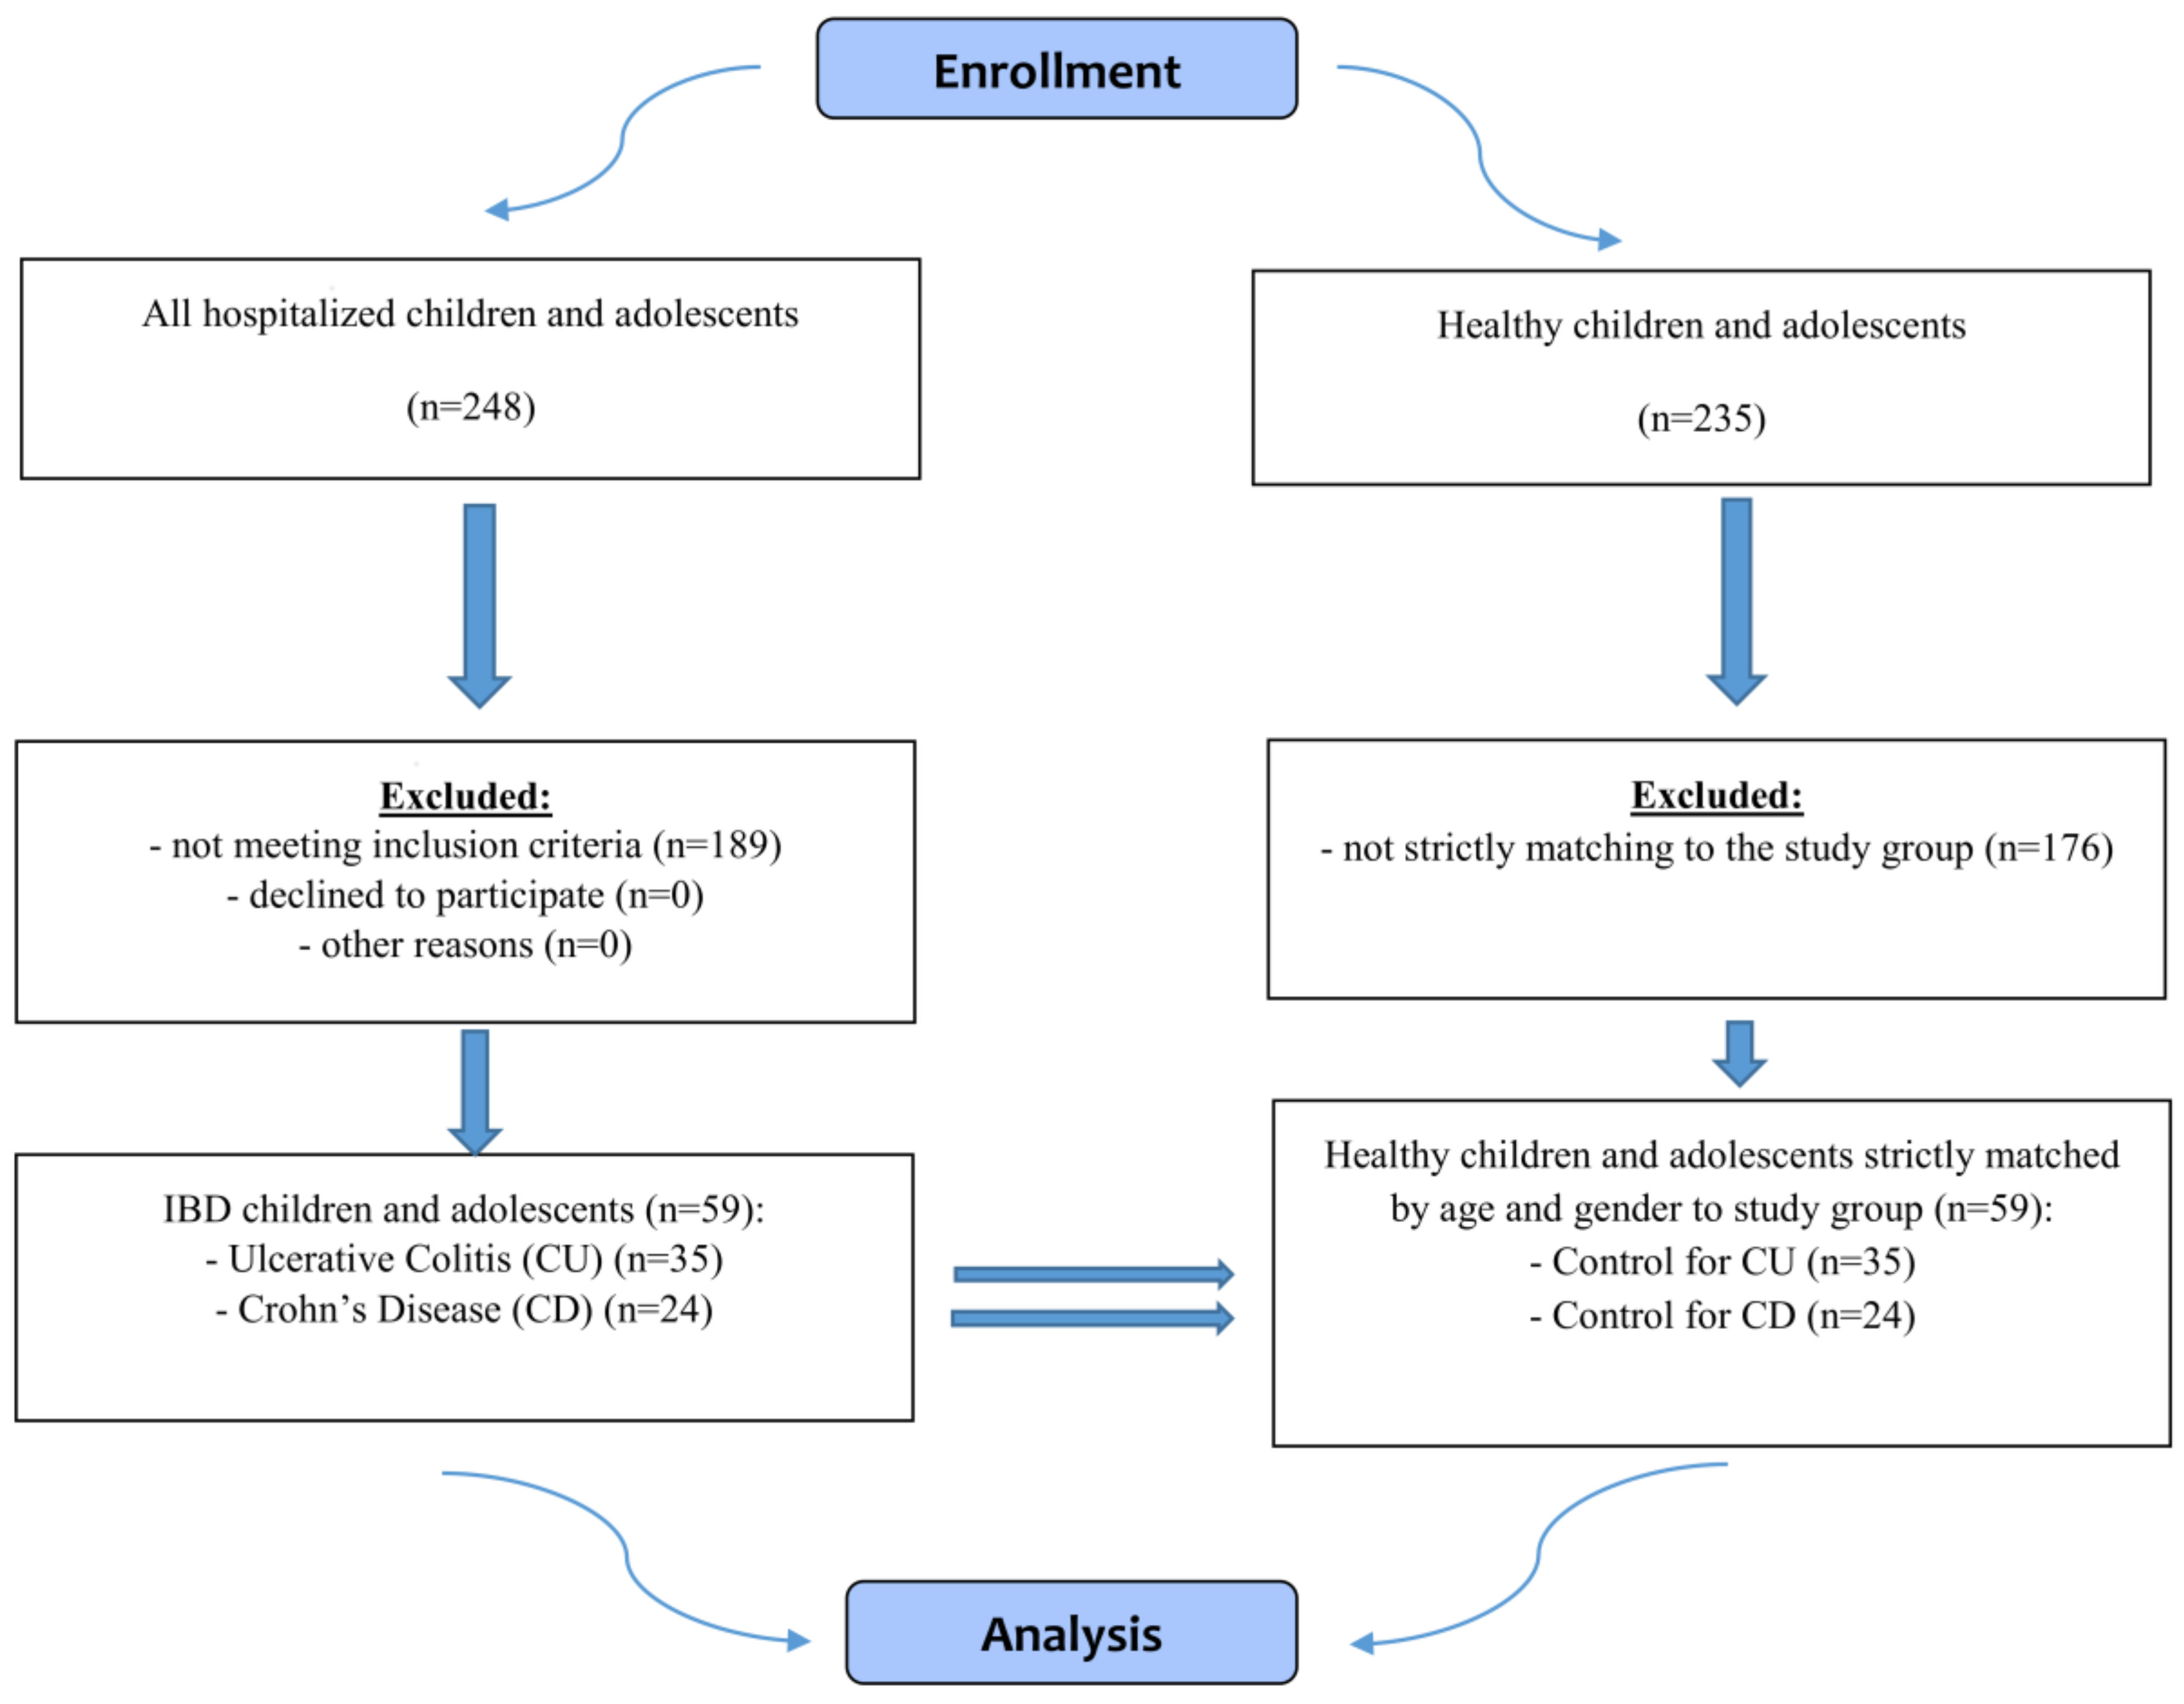
2.2. Subjects
2.3. Assessments
2.4. Statistical Analysis
3. Results
4. Discussion
5. Conclusions
Acknowledgments
Author Contributions
Conflicts of Interest
References
- Cardinal, T.R.; Wazlawik, E.; Bastos, J.L.; Nakazora, L.M.; Scheunemann, L. Standardized phase angle indicates nutritional status in hospitalized preoperative patients. Nutr. Res. 2010, 30, 594–600. [Google Scholar] [CrossRef] [PubMed]
- Norman, K.; Stobäus, N.; Pirlich, M.; Bosy-Westphal, A. Bioelectrical phase angle and impedance vector analysis--clinical relevance and applicability of impedance parameters. Clin. Nutr. 2012, 31, 854–861. [Google Scholar] [CrossRef] [PubMed]
- Rodríguez-Rodríguez, F.; Cristi-Montero, C.; González-Ruíz, K.; Correa-Bautista, J.E.; Ramírez-Vélez, R. Bioelectrical Impedance Vector Analysis and Muscular Fitness in Healthy Men. Nutrients 2016, 8, 407. [Google Scholar] [CrossRef] [PubMed]
- Rinninella, E.; Ruggiero, A.; Maurizi, P.; Triarico, S.; Cintoni, M.; Mele, M.C. Clinical tools to assess nutritional risk and malnutrition in hospitalized children and adolescents. Eur. Rev. Med. Pharmacol. Sci. 2017, 21, 2690–2701. [Google Scholar] [PubMed]
- Kyle, U.G.; Soundar, E.P.; Genton, L.; Pichard, C. Can phase angle determined by bioelectrical impedance analysis assess nutritional risk? A comparison between healthy and hospitalized subjects. Clin. Nutr. 2012, 31, 875–881. [Google Scholar] [CrossRef] [PubMed]
- Genton, L.; Norman, K.; Spoerri, A.; Pichard, C.; Karsegard, V.L.; Herrmann, F.R.; Graf, C.E. Bioimpedance-Derived Phase Angle and Mortality Among Older People. Rejuv. Res. 2017, 20, 118–124. [Google Scholar] [CrossRef] [PubMed]
- Genton, L.; Herrmann, F.R.; Spörri, A.; Graf, C.E. Association of mortality and phase angle measured by different bioelectrical impedance analysis (BIA) devices. Clin. Nutr. 2017, 23, S0261-561430114-0. [Google Scholar] [CrossRef] [PubMed]
- Kovarik, M.; Hronek, M.; Zadak, Z. Clinically relevant determinants of body composition, function and nutritional status as mortality predictors in lung cancer patients. Lung Cancer 2014, 84, 1–6. [Google Scholar] [CrossRef] [PubMed]
- Schulz, K.H.; Patra, S.; Spielmann, H.; Klapdor, S.; Schlüter, K.; van Eckert, S. Physical condition, nutritional status, fatigue, and quality of life in oncological out-patients. SAGE Open Med. 2017, 21, 2050312117743674. [Google Scholar] [CrossRef] [PubMed]
- Hui, D.; Dev, R.; Pimental, L.; Park, M.; Cerana, M.A.; Liu, D.; Bruera, E. Association Between Multi-frequency Phase Angle and Survival in Patients With Advanced Cancer. J. Pain Symptom Manag. 2017, 53, 571–577. [Google Scholar] [CrossRef] [PubMed]
- Lee, S.Y.; Lee, Y.J.; Yang, J.H.; Kim, C.M.; Choi, W.S. The Association between Phase Angle of Bioelectrical Impedance Analysis and Survival Time in Advanced Cancer Patients: Preliminary Study. Korean J. Fam. Med. 2014, 35, 251–256. [Google Scholar] [CrossRef] [PubMed]
- Cichoż-Lach, H.; Michalak, A.A. Comprehensive Review of Bioelectrical Impedance Analysis and Other Methods in the Assessment of Nutritional Status in Patients with Liver Cirrhosis. Gastroenterol. Res. Pract. 2017, 2017, 6765856. [Google Scholar] [CrossRef] [PubMed]
- Jun, M.H.; Kim, S.; Ku, B.; Cho, J.; Kim, K.; Yoo, H.R.; Kim, J.U. Glucose-independent segmental phase angles from multi-frequency bioimpedance analysis to discriminate diabetes mellitus. Sci. Rep. 2018, 12, 648. [Google Scholar] [CrossRef] [PubMed]
- Dittmar, M.; Reber, H.; Kahaly, G.J. Bioimpedance phase angle indicates catabolism in Type 2 diabetes. Diabet Med. 2015, 32, 1177–1185. [Google Scholar] [CrossRef] [PubMed]
- Barrea, L.; Macchia, P.E.; Di Somma, C.; Napolitano, M.; Balato, A.; Falco, A.; Savanelli, M.C.; Balato, N.; Colao, A.; Savastano, S. Bioelectrical phase angle and psoriasis: A novel association with psoriasis severity, quality of life and metabolic syndrome. J. Transl. Med. 2016, 10, 130. [Google Scholar] [CrossRef] [PubMed] [Green Version]
- Beberashvili, I.; Azar, A.; Sinuani, I.; Kadoshi, H.; Shapiro, G.; Feldman, L.; Sandbank, J.; Averbukh, Z. Longitudinal changes in bioimpedance phase angle reflect inverse changes in serum IL-6 levels in maintenance hemodialysis patients. Nutrition 2014, 30, 297–304. [Google Scholar] [CrossRef] [PubMed]
- Colín-Ramírez, E.; Castillo-Martínez, L.; Orea-Tejeda, A.; Vázquez-Durán, M.; Rodríguez, A.E.; Keirns-Davis, C. Bioelectrical impedance phase angle as a prognostic marker in chronic heart failure. Nutrition 2012, 28, 901–905. [Google Scholar] [CrossRef] [PubMed]
- Caccialanza, R.; Cereda, E.; Klersy, C.; Bonardi, C.; Cappello, S.; Quarleri, L.; Turri, A.; Montagna, E.; Iacona, I.; Valentino, F.; et al. Phase angle and handgrip strength are sensitive early markers of energy intake in hypophagic, non-surgical patients at nutritional risk, with contraindications to enteral nutrition. Nutrients 2015, 11, 1828–1840. [Google Scholar] [CrossRef] [PubMed]
- Kuchnia, A.J.; Teigen, L.M.; Cole, A.J.; Mulasi, U.; Gonzalez, M.C.; Heymsfield, S.B.; Vock, D.M.; Earthman, C.P. Phase angle and impedance ratio: Reference cut-points from the United States National Health and Nutrition Examination Survey 1999–2004 from bioimpedance spectroscopy data. JPEN J. Parenter. Enteral Nutr. 2017, 41, 1310–1315. [Google Scholar] [CrossRef] [PubMed]
- Bosy-Westphal, A.; Danielzik, S.; Dörhöfer, R.P.; Later, W.; Wiese, S.; Müller, M.J. Phase angle from bioelectrical impedance analysis: Population reference values by age, sex, and body mass index. JPEN J. Parenter. Enteral Nutr. 2006, 30, 309–316. [Google Scholar] [CrossRef] [PubMed]
- Cederholm, T.; Barazzoni, R.; Austin, P.; Ballmer, P.; Biolo, G.; Bischoff, S.C.; Compher, C.; Correia, I.; Higashiguchi, T.; Holst, M.; et al. ESPEN guidelines on definitions and terminology of clinical nutrition. Clin. Nutr. 2017, 36, 49–64. [Google Scholar] [CrossRef] [PubMed]
- Wiskin, A.E.; Wootton, S.A.; Hunt, T.M.; Cornelius, V.R.; Afzal, N.A.; Jackson, A.A.; Beattie, R.M. Body composition in childhood inflammatory bowel disease. Clin. Nutr. 2011, 30, 112–115. [Google Scholar] [CrossRef] [PubMed]
- Mijac, D.D.; Jankovi´c, G.L.; Jorga, J.; Krstić, M.N. Nutritional status in patients withactive inflammatory bowel disease: Prevalence of malnutrition and meth-ods for routine nutritional assessment. Eur. J. Intern. Med. 2010, 21, 315–319. [Google Scholar] [CrossRef] [PubMed]
- Emerenziani, S.; Biancone, L.; Guarino, M.P.L.; Balestrieri, P.; Stasi, E.; Ribolsi, M.; Rescio, M.P.; Altomare, A.; Cocca, S.; Pallone, F.; et al. Nutritional status and bioelectrical phase angle assessment in adult Crohn disease patients receiving anti-TNFα therapy. Dig. Liver Dis. 2017, 49, 495–499. [Google Scholar] [CrossRef] [PubMed]
- Werkstetter, K.J.; Ullrich, J.; Schatz, S.B.; Prell, C.; Koletzko, B.; Koletzko, S. Lean body mass, physical activity andquality of life in paediatric patients with inflammatory bowel disease and in healthy controls. J. Crohns Colitis. 2012, 6, 665–673. [Google Scholar] [CrossRef] [PubMed]
- Więch, P.; Binkowska-Bury, M.; Korczowski, B. Body composition as an indicator of the nutritional status in children with newly diagnosed ulcerative colitis and Crohn’s disease—A prospective study. Prz Gastroenterol. 2017, 12, 55–59. [Google Scholar] [CrossRef] [PubMed]
- Wells, J.C. Toward body composition reference data for infants, children, and adolescents. Adv. Nutr. 2014, 5, 320S–329S. [Google Scholar] [CrossRef] [PubMed]
- Wells, J.C.; Williams, J.E.; Chomtho, S.; Darch, T.; Grijalva-Eternod, C.; Kennedy, K.; Haroun, D.; Wilson, C.; Cole, T.J.; Fewtrell, M.S. Body-composition reference data for simple and reference techniques and a 4-component model: A new UK reference child. Am J. Clin. Nutr. 2012, 96, 1316–1326. [Google Scholar] [CrossRef] [PubMed]
- Kabiri, L.S.; Hernandez, D.C.; Mitchell, K. Reliability, validity, and diagnostic value of a pediatric bioelectrical impedance analysis scale. Child. Obes. 2015, 11, 650–655. [Google Scholar] [CrossRef] [PubMed]
- Burnham, J.M.; Shults, J.; Semeao, E.; Foster, B.J.; Zemel, B.S.; Stallings, V.A.; Leonard, M.B. Body-composition alterations consistent with cachexia in children and young adults with Crohn disease. Am. J. Clin. Nutr. 2005, 82, 413–420. [Google Scholar] [CrossRef] [PubMed]
- Thayu, M.; Shults, J.; Burnham, J.M.; Zemel, B.S.; Baldassano, R.N.; Leonard, M.B. Gender differences in body composition deficits at diagnosis in children and adolescents with Crohn’s disease. Inflamm. Bowel. Dis. 2007, 13, 1121–1128. [Google Scholar] [CrossRef] [PubMed]
- Sylvester, F.A.; Leopold, S.; Lincoln, M.; Hyams, J.S.; Griffiths, A.M.; Lerer, T. A two-year longitudinal study of persistent lean tissue deficits in children with Crohn’s disease. Clin. Gastroenterol. Hepatol. 2009, 7, 452–455. [Google Scholar] [CrossRef] [PubMed]
- Klaus, J.; Armbrecht, G.; Steinkamp, M.; Bruckel, J.; Rieber, A.; Adler, G.; Reinshagen, M.; Felsenberg, D.; von Tirpitz, C. High prevalence of osteoporotic vertebral fractures in patients with Crohn’s disease. Gut 2002, 51, 654–658. [Google Scholar] [CrossRef] [PubMed]
- Hill, R.J. Update on nutritional status, body composition and growth in paediatric inflammatory bowel disease. World J. Gastroenterol. 2014, 20, 3191–3197. [Google Scholar] [CrossRef] [PubMed]
- Pileggi, V.N.; Monteiro, J.P.; Margutti, A.V.; Camelo, J.S., Jr. Prevalence of child malnutrition at a university hospital using the World Health Organization criteria and bioelectrical impedance data. Braz. J. Med. Biol. Res. 2016, 49, e5012. [Google Scholar] [CrossRef] [PubMed]


| Parameter | Ulcerative Colitis (UC) (Mean ± SD) (n = 34) | Control for UC (Mean ± SD) (n = 34) | p | Crohn’s Disease (CD) (Mean ± SD) (n = 25) | Control for CD (Mean ± SD) (n = 25) | p |
|---|---|---|---|---|---|---|
| Age (years) | 13.5 ± 3.41 | 13.5 ± 3.41 | 1.000 | 13.8 ± 3.12 | 13.8 ± 3.12 | 1.000 |
| Girls | 13.1 ± 3.41 | 13.1 ± 3.41 | 1.000 | 13.1 ± 3.94 | 13.1 ± 3.94 | 1.000 |
| Boys | 13.9 ± 3.46 | 13.9 ± 3.46 | 1.000 | 14.1 ± 2.74 | 14.1 ± 2.74 | 1.000 |
| Body weight (kg) | 47.9 ± 15.33 | 49.2 ± 15.82 | 0.731 | 43.6 ± 14.14 | 54.9 ± 17.35 | 0.015 |
| Girls | 42.7 ± 13.25 | 45.1 ± 11.47 | 0.560 | 43.8 ± 15.99 | 51.0 ± 18.59 | 0.411 |
| Boys | 53.1 ± 15.85 | 53.3 ± 18.69 | 0.984 | 42.6 ± 13.72 | 56.8 ± 17.00 | 0.018 |
| Height (cm) | 156.7 ± 18.24 | 156.6 ± 17.68 | 0.981 | 155.9 ± 18.26 | 160.9 ± 17.64 | 0.316 |
| Girls | 150.8 ± 16.69 | 152.3 ± 14.73 | 0.783 | 148.4 ± 17.05 | 154.1 ± 20.84 | 0.551 |
| Boys | 162.6 ± 18.27 | 160.9 ± 19.71 | 0.795 | 159.4 ± 18.20 | 164.1 ± 15.58 | 0.411 |
| BMI (kg/m2) | 19.1 ± 3.55 | 19.6 ± 3.46 | 0.418 | 17.5 ± 3.41 | 20.6 ± 4.00 | 0.004 * |
| Girls | 18.6 ± 3.98 | 19.2 ± 3.17 | 0.339 | 19.1 ± 4.14 | 20.7 ± 4.56 | 0.645 |
| Boys | 19.6 ± 3.11 | 20.0 ± 3.79 | 0.786 | 16.7 ± 2.82 | 20.6 ± 3.86 | 0.002 * |
| BMI z-score | −0.01 ± 0.928 | 0.13 ± 0.887 | 0.351 | −0.42 ± 0.892 | 0.41 ± 1.050 | 0.003 * |
| Girls | −0.15 ± 1.045 | 0.05 ± 0.829 | 0.231 | −0.03 ± 1.126 | 0.46 ± 1.211 | 0.505 |
| Boys | 0.14 ± 0.799 | 0.22 ± 0.959 | 0.812 | −0.61 ± 0.725 | 0.38 ± 1.004 | 0.002 * |
| Disease activity, n (boys.girls) (PUCAI/PCDAI): Lack Mild Moderate Severe | 12 (8/4) 8 (4/4) 10 (5/5) 4 (0/4) | n/a | n/a | 7 (4/3) 5 (2/3) 9 (8/1) 4 (3/1) | n/a | n/a |
| Duration of the disease: New diagnosis Up to 1 year More than 1 year | 16 4 14 | n/a | n/a | 10 3 12 | n/a | n/a |
| Location of lesions (Paris classification): | 27P 3L 4E | n/a | n/a | 1L1 2L2 3L3 1L4b 2L1/L4b 6L1/L4a 10L3/L4a | n/a | n/a |
| Parameter | Ulcerative Colitis (UC) (Mean ± SD) (n = 34) | Control for UC (Mean ± SD) (n = 34) | p | Crohn’s Disease (CD) (Mean ± SD) (n = 25) | Control for CD (Mean ± SD) (n = 25) | p | ||||
|---|---|---|---|---|---|---|---|---|---|---|
| FM (kg) | 9.83 | 5.02 | 10.02 | 5.88 | 0.893 | 8.58 | 4.72 | 12.00 | 6.77 | 0.054 |
| FM (%) | 20.9 | 7.5 | 20.4 | 9.5 | 0.826 | 19.8 | 6.2 | 21.4 | 8.2 | 0.440 |
| FMI | 4.05 | 1.98 | 4.14 | 2.52 | 0.787 | 3.53 | 1.77 | 4.57 | 2.40 | 0.123 |
| FFM (kg) | 38.10 | 12.94 | 39.21 | 13.38 | 0.727 | 35.02 | 11.70 | 42.93 | 13.53 | 0.032 * |
| FFM (%) | 79.1 | 7.5 | 79.6 | 9.5 | 0.826 | 80.2 | 6.2 | 78.6 | 8.2 | 0.440 |
| FFMI | 15.00 | 2.59 | 15.41 | 2.46 | 0.503 | 13.94 | 2.44 | 16.02 | 2.54 | 0.005 * |
| MM (kg) | 24.24 | 9.86 | 26.15 | 10.01 | 0.432 | 21.80 | 8.39 | 28.39 | 9.90 | 0.015 * |
| MM (%) | 49.5 | 8.2 | 52.4 | 7.9 | 0.137 | 49.1 | 5.9 | 51.5 | 7.2 | 0.199 |
| TBW (liters) | 29.51 | 8.90 | 30.24 | 9.31 | 0.741 | 27.86 | 7.69 | 32.97 | 9.37 | 0.040 * |
| TBW (%) | 62.1 | 6.4 | 62.2 | 9.3 | 0.956 | 65.2 | 8.5 | 61.1 | 7.8 | 0.078 |
| ECW (liters) | 13.25 | 4.72 | 13.26 | 4.31 | 0.996 | 12.02 | 3.98 | 14.37 | 4.54 | 0.058 |
| ECW (%) | 44.7 | 6.7 | 43.8 | 3.4 | 0.552 | 43.0 | 5.4 | 43.4 | 3.0 | 0.779 |
| ICW (liters) | 16.24 | 5.05 | 16.98 | 5.18 | 0.345 | 15.83 | 4.11 | 18.60 | 5.02 | 0.038 * |
| ICW (%) | 55.3 | 6.7 | 56.2 | 3.4 | 0.552 | 57.0 | 5.4 | 56.6 | 3.0 | 0.779 |
| BCM (kg) | 19.58 | 8.20 | 21.26 | 8.27 | 0.405 | 17.60 | 6.92 | 23.08 | 8.13 | 0.013 * |
| BCM (%) | 49.4 | 8.8 | 53.3 | 3.9 | 0.066 | 49.3 | 5.3 | 53.1 | 3.2 | 0.004 * |
| BCMI | 7.63 | 2.01 | 8.31 | 1.78 | 0.149 | 6.98 | 1.80 | 8.57 | 1.74 | 0.003 * |
| Resistance (ohm) | 654.15 | 130.36 | 623.71 | 106.30 | 0.295 | 700.68 | 118.50 | 606.56 | 103.74 | 0.004 * |
| Reactance (ohm) | 61.74 | 13.12 | 64.18 | 8.17 | 0.361 | 63.36 | 10.39 | 61.88 | 6.89 | 0.556 |
| PhA | 5.34 | 1.34 | 5.96 | 0.76 | 0.040* | 5.16 | 1.18 | 5.90 | 0.62 | 0.009 * |
| Parameter | Girls (Mean ± SD) | p | Boys (Mean ± SD) | p | ||||||
|---|---|---|---|---|---|---|---|---|---|---|
| Ulcerative Colitis (UC) | Control | Ulcerative Colitis (UC) | Control | |||||||
| (Mean ± SD) (N = 17) | (Mean ± SD) (N = 17) | (Mean ± SD) (N = 17) | (Mean ± SD) (N = 17) | |||||||
| FM (kg) | 9.98 | 5.79 | 11.25 | 4.57 | 0.274 | 9.69 | 4.28 | 8.79 | 6.87 | 0.193 |
| FM (%) | 23.0 | 8.1 | 24.6 | 7.2 | 0.838 | 18.7 | 6.5 | 16.2 | 9.9 | 0.160 |
| FMI | 4.45 | 2.40 | 4.85 | 2.17 | 0.496 | 3.66 | 1.40 | 3.42 | 2.70 | 0.218 |
| FFM (kg) | 32.68 | 9.86 | 33.89 | 8.64 | 0.518 | 43.52 | 13.63 | 44.54 | 15.31 | 0.786 |
| FFM (%) | 77.0 | 8.1 | 75.4 | 7.2 | 0.838 | 81.3 | 6.5 | 83.8 | 9.9 | 0.160 |
| FFMI | 14.08 | 2.19 | 14.31 | 1.84 | 0.563 | 15.91 | 2.68 | 16.50 | 2.56 | 0.474 |
| MM (kg) | 19.58 | 6.95 | 22.05 | 6.20 | 0.182 | 28.91 | 10.30 | 30.25 | 11.51 | 0.658 |
| MM (%) | 45.7 | 8.1 | 48.7 | 5.3 | 0.114 | 53.2 | 6.6 | 56.1 | 8.5 | 0.122 |
| TBW (liters) | 25.10 | 6.24 | 25.85 | 5.67 | 0.474 | 33.91 | 9.13 | 34.63 | 10.28 | 0.658 |
| TBW (%) | 59.9 | 6.2 | 58.1 | 7.1 | 0.474 | 64.4 | 6.1 | 66.3 | 9.7 | 0.290 |
| ECW (liters) | 11.68 | 4.70 | 11.29 | 2.79 | 0.865 | 14.82 | 4.30 | 15.23 | 4.73 | 0.658 |
| ECW (%) | 45.6 | 8.0 | 43.5 | 2.9 | 0.322 | 43.7 | 5.3 | 44.1 | 3.8 | 1.000 |
| ICW (liters) | 13.42 | 2.97 | 14.56 | 3.04 | 0.092 | 19.05 | 5.18 | 19.40 | 5.80 | 0.892 |
| ICW (%) | 54.4 | 8.0 | 56.5 | 2.9 | 0.322 | 56.3 | 5.3 | 55.9 | 3.8 | 1.000 |
| BCM (kg) | 15.69 | 5.79 | 17.92 | 5.11 | 0.170 | 23.48 | 8.54 | 24.59 | 9.55 | 0.658 |
| BCM (%) | 46.0 | 10.6 | 52.4 | 3.3 | 0.031 * | 52.9 | 4.7 | 54.2 | 4.4 | 0.433 |
| BCMI | 6.77 | 1.76 | 7.55 | 1.25 | 0.114 | 8.49 | 1.92 | 9.06 | 1.94 | 0.339 |
| Resistance (ohm) | 700.12 | 110.30 | 685.18 | 79.06 | 0.433 | 608.18 | 135.63 | 562.24 | 95.00 | 0.322 |
| Reactance (ohm) | 61.59 | 14.35 | 68.94 | 8.19 | 0.140 | 61.88 | 12.20 | 59.41 | 4.74 | 0.786 |
| PhA | 5.06 | 1.23 | 5.76 | 0.63 | 0.038 * | 5.61 | 1.43 | 6.15 | 0.85 | 0.290 |
| Parameter | Girls (Mean ± SD) | p | Boys (Mean ± SD) | p | ||||||
|---|---|---|---|---|---|---|---|---|---|---|
| Crohn’s Disease (CD) | Control | Crohn’s Disease (CD) | Control | |||||||
| (Mean ± SD) | (Mean ± SD) | (Mean ± SD) | (Mean ± SD) | |||||||
| (N = 8) | (N = 8) | (N = 17) | (N = 17) | |||||||
| FM (kg) | 11.69 | 6.76 | 14.85 | 7.22 | 0.279 | 7.12 | 2.51 | 10.66 | 6.32 | 0.099 |
| FM (%) | 25.7 | 5.3 | 28.2 | 4.4 | 0.279 | 17.0 | 4.5 | 18.2 | 7.6 | 0.865 |
| FMI | 5.06 | 2.29 | 5.99 | 2.24 | 0.279 | 2.80 | 0.82 | 3.90 | 2.23 | 0.339 |
| FFM (kg) | 31.95 | 10.21 | 36.15 | 11.95 | 0.382 | 36.46 | 12.36 | 46.12 | 13.36 | 0.062 |
| FFM (%) | 74.3 | 5.3 | 71.8 | 4.4 | 0.279 | 83.0 | 4.5 | 81.8 | 7.6 | 0.865 |
| FFMI | 14.03 | 2.12 | 14.68 | 2.44 | 0.721 | 13.90 | 2.63 | 16.65 | 2.40 | 0.007 * |
| MM (kg) | 20.63 | 7.31 | 22.74 | 7.69 | 0.505 | 22.36 | 9.02 | 31.05 | 9.89 | 0.022 * |
| MM (%) | 47.3 | 5.7 | 44.9 | 3.2 | 0.382 | 50.0 | 5.9 | 54.6 | 6.4 | 0.045 * |
| TBW (liters) | 24.51 | 6.84 | 27.01 | 7.98 | 0.382 | 29.43 | 7.74 | 35.78 | 8.82 | 0.038 * |
| TBW (%) | 57.9 | 7.0 | 54.4 | 6.1 | 0.234 | 68.7 | 6.8 | 64.2 | 6.4 | 0.099 |
| ECW (liters) | 10.51 | 2.92 | 11.90 | 3.73 | 0.382 | 12.74 | 4.29 | 15.54 | 4.51 | 0.106 |
| ECW (%) | 43.6 | 5.2 | 44.1 | 2.9 | 0.328 | 42.8 | 5.6 | 43.0 | 3.1 | 0.892 |
| ICW (liters) | 14.00 | 4.12 | 15.11 | 4.36 | 0.328 | 16.69 | 3.93 | 20.24 | 4.54 | 0.012 * |
| ICW (%) | 56.5 | 5.2 | 55.9 | 2.9 | 0.328 | 57.2 | 5.6 | 57.0 | 3.1 | 0.892 |
| BCM (kg) | 16.76 | 6.07 | 18.44 | 6.28 | 0.645 | 17.99 | 7.44 | 25.26 | 8.13 | 0.020 * |
| BCM (%) | 51.5 | 5.2 | 50.7 | 2.4 | 0.505 | 48.3 | 5.2 | 54.2 | 2.9 | <0.001 * |
| BCMI | 7.30 | 1.51 | 7.46 | 1.39 | 0.959 | 6.82 | 1.94 | 9.09 | 1.68 | 0.003 * |
| Resistance (ohm) | 711.13 | 82.97 | 682.75 | 92.97 | 0.574 | 695.76 | 134.06 | 570.71 | 89.97 | 0.004 * |
| Reactance (ohm) | 69.75 | 11.63 | 64.75 | 8.31 | 0.645 | 60.35 | 8.53 | 60.53 | 5.91 | 0.865 |
| PhA | 5.65 | 0.92 | 5.44 | 0.44 | 0.442 | 4.94 | 1.24 | 6.12 | 0.59 | 0.001 * |
| Parameter | Ulcerative Colitis (UC) (n = 34) | Control for UC (n = 34) | p | Crohn’s Disease (CD) (n = 25) | Control for CD (n = 25) | p | ||||
|---|---|---|---|---|---|---|---|---|---|---|
| N | % | N | % | N | % | N | % | |||
| FM (kg) > 9.P * | 32 | 94.1 | 30 | 88.2 | 25 | 100.0 | 24 | 96.0 | ||
| FM (kg) < 9.P * | - | - | 1 | 2.9 | 0.531 | - | - | - | - | 0.312 |
| FM (kg) < 2.P * | 2 | 5.9 | 3 | 8.8 | - | - | 1 | 4.0 | ||
| FFM (kg) > 9.P * | 34 | 100.0 | 34 | 100.0 | 24 | 96.0 | 24 | 96 | ||
| FFM (kg) < 9.P * | - | - | - | - | - | 1 | 4.0 | 1 | 4.0 | 0.755 |
| FFM (kg) < 2.P * | - | - | - | - | - | - | - | - | ||
| FMI > 9.P ** | 23 | 67.6 | 26 | 76.5 | 20 | 80.0 | 22 | 88.0 | ||
| FMI < 9.P ** | 8 | 23.5 | 4 | 11.8 | 0.436 | 4 | 16.0 | 3 | 12.0 | 0.538 |
| FMI < 2.P ** | 3 | 8.8 | 4 | 11.8 | 1 | 4.0 | - | - | ||
| FFMI > 9.P ** | 25 | 73.5 | 30 | 88.2 | 12 | 48.0 | 22 | 88.0 | ||
| FFMI < 9.P ** | 4 | 11.8 | 3 | 8.8 | 0.196 | 2 | 8.0 | 1 | 4.0 | 0.009 † |
| FFMI < 2.P ** | 5 | 14.7 | 1 | 2.9 | 11 | 44.0 | 2 | 8.0 | ||
| PhA > 10.P *** | 26 | 76.5 | 20 | 58.8 | 18 | 72.0 | 24 | 96.0 | ||
| PhA < 10.P *** | 1 | 2.9 | 13 | 38.2 | <0.001 † | - | - | 1 | 4.0 | 0.012 † |
| PhA < 5.P *** | 7 | 20.6 | 1 | 2.9 | 7 | 28.0 | - | - | ||
© 2018 by the authors. Licensee MDPI, Basel, Switzerland. This article is an open access article distributed under the terms and conditions of the Creative Commons Attribution (CC BY) license (http://creativecommons.org/licenses/by/4.0/).
Share and Cite
Więch, P.; Dąbrowski, M.; Bazaliński, D.; Sałacińska, I.; Korczowski, B.; Binkowska-Bury, M. Bioelectrical Impedance Phase Angle as an Indicator of Malnutrition in Hospitalized Children with Diagnosed Inflammatory Bowel Diseases—A Case Control Study. Nutrients 2018, 10, 499. https://doi.org/10.3390/nu10040499
Więch P, Dąbrowski M, Bazaliński D, Sałacińska I, Korczowski B, Binkowska-Bury M. Bioelectrical Impedance Phase Angle as an Indicator of Malnutrition in Hospitalized Children with Diagnosed Inflammatory Bowel Diseases—A Case Control Study. Nutrients. 2018; 10(4):499. https://doi.org/10.3390/nu10040499
Chicago/Turabian StyleWięch, Paweł, Mariusz Dąbrowski, Dariusz Bazaliński, Izabela Sałacińska, Bartosz Korczowski, and Monika Binkowska-Bury. 2018. "Bioelectrical Impedance Phase Angle as an Indicator of Malnutrition in Hospitalized Children with Diagnosed Inflammatory Bowel Diseases—A Case Control Study" Nutrients 10, no. 4: 499. https://doi.org/10.3390/nu10040499