A Novel Biomimetic Tool for Assessing Vitamin K Status Based on Molecularly Imprinted Polymers

 , , , ,
  , ,
, ,  , and
, and 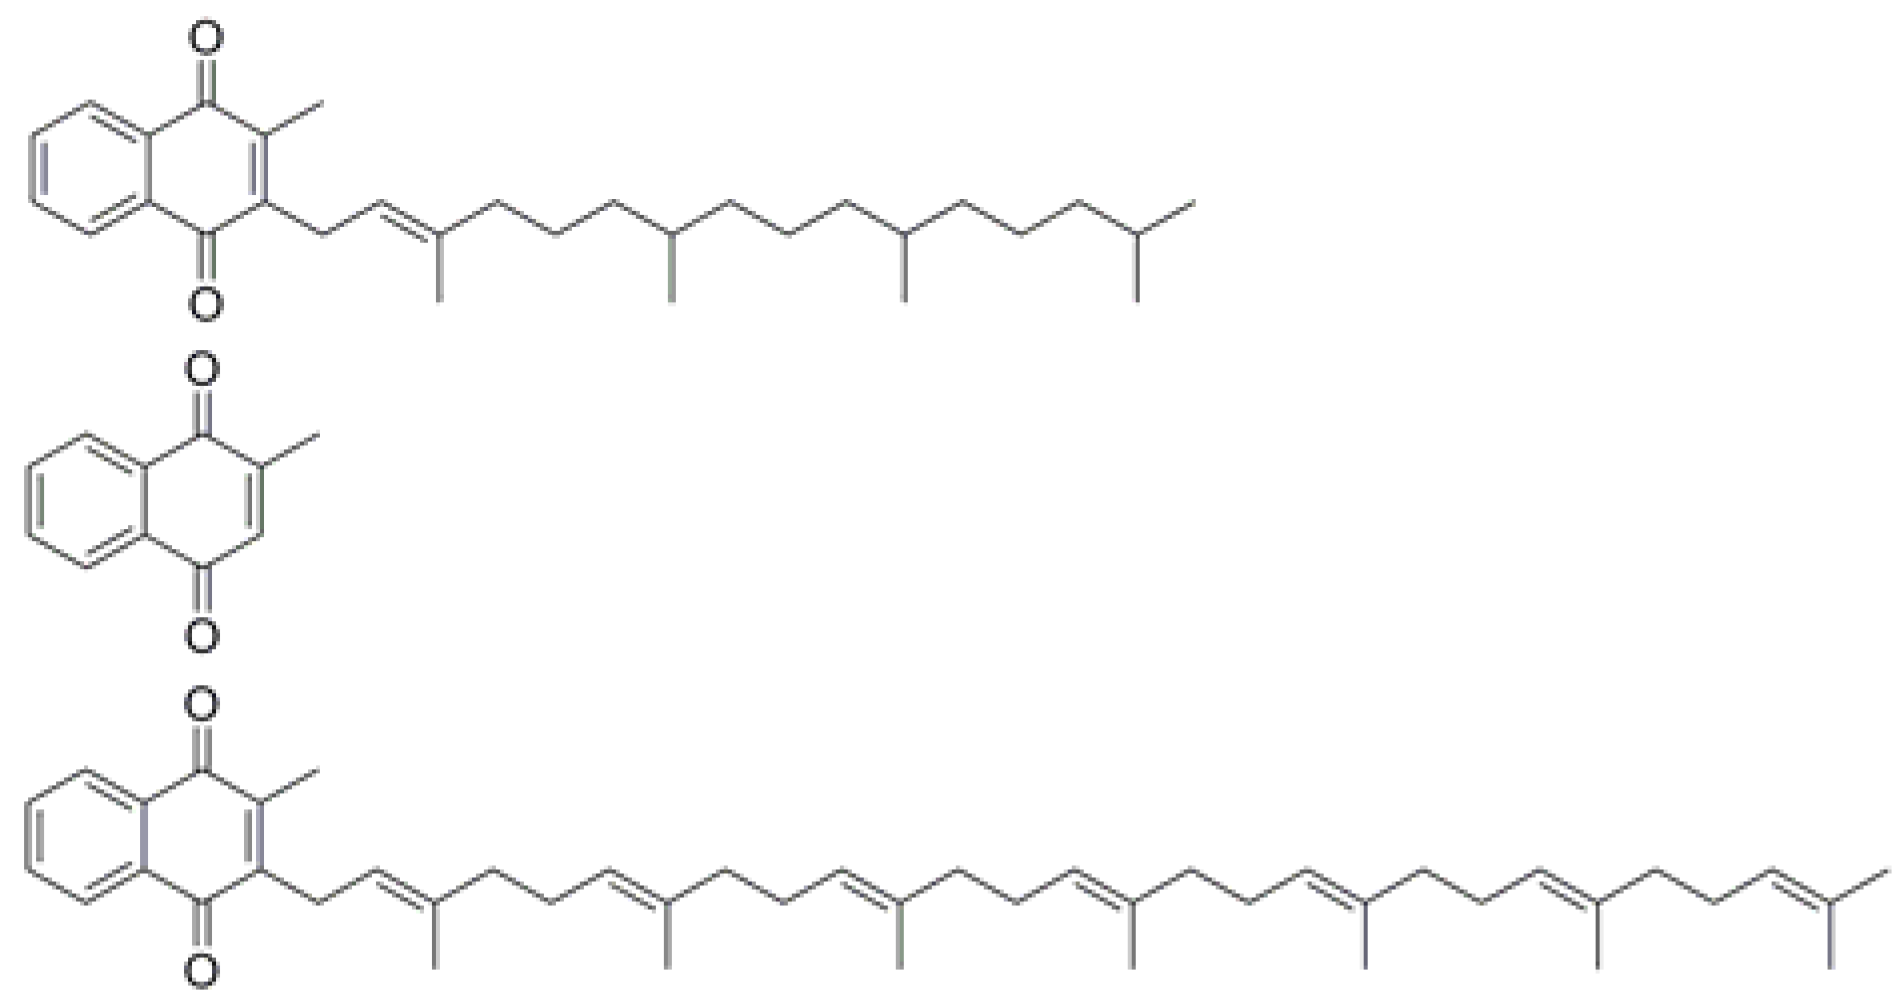
Abstract
:1. Introduction
2. Materials and Methods
2.1. Chemicals
2.2. MIP Synthesis
2.3. Chip Preparation
2.4. Sensing Setup
2.5. Proof of Concept
3. Results and Discussion
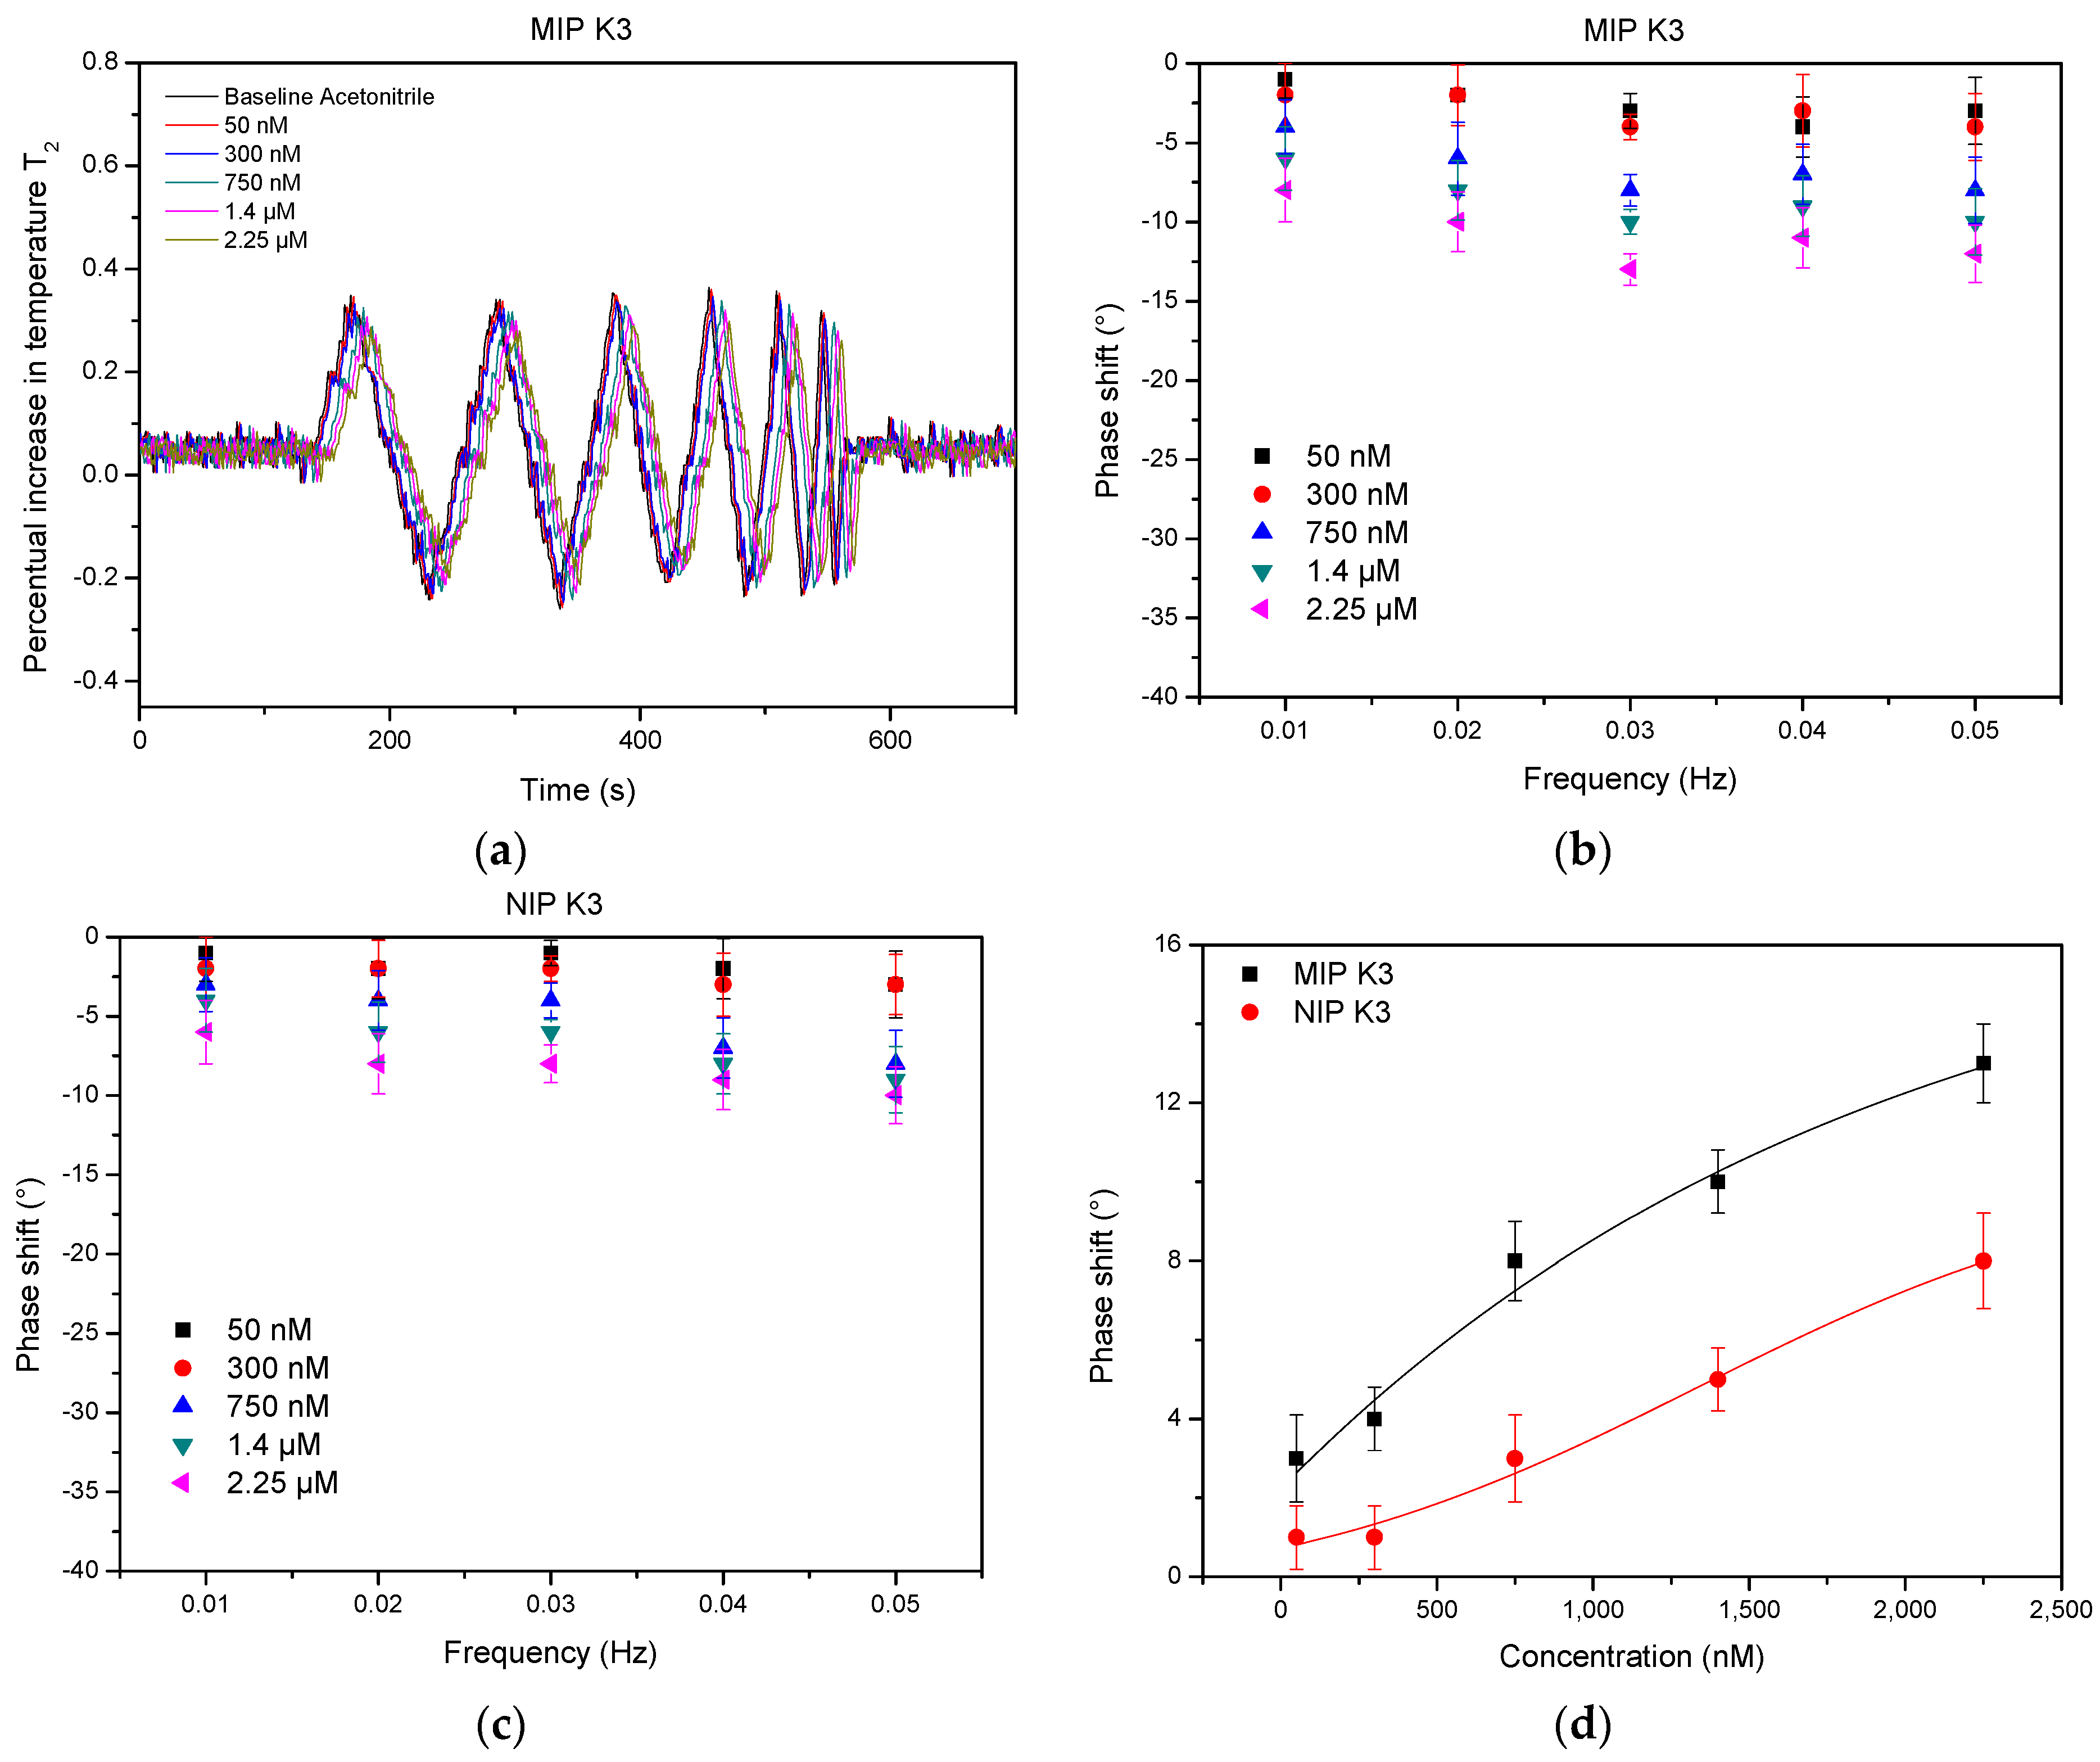
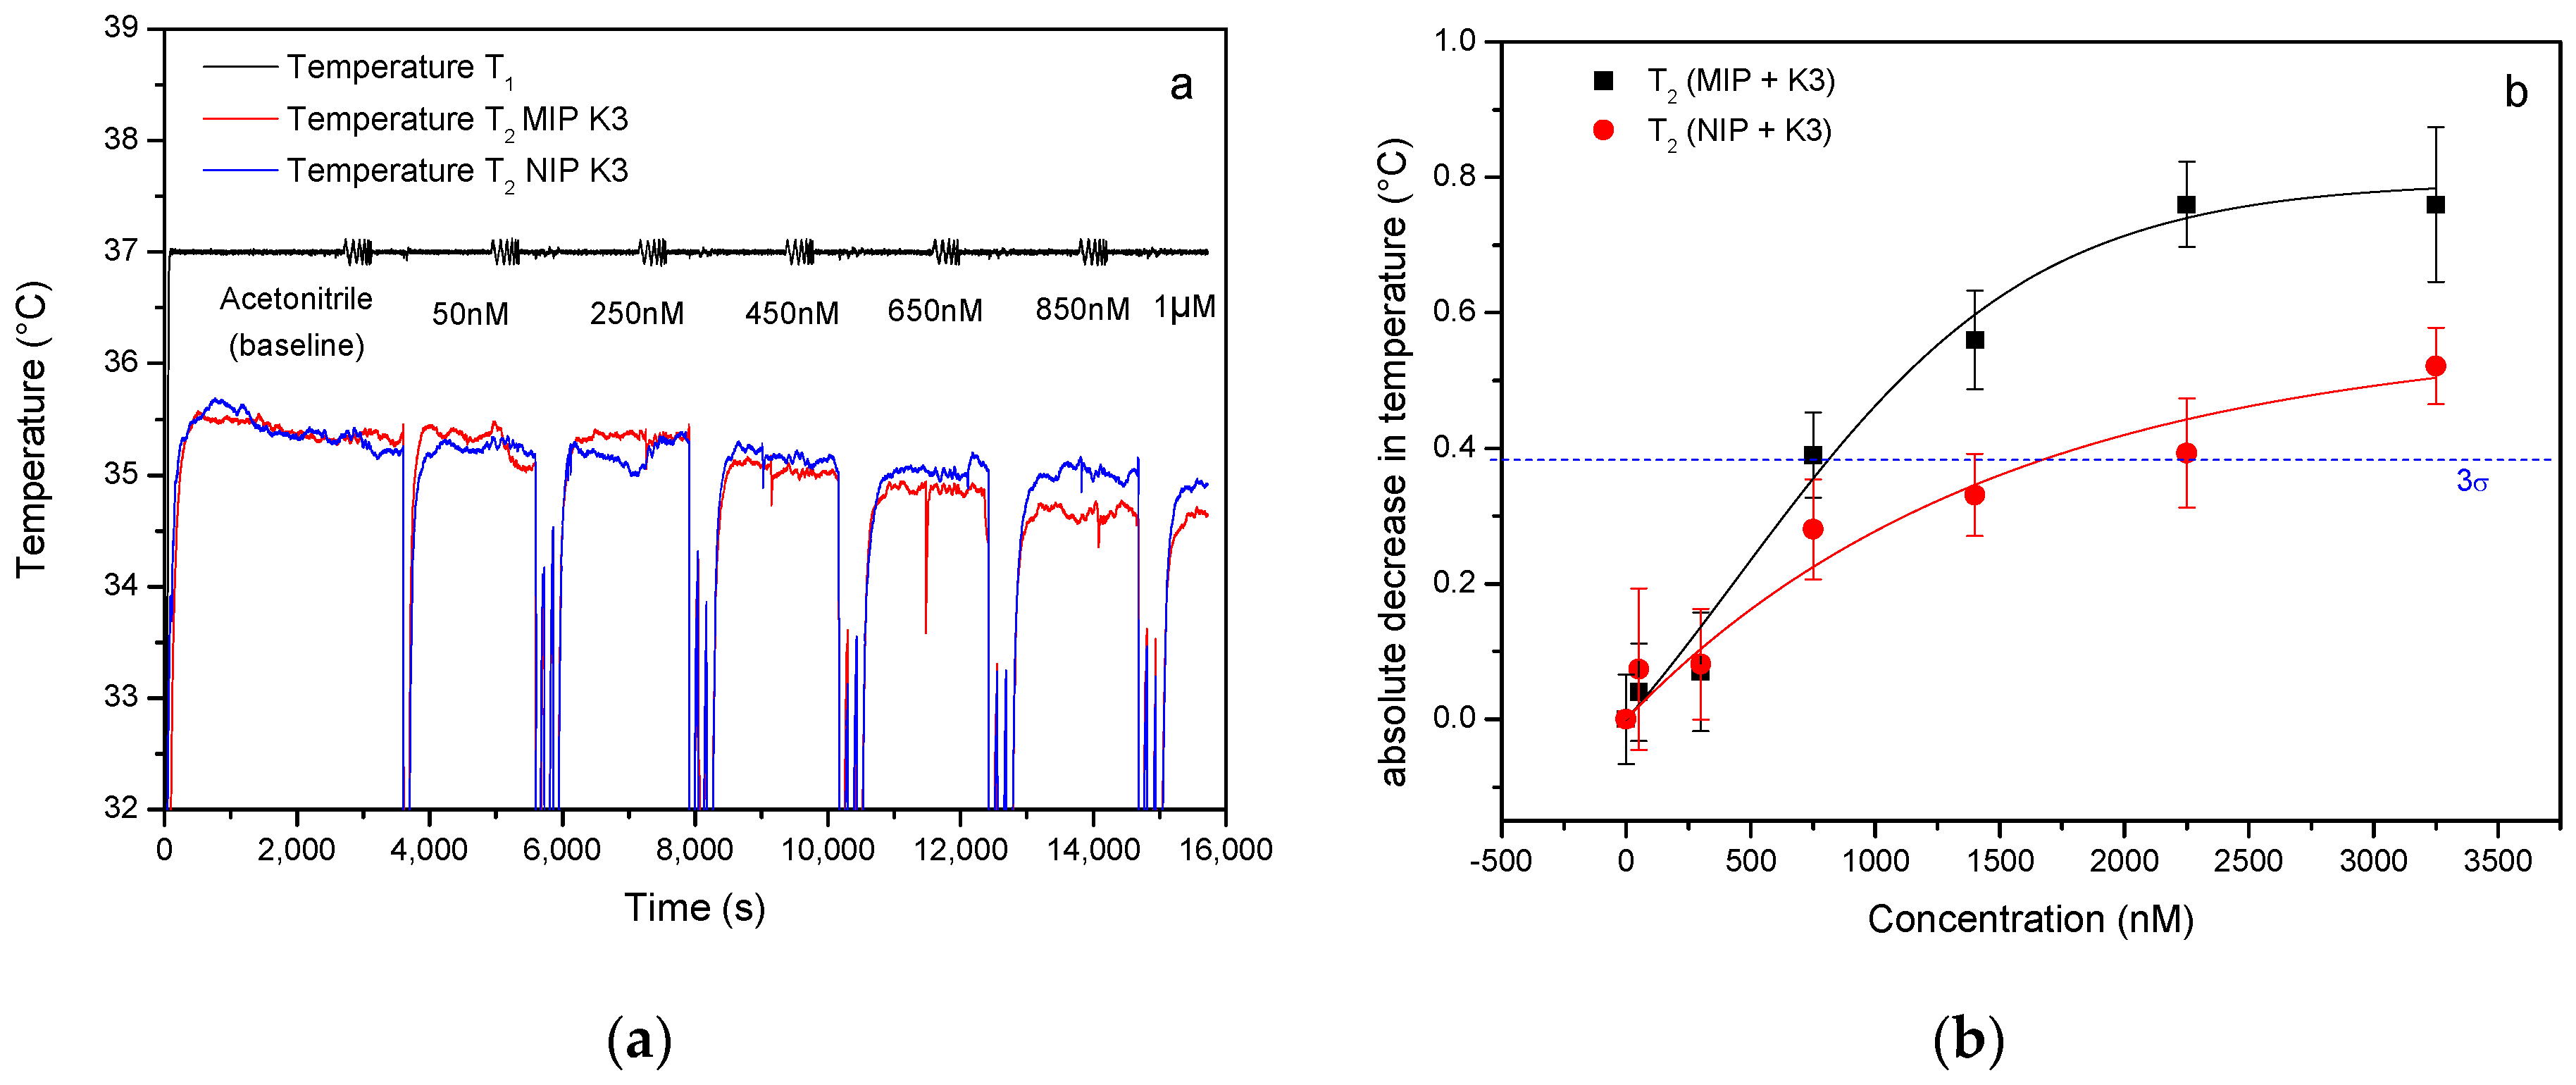
3.1. Specific Detection of Vitamin K3
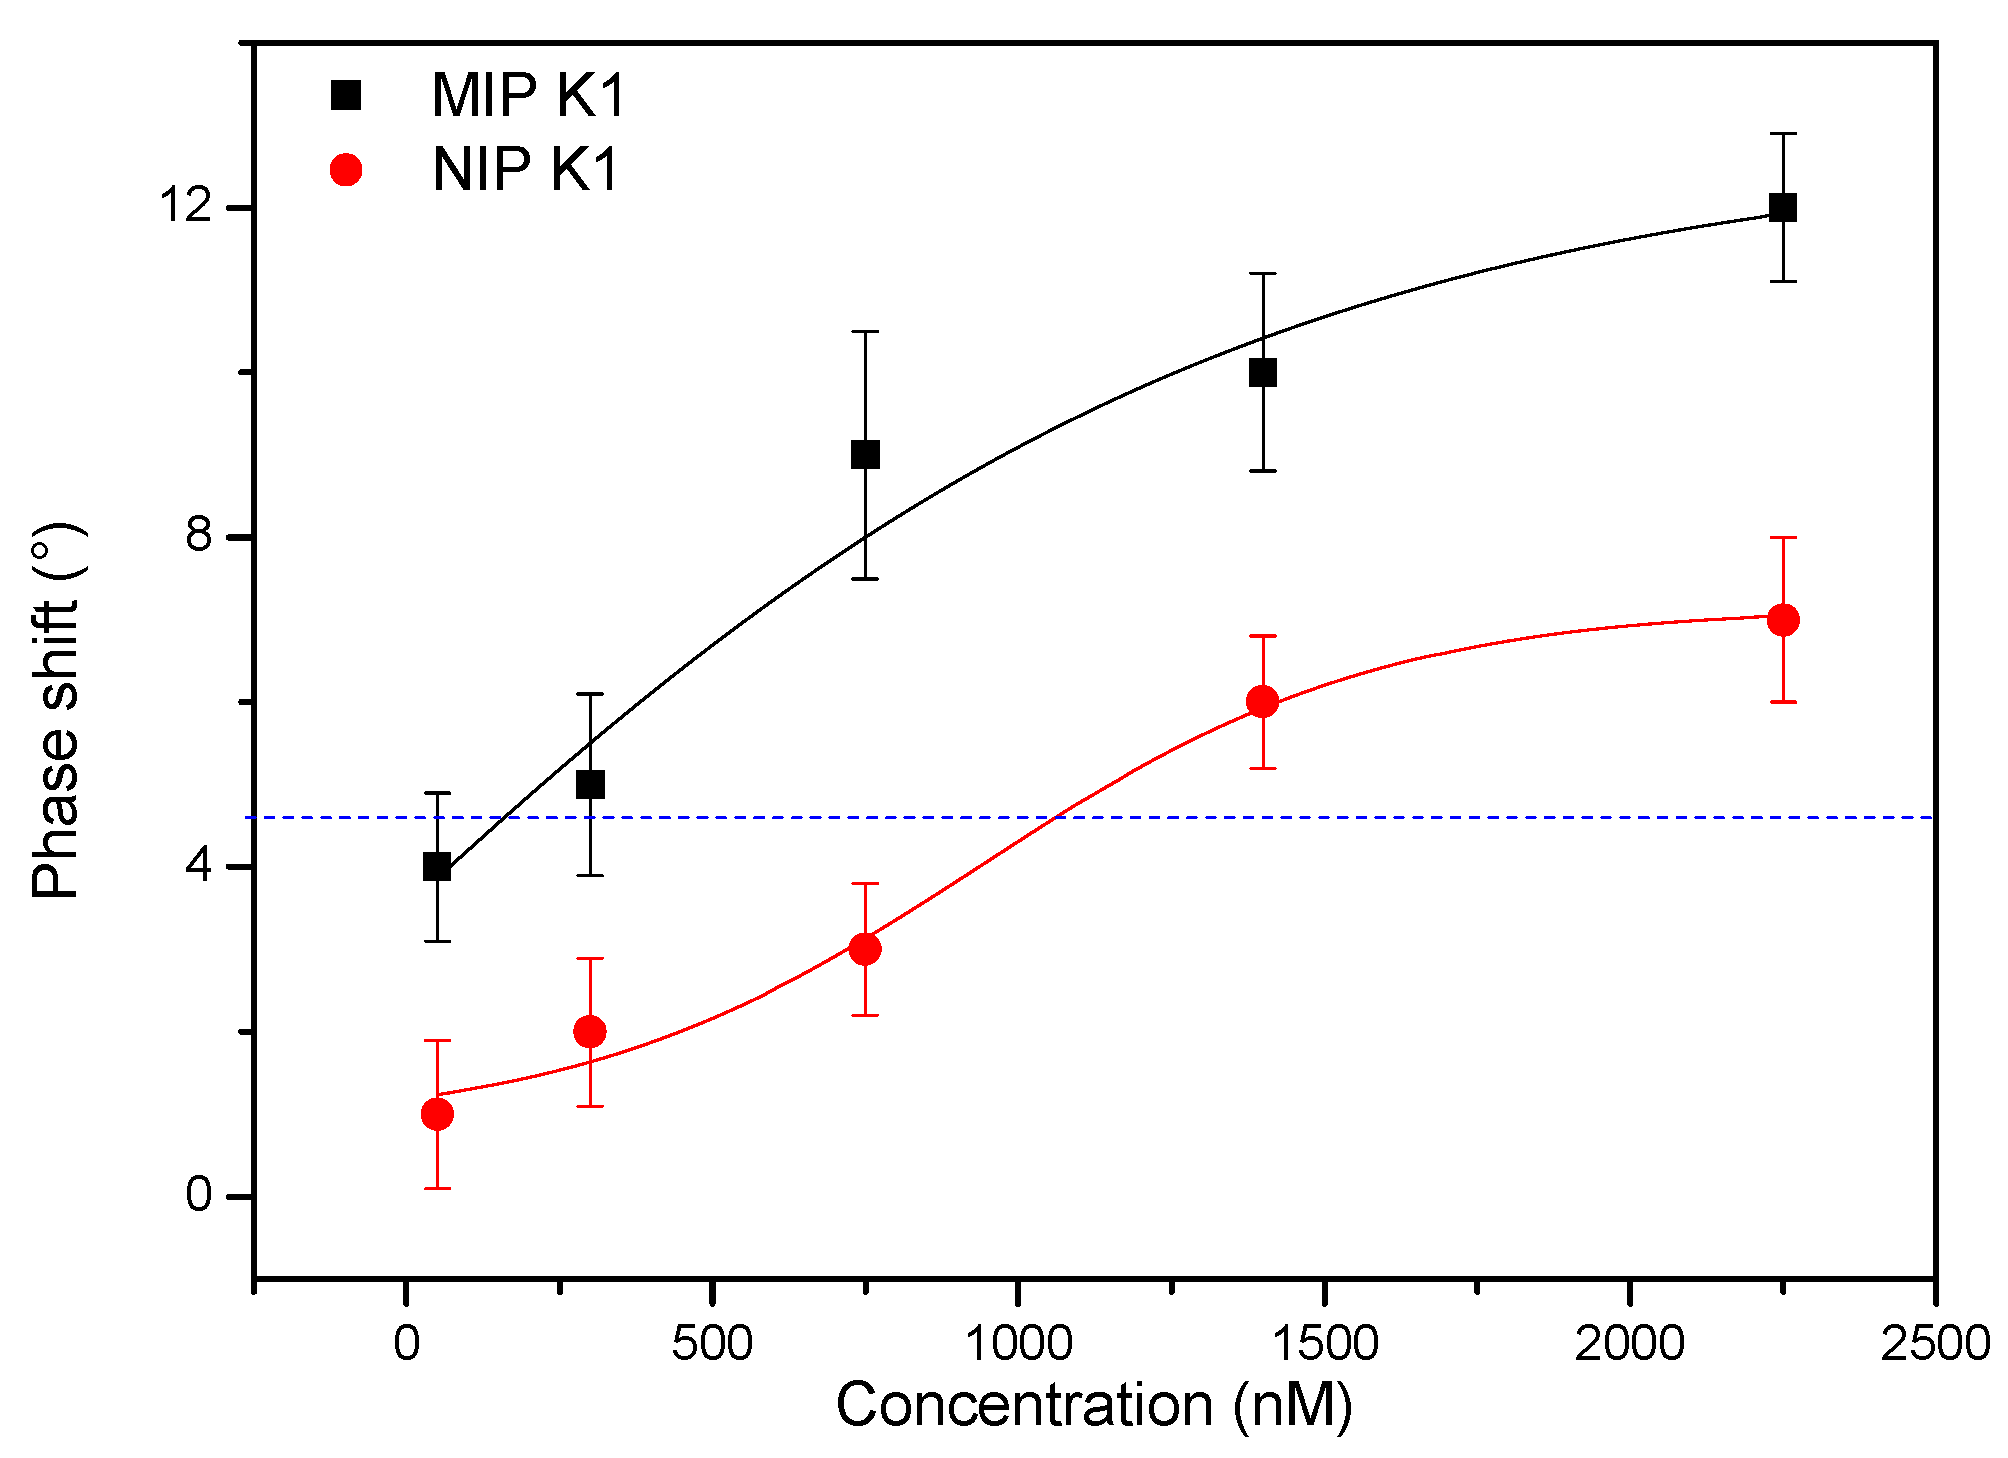
3.2. Vitamin K1 Detection
3.3. Selectivity Test
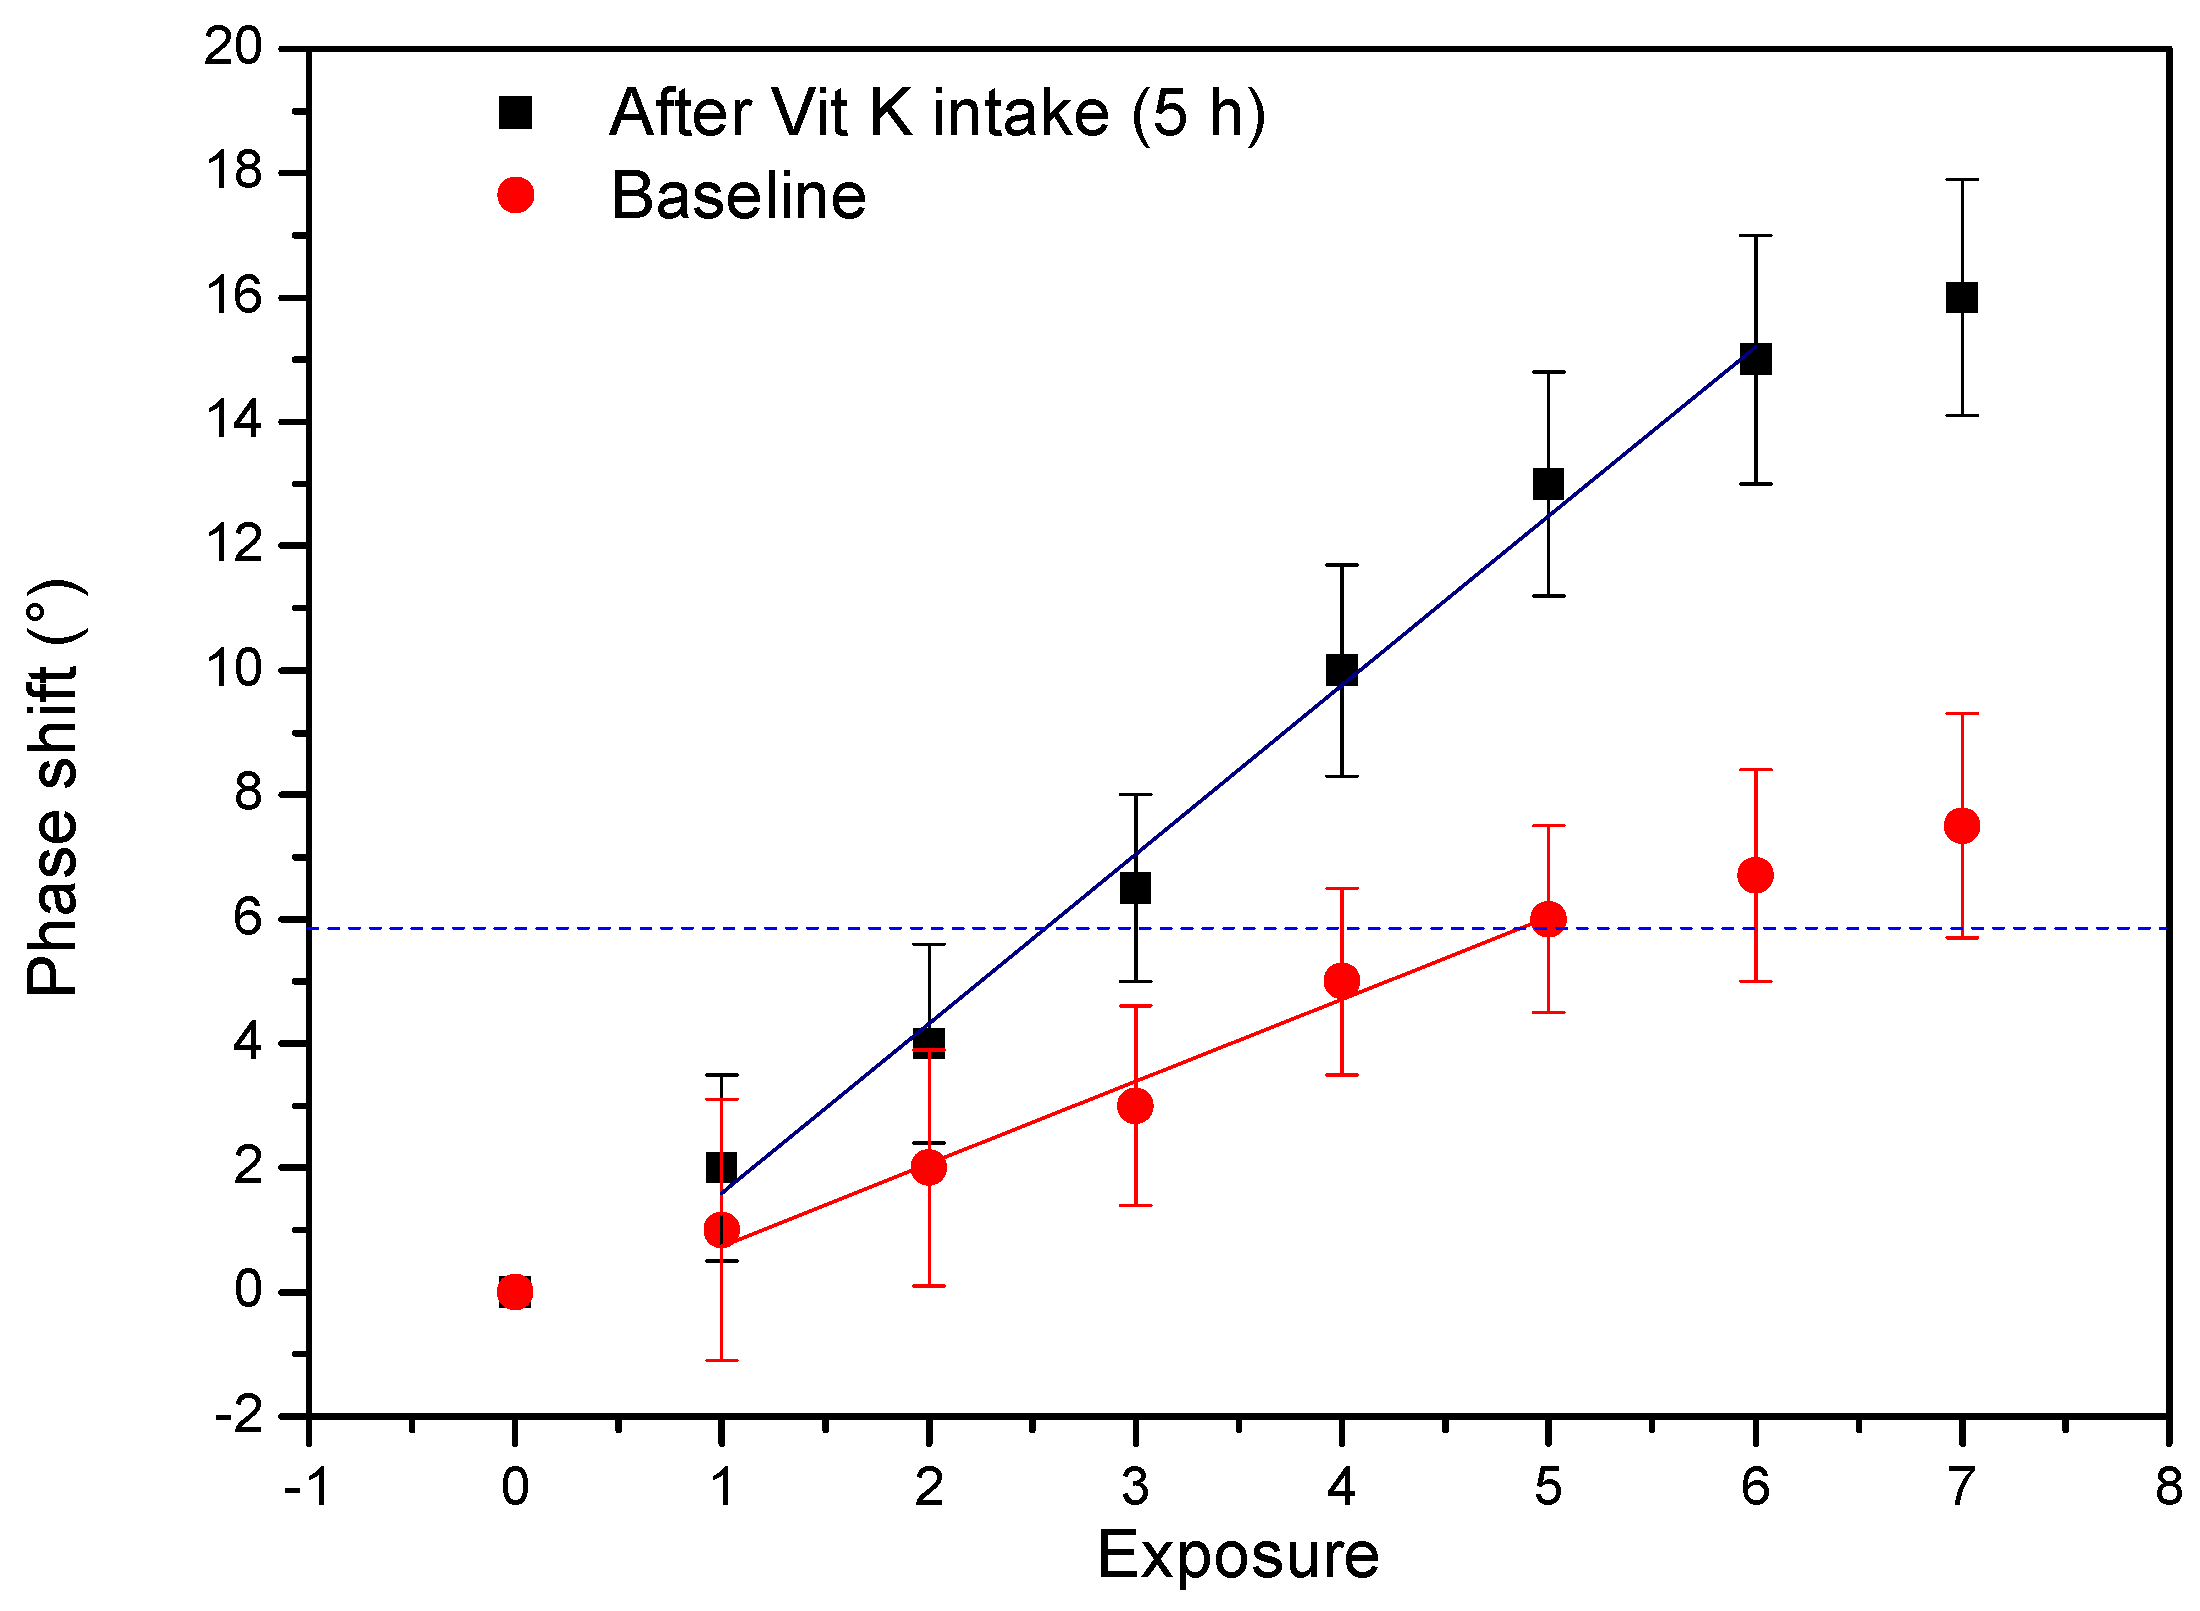
3.4. Proof of Application
4. Conclusions
Supplementary Materials
Author Contributions
Funding
Acknowledgments
Conflicts of Interest
References
- Wulf, G. Enzyme-like Catalysis by Molecularly Imprinted Polymers. Chem. Rev. 2002, 102, 1–28. [Google Scholar] [CrossRef]
- Sellergen, B.; Allender, C.J. Molecularly Imprinted Polymers: A Bridge to Advanced Drug Delivery. Adv. Drug Deliv. Rev. 2005, 57, 1733–1741. [Google Scholar] [CrossRef] [PubMed]
- Schirhagl, R.; Hall, E.W.; Fuereder, I.; Zare, R.N. Separation of bacteria with imprinted polymeric films. Analyst 2012, 137, 1495–1499. [Google Scholar] [CrossRef] [PubMed] [Green Version]
- Qin, L.; He, X.W.; Zhang, W.; Li, W.Y.; Zhang, Y.K. Surface-Modified Polystyrene Beads as Photografting Imprinted Polymer Matrix for Chromatographic Separation of Proteins. J. Chromatogr. A 2009, 1216, 807–814. [Google Scholar] [CrossRef] [PubMed]
- Cheong, W.J.; Yang, S.H.; Ali, F. Molecularly Imprinted Polymers for Separation Science: A Review of Reviews. J. Sep. Sci. 2013, 36, 609–628. [Google Scholar] [CrossRef] [PubMed]
- Liu, J.; Deng, Q.; Tao, D.; Yang, K.; Zhang, L.; Liang, Z.; Zhang, Y. Preparation of Protein Imprinted Materials by Hierarchical Imprinting Techniques and Application in Selective Depletion of Albumin from Human Serum. Sci. Rep. 2014, 4, 5487. [Google Scholar] [CrossRef] [PubMed]
- Whitcombe, M.J.; Kirsch, N.; Nicholls, I.A. Molecular Imprinting Science and Technology: A Survey of the Literature for the Years 2004–2011. J. Mol. Recognit. 2014, 27, 297–401. [Google Scholar] [PubMed]
- Chianella, I.; Guerreiro, A.; Moczko, E.; Caygill, J.S.; Piletska, E.V.; De Vargas Sansalvador, I.M.P.; Whitcombe, M.J.; Piletsky, S.A. Direct Replacement of Antibodies with Molecularly Imprinted Polymer Nanoparticles in ELISA—Development of a Novel Assay for Vancomycin. Anal. Chem. 2013, 85, 8462–8468. [Google Scholar] [CrossRef] [PubMed] [Green Version]
- Haupt, K.; Mosbach, K. Molecularly Imprinted Polymers and Their Use in Biomimetic Sensors. Chem. Rev. 2000, 100, 2495–2504. [Google Scholar] [CrossRef] [PubMed]
- Ye, L.; Haupt, K. Molecularly Imprinted Polymers as Antibody and Receptor mimics for Assays, Sensors and Drug Discovery. Anal. Bioanal. Chem. 2004, 378, 1887–1897. [Google Scholar] [CrossRef] [PubMed]
- Ohnuki, H.; Saiki, T.; Kusakari, A.; Endo, H.; Ichihara, M.; Izumi, M. Incorporation of Glucose Oxidase into Langmuir-Blodgett Films Based on Prussian Blue Applied to Amperometric Glucose Biosensor. Langmuir 2007, 23, 4675–4681. [Google Scholar] [CrossRef] [PubMed]
- Ramanaviciene, A.; Ramanavicius, A. Molecularly Imprinted Polypyrrole-Based Synthetic Receptor for Direct Detection of Bovine Leukemia Virus Glycoproteins. Biosens. Bioelectron. 2004, 20, 1076–1082. [Google Scholar] [CrossRef] [PubMed]
- Tabushi, I.; Kurihara, K.; Naka, K.; Yamamura, K.; Hatakeyama, H. Supramolecular Sensor Based on SnO2 Electrode Modified with Octadecylsilyl Monolayer Having Molecular Binding Sites. Tetrahedron Lett. 1987, 28, 4299–4302. [Google Scholar] [CrossRef]
- Lakshimi, D.; Bossi, A.; Whitcombe, M.J.; Chianella, I.; Fowler, S.A.; Subrahmanyam, S.; Piletska, E.V.; Piletsky, S.A. Electrochemical Sensor for Catechol and Dopamine Based on a Catalytic Molecularly Imprinted Polymer-Conducting Polymer Hybrid Recognition Element. Anal. Chem. 2009, 81, 3576–3584. [Google Scholar] [CrossRef] [PubMed]
- Lang, R.; Chen, L.; Qin, W. Potentiometric detection of chemical vapors using molecularly imprinted polymers as receptors. Sci. Rep. 2015, 5, 12462. [Google Scholar] [CrossRef] [PubMed] [Green Version]
- Wang, Y.; Zhang, Z.; Jain, J.; Yi, J.; Mueller, S.; Sokolov, J.; Liu, Z.; Levon, K.; Rigas, B.; Rafailovich, M.H. Potentiometric Sensors based on based on Surface Molecular Imprinting: Detection of Cancer Biomarkers and Viruses. Sens. Actuators B Chem. 2010, 146, 381–387. [Google Scholar] [CrossRef]
- Bajwa, S.Z.; Lieberzeit, P.A. Recognition principle of Cu2+-imprinted polymers—Assessing interactions by combined spectroscopic and mass-sensitive measurements. Sens. Actuators B Chem. 2015, 207, 976–980. [Google Scholar] [CrossRef]
- Cai, D.; Ren, L.; Zhao, H.; Xu, C.; Zhang, L.; Ying, Y.; Wang, H.; Lan, Y.; Roberts, M.F.; Chuang, J.H.; et al. A Molecular-Imprint Nanosensor for Ultrasensitive Detection of Proteins. Nat. Nanotechnol. 2010, 5, 597–601. [Google Scholar] [CrossRef] [PubMed]
- Peeters, M.; Troost, F.J.; Mingels, R.H.G.; Welsch, T.; van Grinsven, B.; Vranken, T.; Ingebrandt, S.; Thoelen, R.; Cleij, T.J.; Wagner, P. Impedimetric Detection of Histamine in Bowel Fluids Using Synthetic Receptors with pH-Optimized Binding Characteristics. Anal. Chem. 2013, 85, 1475–1483. [Google Scholar] [CrossRef] [PubMed]
- Altintas, Z.; Gittens, M.; Guerreiro, A.; Thompson, K.; Walker, J.; Piletsky, S.; Tothill, I.E. Detection of Waterborne Viruses Using High Affinity Molecularly Imprinted Polymers. Anal. Chem. 2015, 87, 6801–6807. [Google Scholar] [CrossRef] [PubMed]
- Yilmaz, E.; Majidi, D.; Ozgur, E.; Denizli, A. Whole Cell Imprinting Based Escherichia coli Sensors: A Study for SPR and QCM. Sens. Actuators B Chem. 2015, 209, 714–721. [Google Scholar] [CrossRef]
- Ratautaite, V.; Plausinaitis, D.; Baleviciute, I.; Mikoliunaite, L.; Ramanaviciene, A.; Ramanavicius, A. Characterization of Caffeine-Imprinted Polypyrrole by a Quartz Crystal Microbalance and Electrochemical Impedance Spectroscopy. Sens. Actuators B Chem. 2015, 212, 63–71. [Google Scholar] [CrossRef]
- Hayden, O.; Dickert, F.L. Selective Microorganism Detection with Cell Surface Imprinted Polymers. Adv. Mater. 2001, 13, 1480–1483. [Google Scholar] [CrossRef]
- Van Grinsven, B.; Vanden Bon, N.; Strauven, H.; Grieten, L.; Murib, M.S.; Jimenez Monroy, K.L.; Janssens, S.D.; Haenen, K.; Schöning, M.J.; Vermeeren, V.; et al. Heat-Transfer Resistance at Solid-Liquid Interfaces: A Tool for the Detection of Single-Nucleotide Polymorphisms in DNA. ACS Nano 2012, 6, 2712–2721. [Google Scholar] [CrossRef] [PubMed]
- Cornelis, P.; Vandenryt, T.; Wackers, G.; Kellens, E.; Losada-Pérez, P.; Thoelen, R.; De Ceuninck, W.; Eersels, K.; Drijkoningen, S.; Haenen, K.; et al. Heat Transfer Resistance as a Tool to Quantify Hybdrization Efficiency of DNA on a Nanocrystalline Diamond Surface. Diam. Relat. Mater. 2014, 48, 32–36. [Google Scholar] [CrossRef]
- Eersels, K.; van Grinsven, B.; Ethirajan, A.; Timmermans, S.; Jiménez Monroy, K.L.; Bogie, J.F.J.; Punniyakoti, S.; Vandenryt, T.; Hendriks, J.J.A.; Cleij, T.J.; et al. Selective Identification of Macrophages and Cancer Cells Based on Thermal Transport through Surface-Imprinted Polymer Layers. ACS Appl. Mater. Interfaces 2013, 5, 7258–7267. [Google Scholar] [CrossRef] [PubMed] [Green Version]
- Eersels, K.; van Grinsven, B.; Khorshid, M.; Somers, V.; Püttmann, C.; Stein, C.; Barth, S.; Diliën, H.; Bos, G.M.J.; Germeraad, W.T.V.; et al. Heat-Transfer-Method-Based Cell Culture Quality Assay through Cell Detection by Surface Imprinted Polymers. Langmuir 2015, 31, 2043–2050. [Google Scholar] [CrossRef] [PubMed]
- van Grinsven, B.; Eersels, K.; Akkermans, O.; Ellermann, S.; Kordek, A.; Peeters, M.; Deschaume, O.; Bartic, C.; Diliën, H.; Steen Redeker, E.; et al. Label-Free Detection of Escherichia Coli Based on Thermal Transport through Surface Imprinted Polymers. ACS Sens. 2016, 1, 1140–1147. [Google Scholar] [CrossRef]
- Steen Redeker, E.; Eersels, K.; Akkermans, O.; Royakkers, J.; Dyson, D.; Nurekeyeva, K.; Ferrando, B.; Cornelis, P.; Peeters, M.; Wagner, P.; et al. Biomimetic Bacterial Identification Platform Based on Thermal Wave Transport Analysis (TWTA) through Surface-Imprinted Polymers. ACS Inf. Dis. 2017, 3, 388–397. [Google Scholar] [CrossRef] [PubMed]
- Peeters, M.; van Grinsven, B.; Cleij, T.J.; Jiménez-Monroy, K.L.; Cornelis, P.; Pérez-Ruiz, E.; Wackers, G.; Thoelen, R.; De Ceuninck, W.; Lammertyn, J.; et al. Label-free Protein Detection Based on the Heat-Transfer Method—A Case Study with the Peanut Allergen Ara h 1 and Aptamer-Based Synthetic Receptors. ACS Appl. Mater. Interfaces 2015, 7, 10316–10323. [Google Scholar] [CrossRef] [PubMed]
- Wackers, G.; Vandenryt, T.; Cornelis, P.; Kellens, E.; Thoelen, R.; De Ceuninck, W.; Losada Pérez, P.; van Grinsven, B.; Peeters, M.; Wagner, P. Array Formatting of the Heat-Transfer Method (HTM) for the Detection of Small Organic Molecules by Molecularly Imprinted Polymers. Sensors 2014, 14, 11016–11030. [Google Scholar] [CrossRef] [PubMed] [Green Version]
- Diliën, H.; Peeters, M.; Royakkers, J.; Harings, J.; Cornelis, P.; Wagner, P.; Steen Redeker, E.; Banks, C.E.; Eersels, K.; van Grinsven, B.; Cleij, T.J. Label-Free Detection of Small Organic Molecules by Molecularly Imprinted Polymer Functionalized Thermocouples: Toward In Vivo Applications. ACS Sens. 2017, 2, 583–589. [Google Scholar] [CrossRef] [PubMed]
- Peeters, M.M.; van Grinsven, B.; Foster, C.W.; Cleij, T.J.; Banks, C.E. Introducing Thermal Wave Transport Analysis (TWTA): A Thermal Technique for Dopamine Detection by Screen-Printed Electrodes Functionalized with Molecularly Imprinted Polymer (MIP) Particles. Molecules 2016, 21, 552. [Google Scholar] [CrossRef] [PubMed]
- Stenflo, J.; Fernlund, P.; Egan, W.; Roepstorff, P. Vitamin K Dependent Modifications of Glutamic Acid Residues in Prothrombin. Proc. Natl. Acad. Sci. USA 1974, 71, 2730–2733. [Google Scholar] [CrossRef] [PubMed] [Green Version]
- Schurgers, L.J.; Uitto, J.; Reutelingsperger, C.P. Vitamin K-dependent carboxylation of matrix Gla-protein: A crucial switch to control ectopic mineralization. Cell 2013, 19, 217–226. [Google Scholar] [CrossRef] [PubMed]
- Krueger, T.; Westenfeld, R.; Ketteler, M.; Schurgers, L.J.; Floege, J. Vitamin K deficiency in CKD patients: A modifiable risk factor for vascular calcification? Kidney Int. 2009, 76, 18–22. [Google Scholar] [CrossRef] [PubMed]
- Schurgers, L.J.; Vermeer, C. Determination of phylloquinone and menaquinones in food. Effect of food matrix on circulating vitamin K concentrations. Haemostasis 2000, 30, 298–307. [Google Scholar] [PubMed]
- Thijsen, H.H.; Vervoort, L.M.; Schurgers, L.J.; Shearer, M.J. Menadione is a metabolite of oral vitamin K. Br. J. Nutr. 2006, 95, 260–266. [Google Scholar] [CrossRef] [Green Version]
- Sutor, A.H.; von Kries, R.; Cornelissen, E.A.; McNinch, A.W.; Andrew, M. Vitamin K deficiency bleeding (VKDB) in infancy. ISTH Pediatric/Perinatal Subcommittee. International Society on Thrombosis and Haemostasis. Thromb. Haemost. 1999, 81, 456–461. [Google Scholar] [PubMed]
- Conway, S.P. Vitamin K in cystic fibrosis. J. R. Soc. Med. 2004, 97, 48–51. [Google Scholar] [PubMed]
- Westenfeld, R.; Krueger, T.; Schlieper, G.; Cranenburg, E.C.M.; Magdeleyns, E.J.; Heidenreich, S.; Holzmann, S.; Vermeer, C.; Jahnen-Dechent, W.; Ketteler, M.; et al. Effect of vitamin K2 supplementation on functional vitamin K deficiency in hemodialysis patients: A randomized trial. Am. J. Kidney Dis. 2012, 59, 186–195. [Google Scholar] [CrossRef] [PubMed]
- Elliott, M.J.; Booth, S.L.; Hopman, W.M.; Holden, R.M. Assessment of potential biomarkers of subclinical vitamin K deficiency in patients with end-stage kidney disease. Can. J. Kidney Health Dis. 2014, 1, 13. [Google Scholar] [CrossRef] [PubMed]
- Vossen, L.M.; Schurgers, L.J.; van Varik, B.J.; Kietselaer, B.L.J.H.; Vermeer, C.; Meeder, J.G.; Rahel, B.M.; van Cauteren, Y.J.M.; Hoffland, G.A.; Rennenberg, R.J.M.W.; et al. Menaquinone-7 Supplementation to Reduce Vascular Calcification in Patients with Coronary Artery Disease: Rationale and Study Protocol (VitaK-CAC Trial). Nutrients 2015, 7, 8905–8915. [Google Scholar] [CrossRef] [PubMed] [Green Version]
- Peeters, F.E.C.M.; van Mourik, J.W.M.; Meex, S.J.R.; Bucerius, J.; Schalla, S.M.; Gerretsen, S.C.; Mihl, C.; Dweck, M.R.; Schurgers, J.L.; Wildberger, J.E.; et al. Bicuspid Aortic Valve Stenosis and the Effect of Vitamin K2 on Calcification Using 18F-Sodium Fluoride Positron Emission Tomography/Magnetic Resonance: The BASIK2 Rationale and Trial Design. Nutrients 2018, 10, 386. [Google Scholar] [CrossRef] [PubMed]
- Alperin, J.B. Coagulopathy caused by vitamin K deficiency in critically ill, hospitalized patients. JAMA 1987, 258, 1916–1919. [Google Scholar] [CrossRef] [PubMed]
- Katsuyama, H.; Ideguchi, S.; Fukunaga, M.; Saijoh, K.; Sunami, K. Usual dietary intake of fermented soybeans (Natto) is associated with bone mineral density in premenopausal women. J. Nutr. Sci. Vitaminol. 2002, 48, 207–215. [Google Scholar] [CrossRef] [PubMed]
- Sano, M.; Fujita, H.; Morita, I.; Uematsu, H.; Murota, S. Vitamin K2 (menatetrenone) induces iNOS in bovine vascular smooth muscle cells: No relationship between nitric oxide production and gamma-carboxylation. J. Nutr. Sci. Vitaminol. 1999, 45, 711–723. [Google Scholar] [CrossRef] [PubMed]
- Grundberg, C.M.; Nieman, S.D.; Abrams, S.; Rosen, H. Vitamin K status and bone health: An analysis of methods for determination of undercarboxylated osteocalcin. J. Clin. Endocrinol. Metab. 1998, 83, 3258–3266. [Google Scholar]
- Davidson, K.W.; Sadowski, J.A. Determination of vitamin K compounds in plasma or serum by high-performance liquid chromatography using postcolumn chemical reduction and fluorimetric detection. Methods Enzymol. 1997, 282, 408–421. [Google Scholar] [PubMed]
- Schurgers, L.J.; Teunissen, K.J.; Hamulyák, K.; Knapen, M.H.; Vik, H.; Vermeer, C. Vitamin K-containing dietary supplements: Comparison of synthetic vitamin K1 and natto-derived menaquinone-7. Blood 2007, 109, 3279–3283. [Google Scholar] [CrossRef] [PubMed]
- Brandenburg, V.M.; Schurgers, L.J.; Kaesler, N.; Püsche, K.; van Gorp, R.H.; Leftheriotis, G.; Reinartz, S.; Koos, R.; Krüger, T. Prevention of vasculopathy by vitamin K supplementation: Can we turn fiction into fact? Atherosclerosis 2015, 240, 10–16. [Google Scholar] [CrossRef] [PubMed]


© 2018 by the authors. Licensee MDPI, Basel, Switzerland. This article is an open access article distributed under the terms and conditions of the Creative Commons Attribution (CC BY) license (http://creativecommons.org/licenses/by/4.0/).
Share and Cite
Eersels, K.; Diliën, H.; Lowdon, J.W.; Steen Redeker, E.; Rogosic, R.; Heidt, B.; Peeters, M.; Cornelis, P.; Lux, P.; Reutelingsperger, C.P.; et al. A Novel Biomimetic Tool for Assessing Vitamin K Status Based on Molecularly Imprinted Polymers. Nutrients 2018, 10, 751. https://doi.org/10.3390/nu10060751
Eersels K, Diliën H, Lowdon JW, Steen Redeker E, Rogosic R, Heidt B, Peeters M, Cornelis P, Lux P, Reutelingsperger CP, et al. A Novel Biomimetic Tool for Assessing Vitamin K Status Based on Molecularly Imprinted Polymers. Nutrients. 2018; 10(6):751. https://doi.org/10.3390/nu10060751
Chicago/Turabian StyleEersels, Kasper, Hanne Diliën, Joseph W. Lowdon, Erik Steen Redeker, Renato Rogosic, Benjamin Heidt, Marloes Peeters, Peter Cornelis, Petra Lux, Chris P. Reutelingsperger, and et al. 2018. "A Novel Biomimetic Tool for Assessing Vitamin K Status Based on Molecularly Imprinted Polymers" Nutrients 10, no. 6: 751. https://doi.org/10.3390/nu10060751