Breakfast Consumption in French Children, Adolescents, and Adults: A Nationally Representative Cross-Sectional Survey Examined in the Context of the International Breakfast Research Initiative

Abstract
:1. Introduction
2. Materials and Methods
2.1. Population
2.2. Determination of Body Adiposity Status
2.3. Dietary Intake Data
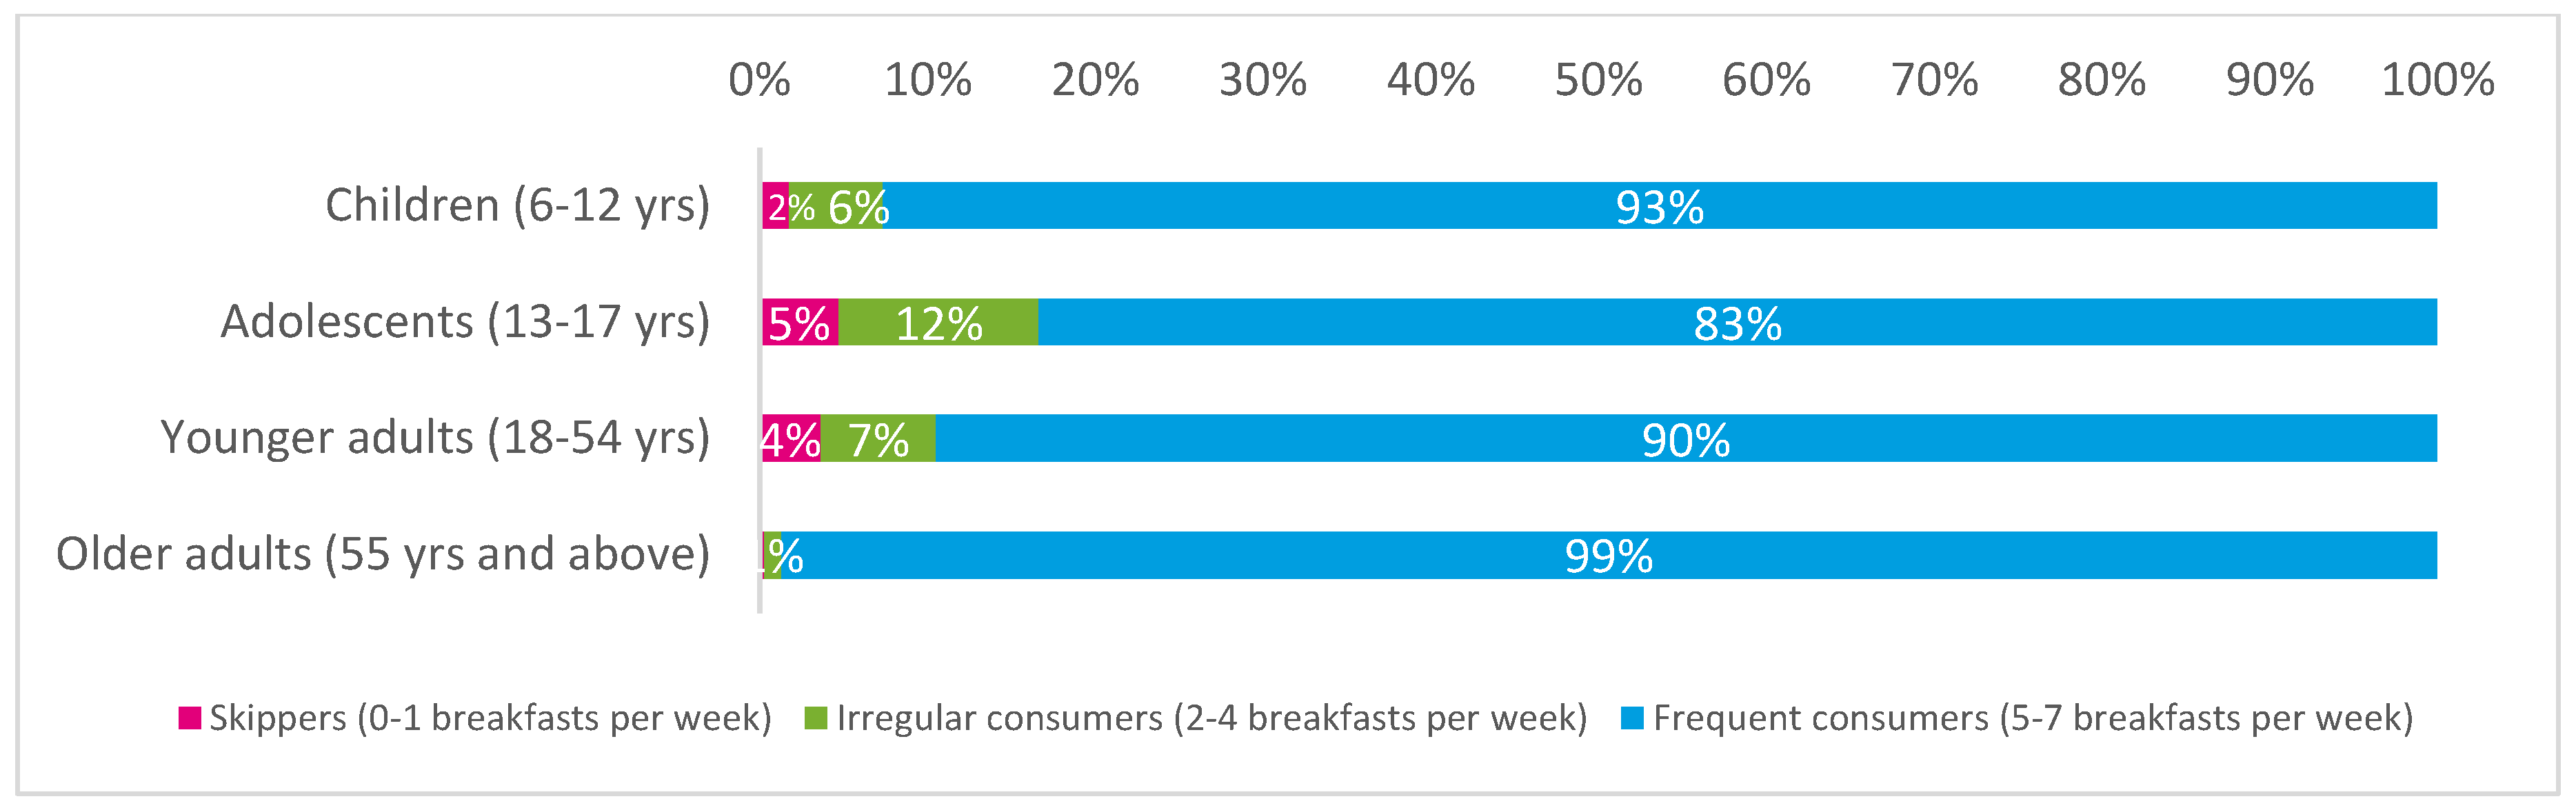
2.4. Assessment of Breakfast Consumption
2.5. Specific Assessment of Wholegrain Consumption
2.6. Assessment of Use of Dietary Supplements
2.7. Assessment of Nutrient Density
2.8. Assessment of Daily Screen Watching Time
2.9. Assessment of Daily Physical Activity in Adults
2.10. Statistical Analyses
3. Results
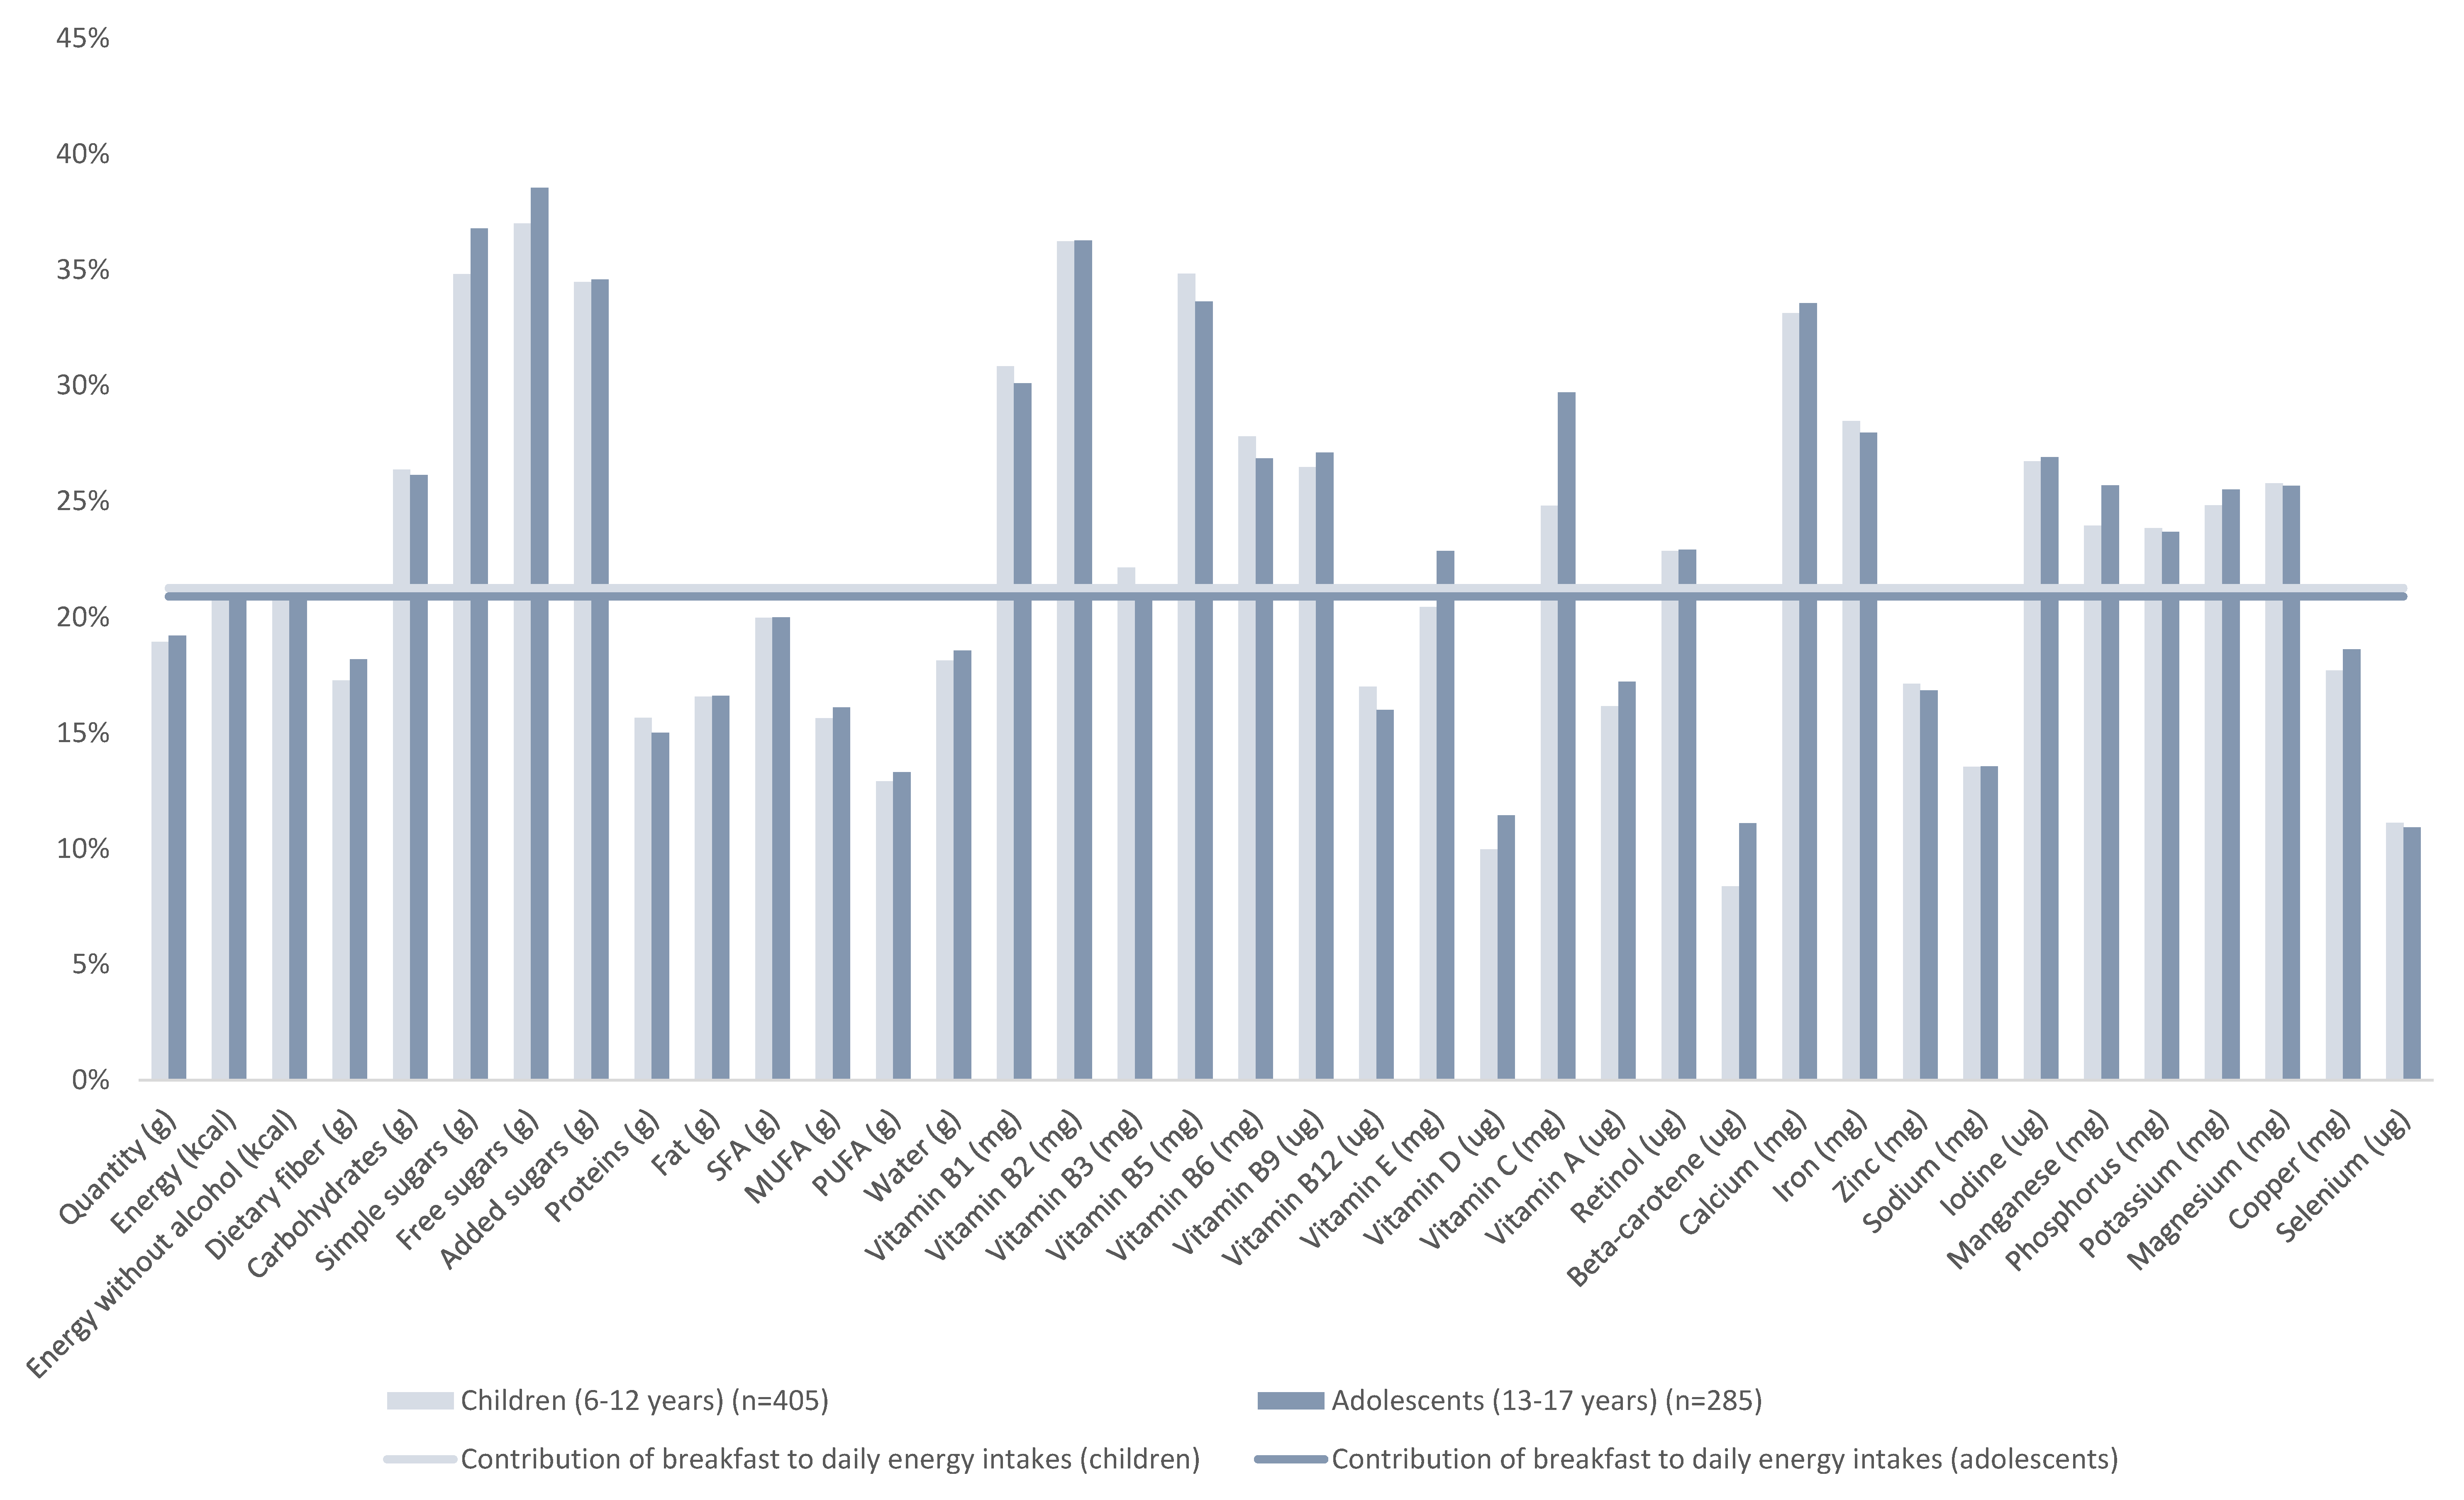
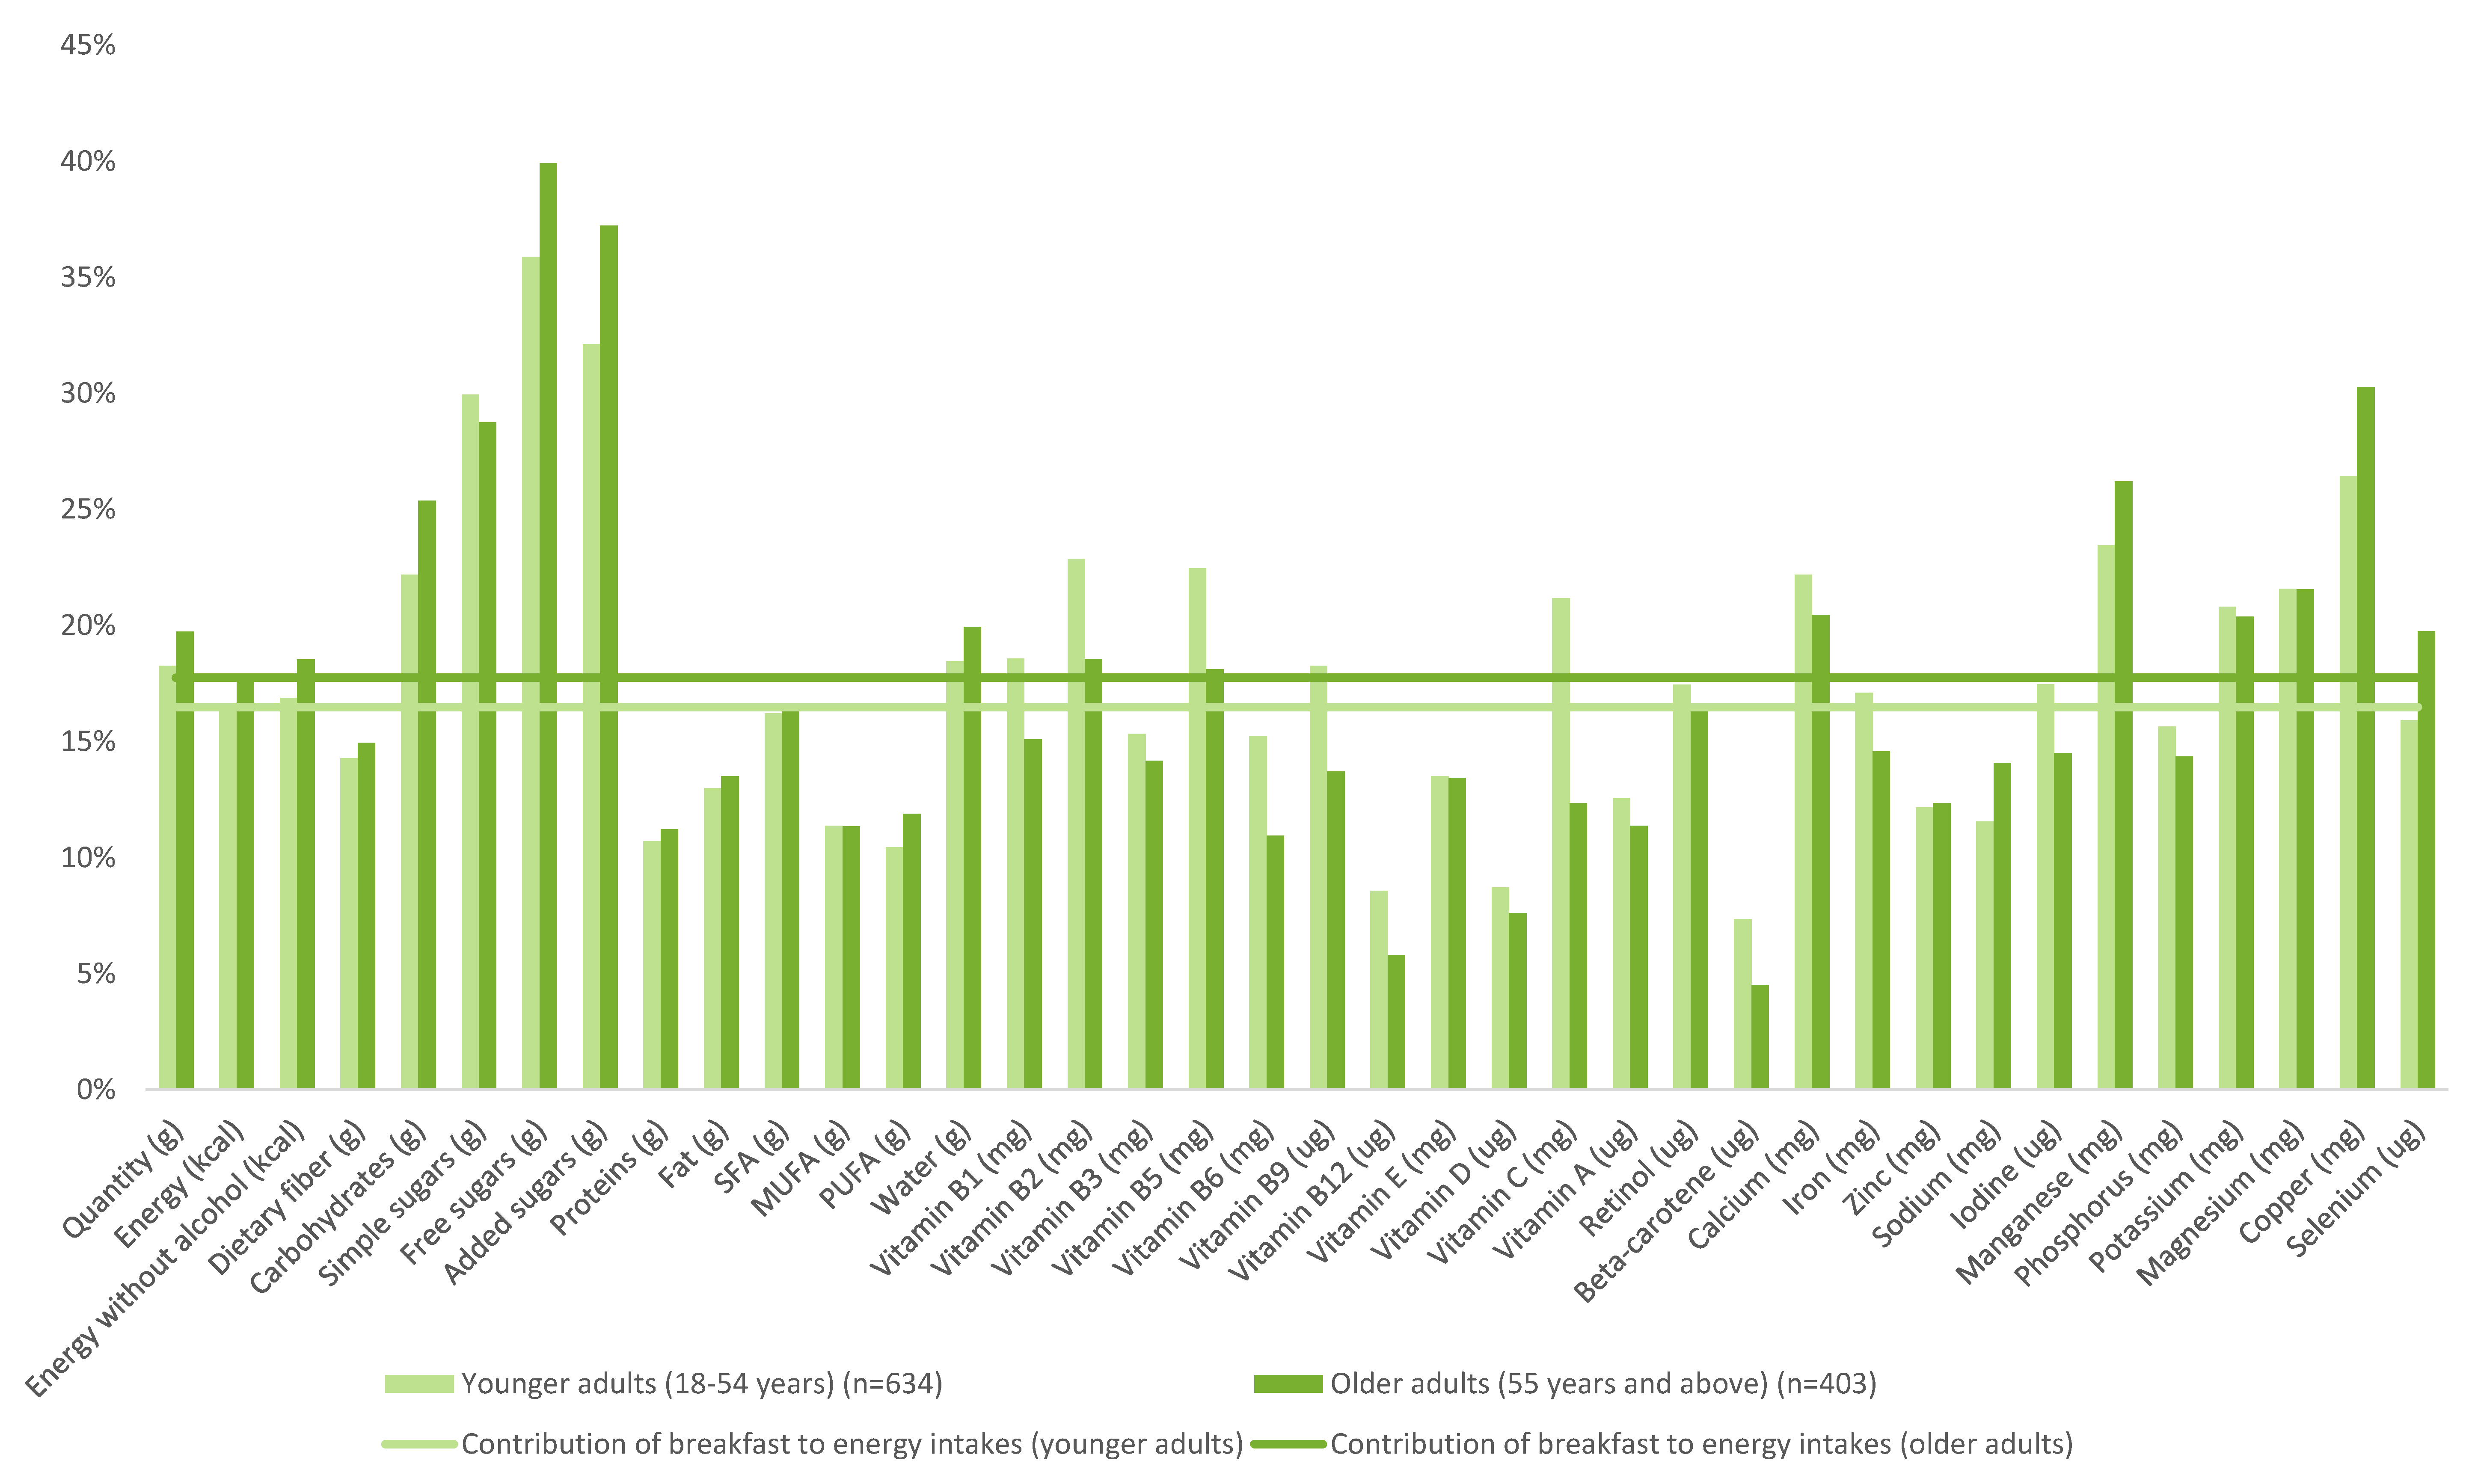
3.1. Food Composition of Breakfasts
3.2. NRF9.3 Data
4. Discussion
5. Conclusions
Author Contributions
Funding
Conflicts of Interest
Appendix A. Governing Principles Document
- -
- Participants are expected to provide impartial and objective input throughout the Project.
- -
- Participants are under no obligation to promote or communicate about CPW SA, its products or the breakfast cereal category.
- -
- To the extent a participant makes public statements or other comments (e.g., on social media) regarding CPW SA or its products, he/she shall disclose his/her material connection to the Company.
- -
- The Steering Committee will decide on authorship and intellectual input into the scientific paper, but it is anticipated that the paper will be drafted by the Project Chair and Co-Chair with iterative inputs from the other participants. The Project Chair will submit the final paper for publication.
- -
- The resulting publication shall accurately reflect the funding by CPW of the Project. In case a CPW SA employee materially participates in the drafting of the paper, this shall also be accurately reflected.

| Children | Adolescents | Younger Adults | Older Adults | ANCOVA * | |||||
|---|---|---|---|---|---|---|---|---|---|
| (6–12 years) | (13–17 years) | (18–54 years) | (55 years and above) | ||||||
| N = 405 | N = 285 | N = 634 | N = 403 | ||||||
| Solid Foods | Mean | SD | Mean | SD | Mean | SD | Mean | SD | p-value |
| Sweet crackers and biscuits | 6.1 a | 0.8 | 5.3 a | 0.9 | 5.0 a | 0.6 | 0.8 b | 0.2 | <0.001 |
| Of which wholegrain | 0.9 | 0.2 | 0.2 | 0.1 | 0.6 | 0.3 | 0.1 | 0 | 0.054 |
| Of which non-wholegrain | 5.2 a | 0.7 | 5.1 a | 0.9 | 4.4 a | 0.5 | 0.8 b | 0.2 | <0.001 |
| Breakfast cereals | 13.5 a | 0.8 | 14.7 a | 1.5 | 6.4 b | 0.7 | 2.3 c | 0.6 | <0.001 |
| Of which wholegrain | 5.2 a,b | 0.5 | 6.7 a | 1 | 3.9 b,c | 0.5 | 2.0 c | 0.5 | <0.001 |
| Of which non-wholegrain | 8.3 a | 0.7 | 8.0 a | 1.2 | 2.5 b | 0.4 | 0.4 c | 0.2 | <0.001 |
| Fruit desserts | 0.8 | 0.2 | 1.1 | 0.4 | 1.4 | 0.5 | 1.3 | 0.4 | 0.67 |
| Milk desserts | 0.3 | 0.1 | 0.4 | 0.3 | 0.3 | 0.1 | 0.5 | 0.2 | 0.967 |
| Fruits | 3.0 a | 0.5 | 2.7 a | 0.7 | 9.0 a | 1.2 | 11.7 b | 1.8 | <0.001 |
| Fats and oils | 1.6 a | 0.1 | 1.4 a | 0.2 | 3.2 b | 0.2 | 7.4 c | 0.4 | <0.001 |
| Breads and toasts | 13.3 a | 1 | 18.4 a | 1.9 | 25.3 b | 1.4 | 46.4 c | 1.9 | <0.001 |
| Of which wholegrain | 0.5 a | 0.2 | 0.5 a | 0.2 | 1.7 b,c | 0.3 | 2.6 c | 0.6 | <0.001 |
| Of which non-wholegrain | 12.8 a | 1 | 18.0 a | 1.9 | 23.6 b | 1.4 | 43.8 c | 1.8 | <0.001 |
| Cakes and pies | 3.8 a | 0.4 | 4.0 a | 0.7 | 3.1 a | 0.5 | 1.4 b | 0.4 | 0.001 |
| Sugars and sweets | 7.2 a | 0.5 | 9.2 a,b | 0.9 | 10.6 b | 0.6 | 16.2 c | 0.8 | <0.001 |
| Fresh dairy products | 7.1 a,b | 1.1 | 5.2 a | 1.2 | 6.4 a | 0.9 | 10.6 b | 1.5 | 0.018 |
| Viennoiseries | 10.3 a | 0.7 | 13.3 a | 1.3 | 10.8 a | 0.8 | 6.9 b | 0.7 | <0.001 |
| Other products (cheese, eggs, meat, …) | 0.4 a | 0.1 | 0.8 a | 0.2 | 2.5 b | 0.6 | 4.6 c | 0.8 | |
| Beverages | |||||||||
| Sodas | 8.5 a,b | 1.7 | 11.3 a | 2.9 | 6.3 a,b | 1.3 | 2.6 b | 1 | 0.005 |
| Milk | 164.4 a | 5.7 | 176.0 a | 8.6 | 86.5 b | 4.9 | 61.8 c | 4.1 | <0.001 |
| Of which milk from hot beverages | 68.8 a | 4.6 | 71.6 a | 6.4 | 44.0 b | 3.3 | 52.1 b | 3.7 | <0.001 |
| Of which milk from other sources | 95.5 a | 5.5 | 104.4 a | 8.3 | 42.5 b | 4.1 | 9.7 c | 2 | <0.001 |
| Water | 17.4 | 2.2 | 14.4 | 3 | 16.2 | 2.3 | 19.4 | 2.7 | 0.608 |
| Juices and nectars | 46.2 a | 3.1 | 63.7 b,c | 5.4 | 43.8 c | 3 | 26.6 d | 2.7 | <0.001 |
| Hot beverages | 20.6 a | 2.3 | 30.9 a | 4.2 | 183.9 b | 7 | 264.9 c | 7.8 | <0.001 |
| Children (6–17 years) | Adults (18 years+) | |
|---|---|---|
| (n = 676; nw = 690) | (n = 1040; nw = 1037) | |
| Total | 634.6 (73.2) | 674.7 (82.8) |
| p-value | <0.0001 | |
| Age group | ||
| 6–12 | 639.5 (70.8) | |
| 13–17 | 634.7 (78.3) | |
| p-value | 0.3938 | |
| 18–24 years | 627.1 (79.7) a | |
| 25–34 | 648.2 (87.7) a,b,c | |
| 35–44 | 660.0 (96.1) b,c | |
| 45–54 | 671.7 (81.4) c,d | |
| 55–64 | 693.8 (62.7) d,e | |
| >65 | 705.0 (68.3) e | |
| p-value | <0.0001 | |
| Sex | ||
| Male | 636.6 (71.2) | 663.4 (87.4) |
| Female | 638.4 (76.5) | 680.7 (78.2) |
| p-value | 0.7505 | 0.0007 |
| Education of the head of household: highest degree obtained | ||
| No diploma | 613.2 (61.4) a | 653.1 (81.2) a |
| Lower than High School Degree | 627.7 (68.1) a | 665.9 (82.0) a |
| Vocational Education | 626.0 (67.0) a,b | 653.7 (87.3) b |
| High School | 658.9 (68.9) b,c | 689.5 (85.7) b |
| Undergraduate | 630.0 (97.5) a,b | 686.9 (70.8) b |
| Graduate | 673.1 (70.9) c | 685.7 (83.7) b |
| Other | 700.6 (57.9) a,c,b | |
| Missing | 630.0 (35.5) a,c,b | 704.3 (91) a,b |
| p-value | <0.0001 | 0.0009 |
| Occupation of the head of household | ||
| Farmer, artisan, trader, business owner | 647.8 (92.8) a,b | 677.9 (84.6) a,b |
| Executive, Senior Intellectual Profession, Liberal Profession | 665.7 (77.0) a | 689.7 (80.2) a |
| Intermediate occupation | 643.2 (87.3) b | 681.5 (74.5) a,b |
| Employee | 625.7 (60.9) b | 668.2 (85.5) a,b |
| Worker | 622.2 (64.3) b | 657.7 (81.6) b |
| Never employed / Inactive | 617.6 (58.3) a,b | 646.1 (87.5) a |
| p-value | <0.0001 | <0.0001 |
| Type of household | ||
| Couple without children | 681.7 (73.3) a | |
| Couple with children | 637.9 (76.2) | 655.2 (85.7) b |
| Single parent family | 636.8 (66.6) | 654.6 (93.2) b |
| Single | 691.0 (78.9) a | |
| Other | 625.5 (54.3) | 640.9 (113.4) a,b |
| p-value | 0.9136 | <0.0001 |
| Number of children (<15 years) | ||
| 0 | 625.5 (54.3) | 684.0 (77.1) a |
| 1 | 652.6 (81.6) | 653.8 (84.3) b |
| 2 | 634.9 (70.7) | 660.5 (89.4) b |
| 3 or more | 633.5 (72.5) | 648.8 (90.8) b |
| p-value | 0.0841 | <0.0001 |
| Number of people working in the household | ||
| 0 | 602.6 (56.1) a | 695.7 (71.7) a |
| 1 | 635.7 (74.0) a | 661.5 (84.7) b |
| 2 or more | 641.1 (74.2) b | 661.4 (86.0) b |
| p-value | 0.0315 | <0.0001 |
| Living area | ||
| Rural | 629.0 (64.8) a | 670.7 (79.1) a,b |
| 2 to 20,000 inhabitants | 630.8 (80.9) a,b | 666.2 (74.5) a,b |
| 20 to 100,000 inhabitants | 635.2 (73.4) a,b | 655.6 (90.2) a |
| >100,000 inhabitants | 640.5 (71.1) a,b | 680.1 (87.1) b |
| Paris | 655.1 (82.9) b | 680.8 (78.4) a,b |
| p-value | 0.0472 | 0.0220 |
| Region | ||
| Paris region | 648.6 (84.6) | 676.9 (77.3) a,b |
| North France | 634.1 (75.8) | 664.2 (80.6) a |
| South France | 636.8 (64.8) | 680.5 (86.4) b |
| p-value | 0.1807 | 0.0122 |
| Food budget by consumption unit | ||
| First Tertile | 643.7 (68.2) | 667.5 (89.5) |
| Second Tertile | 639.4 (69.3) | 666.2 (82.8) |
| Third Tertile | 632.7 (80.0) | 679.1 (77.9) |
| p-value | 0.2659 | 0.0536 |
| Income per consumption unit | ||
| Less than 9909 € | 644.5 (73.1) | 666.3 (87.9) |
| From 9909 € to 12,958 € | 618.9 (55.0) | 653.4 (86.1) |
| From 12,958 € to 18,294 € | 624.6 (58.2) | 664.5 (81.0) |
| From 18,294 € to 30,490 € | 629.4 (80.2) | 674.8 (82.8) |
| More than 30,490 € | 645.0 (73.8) | 677.7 (75.9) |
| Missing | 642.1 (77.5) | 681.1 (85.3) |
| p-value | 0.0834 | 0.2381 |
| BMI | ||
| <18.5 | 628.0 (76.3) | 624.0 (103.2) a |
| 18.5–25 | 637.2 (72.5) | 669.9 (85.6) b |
| 25–30 | 639.2 (75.1) | 679.4 (71.6) b |
| ≥30 | 669.2 (75.7) | 680.7 (81.1) b |
| p-value | 0.0799 | 0.0004 |
| Daily Screen time | ||
| Lower | 644.4 (73.1) | 683.3 (75.4) |
| Higher | 630.5 (73.6) | 665.1 (86.2) |
| p-value | 0.0134 | 0.0005 |
| Physical activity | ||
| Higher | 635.8 (76.5) | 676.7 (80.0) |
| Lower | 637.1 (69.4) | 666.1 (85.5) |
| p-value | 0.7758 | 0.0404 |
| Smoking | ||
| Yes | 640.6 (90.8) a | |
| No | 686.3 (74.9) b | |
| Missing | 632.5 (69.4) a,b | |
| p-value | <0.0001 | |
| Children & Adolescents (6–17 years) | Adults (18 years+) | |||||||||||
|---|---|---|---|---|---|---|---|---|---|---|---|---|
| T1 (n = 231; nw = 221) | T2 (n = 213; nw = 224) | T3 (n = 222; nw = 234) | Model A * | Model B * | T1 (n = 322; nw = 332) | T2 (n = 338; nw = 338) | T3 (n = 364; nw = 351) | Model A ** | Model C ** | |||
| p-Value | p-Value Model | p-Value for Tertiles Effect | p-Value | p-Value Model | p-Value for Tertiles Effect | |||||||
| NRF 9.3 | 558.1 (45.9) a | 638.6 (17.2) b | 713.9 (35.9) c | <0.001 | <0.001 | <0.001 | 579.3 (55.2) a | 677.7 (18.9) b | 757.6 (33.5) c | <0.001 | <0.001 | <0.001 |
| Positive subscore | 655.8 (45.6) a | 714.2 (31.4) b | 766.3 (34.1) c | <0.001 | <0.001 | <0.001 | 674.8 (49.3) a | 750.9 (32.3) b | 811.3 (34.2) c | <0.001 | <0.001 | <0.001 |
| Negative subscore | 97.8 (38.3) a | 75.6 (27.3) b | 52.4 (27.0) c | <0.001 | <0.001 | <0.001 | 95.5 (45.0) a | 73.2 (28.4) b | 53.7 (22.8) c | <0.001 | <0.001 | <0.001 |
| Calcium subscore | 0.934 (0.117) a | 0.977 (0.061) a | 0.988 (0.039) b | <0.001 | <0.001 | <0.001 | 0.922 (0.131) a | 0.96 (0.091) b | 0.983 (0.05) c | <0.001 | <0.001 | <0.001 |
| Potassium subscore | 0.990 (0.030) a | 0.999 (0.007) b | 1.000 (0.001) b | <0.001 | <0.001 | <0.001 | 0.994 (0.030) a | 1.000 (0.003) b | 1.000 (0.000) b | <0.001 | 0.001 | <0.001 |
| Protein subscore | 1.000 (0.001) | 1.000 (0.000) | 1.000 (0.000) | 0.250 | 0.947 | 0.345 | 1.000 (0.000) | 1.000 (0.000) | 1.000 (0.000) | . | . | . |
| Fiber subscore | 0.566 (0.089) a | 0.631 (0.108) b | 0.731 (0.120) c | <0.001 | <0.001 | <0.001 | 0.607 (0.122) a | 0.725 (0.133) b | 0.837 (0.128) c | <0.001 | <0.001 | <0.001 |
| Iron subscore | 0.774 (0.134) a | 0.855 (0.128) b | 0.881 (0.122) b | <0.001 | <0.001 | <0.001 | 0.763 (0.147) a | 0.826 (0.139) b | 0.912 (0.114) c | <0.001 | <0.001 | <0.001 |
| Vitamin A subscore | 0.555 (0.209) a | 0.703 (0.221) b | 0.820 (0.200) c | <0.001 | <0.001 | <0.001 | 0.657 (0.244) a | 0.794 (0.218) b | 0.882 (0.170) c | <0.001 | <0.001 | <0.001 |
| Vitamin D subscore | 0.362 (0.144) a | 0.391 (0.172) a | 0.506 (0.242) b | <0.001 | <0.001 | <0.001 | 0.399 (0.185) a | 0.502 (0.239) b | 0.633 (0.256) c | <0.001 | <0.001 | <0.001 |
| Vitamin C subscore | 0.702 (0.274) a | 0.843 (0.210) b | 0.928 (0.149) c | <0.001 | <0.001 | <0.001 | 0.645 (0.279) a | 0.870 (0.195) b | 0.952 (0.116) c | <0.001 | <0.001 | <0.001 |
| Magnesium subscore | 0.676 (0.088) a | 0.744 (0.091) b | 0.809 (0.104) c | <0.001 | <0.001 | <0.001 | 0.761 (0.129) a | 0.831 (0.119) b | 0.914 (0.098) c | <0.001 | <0.001 | <0.001 |
| Sodium subscore | 0.149 (0.160) | 0.162 (0.177) | 0.166 (0.161) | 0.504 | 0.556 | 0.582 | 0.346 (0.253) a,b | 0.382 (0.241) a | 0.324 (0.210) b | 0.005 | <0.001 | <0.001 |
| Saturated fat subscore | 0.212 (0.170) a | 0.188 (0.165) a | 0.125 (0.143) b | <0.001 | <0.001 | 0.000 | 0.292 (0.285) a | 0.219 (0.184) b | 0.144 (0.148) c | <0.001 | <0.001 | <0.001 |
| Free sugars subscore | 0.617 (0.423)a | 0.406 (0.298) b | 0.233 (0.258) c | <0.001 | <0.001 | <0.001 | 0.316 (0.467) a | 0.131 (0.217) b | 0.070 (0.134) c | <0.001 | <0.001 | <0.001 |
References
- Spence, C. Breakfast: The most important meal of the day? Int. J. Gastronomy Food Sci. 2017, 8, 1–6. [Google Scholar] [CrossRef]
- Betts, J.A.; Chowdhury, E.A.; Gonzalez, J.T.; Richardson, J.D.; Tsintzas, K.; Thompson, D. Is breakfast the most important meal of the day? Proc. Nutr. Soc. 2017, 75, 464–474. [Google Scholar] [CrossRef] [PubMed]
- Garaulet, M.; Gomez-Abellan, P. Timing of food intake and obesity: A novel association. Physiol. Behav. 2014, 134, 44–50. [Google Scholar] [CrossRef] [PubMed]
- Cahill, L.E.; Chiuve, S.E.; Mekary, R.A.; Jensen, M.K.; Flint, A.J.; Hu, F.B.; Rimm, E.B. A prospective study of breakfast eating and incident coronary heart disease in a cohort of male U.S. health professionals. Circulation 2013, 128, 337–343. [Google Scholar] [CrossRef] [PubMed]
- Betts, J.A.; Richardson, J.D.; Chowdhury, E.A.; Holman, G.D.; Tsintzas, K.; Thompson, D. The causal role of breakfast in energy balance and health: A randomized controlled trial in lean adults. Am. J. Clin. Nutr. 2014, 100, 539–547. [Google Scholar] [CrossRef] [PubMed] [Green Version]
- Benton, D.; Maconie, A.; Williams, C. The influence of the glycaemic load of breakfast on the behaviour of children in school. Physiol. Behav. 2007, 92, 717–724. [Google Scholar] [CrossRef] [PubMed]
- Galioto, R.; Spitznagel, M.B. The effects of breakfast and breakfast composition on cognition in adults. Adv. Nutr. 2016, 7, 576S–589S. [Google Scholar] [CrossRef] [PubMed]
- Ionivo, I.; Stuff, J.; Liu, Y.; Brewton, C.; Dovi, A.; Kleinman, R.; Nicklas, T. Breakfast consumption has no effect on neurophychological functioning in children: A repeated-measures clinical trial. Am. J. Clin. Nutr. 2016, 104, 715–721. [Google Scholar]
- Leidy, H.J.; Gwin, J.A.; Roenfeldt, C.A.; Zino, A.Z.; Shafer, R.S. Evaluating the intervention-based evidence surrounding the causal role of breakfast on markers of weight management, with specific focus on breakfast composition and size. Adv. Nutr. 2016, 7, 563S–575S. [Google Scholar] [CrossRef] [PubMed]
- Horikawa, C.; Kodama, S.; Yachi, Y.; Heianza, Y.; Hirasawa, R.; Ibe, Y.; Saito, K.; Shimano, H.; Yamada, N.; Sone, H. Skipping breakfast and prevalence of overweight and obesity in Asian and Pacific regions: A meta-analysis. Prev. Med. 2011, 53, 260–267. [Google Scholar] [CrossRef] [PubMed]
- Mesas, A.E.; Munoz-Pareja, M.; Lopez-Garcia, E.; Rodriguez-Artalejo, F. Selected eating behaviours and excess body weight: A systematic review. Obes. Rev. 2012, 13, 106–135. [Google Scholar] [CrossRef] [PubMed]
- Rampersaud, G.C.; Pereira, M.A.; Girard, B.L.; Adams, J.; Metzl, J.D. Breakfast habits, nutritional status, body weight, and academic performance in children and adolescents. J. Am. Diet. Assoc. 2005, 105, 743–760. [Google Scholar] [CrossRef] [PubMed]
- Szajewska, H.; Ruszczynski, M. Systematic review demonstrating that breakfast consumption influences body weight outcomes in children and adolescents in Europe. Crit. Rev. Food Sci. Nutr. 2010, 50, 113–119. [Google Scholar] [CrossRef] [PubMed]
- Deshmukh-Taskar, P.R.; Nicklas, T.A.; O’Neil, C.E.; Keast, D.R.; Radcliffe, J.D.; Cho, S. The relationship of breakfast skipping and type of breakfast consumption with nutrient intake and weight status in children and adolescents: The National Health and Nutrition Examination Survey 1999–2006. J. Am. Diet. Assoc. 2010, 110, 869–878. [Google Scholar] [CrossRef] [PubMed]
- Siega-Riz, A.M.; Popkin, B.M.; Carson, T. Trends in breakfast consumption for children in the United States from 1965–1991. Am. J. Clin. Nutr. 1998, 67, 748S–756S. [Google Scholar] [CrossRef] [PubMed]
- Dhurandhar, E.J.; Dawson, J.; Alcorn, A.; Larsen, L.H.; Thomas, E.A.; Cardel, M.; Bourland, A.C.; Astrup, A.; St-Onge, M.P.; Hill, J.O.; et al. The effectiveness of breakfast recommendations on weight loss: A randomized controlled trial. Am. J. Clin. Nutr. 2014, 100, 507–513. [Google Scholar] [CrossRef] [PubMed]
- Bohan Brown, M.M.; Milanes, J.E.; Allison, D.A.; Brown, A.W. Eating compared to skipping breakfast has no discernible benefit for obesity-related anthropometrics: Systematic review and meta-analysis of randomized controlled trials. FASEB J. 2017, 31, lb363. [Google Scholar]
- Gonzalez, J. Breakfast for prevention and treatment of obesity. In Practical Guide to Obesity Medicine; Weaver, J., Ed.; Elsevier: St. Louis, MI, USA, 2018; pp. 241–249. [Google Scholar]
- Afeiche, M.C.; Smith Taillie, L.; Hopkins, S.; Elridge, A.L.; Popkin, B.M. Breakfast dietary patterns among Mexican children are related to total-day diet quality. J. Nutr. 2017, 147, 404–412. [Google Scholar] [CrossRef] [PubMed]
- Fayet-Moore, F.; Kim, J.; Sritharan, N.; Petocz, P. Impact of breakfast skipping and breakfast choice on the nutrient intake and body mass index of Australian children. Nutrients 2016, 8, 487. [Google Scholar] [CrossRef] [PubMed]
- Coulthard, J.D.; Palla, L.; Pot, G.K. Breakfast consumption and nutrient intakes in 4–18-year-olds: UK National Diet and Nutrition Survey Rolling Programme (2008–2012). Br. J. Nutr. 2017, 118, 280–290. [Google Scholar] [CrossRef] [PubMed] [Green Version]
- Lepicard, E.M.; Maillot, M.; Vieux, F.; Viltard, M.; Bonnet, F. Quantitative and qualitative analysis of breakfast nutritional composition in French schoolchildren aged 9–11 years. J. Hum. Nutr. Diet. 2016, 30, 151–158. [Google Scholar] [CrossRef] [PubMed]
- Gibney, M.J.; Barr, S.I.; Bellisle, F.; Drewnowski, A.; Fagt, S.; Livingstone, B.; Masset, G.; Varela-Moreiras, G.; Moreno, L.; Smith, J.; et al. Breakfast in human nutrition: The International Breakfast Research Initiative. Nutrients 2018, 10, 559. [Google Scholar] [CrossRef] [PubMed]
- Agence Nationale de Sécurité Sanitaire de l’Alimentation, de l’Environnement et du Travail. Programme National Nutrition & Santé; MangerBouger. Available online: http://www.mangerbouger.fr/Manger-Mieux/Que-veut-dire-bien-manger/Se-reunir-autour-de-repas-reguliers (accessed on 27 March 2018).
- Bellisle, F.; Hébel, P.; Colin, J.; Réyé, B.; Hopkins, S. Consumption of wholegrains in French children adolescents and adults. Br. J. Nutr. 2014, 112, 1674–1684. [Google Scholar] [CrossRef] [PubMed]
- Hébel, P. Comportements et Consommations Alimentaires en France (Food Intake and Behaviours in France); Tec & Doc Lavoisier: Paris, France, 2012. [Google Scholar]
- Schofield, W.N. Predicting basal metabolic rate, new standards and review of previous work. Hum. Nutr. Clin. Nutr. 1985, 39 (Suppl. 1), 5–41. [Google Scholar]
- Cole, T.; Bellizzi, M.C.; Flegal, K.M.; Dietz, W.H. Establishing a standard definition for child overweight and obesity world-wide: International survey. BMJ 2000, 320, 1240–1243. [Google Scholar] [CrossRef] [PubMed]
- SUVIMAX. Portions Alimentaires: Manuel Photos Pour L’estimation des Quantités (Food Portions: Handbook of Photographs to Help Estimating Quantities); Polytechnica: Paris, France, 2000. [Google Scholar]
- CIQUAL 2 Food Composition Table. 2013. Available online: http://www.ansespro.fr/TableCIQUAL/ (accessed on 27 June 2017).
- Louie, J.C.T.; Moshtaghian, H.; Boylan, S.; Flood, V.M.; Rangan, A.M.; Barclay, A.W.; Brand-Miller, J.C.; Gill, T.P.A. A systematic methodology to estimate added sugar content of foods. Eur. J. Clin. Nutr. 2015, 69, 154–161. [Google Scholar] [CrossRef] [PubMed]
- Mintel Global New Products Database. 2012. Available online: http://www.gnpd.com (accessed on 27 June 2017).
- Fulgoni, V.L., III; Keast, D.R.; Drewnowski, A. Development and validation of the Nutrient-Rich Foods Index: A tool to measure nutritional quality of foods. J. Nutr. 2009, 139, 1549–1554. [Google Scholar]
- Drewnowski, A. Defining nutrient density: Development and validation of the Nutrient Rich Foods Index. J. Am. Coll. Nutr. 2009, 28, 421S–426S. [Google Scholar] [CrossRef] [PubMed]
- Drewnowski, A.; Fulgoni, V.L., III. Nutrient density: Principles and evaluation tools. Am. J. Clin. Nutr. 2014, 99, 1223S–1228S. [Google Scholar] [CrossRef] [PubMed]
- European Union. Regulation (EU) No 1169/2011 of the European Parliament and of the Council of 25 October 2011; European Union: Brussels, Belgium, 2011. [Google Scholar]
- World Health Organisation. Available online: http://www.who.int/news-room/fact-sheets/detail/healthy-diet (accessed on 27 June 2018).
- ANSES (Agence Nationale de Sécurité sanitaire, Alimentation, Environnement, Travail). Apports Nutritionnels Conseillés. Available online: https://www.anses.fr/fr/system/files/NUT2006sa0359.pdf (accessed on 27 June 2017).
- ANSES (Agence Nationale de Sécurité sanitaire, Alimentation, Environnement, Travail). Etude Individuelle Nationale des Consommations Alimentaires 3 (INCA 3). Available online: https://www.anses.fr/fr/system/files/NUT2014SA0234Ra.pdf (accessed on 27 March 2018).
- O’Neill, C.E.; Byrd-Bredbenner, C.; Hayes, D.; Jana, L.; Klinger, S.E.; Stephenson-Martin, S. The role of breakfast in health: Definition and criteria for a quality breakfast. J. Acad. Nutr. Diet. 2014, 114 (Suppl. 3), S8–S26. [Google Scholar] [CrossRef]
- De Castro, J.M. Methodology, correlational analysis, and interpretation of diet diary records of the food and fluid intake of free-living humans. Appetite 1994, 23, 179–192. [Google Scholar] [CrossRef] [PubMed]
- Bellisle, F.; Dalix, A.M.; Mennen, L.; Galan, P.; Hercberg, S.; de Castro, J.M.; Gausseres, N. Contribution of snacks and meals in the diet of French adults: A diet-diary study. Physiol. Behav. 2003, 79, 183–189. [Google Scholar] [CrossRef]
- Alexy, U.; Wicher, M.; Kersting, M. Breakfast trends in children and adolescents: Frequency and quality. Publ. Health Nutr. 2010, 13, 1795–1802. [Google Scholar] [CrossRef] [PubMed]
- Bellisle, F.; Dalix, A.M.; Slama, G. Non food-related environmental stimuli induce increased meal intake in healthy women. Appetite 2004, 43, 175–180. [Google Scholar] [CrossRef] [PubMed]
- Blass, E.M.; Anderson, D.R.; Kirkorian, H.L.; Pempek, T.A.; Price, I.; Koleini, M.F. On the road to obesity: Television viewing increases intake of high-density foods. Physiol. Behav. 2006, 88, 597–604. [Google Scholar] [CrossRef] [PubMed]
- Matheson, K.; Killen, J.; Wang, Y.; Varady, A.; Robinson, T.N. Children’s food consumption during television viewing. Am. J. Clin. Nutr. 2004, 79, 1088–1094. [Google Scholar] [CrossRef] [PubMed]
- Robinson, T.N.; Banda, J.A.; Hale, L.; Lu, A.S.; Fleming-Milici, F.; Calvert, S.L.; Wartella, E. Screen media exposure an dobesity in children and adolescents. Pediatrics 2017, 140 (Suppl. 2), 97. [Google Scholar] [CrossRef]
- Wehling, H.; Lusher, J. People with a body mass index ≥ 30 under-report their dietary intake: A systematic review. J. Health Psychol. 2017. [Google Scholar] [CrossRef] [PubMed]


| Total Population (n = 1727) | Children (6–12 years) (n = 405) | Adolescents (13–17 years) (n = 285) | Younger Adults (18–54 years) (n = 634) | Older Adults (55 years and above) (n = 403) | ANCOVA, Adjusted for Daily Total Energy Intake p-Value for Population Effect | |||||||||||||||||
|---|---|---|---|---|---|---|---|---|---|---|---|---|---|---|---|---|---|---|---|---|---|---|
| Breakfast Intake | Daily Intake | Breakfast Intake | Daily Intake | Breakfast Intake | Daily Intake | Breakfast Intake | Daily Intake | Breakfast Intake | Daily Intake | |||||||||||||
| Mean | SD | Mean | SD | Mean | SD | Mean | SD | Mean | SD | Mean | SD | Mean | SD | Mean | SD | Mean | SD | Mean | SD | Breakfast Intakes | Daily Intakes | |
| Quantity (g) | 430.2 | 195.7 | 2286.1 | 754.2 | 324.2 a | 108.9 | 1719.2 a | 452.4 | 372.5 a | 142.2 | 1935.7 b | 613.4 | 421.0 b | 206.3 | 2292.9 c | 795.0 | 485.9 c | 173.1 | 2495.2 d | 605.5 | <0.0001 | <0.0001 |
| Energy (kcal) | 339.4 | 186.4 | 1921.8 | 575.3 | 352.4 | 129.8 | 1656.4 a | 452.7 | 403.1 | 175.6 | 1937.9 a | 682.5 | 325.1 | 200.1 | 1948.6 b | 595.1 | 343.6 | 160.4 | 1950.0 c | 480.6 | 0.097 | <0.0001 |
| Energy without alcohol (kcal) | 339.4 | 186.5 | 1865.3 | 556.6 | 352.4 | 129.8 | 1656.1 a | 452.5 | 403.1 | 175.6 | 1934.7 a | 683.8 | 325.0 | 200.1 | 1891.9 a | 574.2 | 343.6 | 160.4 | 1861.7 b | 458.8 | 0.097 | 0.015 |
| Dietary fiber (g) | 2.6 | 2.0 | 16.6 | 6.1 | 2.3 | 1.3 | 13.3 a | 4.4 | 2.8 | 1.8 | 15.3 a | 6.0 | 2.4 | 2.0 | 16.0 b | 5.7 | 2.9 | 1.9 | 18.7 c | 5.6 | 0.918 | <0.0001 |
| Carbohydrates (g) | 52.6 | 30.3 | 217.0 | 72.3 | 54.4 | 20.7 | 206.5 a | 61.3 | 61.5 | 28.4 | 237.5 b | 94.7 | 50.1 | 32.5 | 219.2 c | 74.4 | 54.2 | 26.7 | 212.0 c | 60.9 | 0.274 | 0.014 |
| Carbohydrates (% energy wa) | 61.2 | 16.6 | 45.8 | 8.7 | 61.1 a | 11.3 | 49.2 a | 6.8 | 60.4 a, c | 13.9 | 47.9 b | 9.4 | 60.3 b,c | 18.2 | 45.2 c | 9.5 | 62.8 d,e | 14.4 | 45.4 d | 6.7 | <0.0001 | <0.0001 |
| Simple sugars (g) | 25.2 | 16.0 | 81.6 | 38.0 | 30.7 a | 12.3 | 90.0 a | 32.2 | 34.5 a | 15.6 | 96.6 a | 43.6 | 24.4 b | 17.0 | 81.2 b | 41.5 | 21.9 b | 13.2 | 74.8 c | 27.2 | 0.008 | <0.0001 |
| Free sugars (g) | 17.6 | 12.6 | 49.3 | 31.3 | 21.0 a | 10.0 | 59.6 a | 25.2 | 24.4 a | 13.6 | 67.0 b | 37.8 | 17.4 b | 13.1 | 51.6 c | 33.3 | 14.7 c | 10.4 | 36.7 d | 19.7 | 0.032 | <0.0001 |
| Free sugars (% energy wa) | 22.9 | 17.9 | 10.3 | 5.5 | 23.9 | 9.8 | 14.1 a | 4.4 | 24.9 | 14.1 | 13.4 b | 5.3 | 24.3 | 20.1 | 10.5 c | 5.7 | 19.4 | 16.0 | 8.0 d | 4.0 | 0.257 | <0.0001 |
| Added sugars (g) | 13.8 | 10.7 | 42.9 | 28.4 | 16.6 a | 8.9 | 51.0 a | 23.4 | 18.3 a | 12.0 | 56.4 b | 32.0 | 13.4 b | 10.9 | 45.0 c | 31.1 | 12.3 b | 9.4 | 32.9 d | 18.4 | 0.019 | <0.0001 |
| Aded sugars (% energy wa) | 18.3 | 16.7 | 9.0 | 5.0 | 18.4 | 7.2 | 12.0 a | 4.0 | 17.5 | 8.6 | 11.3 b | 4.8 | 19.1 | 18.7 | 9.1 b,c | 5.2 | 16.8 | 15.7 | 7.2 c | 3.7 | 0.152 | <0.0001 |
| Proteins (g) | 9.3 | 5.9 | 81.5 | 26.0 | 10.5 | 4.4 | 67.1 | 19.3 | 11.9 | 6.0 | 80.5 | 30.0 | 8.9 | 6.6 | 83.0 | 26.7 | 9.1 | 4.7 | 84.1 | 22.5 | 0.286 | 0.140 |
| Proteins (% energy wa) | 11.8 | 10.0 | 17.4 | 3.9 | 11.7 | 3.4 | 16.2 a,b | 3.0 | 11.6 | 4.0 | 16.4 a | 3.9 | 11.9 | 11.2 | 17.3 b | 4.2 | 12.0 | 10.3 | 18.1 a,b | 3.0 | 0.908 | <0.0001 |
| Fat (g) | 10.2 | 7.6 | 74.6 | 26.4 | 10.3 | 5.2 | 62.4 a | 18.9 | 12.1 | 7.3 | 73.6 a | 27.0 | 9.9 | 7.7 | 75.9 a | 26.8 | 10.0 | 7.0 | 75.3 b | 23.5 | 0.109 | 0.045 |
| Fat (% energy wa) | 25.5 | 12.4 | 35.3 | 7.2 | 26.2 a | 9.5 | 33.5 a | 5.3 | 26.0 a | 10.8 | 33.6 a | 7.3 | 25.5 a | 12.9 | 35.1 a | 7.9 | 24.9 a | 11.6 | 36.2 a | 5.9 | 0.010 | <0.0001 |
| SFA (g) | 5.1 | 4.4 | 29.6 | 12.2 | 5.1 | 2.9 | 25.6 a,c | 8.2 | 5.8 | 3.4 | 29.5 a | 11.6 | 5.0 | 4.5 | 29.9 a,c | 11.7 | 5.0 | 4.4 | 29.8 b,c | 12.6 | 0.256 | <0.0001 |
| SFA (% energy wa) | 12.5 | 7.4 | 14.0 | 3.6 | 13.1 a | 5.7 | 13.8 a | 2.6 | 12.6 a | 5.5 | 13.5 a | 3.4 | 12.6 a | 7.6 | 13.8 a | 3.8 | 12.3 a | 7.5 | 14.2 a | 3.3 | 0.011 | <0.0001 |
| MUFA (g) | 2.9 | 2.2 | 24.6 | 9.2 | 3.2 | 1.7 | 20.6 a | 6.5 | 3.9 | 2.6 | 24.4 a | 9.5 | 2.8 | 2.2 | 25.1 b | 9.5 | 2.7 | 1.8 | 24.7 c | 7.8 | 0.058 | 0.018 |
| PUFA (g) | 1.1 | 1.0 | 9.6 | 4.7 | 0.9 | 0.6 | 7.3 | 3.0 | 1.1 | 0.9 | 8.7 | 4.1 | 1.0 | 0.9 | 9.6 | 4.4 | 1.2 | 1.1 | 10.2 | 4.8 | 0.619 | 0.452 |
| Water (g) | 351.8 | 177.7 | 1868.2 | 677.4 | 243.5 a | 89.1 | 1354.0 a | 378.1 | 280.3 a | 113.7 | 1510.3 a | 495.5 | 346.1 b | 185.7 | 1870.6 b | 708.1 | 405.5 c | 160.5 | 2070.5 b | 558.5 | <0.0001 | <0.0001 |
| Total Population (n = 1727) | Children (6–12 years) (n = 405) | Adolescents (13–17 years) (n = 285) | Younger Adults (18–54 years) (n = 634) | Older Adults (55 years and above) (n = 403) | ANCOVA, Adjusted for Daily Total Energy Intake p-Value for Population Effect | |||||||||||||||||
|---|---|---|---|---|---|---|---|---|---|---|---|---|---|---|---|---|---|---|---|---|---|---|
| Breakfast Intake | Daily Intake | Breakfast Intake | Daily Intake | Breakfast Intake | Daily Intake | Breakfast Intake | Daily Intake | Breakfast Intake | Daily Intake | |||||||||||||
| Mean | SD | Mean | SD | Mean | SD | Mean | SD | Mean | SD | Mean | SD | Mean | SD | Mean | SD | Mean | SD | Mean | SD | Breakfast Intakes | Daily Intakes | |
| Vitamin B1 (mg) | 0.2 | 0.2 | 1.1 | 0.4 | 0.3 | 0.2 | 1.1 a | 0.4 | 0.4 | 0.3 | 1.2 a,c | 0.7 | 0.2 | 0.3 | 1.1 b | 0.5 | 0.2 | 0.2 | 1.1 b,c | 0.3 | 0.409 | <0.0001 |
| Vitamin B2 (mg) | 0.4 | 0.4 | 1.6 | 0.6 | 0.6 | 0.3 | 1.5 a | 0.5 | 0.6 | 0.5 | 1.7 a,b | 0.9 | 0.4 | 0.4 | 1.5 c | 0.7 | 0.3 | 0.2 | 1.6 c,b | 0.5 | 0.360 | <0.0001 |
| Vitamin B3 (mg) | 2.8 | 3.0 | 17.3 | 7.2 | 3.3 | 2.5 | 14.0 a | 5.5 | 3.7 | 3.8 | 16.9 a | 8.9 | 2.9 | 3.2 | 18.0 b | 7.6 | 2.5 | 2.5 | 17.3 b | 5.9 | 0.994 | 0.0007 |
| Vitamin B5 (mg) | 1.0 | 0.9 | 4.2 | 1.7 | 1.5 | 0.9 | 4.1 a | 1.4 | 1.7 | 1.4 | 4.7 a | 2.9 | 1.0 | 1.0 | 4.2 b | 1.6 | 0.8 | 0.5 | 4.2 a,b | 1.4 | 0.274 | <0.0001 |
| Vitamin B6 (mg) | 0.3 | 0.3 | 1.6 | 0.6 | 0.4 | 0.3 | 1.5 a | 0.5 | 0.5 | 0.5 | 1.7 a | 1.0 | 0.3 | 0.3 | 1.6 a,b | 0.6 | 0.2 | 0.2 | 1.6 b | 0.5 | 0.368 | <0.0001 |
| Vitamin B9 (ug) | 46.4 | 39.4 | 251.4 | 99.0 | 58.2 | 30.2 | 217.5 a | 71.9 | 67.1 | 47.6 | 244.2 a | 129.4 | 46.6 | 41.7 | 242.6 a | 97.8 | 38.6 | 29.6 | 276.9 b | 85.7 | 0.472 | <0.0001 |
| Vitamin B12 (ug) | 0.4 | 0.4 | 5.4 | 5.3 | 0.6 | 0.3 | 3.7 | 2.3 | 0.6 | 0.5 | 4.4 | 4.2 | 0.4 | 0.5 | 4.9 | 3.7 | 0.3 | 0.3 | 6.7 | 6.6 | 0.239 | 0.532 |
| Vitamin E (mg) | 1.1 | 1.1 | 7.4 | 4.0 | 1.3 | 0.8 | 6.3 | 2.5 | 1.6 | 1.4 | 7.1 | 3.5 | 1.0 | 0.9 | 7.3 | 3.9 | 1.1 | 1.2 | 7.7 | 4.2 | 0.893 | 0.147 |
| Vitamin D (ug) | 0.2 | 0.3 | 2.4 | 1.7 | 0.2 | 0.2 | 1.7 | 1.0 | 0.2 | 0.4 | 2.1 | 1.6 | 0.2 | 0.4 | 2.5 | 1.9 | 0.2 | 0.2 | 2.6 | 1.4 | 0.819 | 0.602 |
| Vitamin C (mg) | 20.3 | 30.0 | 86.3 | 55.8 | 22.0 | 22.7 | 78.2 a | 41.9 | 28.9 | 35.5 | 82.8 a | 72.7 | 21.4 | 30.7 | 79.3 b | 53.0 | 15.3 | 24.1 | 99.5 c | 50.1 | 0.806 | <0.0001 |
| Vitamin A (ug) | 78.2 | 80.8 | 824.4 | 863.3 | 70.3 | 43.2 | 551.0 | 415.7 | 79.6 | 53.4 | 615.9 | 684.6 | 75.3 | 84.6 | 751.6 | 676.4 | 82.3 | 77.5 | 1021.3 | 995.0 | 0.251 | 0.473 |
| Retinol (ug) | 63.9 | 65.4 | 563.4 | 841.5 | 59.7 | 38.3 | 343.2 | 361.4 | 66.4 | 48.9 | 402.8 | 609.2 | 59.4 | 61.4 | 506.9 | 687.0 | 70.3 | 73.5 | 705.8 | 974.1 | 0.341 | 0.503 |
| Beta-carotene (ug) | 129.1 | 337.4 | 2326.5 | 1870.0 | 114.3 | 185.6 | 1710.0 a | 1265.0 | 143.6 | 252.3 | 1808.4 a | 2145.3 | 134.9 | 365.8 | 2159.7 a | 1811.0 | 107.6 | 226.3 | 2925.1 b | 1645.6 | 0.170 | 0.001 |
| Calcium (mg) | 219.0 | 158.0 | 910.2 | 361.9 | 285.1 | 133.0 | 844.2 a | 271.1 | 315.1 | 177.9 | 926.7 a | 428.3 | 208.9 | 169.5 | 896.8 b | 387.5 | 193.6 | 116.4 | 939.1 a | 275.2 | 0.126 | <0.0001 |
| Iron (mg) | 2.1 | 2.051 | 11.5 | 4.7 | 3.0 | 1.8 | 10.1 | 3.6 | 3.4 | 2.4 | 11.8 | 5.5 | 2.1 | 2.1 | 11.5 | 4.6 | 1.8 | 1.7 | 12.0 | 4.6 | 0.522 | 0.089 |
| Zinc (mg) | 1.2 | 0.9 | 9.6 | 3.5 | 1.3 | 0.7 | 7.8 a | 2.7 | 1.5 | 1.0 | 9.3 a,c | 4.3 | 1.2 | 1.0 | 9.6 b,c | 3.4 | 1.2 | 0.9 | 10.0 d | 3.2 | 0.563 | 0.0001 |
| Sodium (mg) | 366.3 | 269.8 | 2911.6 | 1030.6 | 299.1 | 141.6 | 2237.0 | 743.7 | 347.9 | 218.6 | 2596.3 | 1015.8 | 339.3 | 270.5 | 2926.5 | 1023.3 | 439.3 | 274.4 | 3149.3 | 933.1 | 0.284 | 0.212 |
| Iodine (ug) | 21.7 | 18.5 | 120.9 | 68.1 | 27.9 | 13.9 | 104.4 a | 37.8 | 31.6 | 18.6 | 117.1 a | 53.4 | 21.1 | 18.9 | 118.2 a | 53.7 | 18.1 | 15.9 | 130.3 b | 84.7 | 0.144 | 0.0003 |
| Manganese (mg) | 0.7 | 0.9 | 2.7 | 1.7 | 0.5 | 0.7 | 2.0 | 1.2 | 0.7 | 1.0 | 2.4 | 1.6 | 0.7 | 0.9 | 2.6 | 1.4 | 0.9 | 1.0 | 3.0 | 2.0 | 0.372 | 0.254 |
| Phosphorus (mg) | 196.8 | 140.9 | 1163.1 | 374.5 | 253.9 | 120.6 | 1042.4 a | 296.4 | 287.4 | 150.9 | 1199.7 a | 445.6 | 191.8 | 153.9 | 1175.7 a | 399.3 | 167.9 | 98.4 | 1166.9 a | 289.8 | 0.070 | 0.038 |
| Potassium (mg) | 591.3 | 311.3 | 2751.3 | 903.2 | 551.1 | 227.1 | 2199.8 a | 620.7 | 638.4 | 295.1 | 2489.5 a | 847.5 | 582.6 | 318.8 | 2746.2 b | 929.7 | 609.7 | 289.4 | 2987.0 c | 748.0 | 0.237 | 0.002 |
| Magnesium (mg) | 68.0 | 45.9 | 298.9 | 108.6 | 61.7 | 31.3 | 233.4 a | 68.2 | 70.5 | 40.0 | 267.1 a | 96.8 | 69.4 | 52.0 | 305.5 b | 115.1 | 69.6 | 40.2 | 317.8 c | 93.6 | 0.103 | 0.002 |
| Copper (mg) | 0.6 | 0.6 | 2.0 | 1.5 | 0.2 a | 0.1 | 1.1 a | 0.6 | 0.2 a | 0.2 | 1.2 a | 1.0 | 0.6 b | 0.5 | 2.0 b | 1.4 | 0.7 c | 0.5 | 2.4 c | 1.5 | 0.0003 | 0.027 |
| Selenium (ug) | 13.3 | 9.6 | 81.7 | 36.9 | 6.1 a | 3.8 | 57.6 a | 23.5 | 6.9 a | 5.0 | 65.3 a | 27.3 | 13.0 b | 9.7 | 81.3 b | 36.0 | 17.2 c | 8.3 | 91.5 c | 33.1 | <0.0001 | <0.0001 |
| % of Consumers | Energy | Fiber | CHO | Simple Sugars | Free Sugars | Added Sugars | Proteins | Fat | SFA | MUFA | PUFA | B1 | B2 | B3 | B5 | B6 | B9 | B12 | Vitamin E | Vitamin D | Vitamin C | Vitamin A | Calcium | Iron | Zinc | Sodium | Manganese | phosphorus | potassium | Magnesium | Copper | Selenium | |
|---|---|---|---|---|---|---|---|---|---|---|---|---|---|---|---|---|---|---|---|---|---|---|---|---|---|---|---|---|---|---|---|---|---|
| Children & Adolescents (6–17 years) | |||||||||||||||||||||||||||||||||
| Milk | 80.2 | 21.2 | 0.0 | 14.4 | 24.1 | 0.0 | 0.0 | 50.4 | 24.2 | 29.9 | 24.4 | 9.2 | 18.9 | 50.6 | 4.4 | 35.6 | 18.4 | 7.6 | 60.5 | 3.9 | 9.9 | 0.5 | 50.0 | 61.7 | 2.5 | 46.9 | 22.9 | 1.0 | 57.9 | 47.6 | 35.5 | 8.2 | 24.9 |
| Hot Beverages | 53.8 | 7.7 | 20.1 | 10.4 | 13.6 | 19.7 | 25.2 | 4.6 | 2.9 | 3.2 | 2.5 | 1.5 | 10.1 | 3.0 | 11.8 | 3.3 | 10.3 | 9.2 | 0.2 | 18.3 | 0.0 | 0.4 | 0.3 | 3.5 | 27.7 | 4.5 | 1.3 | 8.0 | 6.1 | 11.3 | 14.9 | 16.7 | 13.0 |
| Fruit Juices | 49.3 | 6.0 | 6.1 | 9.0 | 15.1 | 22.1 | 0.4 | 2.8 | 0.4 | 0.2 | 0.4 | 2.4 | 8.9 | 2.2 | 6.3 | 5.6 | 6.9 | 19.0 | 0.0 | 5.1 | 0.8 | 72.7 | 6.3 | 6.0 | 1.4 | 1.1 | 0.7 | 6.0 | 2.4 | 14.0 | 7.8 | 6.2 | 9.6 |
| Breads & toasts | 55.3 | 11.3 | 24.7 | 14.4 | 1.5 | 0.8 | 1.0 | 12.3 | 3.8 | 2.1 | 3.5 | 11.7 | 5.6 | 1.9 | 8.3 | 3.9 | 3.7 | 6.1 | 2.8 | 3.1 | 3.4 | 0.0 | 0.2 | 3.1 | 14.7 | 18.5 | 30.0 | 46.7 | 6.9 | 4.7 | 13.3 | 15.5 | 8.0 |
| >wholegrain | 3.2 | 0.3 | 1.1 | 0.4 | 0.1 | 0.0 | 0.1 | 0.4 | 0.1 | 0.1 | 0.2 | 0.5 | 0.3 | 0.1 | 0.7 | 0.2 | 0.3 | 0.3 | 0.1 | 0.2 | 0.1 | 0.0 | 0.0 | 0.2 | 1.0 | 1.2 | 0.8 | 3.9 | 0.4 | 0.2 | 0.8 | 1.0 | 0.3 |
| Breakfast cereals | 54.4 | 14.7 | 20.3 | 19.2 | 13.0 | 18.4 | 23.5 | 7.9 | 7.2 | 6.1 | 7.7 | 12.5 | 47.2 | 31.1 | 61.1 | 40.9 | 51.9 | 39.1 | 19.8 | 19.7 | 7.5 | 21.5 | 0.1 | 10.5 | 33.0 | 9.4 | 14.3 | 13.2 | 7.2 | 7.4 | 9.3 | 13.9 | 9.0 |
| >wholegrain | 27.8 | 6.1 | 9.5 | 8.0 | 5.5 | 8.0 | 10.2 | 3.2 | 2.9 | 2.9 | 3.0 | 3.9 | 19.7 | 13.0 | 25.6 | 16.6 | 21.8 | 16.5 | 8.3 | 5.4 | 1.7 | 11.7 | 0.0 | 4.5 | 14.0 | 4.1 | 5.9 | 6.8 | 3.1 | 3.6 | 4.3 | 5.9 | 6.1 |
| Viennoiseries | 49.4 | 12.3 | 6.7 | 9.5 | 3.3 | 4.4 | 5.7 | 8.6 | 20.2 | 18.5 | 15.6 | 16.9 | 3.1 | 2.6 | 3.3 | 4.2 | 2.3 | 9.8 | 4.3 | 11.6 | 19.0 | 0.1 | 11.7 | 3.8 | 6.0 | 5.8 | 17.2 | 8.0 | 4.5 | 3.3 | 3.9 | 10.4 | 11.3 |
| Sugar & Sweets | 64.1 | 8.8 | 8.4 | 9.0 | 14.6 | 20.5 | 26.2 | 3.0 | 11.0 | 7.9 | 17.0 | 13.5 | 1.7 | 2.3 | 1.8 | 1.4 | 2.2 | 1.8 | 2.1 | 18.3 | 1.8 | 0.4 | 0.6 | 2.0 | 6.4 | 3.5 | 1.1 | 7.8 | 3.2 | 4.0 | 6.2 | 11.1 | 3.3 |
| Fresh Dairy | 13.1 | 1.4 | 0.1 | 1.3 | 2.0 | 1.0 | 1.3 | 2.1 | 1.3 | 1.6 | 1.0 | 0.4 | 0.4 | 1.8 | 0.2 | 0.9 | 0.4 | 1.1 | 2.1 | 0.2 | 5.3 | 0.1 | 1.2 | 2.5 | 0.2 | 1.7 | 0.9 | 0.3 | 2.0 | 1.3 | 0.8 | 0.5 | 1.6 |
| Fats & Oils | 32.7 | 2.7 | 0.0 | 0.0 | 0.0 | 0.0 | 0.0 | 0.1 | 10.0 | 12.5 | 8.0 | 7.2 | 0.1 | 0.1 | 0.0 | 0.1 | 0.0 | 0.1 | 0.2 | 4.9 | 6.3 | 0.0 | 14.3 | 0.1 | 0.1 | 0.2 | 1.0 | 0.3 | 0.1 | 0.1 | 0.1 | 0.9 | 0.7 |
| Fruit | 9.1 | 0.4 | 2.2 | 0.6 | 1.0 | 0.0 | 0.0 | 0.2 | 0.1 | 0.0 | 0.0 | 0.3 | 0.3 | 0.2 | 0.3 | 0.4 | 0.9 | 1.2 | 0.0 | 1.0 | 0.0 | 2.7 | 0.7 | 0.1 | 0.2 | 0.2 | 0.1 | 1.2 | 0.2 | 1.2 | 0.7 | 1.2 | 0.8 |
| Total | 86.4 | 88.5 | 87.8 | 88.2 | 87.0 | 83.3 | 92.0 | 80.8 | 81.9 | 80.1 | 75.5 | 96.1 | 95.8 | 97.5 | 96.3 | 97.2 | 94.9 | 92.1 | 85.9 | 54.0 | 98.2 | 85.4 | 93.6 | 92.1 | 91.6 | 89.5 | 92.4 | 90.6 | 94.8 | 92.5 | 84.6 | 82.1 | |
| Adults (18 years +) | |||||||||||||||||||||||||||||||||
| Milk | 48.6 | 10.6 | 0.0 | 7.1 | 14.9 | 0.0 | 0.0 | 28.2 | 11.7 | 14.1 | 13.4 | 3.8 | 15.4 | 39.2 | 2.5 | 27.7 | 16.2 | 4.9 | 49.7 | 2.3 | 4.1 | 0.4 | 20.7 | 41.2 | 1.8 | 25.7 | 8.8 | 0.3 | 38.8 | 21.6 | 15.1 | 1.1 | 5.0 |
| Hot Beverages | 89.4 | 4.3 | 11.7 | 4.6 | 6.2 | 7.3 | 9.2 | 6.3 | 2.7 | 2.1 | 2.2 | 1.4 | 8.8 | 17.6 | 39.5 | 16.7 | 6.2 | 6.6 | 2.2 | 7.7 | 0.1 | 0.6 | 1.8 | 19.6 | 18.2 | 11.5 | 2.5 | 20.3 | 8.5 | 41.1 | 41.6 | 75.6 | 67.5 |
| Fruit Juices | 33.1 | 4.5 | 3.9 | 6.7 | 13.9 | 20.2 | 0.4 | 2.5 | 0.3 | 0.1 | 0.4 | 1.5 | 11.2 | 2.6 | 5.3 | 6.9 | 8.9 | 20.3 | 0.0 | 5.5 | 0.3 | 68.9 | 6.3 | 6.1 | 1.6 | 1.0 | 0.5 | 4.0 | 2.7 | 10.0 | 5.4 | 1.5 | 3.0 |
| Bread & Toasts | 68.5 | 29.2 | 49.2 | 37.6 | 4.3 | 1.3 | 1.6 | 34.4 | 7.8 | 3.6 | 7.7 | 23.8 | 21.6 | 6.5 | 19.5 | 13.1 | 16.9 | 21.8 | 9.0 | 10.0 | 11.9 | 0.1 | 0.3 | 10.0 | 38.8 | 36.7 | 58.4 | 54.3 | 21.7 | 10.3 | 21.0 | 8.8 | 7.6 |
| >wholegrain | 8.6 | 1.7 | 5.0 | 2.0 | 0.4 | 0.3 | 0.4 | 2.1 | 0.8 | 0.4 | 1.0 | 2.1 | 1.7 | 0.6 | 3.4 | 1.2 | 2.2 | 1.3 | 0.3 | 1.2 | 0.2 | 0.0 | 0.0 | 1.0 | 6.8 | 6.6 | 3.1 | 13.8 | 2.3 | 0.9 | 3.5 | 1.2 | 0.7 |
| Breakfast cereals | 16.0 | 4.9 | 7.4 | 6.2 | 4.6 | 6.5 | 8.1 | 3.5 | 2.6 | 2.3 | 3.0 | 4.0 | 26.6 | 16.8 | 24.0 | 18.8 | 31.8 | 17.6 | 11.2 | 7.0 | 3.8 | 10.1 | 0.0 | 3.4 | 16.8 | 4.3 | 4.9 | 4.8 | 3.5 | 2.1 | 3.0 | 2.6 | 1.3 |
| >wholegrain | 10.5 | 3.1 | 5.2 | 3.7 | 2.8 | 4.0 | 5.0 | 2.3 | 2.0 | 1.9 | 2.2 | 2.8 | 16.8 | 10.6 | 15.1 | 10.6 | 20.1 | 11.1 | 7.1 | 4.5 | 1.2 | 7.3 | 0.0 | 1.8 | 11.0 | 3.2 | 3.2 | 3.7 | 2.5 | 1.5 | 2.1 | 1.4 | 1.1 |
| Viennoiseries | 37.2 | 11.2 | 6.2 | 8.5 | 3.5 | 4.6 | 5.7 | 8.4 | 18.6 | 17.7 | 15.8 | 12.1 | 4.7 | 3.5 | 3.0 | 5.2 | 3.6 | 11.6 | 5.7 | 12.3 | 22.0 | 0.1 | 9.2 | 4.3 | 7.1 | 5.6 | 11.9 | 5.2 | 5.2 | 2.5 | 2.9 | 2.5 | 3.4 |
| Sugar & Sweets | 76.2 | 11.7 | 5.5 | 17.3 | 36.1 | 49.1 | 61.3 | 1.5 | 2.8 | 2.1 | 4.5 | 3.1 | 1.1 | 1.4 | 1.1 | 1.1 | 2.5 | 1.3 | 0.8 | 5.4 | 0.2 | 1.4 | 0.8 | 1.4 | 3.9 | 1.6 | 0.5 | 1.8 | 1.5 | 2.1 | 2.0 | 1.5 | 0.5 |
| Fresh Dairy | 12.1 | 1.6 | 0.2 | 1.1 | 2.1 | 1.3 | 1.7 | 4.2 | 1.9 | 2.2 | 1.7 | 0.6 | 1.4 | 4.6 | 0.4 | 2.8 | 1.6 | 3.3 | 6.2 | 0.6 | 6.5 | 0.2 | 1.9 | 5.2 | 0.5 | 3.0 | 1.0 | 0.2 | 4.3 | 1.8 | 1.2 | 0.2 | 1.0 |
| Fats & Oils | 51.6 | 9.2 | 0.0 | 0.1 | 0.1 | 0.0 | 0.0 | 0.5 | 33.8 | 39.5 | 31.6 | 26.8 | 0.7 | 0.4 | 0.1 | 0.4 | 0.2 | 0.3 | 1.4 | 28.2 | 19.6 | 0.1 | 40.3 | 0.4 | 0.6 | 0.8 | 2.7 | 1.0 | 0.5 | 0.2 | 0.2 | 1.3 | 1.1 |
| Fruit | 14.3 | 1.7 | 7.7 | 2.4 | 4.7 | 0.0 | 0.0 | 1.0 | 0.3 | 0.1 | 0.1 | 1.2 | 2.1 | 1.1 | 1.2 | 2.3 | 5.7 | 5.6 | 0.0 | 5.7 | 0.0 | 13.7 | 2.7 | 0.9 | 1.0 | 0.9 | 0.3 | 2.6 | 1.2 | 3.8 | 2.2 | 1.3 | 1.3 |
| Total | 89.0 | 91.7 | 91.6 | 90.5 | 90.3 | 87.8 | 90.6 | 82.4 | 83.8 | 80.6 | 78.3 | 93.5 | 93.5 | 96.5 | 95.1 | 93.7 | 93.2 | 86.3 | 84.7 | 68.6 | 95.5 | 84.0 | 92.3 | 90.3 | 91.0 | 91.6 | 94.7 | 87.8 | 95.6 | 94.5 | 96.4 | 91.6 | |
| Children and Adolescents (6–17 years) | Adults (18 years +) | |||||||||||
|---|---|---|---|---|---|---|---|---|---|---|---|---|
| T1 (n = 231; nw = 221) | T2 (n = 213; nw = 224) | T3 (n = 222; nw = 234) | Model A * | Model B * | T1 (n = 322; nw = 332) | T2 (n = 338; nw = 338) | T3 (n = 364; nw = 351) | Model A ** | Model C ** | |||
| p-Value | p-Value Model | p-Value for Tertiles Effect | p-Value for Tertiles Effect | p-Value Model | p-Value for Tertiles Effect | |||||||
| NRF 9.3 | 558.1 (45.9) a | 638.6 (17.2) b | 713.9 (35.9) c | <0.001 | 0.001 | <0.001 | 579.3 (55.2) a | 677.7 (18.9) b | 757.6 (33.5) c | <0.001 | <0.001 | <0.001 |
| Quantity (g) | 320 (116.1) a | 361.3 (111.5) b | 365.2 (121.1) b | <0.001 | 0.048 | <0.001 | 413.4 (180.5) a | 452.0 (203.2) b | 492.0 (173.8) c | <0.001 | <0.001 | 0.001 |
| Energy (kcal) | 365 (144.7) | 387.5 (132.7) | 383.8 (153.9) | 0.213 | 0.048 | 0.103 | 325.8 (203.2) | 343.0 (181.6) | 343.2 (157.9) | 0.356 | 0.231 | 0.377 |
| Energy wa (kcal) | 365 (144.7) | 387.4 (132.7) | 383.7 (153.9) | 0.213 | 0.001 | 0.103 | 325.7 (203.2) | 343.0 (181.7) | 343.2 (157.9) | 0.357 | 0.233 | 0.378 |
| Dietary fiber (g) | 2.2 (1.3) a | 2.5 (1.2) b | 2.8 (1.8) c | <0.001 | 0.036 | <0.001 | 2.0 (1.7) a | 2.5 (1.9) b | 3.3 (2.1) c | <0.001 | <0.001 | <0.001 |
| Carbohydrates (g) | 55.1 (21.6) a | 59.7 (21.7) b | 59.7 (25.8) b | 0.053 | 0.760 | 0.026 | 49.0 (32.0) | 53.8 (30.6) | 54.6 (26.5) | 0.028 | 0.166 | 0.059 |
| Carbohydrates (% energy wa) | 61.4 (10.0) | 61.8 (8.6) | 61.8 (10.9) | 0.857 | 0.087 | 0.904 | 60.7 (17.8) | 62.3 (14.0) | 63.6 (13.0) | 0.043 | 0.090 | 0.172 |
| Simple sugars (g) | 32.4 (13.4) | 33.8 (12.2) | 32.9 (14.2) | 0.537 | 0.397 | 0.334 | 23.4 (16.1) | 24.0 (15.5) | 24.7 (14.7) | 0.525 | <0.001 | 0.083 |
| Free sugars (g) | 22.8 (11.4) | 23.2 (10.5) | 21.6 (11.5) | 0.296 | 0.121 | 0.343 | 17.1 (12.2) | 16.9 (12.5) | 15.4 (10.9) | 0.107 | <0.001 | 0.346 |
| Free sugars (% energy wa) | 26.2 (12.4) a | 24.4 (9.1) a,b | 22.8 (10.7) b | 0.003 | 0.031 | 0.002 | 26.4 (23.1) a | 21.9 (16.0) b | 19.5 (14.8) b | <0.001 | <0.001 | 0.001 |
| Added sugars (g) | 18.3 (10.6) | 18.1 (9.5) | 16.4 (9.8) | 0.087 | 0.002 | 0.225 | 14.2 (10.9) | 13.0 (9.6) | 12.4 (10.2) | 0.066 | 0.022 | 0.253 |
| Added sugars (% energy wa) | 19.7 (7.9) a | 18.5 (6.8) a | 16.7 (7.3) b | <0.001 | 0.001 | <0.001 | 22.5 (22.4) a | 17.1 (13.9) b | 16.0 (14.6) b | <0.001 | <0.001 | <0.001 |
| Proteins (g) | 10.3 (5.1) a | 11.5 (4.7) b | 11.8 (5.0) b | 0.004 | 0.006 | <0.001 | 8.3 (6.1) a | 9.1 (5.6) b | 9.9 (5.5) c | 0.002 | 0.036 | 0.001 |
| Proteins (% energy wa) | 11.2 (3.6) a | 11.9 (3.1) b | 12.4 (3.2) b | <0.001 | 0.142 | <0.001 | 12.2 (13.8) | 11.9 (10.2) | 12.2 (8.0) | 0.879 | 0.626 | 0.796 |
| Fat (g) | 11.5 (6.3) | 11.4 (6.0) | 10.8 (5.8) | 0.439 | 0.520 | 0.578 | 10.7 (9.0) | 10.1 (6.6) | 9.5 (6.5) | 0.077 | 0.015 | 0.134 |
| Fat (% energy wa) | 27.5 (9.4) | 26.3 (8.6) | 25.8 (10.4) | 0.149 | 0.328 | 0.131 | 27.1 (13.7) a | 25.8 (11.6) a,b | 24.2 (10.7) b | 0.008 | 0.024 | 0.037 |
| SFA (g) | 5.4 (2.9) | 5.6 (3.2) | 5.4 (3.0) | 0.855 | 0.690 | 0.793 | 5.5 (5.9) a | 5.1 (3.7) a | 4.5 (3.5) b | 0.013 | 0.015 | 0.015 |
| SFA (% energy wa) | 13.1 (5.0) | 12.9 (4.6) | 13.2 (6.6) | 0.830 | 0.091 | 0.855 | 13.6 (8.6) a | 13.0 (7.2) a | 11.5 (6.3) b | 0.001 | 0.011 | 0.002 |
| MUFA (g) | 3.7 (2.3) | 3.6 (2) | 3.3 (1.8) | 0.078 | 0.203 | 0.209 | 3 (2.3) | 2.8 (1.9) | 2.7 (1.9) | 0.131 | 0.001 | 0.635 |
| MUFA (% energy wa) | 8.7 (3.2) a | 8.3 (3.1) a | 7.8 (3.1) b | 0.005 | 0.043 | 0.009 | 7.7 (4.0) | 7.2 (3.4) | 6.9 (3.4) | 0.016 | <0.001 | 0.433 |
| PUFA (g) | 1.1 (0.8) | 1.0 (0.7) | 1.0 (0.7) | 0.587 | 0.127 | 0.713 | 1.0 (1.0) a | 1.0 (0.9) a | 1.2 (1.2) b | 0.008 | 0.001 | 0.028 |
| PUFA (% energy wa) | 2.5 (1.3) | 2.3 (1.3) | 2.2 (1.1) | 0.075 | 0.001 | 0.079 | 2.5 (2.1) a | 2.5 (1.7) a | 3.1 (2.2) b | <0.001 | 0.009 | 0.002 |
| Water (g) | 237.8 (94.1) a | 272.6 (92.1) b | 276.2 (97.6) b | <0.001 | 0.037 | <0.001 | 339.9 (162.7) a | 372.5 (188.0) b | 410.5 (160.0) c | <0.001 | <0.001 | 0.002 |
| Vitamin B1 (mg) | 0.3 (0.2) a | 0.4 (0.3) b | 0.4 (0.3) b | 0.006 | 0.015 | 0.001 | 0.22 (0.21) a | 0.19 (0.2) a | 0.19 (0.21) b | 0.002 | <0.001 | <0.001 |
| Vitamin B2 (mg) | 0.5 (0.3) a | 0.6 (0.4) b | 0.6 (0.4) b | 0.006 | 0.039 | <0.001 | 0.3 (0.3) a | 0.3 (0.3) a | 0.4 (0.4) b | 0.002 | <0.001 | <0.001 |
| Vitamin B3 (mg) | 3.0 (2.5) a | 3.6 (3.3) b | 3.8 (3.2) b | 0.007 | 0.062 | 0.002 | 2.5 (2.9) a | 2.6 (2.5) a | 3.3 (3.2) b | <0.001 | <0.001 | <0.001 |
| Vitamin B5 (mg) | 1.4 (1.0) a | 1.7 (1.2) b | 1.7 (1.1) b | 0.007 | 0.061 | 0.002 | 0.9 (0.9) a | 0.9 (0.7) a | 1.0 (0.8) b | 0.036 | <0.001 | <0.001 |
| Vitamin B6 (mg) | 0.4 (0.3) a | 0.5 (0.4) b | 0.5 (0.4) b | 0.009 | 0.042 | 0.002 | 0.2 (0.3) a | 0.2 (0.2) a | 0.3 (0.3) b | <0.001 | <0.001 | <0.001 |
| Vitamin B9 (ug) | 55.8 (30.1) a | 65.9 (40.0) b | 66.5 (40.5) b | 0.003 | 0.019 | 0.001 | 38.2 (36.5) a | 44.8 (34.9) b | 49.3 (38.9) b | <0.001 | <0.001 | <0.001 |
| Vitamin B12 (ug) | 0.5 (0.4) a | 0.6 (0.4) b | 0.6 (0.4) b | 0.010 | 0.088 | 0.001 | 0.3 (0.4) a | 0.3 (0.3) a | 0.4 (0.4) b | 0.002 | <0.001 | <0.001 |
| Vitamin E (mg) | 1.6 (1.2) | 1.4 (1.1) | 1.3 (0.9) | 0.037 | 0.851 | 0.228 | 0.9 (1.0) a | 1.0 (1.0) a | 1.1 (1.1) b | 0.029 | 0.025 | 0.017 |
| Vitamin D (ug) | 0.2 (0.3) | 0.2 (0.3) | 0.2 (0.4) | 0.403 | 0.080 | 0.358 | 0.2 (0.3) | 0.2 (0.3) | 0.2 (0.3) | 0.713 | 0.124 | 0.390 |
| Vitamin C (mg) | 21.0 (25.0) a | 26.1 (27.9) a | 28.3 (31.6) b | 0.020 | 0.018 | 0.049 | 15.1 (27.5) a | 20.8 (31.7) b | 21.8 (25.2) b | 0.004 | <0.001 | <0.001 |
| Vitamin A (ug) | 68.0 (40.3) a | 77.3 (47.9) b | 80 (51.4) b | 0.016 | 0.012 | 0.003 | 75.6 (76.4) | 80.3 (86.3) | 81.6 (82.0) | 0.612 | 0.047 | 0.765 |
| Retinol (ug) | 56.3 (36.2) a | 65.7 (43.4) b | 67.9 (46.2) b | 0.008 | 0.441 | 0.002 | 64.9 (70.1) | 64.4 (57.0) | 64.6 (73.0) | 0.997 | 0.016 | 0.845 |
| Beta-carotene (ug) | 131.9 (234.7) | 120.8 (193.9) | 132 (210.7) | 0.815 | 0.001 | 0.903 | 106.0 (228.3) | 133.1 (424.3) | 138.9 (260.0) | 0.352 | 0.062 | 0.128 |
| Calcium (mg) | 272.1 (148.0) a | 312.2 (152) b | 320.1 (141.4) b | 0.001 | 0.011 | <0.001 | 187.2 (158.8) a | 202.2 (138.2) a | 227.8 (145.1) b | 0.001 | <0.001 | <0.001 |
| Iron (mg) | 2.9 (1.8) a | 3.3 (2.0) b | 3.5 (2.2) b | 0.014 | 0.010 | 0.005 | 1.7 (1.7) a | 1.8 (1.6) a | 2.5 (2.2) b | <0.001 | <0.001 | <0.001 |
| Zinc (mg) | 1.3 (0.7) a | 1.4 (0.7) b | 1.6 (0.9) c | <0.001 | 0.037 | <0.001 | 1.0 (0.8) a | 1.1 (0.8) b | 1.5 (1.1) b | <0.001 | <0.001 | <0.001 |
| Sodium (mg) | 290.4 (150.1) a | 329.5 (166.9) b | 350.3 (193.5) b | 0.001 | 0.008 | 0.001 | 346.2 (299.8) | 404.4 (283.9) | 400.3 (236.5) | 0.009 | 0.001 | 0.156 |
| Iodine (ug) | 27.8 (15.9) a | 30.3 (14.8) a,b | 31.3 (15.9) b | 0.056 | 0.020 | 0.004 | 19 (16.1) a | 20.1 (18.8) b | 21.7 (17.8) c | 0.135 | <0.001 | 0.004 |
| Manganese (mg) | 0.5 (0.6) a | 0.6 (0.7) a | 0.8 (1.1) b | 0.002 | 0.001 | 0.025 | 0.5 (0.6) a | 0.7 (0.8) a | 1.1 (1.2) b | <0.001 | <0.001 | <0.001 |
| Phosphorus (mg) | 250.5 (135.8) a | 283.3 (124.9) b | 280.5 (127.9) b | 0.013 | <0.001 | 0.001 | 176.4 (140.8) a | 178.9 (124.3) a | 200.2 (131.5) b | 0.035 | <0.001 | <0.001 |
| Potassium (mg) | 541.1 (251.9) a | 614.4 (234.4) b | 629.6 (252.7) b | <0.001 | 0.007 | <0.001 | 551.3 (280.8) a | 588.1 (307.2) a | 664.6 (299.8) b | <0.001 | 0.001 | <0.001 |
| Magnesium (mg) | 59.8 (33.6) a | 65.5 (28.4) b | 73.2 (38.7) c | <0.001 | 0.225 | <0.001 | 61.6 (46) a | 67.2 (41.8) a | 82.3 (49.7) b | <0.001 | <0.001 | <0.001 |
| Copper (mg) | 0.2 (0.1) | 0.2 (0.2) | 0.2 (0.2) | 0.052 | 0.878 | 0.107 | 0.6 (0.5) | 0.6 (0.6) | 0.7 (0.5) | 0.415 | <0.001 | 0.762 |
| Selenium (ug) | 6.3 (3.8) | 6.6 (4.3) | 6.7 (4.7) | 0.578 | <0.001 | 0.773 | 13.8 (9.3) | 14.4 (9.7) | 16.2 (8.7) | 0.002 | <0.001 | 0.342 |
| Children (6–17 years) | Adults (18 years +) | |||||||||||
|---|---|---|---|---|---|---|---|---|---|---|---|---|
| T1 (n = 231; nw = 221) | T2 (n = 213; nw = 224) | T3 (n = 222; nw = 234) | Model A * | Model B ** | T1 (n = 322; nw = 332) | T2 (n = 338; nw = 338) | T3 (n = 364; nw = 351) | Model A * | Model C *** | |||
| p-Value | p-Value Model | p-Value Tertiles Effect | p-Value | p-Value Model | p-Value Tertiles Effect | |||||||
| NRF 9.3 | 558.1 a (45.9) | 638.6 b (17.2) | 713.9 c (35.9) | <0.001 | 0.001 | <0.001 | 579.3 a (55.2) | 677.7 b (18.9) | 757.6 c (33.5) | <0.001 | <0.001 | <0.001 |
| Milk (mL) | 154.6 a (127.9) 75.8% | 179.6 b (128.0) 83.2% | 180.1 b (122.1) 85.0% | 0.051 | 0.002 | 0.003 | 78.7 a (117.5) 48.4% | 71.6 a (98.6) 47.9% | 83.9 b (108.4) 51.7% | 0.331 | 0.002 | 0.035 |
| Hot Beverages (mL) | 18.4 (39.7) 47.3% | 27.2 (61.3) 60.2% | 29.6 (67.7) 55.9% | 0.091 | 0.083 | 0.200 | 204.2 (177.5) 86.7% | 213.4 (179.5) 91.6% | 237.6 (157.4) 93.9% | 0.031 | 0.083 | 0.573 |
| Fruit Juices (mL) | 49.3 (72.2) 44.8% | 55.6 (75.0) 51.2% | 58.2 (81.5) 53.8% | 0.438 | 0.453 | 0.558 | 33.1 a (65.3) 29.2% | 46.4 b (82.9) 37.1% | 33.8 a,b (54.2) 34.5% | 0.017 | 0.453 | 0.005 |
| Breads & toasts (g) | 11.1 a (20.1) 44.1% | 14.9 a (23.5) 61.9% | 19.8 b (28.2) 61.8% | 0.001 | 0.001 | 0.005 | 26.0 a (37.0) 56.2% | 37.2 b (40.7) 70.9% | 38.7 b (33.9) 80.8% | <0.001 | 0.001 | 0.046 |
| >wholegrain | 0.2 (1.7) 1.6% | 0.2 (1.5) 2.7% | 1.0 (5.0) 5.2% | 0.013 | 0.036 | 0.157 | 0.8 a (5.7) 4.1% | 1.2 a (5.5) 6.4% | 4.2 b (14.6) 15.5% | <0.001 | 0.036 | <0.001 |
| Breakfast cereals (g) | 11.2 a (17.6) 48.1% | 15.8 b (22.5) 61.2% | 15.5 b (21.3) 56.2% | 0.028 | 0.201 | 0.021 | 4.1 a (14.5) 16.3% | 3.1 a (11.6) 12.7% | 7.4 b (19.4) 19.6% | 0.001 | 0.201 | <0.001 |
| >wholegrain | 3.7 a (9.0) 23.3% | 7.2 b (13.7) 33.0% | 6.8 b (16.0) 28.4% b | 0.009 | 0.147 | 0.021 | 2.2 a (9.7) 9.6% | 1.7 a (9.0) 7.5% | 5.5 b (17.1) 14.9% | <0.001 | 0.147 | <0.001 |
| Viennoiseries (g) | 13.8 (18.1) 56.0% | 10.6 (16.4) 51.5% | 10.6 (18.6) 43.4% | 0.080 | 0.485 | 0.129 | 11.4 a (21.5) 41.4% | 11.0 a (19.9) 40.7% | 6.2 b (12.4) 31.4% | <0.001 | 0.485 | 0.003 |
| Sugar & Sweets (g) | 8.8 (13.1) 59.7% | 8.4 (11.6) 68.7% | 6.9 (9.5) 66.7% | 0.174 | 0.844 | 0.077 | 12.6 (15.6) 78.7% | 13.0 (14.0) 77.7% | 13.3 (16.4) 75.9% | 0.806 | 0.844 | 0.313 |
| Fresh Dairy (g) | 7.0 (21.7) 14.7% | 5.2 (19.0) 10.7% | 7.2 (22.9) 14.4% | 0.548 | 0.116 | 0.663 | 2.8 a (14.5) 5.4% | 8.5 (27.7) 12.1% b | 12.9 b (32.9) 19.0% | <0.001 | 0.116 | 0.001 |
| Fats & Oils (g) | 1.1 a (3.4) 24.0% | 1.5 a,b (3.1) 37.3% | 1.9 b (3.6) 38.0% | 0.060 | 0.032 | 0.062 | 4.0 (6.9) 42.4% | 5.3 (7.3) 54.7% | 5.5 (7.0) 59.8% | 0.016 | 0.032 | 0.724 |
| Fruit (g) | 1.5 (8.8) 5.4% | 2.7 (10.7) 8.9% | 4.4 (14.0) 13.3% | 0.027 | 0.333 | 0.064 | 3.2 a (19.4) 5.8% | 8.0 a (27.2) 13.3% | 18.8 b (44.9) 24.0% | <0.001 | 0.333 | <0.001 |
© 2018 by the authors. Licensee MDPI, Basel, Switzerland. This article is an open access article distributed under the terms and conditions of the Creative Commons Attribution (CC BY) license (http://creativecommons.org/licenses/by/4.0/).
Share and Cite
Bellisle, F.; Hébel, P.; Salmon-Legagneur, A.; Vieux, F. Breakfast Consumption in French Children, Adolescents, and Adults: A Nationally Representative Cross-Sectional Survey Examined in the Context of the International Breakfast Research Initiative. Nutrients 2018, 10, 1056. https://doi.org/10.3390/nu10081056
Bellisle F, Hébel P, Salmon-Legagneur A, Vieux F. Breakfast Consumption in French Children, Adolescents, and Adults: A Nationally Representative Cross-Sectional Survey Examined in the Context of the International Breakfast Research Initiative. Nutrients. 2018; 10(8):1056. https://doi.org/10.3390/nu10081056
Chicago/Turabian StyleBellisle, France, Pascale Hébel, Aurée Salmon-Legagneur, and Florent Vieux. 2018. "Breakfast Consumption in French Children, Adolescents, and Adults: A Nationally Representative Cross-Sectional Survey Examined in the Context of the International Breakfast Research Initiative" Nutrients 10, no. 8: 1056. https://doi.org/10.3390/nu10081056