Hepatic Oxidative Stress in Fructose-Induced Fatty Liver Is Not Caused by Sulfur Amino Acid Insufficiency

Abstract
:1. Introduction
2. Materials and Methods
2.1. Animals and Feeding Protocol
2.2. Analytical Methods
2.3. Western Blot Analyses
2.4. Thiobarbituric Acid Reactive Substances Assay
2.5. Oil Red O Staining
2.6. Statistical Analysis
3. Results
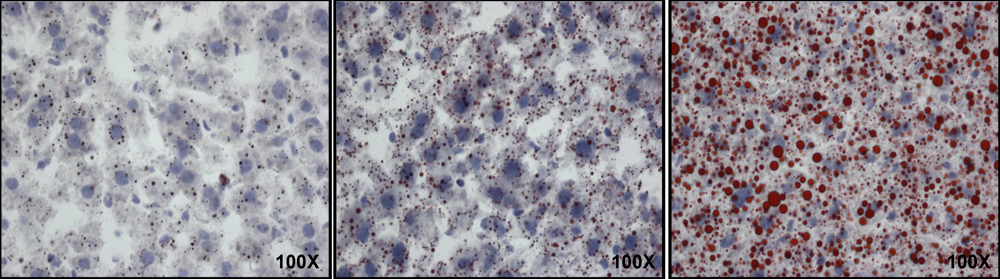
3.1. Fatty Liver

3.2. Animal Characteristics

| Parameters | Control | Fructose | Glucose | Pair fed | p† |
|---|---|---|---|---|---|
| n = 10 | n = 11 | n = 10 | n = 8 | ||
| Initial weight (g) | 20.1 ± 0.1 a | 20 ± 0.3 a | 19.9 ± 0.3 a | 19.6 ± 0.3 a | 0.7 |
| Final weight (g) | 25.5 ± 0.3 a | 28.1 ± 0.6 b | 31.8 ± 0.6 c | 17.1 ± 0.2 d | <0.001 |
| Solid food intake (gm/day) | 3.9 ± 0.2 a | 2.4 ± 0.3 b | 1.8 ± 0.2 b | 2.4 ± 0 b | <0.001 |
| Liquid intake (mL/day) | 4.8 ± 0.3 a | 6.8 ± 0.2 b | 9.5 ± 0.2 c | 2.1 ± 0.1 d | <0.001 |
| Cysteine intake (mg/day) | 12.2 ± 0.7 a | 7.5 ± 0.9 b | 5.7 ± 0.5 b | 7.5 ± 0 b | <0.001 |
| Methionine intake (mg/day) | 26.4 ± 1.5 a | 16.3 ± 20 b | 12.2 ± 1.2 b | 16.3 ± 0 b | <0.001 |
| Total caloric intake (kcal/day) | 16.0 ± 1.0 a | 18.0 ± 1.0 a | 19.0 ± 1.0 a | 10.0 ± 0 b | <0.001 |
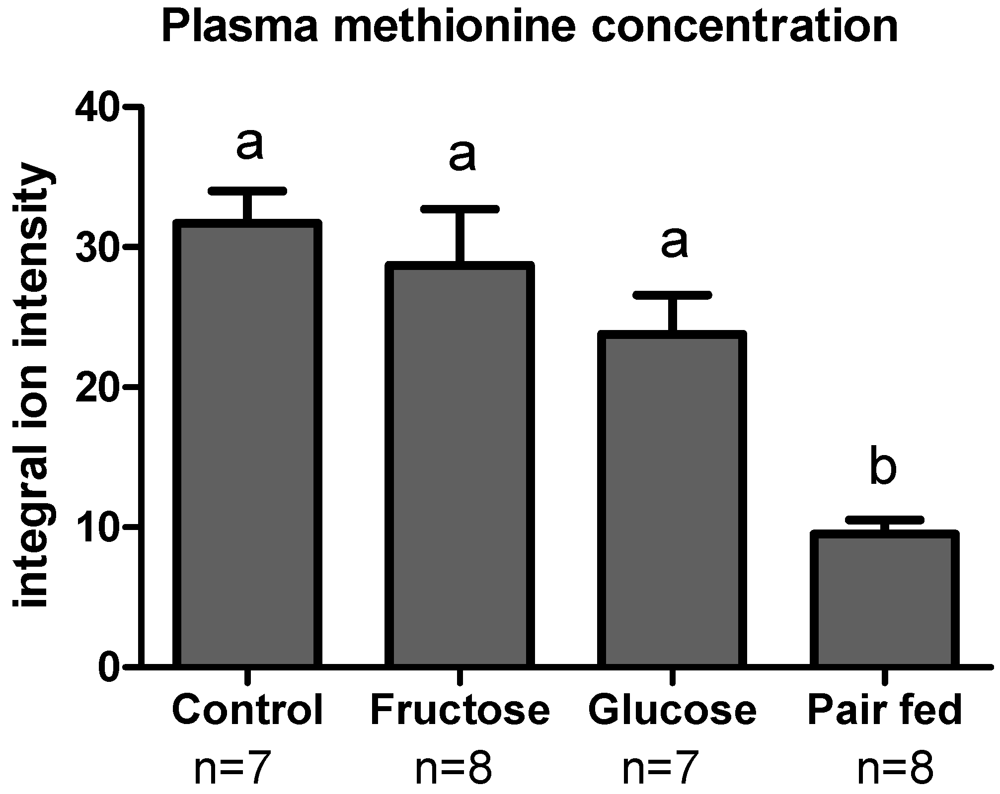
3.3. Plasma Sulfur Amino Acids

| Antioxidant thiols | Control | Fructose | Glucose | Pair fed | p† |
|---|---|---|---|---|---|
| n = 10 | n = 11 | n = 10 | n = 8 | ||
| Plasma | |||||
| Cys (µM) | 18.2 ± 2.0 a | 17.1 ± 1.0 a | 13.2 ± 2.0 a,b | 9.1 ± 1.0 b | 0.002 |
| CySS (µM) | 40.4 ± 2.0 | 40.9 ± 3.0 | 43.7 ± 3.0 | 33.4 ± 2.0 | 0.06 |
| GSH (µM) | 26.4 ± 5.0 a | 17.2 ± 2.0 | 20.7 ± 2.0 | 10.5 ± 2.0 b | 0.005 |
| GSSG (µM) | 1.6 ± 0.3 | 1.3 ± 0.3.0 | 1.3 ± 0.2 | 0.7 ± 0.2 | 0.2 |
| Total Cys (µM) | 114.1 ± 4.0 a | 109.4 ± 8.0 a | 113.8 ± 3.0 a | 81.0 ± 5.0 b | 0.004 |
| Total GSH (µM) | 44.8 ± 7.0 a | 30.4 ± 3.0 a,b | 36.5 ± 4.0 a | 17.0 ± 2.0 b | 0.001 |
| Liver | |||||
| Cys (µM) | 9.9 ± 2.0 | 7.2 ± 2.0 | 17.1 ± 9.0 | 11.8 ± 2.0 | 0.5 |
| CySS (µM) | 38.3 ± 7.0 a | 34.6 ± 6.0 a,b | 41.7 ± 8.0 a | 10.9 ± 2.0 b | 0.01 |
| GSH (µM) | 1884 ± 149.0 a | 1642 ± 137.0 a | 1432 ± 177 a,b | 982 ± 63 b | 0.002 |
| GSSG (µM) | 81.9 ± 13.0 a | 52.3 ± 5.0 a,b | 40.8 ± 7.0 b | 40.5 ± 4.0 b | 0.004 |
| Total Cys (µM) | 126.1 ± 15.0 a | 104.5 ± 14.0 a,b | 116.6 ± 18.0 a | 57.4 ± 5.0 b | 0.01 |
| Total GSH (µM) | 2087.2 ± 144 a | 1774.5 ± 142 a | 1530 ± 202 a,b | 1087 ± 66 b | 0.001 |
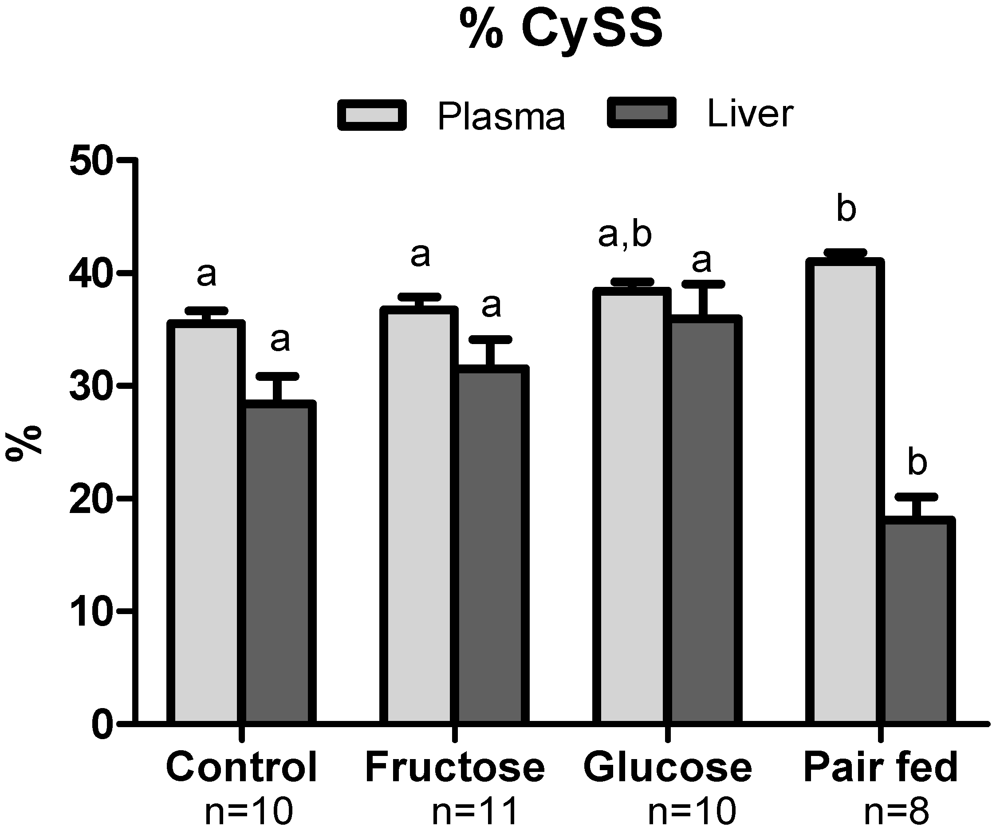
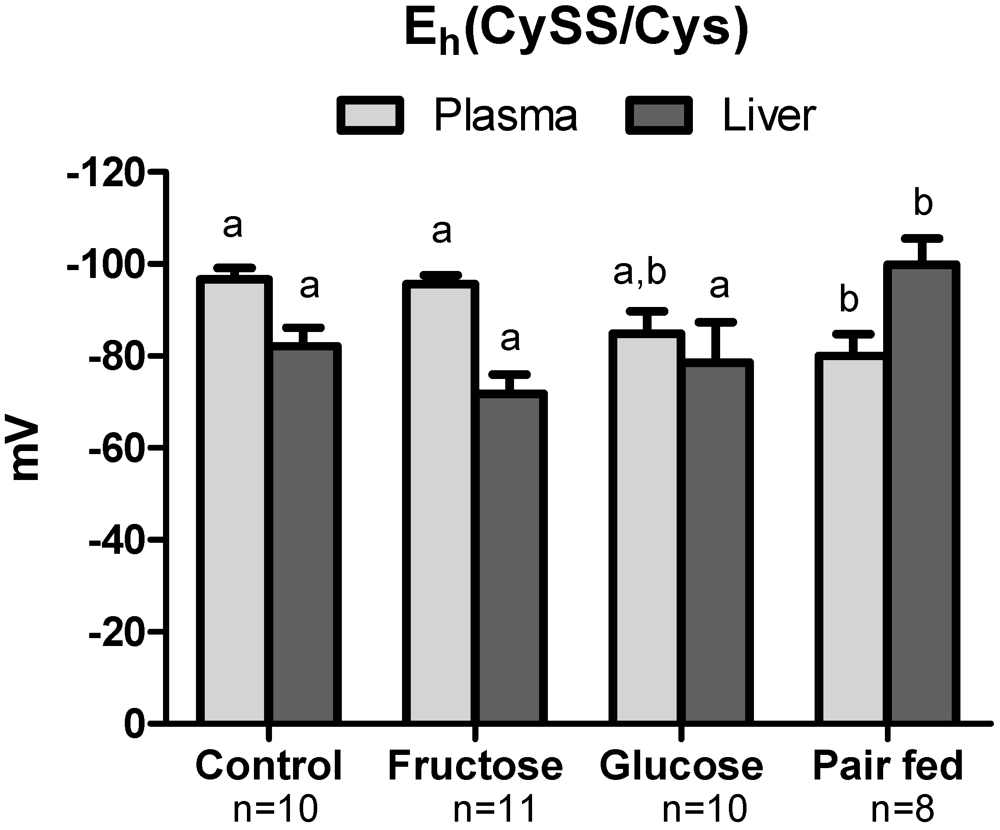
3.4. Plasma Oxidative Stress Indices
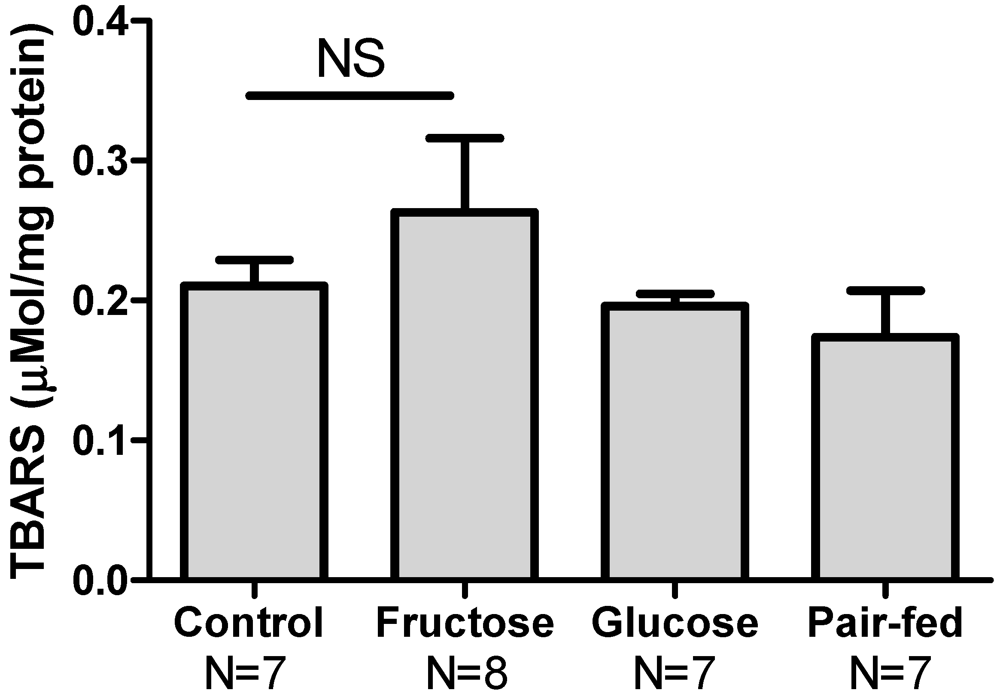
3.5. Hepatic Oxidative Stress


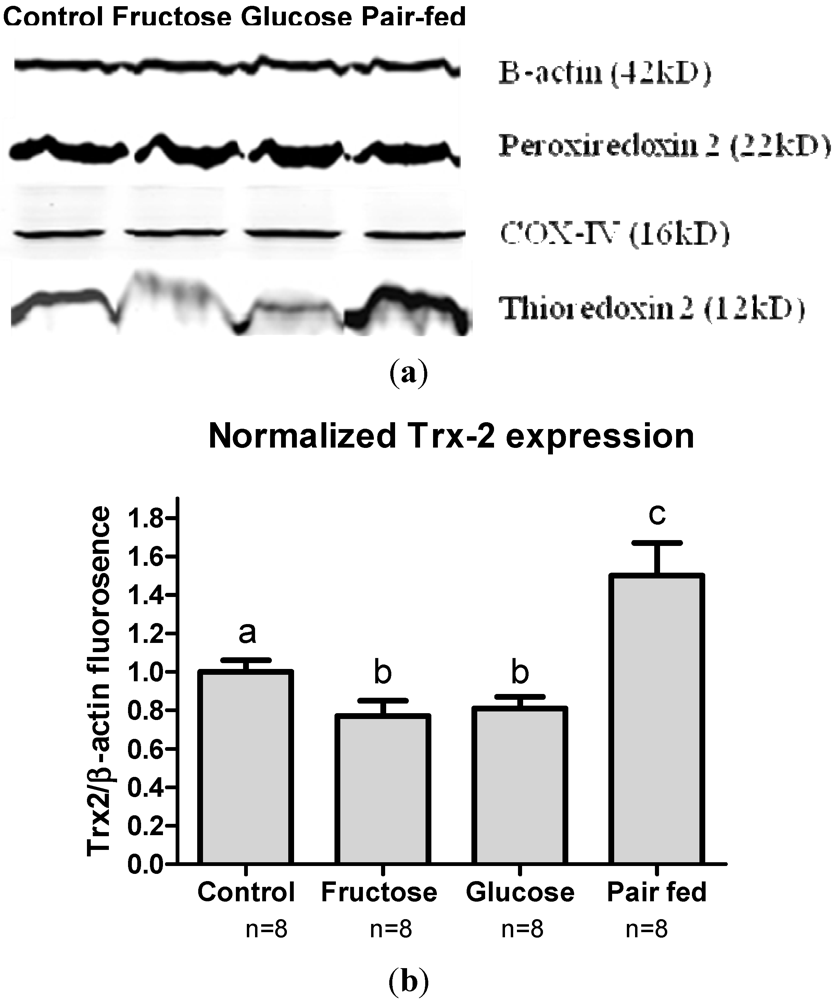
3.6. Antioxidant Protein Expression

4. Discussion
5. Conclusion
Implications
Acknowledgments
Conflict of Interest
References
- Vos, M.B.; Kimmons, J.E.; Gillespie, C.; Welsh, J.; Blanck, H.M. Dietary fructose consumption among US children and adults: The Third National Health and Nutrition Examination Survey. Medscape J. Med. 2008, 10, 160. [Google Scholar]
- Wolf, A.; Bray, G.A.; Popkin, B.M. A short history of beverages and how our body treats them. Obes. Rev. 2008, 9, 151–164. [Google Scholar]
- Bray, G.A.; Nielsen, S.J.; Popkin, B.M. Consumption of high-fructose corn syrup in beverages may play a role in the epidemic of obesity. Am. J. Clin. Nutr. 2004, 79, 537–543. [Google Scholar]
- Le, K.A.; Tappy, L. Metabolic effects of fructose. Curr. Opin. Clin. Nutr. Metab. Care 2006, 9, 469–475. [Google Scholar]
- Havel, P.J. Dietary fructose: Implications for dysregulation of energy homeostasis and lipid/carbohydrate metabolism. Nutr. Rev. 2005, 63, 133–157. [Google Scholar]
- Bocarsly, M.E.; Powell, E.S.; Avena, N.M.; Hoebel, B.G. High-fructose corn syrup causes characteristics of obesity in rats: Increased body weight, body fat and triglyceride levels. Pharmacol. Biochem. Behav. 2010, 97, 101–106. [Google Scholar]
- Anstee, Q.M.; Goldin, R.D. Mouse models in non-alcoholic fatty liver disease and steatohepatitis research. Int. J. Exp. Pathol. 2006, 87, 1–16. [Google Scholar]
- Basciano, H.; Federico, L.; Adeli, K. Fructose, insulin resistance, and metabolic dyslipidemia. Nutr. Metab. (Lond.) 2005, 2, 5. [Google Scholar] [CrossRef] [PubMed]
- Bizeau, M.E.; Pagliassotti, M.J. Hepatic adaptations to sucrose and fructose. Metabolism 2005, 54, 1189–1201. [Google Scholar]
- Cave, M.; Deaciuc, I.; Mendez, C.; Song, Z.; Joshi-Barve, S.; Barve, S.; McClain, C. Nonalcoholic fatty liver disease: Predisposing factors and the role of nutrition. J. Nutr. Biochem. 2007, 18, 184–195. [Google Scholar]
- Howard, B.V.; Wylie-Rosett, J. Sugar and cardiovascular disease: A statement for healthcare professionals from the Committee on Nutrition of the Council on Nutrition, Physical Activity, and Metabolism of the American Heart Association. Circulation 2002, 106, 523–527. [Google Scholar] [PubMed]
- Le, K.A.; Bortolotti, M. Role of dietary carbohydrates and macronutrients in the pathogenesis of nonalcoholic fatty liver disease. Curr. Opin. Clin. Nutr. Metab. Care 2008, 11, 477–482. [Google Scholar]
- Stanhope, K.L.; Havel, P.J. Fructose consumption: Recent results and their potential implications. Ann. N. Y. Acad. Sci. 2010, 1190, 15–24. [Google Scholar]
- Davail, S.; Rideau, N.; Bernadet, M.D.; Andre, J.M.; Guy, G.; Hoo-Paris, R. Effects of dietary fructose on liver steatosis in overfed mule ducks. Horm. Metab. Res. 2005, 37, 32–35. [Google Scholar]
- Mendeloff, A.I.; Weichselbaum, T.E. Role of the human liver in the assimilation of intravenously administered fructose. Metabolism 1953, 2, 450–458. [Google Scholar]
- Ouyang, X.; Cirillo, P.; Sautin, Y.; McCall, S.; Bruchette, J.L.; Diehl, A.M.; Johnson, R.J.; Abdelmalek, M.F. Fructose consumption as a risk factor for non-alcoholic fatty liver disease. J. Hepatol. 2008, 48, 993–999. [Google Scholar]
- Assy, N.; Nasser, G.; Kamayse, I.; Nseir, W.; Beniashvili, Z.; Djibre, A.; Grosovski, M. Soft drink consumption linked with fatty liver in the absence of traditional risk factors. Can. J. Gastroenterol. 2008, 22, 811–816. [Google Scholar]
- Huang, D.; Dhawan, T.; Young, S.; Yong, W.H.; Boros, L.G.; Heaney, A.P. Fructose impairs glucose-induced hepatic triglyceride synthesis. Lipids Health Dis. 2011, 10, 20. [Google Scholar]
- Wei, Y.; Wang, D.; Topczewski, F.; Pagliassotti, M.J. Fructose-mediated stress signaling in the liver: Implications for hepatic insulin resistance. J. Nutr. Biochem. 2007, 18, 1–9. [Google Scholar]
- Bray, G.A. Soft drink consumption and obesity: It is all about fructose. Curr. Opin. Lipidol. 2010, 21, 51–57. [Google Scholar]
- Busserolles, J.; Gueux, E.; Rock, E.; Mazur, A.; Rayssiguier, Y. Substituting honey for refined carbohydrates protects rats from hypertriglyceridemic and prooxidative effects of fructose. J. Nutr. 2002, 132, 3379–3382. [Google Scholar]
- Busserolles, J.; Gueux, E.; Rock, E.; Demigne, C.; Mazur, A.; Rayssiguier, Y. Oligofructose protects against the hypertriglyceridemic and pro-oxidative effects of a high fructose diet in rats. J. Nutr. 2003, 133, 1903–1908. [Google Scholar]
- Wei, Y.; Wang, D.; Pagliassotti, M.J. Fructose selectively modulates c-jun N-terminal kinase activity and insulin signaling in rat primary hepatocytes. J. Nutr. 2005, 135, 1642–1646. [Google Scholar]
- Vos, M.B.; Weber, M.B.; Welsh, J.; Khatoon, F.; Jones, D.P.; Whitington, P.F.; McClain, C.J. Fructose and oxidized low-density lipoprotein in pediatric nonalcoholic fatty liver disease: A pilot study. Arch. Pediatr. Adolesc. Med. 2009, 163, 674–675. [Google Scholar]
- Mellor, K.; Ritchie, R.H.; Meredith, G.; Woodman, O.L.; Morris, M.J.; Delbridge, L.M. High-fructose diet elevates myocardial superoxide generation in mice in the absence of cardiac hypertrophy. Nutrition 2010, 26, 842–848. [Google Scholar]
- Kelley, G.L.; Allan, G.; Azhar, S. High dietary fructose induces a hepatic stress response resulting in cholesterol and lipid dysregulation. Endocrinology 2004, 145, 548–555. [Google Scholar]
- Lee, O.; Bruce, W.R.; Dong, Q.; Bruce, J.; Mehta, R.; O’Brien, P.J. Fructose and carbonyl metabolites as endogenous toxins. Chem. Biol. Interact. 2009, 178, 332–339. [Google Scholar]
- Nseir, W.; Nassar, F.; Assy, N. Soft drinks consumption and nonalcoholic fatty liver disease. World J. Gastroenterol. 2010, 16, 2579–2588. [Google Scholar]
- Du, D.; Shi, Y.H.; Le, G.W. Oxidative stress induced by high-glucose diet in liver of C57BL/6J mice and its underlying mechanism. Mol. Biol. Rep. 2010, 37, 3833–3839. [Google Scholar]
- Delbosc, S.; Paizanis, E.; Magous, R.; Araiz, C.; Dimo, T.; Cristol, J.P.; Cros, G.; Azay, J. Involvement of oxidative stress and NADPH oxidase activation in the development of cardiovascular complications in a model of insulin resistance, the fructose-fed rat. Atherosclerosis 2005, 179, 43–49. [Google Scholar]
- Nyby, M.D.; Abedi, K.; Smutko, V.; Eslami, P.; Tuck, M.L. Vascular Angiotensin type 1 receptor expression is associated with vascular dysfunction, oxidative stress and inflammation in fructose-fed rats. Hypertens. Res. 2007, 30, 451–457. [Google Scholar]
- Du, D.; Shi, Y.H.; Le, G.W. Oxidative stress induced by high-glucose diet in liver of C57BL/6J mice and its underlying mechanism. Mol. Biol. Rep. 2010, 37, 3833–3839. [Google Scholar]
- Miller, A.; Adeli, K. Dietary fructose and the metabolic syndrome. Curr. Opin. Gastroenterol. 2008, 24, 204–209. [Google Scholar]
- Rodin, J. Comparative effects of fructose, aspartame, glucose, and water preloads on calorie and macronutrient inta. Am. J. Clin. Nutr. 1990, 51, 428–435. [Google Scholar]
- Raben, A.; Vasilaras, T.H.; Moller, A.C.; Astrup, A. Sucrose compared with artificial sweeteners: Different effects on ad libitum food intake and body weight after 10 wk of supplementation in overweight subjects. Am. J. Clin. Nutr. 2002, 76, 721–729. [Google Scholar]
- Vartanian, L.R.; Schwartz, M.B.; Brownell, K.D. Effects of soft drink consumption on nutrition and health: A systematic review and meta-analysis. Am. J. Public Health 2007, 97, 667–675. [Google Scholar]
- DiMeglio, D.P.; Mattes, R.D. Liquid versus solid carbohydrate: Effects on food intake and body weight. Int. J. Obes. Relat. Metab. Disord. 2000, 24, 794–800. [Google Scholar]
- Tordoff, M.G.; Alleva, A.M. Effect of drinking soda sweetened with aspartame or high-fructose corn syrup on food intake and body weight. Am. J. Clin. Nutr. 1990, 51, 963–969. [Google Scholar]
- De Castro, J.M. The effects of the spontaneous ingestion of particular foods or beverages on the meal pattern and overall nutrient intake of humans. Physiol. Behav. 1993, 53, 1133–1144. [Google Scholar]
- Mattes, R.D. Dietary compensation by humans for supplemental energy provided as ethanol or carbohydrate in fluids. Physiol. Behav. 1996, 59, 179–187. [Google Scholar]
- Reid, M.; Hammersley, R.; Hill, A.J.; Skidmore, P. Long-term dietary compensation for added sugar: Effects of supplementary sucrose drinks over a 4-week period. Br. J. Nutr. 2007, 97, 193–203. [Google Scholar]
- Mattes, R.D.; Campbell, W.W. Effects of food form and timing of ingestion on appetite and energy intake in lean young adults and in young adults with obesity. J. Am. Diet. Assoc. 2009, 109, 430–437. [Google Scholar]
- Mattes, R.D. Fluid energy-Where’s the problem? J. Am. Diet. Assoc. 2006, 106, 1956–1961. [Google Scholar] [CrossRef] [PubMed]
- Bergheim, I.; Weber, S.; Vos, M.; Kramer, S.; Volynets, V.; Kaserouni, S.; McClain, C.J.; Bischoff, S.C. Antibiotics protect against fructose-induced hepatic lipid accumulation in mice: Role of endotoxin. J. Hepatol. 2008, 48, 983–992. [Google Scholar]
- Jurgens, H.; Haass, W.; Castaneda, T.R.; Schurmann, A.; Koebnick, C.; Dombrowski, F.; Otto, B.; Nawrocki, A.R.; Scherer, P.E.; Spranger, J.; et al. Consuming fructose-sweetened beverages increases body adiposity in mice. Obes. Res. 2005, 13, 1146–1156. [Google Scholar]
- Go, Y.M.; Jones, D.P. Redox compartmentalization in eukaryotic cells. Biochim. Biophys. Acta 2008, 1780, 1273–1290. [Google Scholar]
- Jones, D.P.; Liang, Y. Measuring the poise of thiol/disulfide couples in vivo. Free Radic. Biol. Med. 2009, 47, 1329–1338. [Google Scholar] [CrossRef] [PubMed]
- Jones, D.P.; Park, Y.; Gletsu-Miller, N.; Liang, Y.; Yu, T.; Accardi, C.J.; Ziegler, T.R. Dietary sulfur amino acid effects on fasting plasma cysteine/cystine redox potential in humans. Nutrition 2011, 27, 199–205. [Google Scholar]
- Nkabyo, Y.S.; Gu, L.H.; Jones, D.P.; Ziegler, T.R. Thiol/disulfide redox status is oxidized in plasma and small intestinal and colonic mucosa of rats with inadequate sulfur amino acid intake. J. Nutr. 2006, 136, 1242–1248. [Google Scholar]
- Jonas, C.R.; Estivariz, C.F.; Jones, D.P.; Gu, L.H.; Wallace, T.M.; Diaz, E.E.; Pascal, R.R.; Cotsonis, G.A.; Ziegler, T.R. Keratinocyte growth factor enhances glutathione redox state in rat intestinal mucosa during nutritional repletion. J. Nutr. 1999, 129, 1278–1284. [Google Scholar]
- Ishii, S.; Iizuka, K.; Miller, B.C.; Uyeda, K. Carbohydrate response element protein directly promotes lipogenic enzyme gene transcription. Proc. Natl. Acad. Sci. USA 2004, 101, 15597–15602. [Google Scholar]
- Jones, D.P.; Carlson, J.L.; Mody, V.C.; Cai, J.; Lynn, M.J.; Sternberg, P. Redox state of glutathione in human plasma. Free Radic. Biol. Med. 2000, 28, 625–635. [Google Scholar]
- Jones, D.P.; Carlson, J.L.; Samiec, P.S.; Sternberg, P., Jr.; Mody, V.C., Jr.; Reed, R.L.; Brown, L.A. Glutathione measurement in human plasma. Evaluation of sample collection, storage and derivatization conditions for analysis of dansyl derivatives by HPLC. Clin. Chim. Acta 1998, 275, 175–184. [Google Scholar] [CrossRef] [PubMed]
- Johnson, J.M.; Strobel, F.H.; Reed, M.; Pohl, J.; Jones, D.P. A rapid LC-FTMS method for the analysis of cysteine, cystine and cysteine/cystine steady-state redox potential in human plasma. Clin. Chim. Acta 2008, 396, 43–48. [Google Scholar]
- Halvey, P.J.; Watson, W.H.; Hansen, J.M.; Go, Y.M.; Samali, A.; Jones, D.P. Compartmental oxidation of thiol-disulphide redox couples during epidermal growth factor signalling. Biochem. J. 2005, 386, 215–219. [Google Scholar]
- He, M.; Cai, J.; Go, Y.M.; Johnson, J.M.; Martin, W.D.; Hansen, J.M.; Jones, D.P. Identification of thioredoxin-2 as a regulator of the mitochondrial permeability transition. Toxicol. Sci. 2008, 105, 44–50. [Google Scholar]
- Chen, Y.; Yu, M.; Jones, D.P.; Greenamyre, J.T.; Cai, J. Protection against oxidant-induced apoptosis by mitochondrial thioredoxin in SH-SY5Y neuroblastoma cells. Toxicol. Appl. Pharmacol. 2006, 216, 256–262. [Google Scholar]
- Ngo Sock, E.T.; Le, K.A.; Ith, M.; Kreis, R.; Boesch, C.; Tappy, L. Effects of a short-term overfeeding with fructose or glucose in healthy young males. Br. J. Nutr. 2010, 103, 939–943. [Google Scholar]
- Tappy, L.; Le, K.A.; Tran, C.; Paquot, N. Fructose and metabolic diseases: New findings, new questions. Nutrition 2010, 26, 1044–1049. [Google Scholar]
- McDevitt, R.M.; Bott, S.J.; Harding, M.; Coward, W.A.; Bluck, L.J.; Prentice, A.M. De novo lipogenesis during controlled overfeeding with sucrose or glucose in lean and obese women. Am. J. Clin. Nutr. 2001, 74, 737–746. [Google Scholar] [PubMed]
- Stanhope, K.L.; Schwarz, J.M.; Keim, N.L.; Griffen, S.C.; Bremer, A.A.; Graham, J.L.; Hatcher, B.; Cox, C.L.; Dyachenko, A.; Zhang, W.; et al. Consuming fructose-sweetened, not glucose-sweetened, beverages increases visceral adiposity and lipids and decreases insulin sensitivity in overweight/obese human. J. Clin. Invest. 2009, 119, 1322–1334. [Google Scholar]
- Tappy, L.; Le, K.A. Metabolic effects of fructose and the worldwide increase in obesity. Physiol. Rev. 2010, 90, 23–46. [Google Scholar]
- Machado, M.V.; Ravasco, P.; Jesus, L.; Marques-Vidal, P.; Oliveira, C.R.; Proenca, T.; Baldeiras, I.; Camilo, M.E.; Cortez-Pinto, H. Blood oxidative stress markers in non-alcoholic steatohepatitis and how it correlates with diet. Scand. J. Gastroenterol. 2008, 43, 95–102. [Google Scholar]
- Sumida, Y.; Nakashima, T.; Yoh, T.; Furutani, M.; Hirohama, A.; Kakisaka, Y.; Nakajima, Y.; Ishikawa, H.; Mitsuyoshi, H.; Okanoue, T.; et al. Serum thioredoxin levels as a predictor of steatohepatitis in patients with nonalcoholic fatty liver disease. J. Hepatol. 2003, 38, 32–38. [Google Scholar]
- Ristow, M.; Zarse, K. How increased oxidative stress promotes longevity and metabolic health: The concept of mitochondrial hormesis (mitohormesis). Exp. Gerontol. 2010, 45, 410–418. [Google Scholar]
© 2011 by the authors; licensee MDPI, Basel, Switzerland. This article is an open-access article distributed under the terms and conditions of the Creative Commons Attribution license (http://creativecommons.org/licenses/by/3.0/).
Share and Cite
Kunde, S.S.; Roede, J.R.; Vos, M.B.; Orr, M.L.; Go, Y.-M.; Park, Y.; Ziegler, T.R.; Jones, D.P. Hepatic Oxidative Stress in Fructose-Induced Fatty Liver Is Not Caused by Sulfur Amino Acid Insufficiency. Nutrients 2011, 3, 987-1002. https://doi.org/10.3390/nu3110987
Kunde SS, Roede JR, Vos MB, Orr ML, Go Y-M, Park Y, Ziegler TR, Jones DP. Hepatic Oxidative Stress in Fructose-Induced Fatty Liver Is Not Caused by Sulfur Amino Acid Insufficiency. Nutrients. 2011; 3(11):987-1002. https://doi.org/10.3390/nu3110987
Chicago/Turabian StyleKunde, Sachin S., James R. Roede, Miriam B. Vos, Michael L. Orr, Young-Mi Go, Youngja Park, Thomas R. Ziegler, and Dean P. Jones. 2011. "Hepatic Oxidative Stress in Fructose-Induced Fatty Liver Is Not Caused by Sulfur Amino Acid Insufficiency" Nutrients 3, no. 11: 987-1002. https://doi.org/10.3390/nu3110987