1. Introduction
Monocytes and neutrophils belong to the great family of host defense cells and share similar mechanisms that consist of ingesting the bacterial material through phagocytosis and killing infectious agents by producing reactive oxygen species (ROS) upon activation of NADPH-oxidase. Furthermore, their ROS production performs other important physiological functions, for example by participating at the transduction of the cellular signal, the gene expression, the regulation of the vascular tone,
etc [
1,
2,
3].
However, an excessive ROS production can be deleterious for the cell, since ROS can attack important biomolecules, causing changes in the structure and function of enzymes, proteins and nucleotides. It is well established that ROS are involved in the long term pathogenesis of various diseases like cancer, diabetes, rheumatoid arthritis, cell aging, cardiovascular diseases, including atherosclerosis,
etc [
2,
4]. Monocytes are well known to play a crucial role in the development of ROS-induced pathologies, as they can produce non-negligible amounts of ROS.
Unsaturated fatty acids are major constituents of biomembranes, but they are particularly sensitive to oxidation. A regulated lipid peroxidation is a normal physiological and noncytotoxic process with biochemical intrinsic functions, such as the generation of prostaglandins [
5]. In contrast, an increased lipid peroxidation has been found to be correlated with swelling and possible lysis of mitochondrion, microsomes, lysosomes and cells [
5,
6,
7]. Lipid peroxides are well known to exert deleterious effects on biomembranes, for example by disturbing the lipid bilayer through inappropriate Van Der Waals associations and increasing their viscosity and osmotic fragility [
6]. On the other hand, lipid peroxides react with cell proteins, modify their structure through scission, cross-linking or covalent bonds and thus, decrease their rotational and lateral mobility [
5,
6,
7].
Considering the negative long-term side effects of ROS produced either by cells such as monocytes or by lipid peroxidation, modulating the ROS generation and maintaining the redox state of the cell at the required physiological level is nowadays considered as a main therapeutic target [
8,
9]. Polyphenols found in fruit and vegetables have gained growing interest. They have been reported to contribute to prevent or delay the onset of inflammatory diseases and other ROS related pathologies because they can develop efficient antioxidant (AOX) activities through their chemical structure [
10,
11] and also modulate different biochemical mechanisms within the human body [
12,
13,
14,
15,
16]. In this perspective, we were interested to investigate the polyphenol content and the AOX capacity of selected green vegetables commonly consumed by migrants from Western and Central Africa living in Western Europe as well as by the people in the origin countries,
i.e., leaves (and crosses) of
Abelmoschus esculentus (Malvaceae),
Hibiscus acetosella (Malvaceae),
Manihot esculenta Crantz (Eupohorbiaceae) and
Pteridium aquilinum (Dennstaedtiaceae). In the tropical regions, these plants grow readily even in the dry season. Among them,
Manihot is economically the most important, because it is the basic green vegetable for people in many parts of sub-Saharan Africa such as Nigeria, Cameroon, Gabon, Democratic Republic of Congo (DRC), Uganda, Angola,
etc., and is also consumed in Latin America, the Philippines, Indonesia, Malaysia and other Asian countries [
17,
18].
Manihot leaves (and seeds) are used in folk medicine to alleviate fever, headache, rheumatism, and hemorrhoids [
19]. In Nigeria, they are also utilized in the treatment of ringworms, tumor, conjunctivitis, sores and abscesses [
19]. Some literature data reported that the aqueous, methanolic and ethanolic extracts of
Manihot leaves (and seeds) contained anthocyanins, flavonoids and other polyphenols and were found to scavenge DPPH-, hydroxyl- and superoxide free radicals, to inhibit Low Density Lipoprotein (LDL) oxidation, to chelate cupric ions and to reduce ferric ions [
20,
21]. Similar investigations have been carried out on
Abelmoschus esculentus [
22,
23,
24,
25] and some
Hibiscus varieties, mainly
Hibiscus sabdariffa [
20,
25] and reported stoichiometry based AOX activities related to the polyphenol content found in the leaf and seed extracts. The leaves, flower and calyces of the variety
Hibiscus sabdariffa are also used as diuretic, sedative, anti-scorbutic, colorectal and intestinal antiseptic as well as in heart and nerve conditions [
26]. The polyphenol content of
Pteridium aquilinum has also been investigated [
27,
28], but its AOX activities remain poorly elucidated [
25].
Taking into account the major role of lipid peroxidation in the ROS production, originally this research consisted of designing an appropriate model to investigate the effects of the plant extracts on any of the main steps of lipid peroxidation, beginning with markers of an advanced lipid peroxidation, and investigating back along the pathway of lipid peroxidation to its initiation, where transient free radicals are produced. Short chain volatile
C-compounds like pentane and ethylene are markers of an advanced lipid peroxidation [
29]. In our model, their formation was analyzed with a gas chromatography (GC) technique by following the ethylene production. Lipid hydroperoxides are generated before the volatile compounds [
29]. Their formation was investigated with spectroscopy technique using
N-
N′-dimethyl-
p-phenylene-diamine (DMPD). The generation of transient free radicals characterizes the initiation of a lipid peroxidation [
29]. The formation of these intermediate compounds was studied with Electron Spin Resonance technique (ESR). The second set of experiments was a model of ROS production based on the oxidant activities of human monocytes activated with phorbol-12-myristate-13-acetate (PMA), that we designed to study the effect of the plant extracts on the cellular ROS production in inflammation-like conditions, using a fluorescence technique with 2′,7′-dichlorofluorescine-diacetate (DCFH-DA) as fluorogenic probe. Compared to neutrophils, monocytes have low level of myeloperoxidase, which is a powerful oxidant enzyme mainly occurring in the defense cells, particularly in neutrophils [
30]. Consequently, the ROS amount produced by monocytes could be quite weak. Therefore, horseradish peroxidase (HRP) was used as reaction enhancer to increase the ROS level and allow easy comparisons of the inhibitory effects displayed by the extracts being studied. To reproduce at best the usual culinary processing and to analyze its eventual effect on the AOX capacity of the tested plants, samples of each plant extract were boiled and tested in parallel to not heated samples. The amount of total polyphenol, non-tannin polyphenol and flavonoid contained in the dry plant powders was analyzed using classic spectroscopy techniques. To identify some of the polyphenols contained in the plant extracts, an HPLC-UV/DAD analysis was undertaken, using some standard compounds with well-known AOX activities as reference.
2. Experimental Section
2.1. Chemicals and Reagents
Sodium carbonate, sodium dihydrogenphosphate, di-sodium hydrogenphosphate, hydrochloric acid, iron(II) sulfate heptahydrate, ammonium iron(II) sulfate hexahydrate, vitamin C, ethyl acetate, acetone, methanol and ethanol were of analytical grade from Merck VWR (Leuven, Belgium). Linoleic acid, phorbol-12-myristate-13-acetate (PMA), polyphenol standards, 3-[(3-cholamidopropyl)-dimethylammonio]-1-propanesulfonate (CHAPS), phosphomolybdo-phosphotungstic reagent (Folin-Ciocalteu reagent), as well as glacial acetic acid, sheep skin powder, aluminium chlorid, anhydrous sodium sulfate, hexamethylentetramine, N-N′-dimethyl-p-phenylene diamine (DMPD) and α-(4-pyridyl-1-oxide)-N-tert-butylnitrone (POBN) were from Sigma (Bornem, Belgium). Chelex (200–400 mesh, sodium form) was from BioRad (Belgium); chloroform was from Acros (Geel, Belgium). 2′,7′-dichlorofluorescine-diacetate (DCFH-DA) was purchased from Eastman Kodak (Rochester, NY, USA), Trypan blue was from ICN Biomedicals, Inc (Cleveland, OH, USA), and horseradish peroxidase (HRP) was obtained from Roche (Mannheim, Germany). Water was treated in a Milli-Q water ultra purification system (Easy Pure Purification System).
2.2. Vegetal Material
Abelmoschus, Hibiscus, Manihot young leaves and Pteridium crosses and leaves were gathered in Kisantu, province Bas-Congo (DRC) in March–April 2007, and authenticated by the National Institute for Research in Agronomics (INRA), University of Kinshasa, DRC. Sample specimens bearing authentic voucher numbers were provided to the affiliation laboratory of the research team. The plant parts were shaded dried until their weight became stable, then ground and sieved at 180 µm particle size. The recovered powder was loaded into hermetic and opaque flasks and stored at room temperature out of light until further preparations.
2.3. Preparation of Aqueous Extracts and Samples for Biochemical Assays
The powder (100 g) was permanently stirred (300 rpm) for 6 h at room temperature in 500 mL ultra pure water until filtration and lyophilization (24 h). The extracts were kept in hermetic and opaque flasks at −22 °C. Before each assay, two measures of each extract were dissolved in ultra pure water; one of them was boiled for 45 min. All steps were performed in the dark. The extraction yields were Pteridium 7.9% > Manihot 7.4% > Hibiscus 7.3% > Abelmoschus 6.9%.
2.4. Study on Lipid Peroxidation Model
2.4.1. Preparation of the Linoleic Acid Emulsion
Linoleic acid (0.64 mM) and 200 mg CHAPS were mixed in 50 mL chelexed phosphate buffer (pH 7.4) and gently shaken for 5 min at room temperature.
2.4.2. Measurement of the Ethylene Produced (Gas Chromatography Technique)
The experiment was based on the procedure described by Beyer
et al. [
31]. Two hundred microliters of plant extract adjusted to 10, 50 and 100 µg/mL final concentration, one milliliter of linoleic acid emulsion 0.64 mM, 200 µL of vitamin C 1 mM and 580 µL of phosphate buffer pH 7.4 were loaded into flasks. Iron(II) 5 mM (20 µL) was added before the flasks were hermetically sealed and kept at 37 °C overnight in the dark. Ten microliters of the upper gaseous phase produced in the flask were manually injected in the column of a Varian 450 GC apparatus. One flask was loaded without plant extract and was set as 100% ethylene production (control). The GC parameters were: Porapak T column (1 m length; ID 1/8 inch; supplied by Supelco, Belgium) at 160 °C. Nitrogen was used as gas carrier (30 mL/min). Flame ionization detector (FID) and injector temperatures detector were both set at 200 °C. The driving software was the Varian “Galaxy Chromatography data system”.
2.4.3. Measurement of the Lipid Hydroperoxides Produced (UV-Visible Assay with DMPD)
The assay was based on the method described by Deby
et al. [
32], with light adaptations. One hundred microliters Vitamin C (1 mM), 90 µL phosphate buffer (pH 7.4) and 100 µL of extract solutions adjusted to respectively 5, 10, 25, 50, 75 and 100 µg/mL final concentration, were added to 700 µL linoleic acid emulsion (0.45 mM). Ten microliters Fe(II) 5 mM were loaded as last before the tube was hermetically closed and stored for 4.5 h at 37 °C in the dark. One tube was loaded without plant extract and was set as control for the lipid peroxidation (100% production of lipid hydroperoxides). Before centrifugation (400×
g, 10 min, 20 °C), 2 mL chloroform were added to extract the organic phase. The aqueous layer was discarded and the organic phase was immediately evaporated under a flow of nitrogen gas. To monitor the peroxidation products, 300 µL ethanol, 3 mL DMPD solution (2.2 µM DMPD in chloroform/acetic acid/ultra pure water 5:5:1 v/v/v) and as last 50 µL Fe(III) 0.128 µM final concentration were loaded before the absorbance was read using ethanol as blank (Hewlett Packard Spectrophometer, 517 nm).
2.4.4. Measurement of the Transient Free Radicals Produced by Lipid Peroxidation (ESR Technique)
This study was performed according to the method described by Mouithys-Mickalad
et al. [
33]. Plant extracts (100 µL) were adjusted to 10, 50 and 100 µg/mL final concentration and added to 500 µL linoleic acid emulsion (0.32 mM) before addition of 100 µL vitamin C (1 mM) and 100 µL POBN (50 mM). One flask of the emulsion received no plant extract and was used as control for the formation of intermediate free radicals (100% production of transient free radicals). Each tube volume was completed to 1 mL total volume with chelexed phosphate buffer (pH 7.4) and 10 µL 5 × 10
−5 M Fe(II) that was added at last. The tube was stored in the incubator at 37 °C in the dark for 2 h and the content transferred in an ESR quartz flat cell which was put into the cavity of the ESR spectrometer for analysis. The measurements were carried out at room temperature with a Bruker spectrometer (Bruker, Karlsruhe, Germany), operating at X-band frequency (9.8 GHz) and at a microwave power of 20 mW. The instrumental settings were: 100 KHz modulation frequency, 1.012 G modulation amplitude, 3480 G magnetic field centre; receiver gain was 2 × 10
4. The sweep width was ±50 G and the number scan was 1. The hyperfine splitting constants were measured from the experimental spectra using a Bruker Win-Simfonia program running under Microsoft Windows.
2.5. Study on Cell Model
2.5.1. Cell Culture
Human promyelocytic leukemia cells (HL-60) were obtained from the American Type Culture Collection (ACCT, USA) and cultured in Iscove’s Modified Dulbecco’s Medium (IMDM) supplemented with 20% (v/v) fetal calf serum, 100 U/mL penicillin/streptomycin, 1.25 mg/mL amphotericin B, and 2 g/L NaHCO3 in 50 mL flasks at 37 °C in a 5% CO2 humidified atmosphere. The cells were cultured and fed two to three times per week to maintain a log phase growth and once a week, they were centrifuged and re-suspended in fresh IMDM. Before each experiment, cells were counted with Burker’ cell (Briare, France) to reach the cell density required for the experiments, i.e., 1 × 10⁶ cells/mL.
2.5.2. Cell Viability Assay
Cells (10
6/mL HBSS buffer) were incubated with 10 µL of not heated extract solutions at the final concentration of 100 μg/mL at 37 °C for 45 min in the dark. The cell viability was checked using an exclusion test with Trypan blue [
34]. For the control cells, 10 µL ultra pure water were used instead of the extract solutions.
2.5.3. Measurement of the ROS Produced by PMA-Activated HL-60 Monocytes (Fluorescence Technique with Non Fluorescent DCFH-DA)
This experiment was based on the method described by Amado
et al. [
35] with adaptations. One million HL-60 monocytes were incubated at 37 °C in the dark with 41 µM non-fluorescent DCFH-DA for 45 min in 24-well microtiter plates. The content of each well was transferred into a 5 mL-tube for centrifugation (300×
g) for 10 min at 37 °C. The recovered cell pellet was diluted with 500 µL HBSS buffer and transferred into wells containing 450 µL HBSS. Ten microliters of extract solution at final concentrations of 10, 50 and 100 µg/mL, 10 µL HRP (30 µg/mL) and as last 30 µL PMA (0.486 µM) were added to a volume of 950 µL cell suspension. In each assay, three wells were loaded without plant extract and were taken as control for the ROS production (100% ROS induced fluorescence). To measure the basic ROS production of the cells at the absence of activation, three other wells without plant extract received no PMA (NA, not activated). The fluorescence produced was measured for 30 min at 37 °C on a Fluoreskan (Fluoreskan Ascent FL, Fischer Scientific, Tournai, Belgium).
2.6. Estimation of the Content of Phytochemical Compounds
2.6.1. Spectroscopy Based Estimation of Polyphenols and Tannins
2.6.1.2. Estimation Technique
Total polyphenols were estimated according to the Folin-Ciocalteu spectroscopy based method [
36]. An aliquot of 200 µL of the sample prepared above was mixed with 100 µL of Folin-Ciocalteu reagent in 1 ml ultra pure water and vortexed. 1.2 mL of an aqueous solution of Na
2CO
3 (200 g/L) were added and the mixture was allowed to stand for 30 min at room temperature in the darkness before the absorbance was measured. To determine the tannin content, 100 mg of sheepskin powder were dissolved in 10 mL sample and shaken for 1 h. The volume of the resulting filtrate was increased with ultra pure water to 1:4 v/v. The absorbance was read at 760 nm, using pyrogallol as control and water as blank (Spectophotometer UVIKON 922). The results, expressed as g pyrogallol equivalent/100 g dry plant powder, were calculated according to the formulae: total polyphenol = [(62.5 × A
1) × m
2]/(A
3 × m
2), non-tannin polyphenol = [(62.5 × A
2) × m
2]/(A
3 × m
1) and tannins = [62.5 × (A
1 − A
2) × m
2]/(A
3 × m
1), whereby A
1, A
2 and A
3 are the absorbance values of total polyphenol (A
1), non-tannin polyphenol (A
2) and pyrogallol (A
3), m
1 and m
2 are the mass (in gram) of respectively the plant powder (m
1) and pyrogallol (m
2) that were weighed for this determination.
2.6.2. Colorimetry Based Estimation of Flavonoids
2.6.2.2. Estimation Technique
The content of flavonoid was estimated by the AlCl
3 technique according to the method described in the European Pharmacopeia [
37]. Glacial acetic acid and methanol were mixed to 1:19 v/v. Four hundred microliters of the plant sample prepared above, 40 µL AlCl
3 and 560 µL of the glacial acetic acid-methanol mixture were loaded into vials that were allowed to stand for 30 min at room temperature out of light before the absorbance was read at 425 nm (Spectophotometer UVIKON 922), using hyperoside as control and water as blank. The results, expressed as g hyperoside equivalent/100 g dry plant powder, were calculated using the formula: (A × 1.25)/m, whereby A is the absorbance value and m the mass (in gram) of the extract weighed for this determination.
2.7. Statistical Analysis
Each concentration was tested in triplicate in each assay. The fluorescence, ESR and GC assays were carried out two times, the DMPD technique three times. All results were expressed as mean values ± standard deviation (SD). The statistical analysis was performed with GraphPad Instat 3.05 (GraphPad Software, San Diego California, USA). The results were analyzed using one-way analysis of variance (ANOVA); a multiple comparison of all data was performed using the “Student-Newman-Keuls Multiple Comparisons Test”, particularly focusing on two comparisons within each assay: “each sample vs. control”, and for the same extract at the same concentration, “boiled sample vs. not heated sample”. The IC50 values to the DMPD assay were calculated with GraphPad Prism 5.0 under application of the function “log (inhibitor) vs. normalized response-variable slope” after converting the concentrations into their decimal logarithm.
4. Discussion
In the traditional use, the tested green vegetables are previously chopped, immersed in water, roasted, then crushed and cooked in boiling water for 30 to 45 min before consumption. Such processing eliminates cyanosids and ptaquilosids, well known toxic compounds of
Manihot and
Pteridium, or decreases them under a non-toxic level. Under these usual conditions, the consumption provokes neither digestive problems nor allergic symptoms. The results obtained with our cellular model of viability are in agreement with this traditional use and literature data [
38,
39].
Several methods have been developed to extract the antioxidant (AOX) fraction of plant and food material. The extraction yield and the activities of the obtained extracts depend on many factors, such as the solvent used and its polarity, temperature, pH, the plant part, material preparation and the presence of hydrophilic and/or lipophilic compounds. In this work, we determined the polyphenol content with samples prepared on specific procedures appropriated to these compounds [
36,
37]. The plant powders were shown to contain different amounts of total polyphenol and flavonoid, depending on the plant (
Table 1). The spectroscopy analysis with Folin-Ciocalteu reagent showed that
Pteridium had the highest amount of tannins. Tannins might also intervene in the AOX activities that we observed with
Pteridium samples. Indeed, tannins are found in many plant foods including walnuts and pomegranates. At moderate levels, these flavanol polymers are non-toxic and develop efficient AOX capacity [
40]. For instance, ellagic acid released from hydrolysable tannins in the small intestine is a compound with well-known AOX efficiency. Furthermore, tannins are metabolized by gut bacteria into urolithins which may have further health benefits [
41].
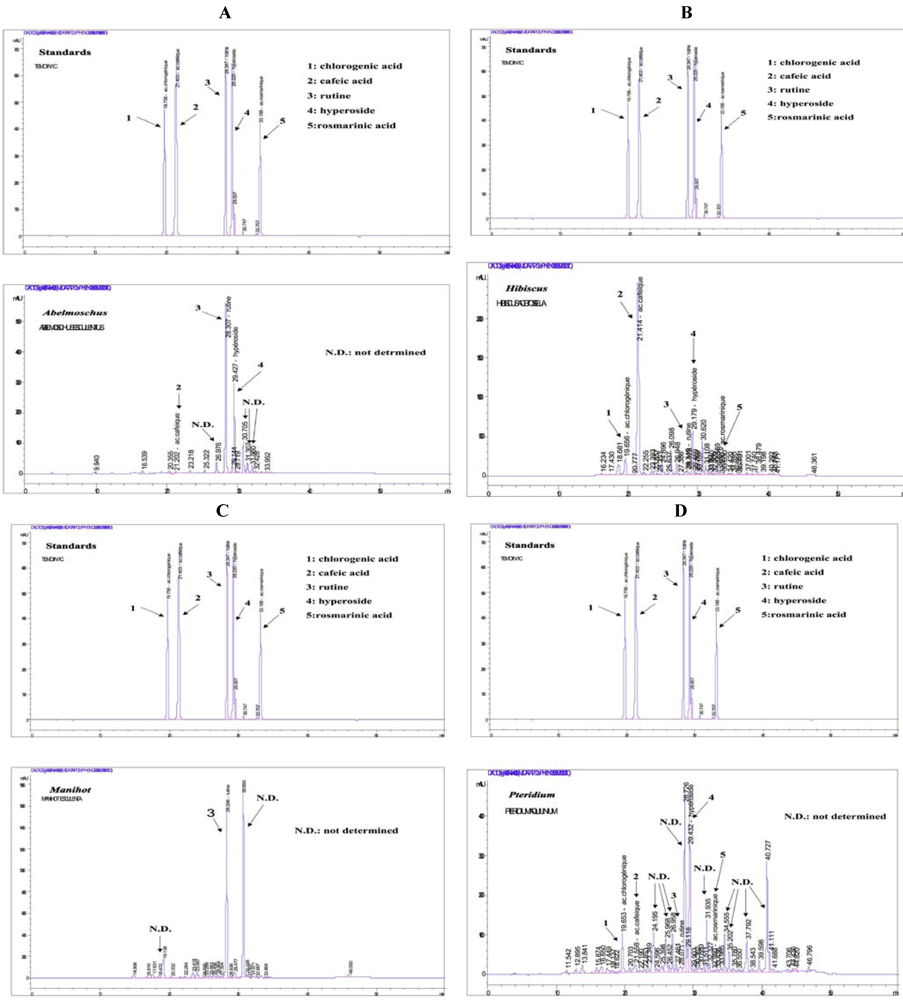
As shown in
Figure 6A–D, a preliminary HPLC separation carried out on methanolic plant extracts has permitted identification of some polyphenolic compounds in the samples. Other compounds, whose standards were not put in the analysis set, still remain to be identified by further analysis. However, the identified compounds sufficiently explain at least partially the inhibition of oxidation that we observed, since they complete some classic criteria, such as the presence of hydroxyl groups around the aromatic rings that is required by polyphenols to enable liberation of electrons and efficiently inhibit oxidation [
10,
11].
For the biochemical experiments, we were interested to mimic the processing usually carried out by the migrants from sub-Saharan Africa living in Western Europe and by the people in the origin countries, consisting of cooking these vegetables in boiling water. Thus, despite the eventual differences in yield and biological activities of the extracts obtained from the different extraction procedures, we have used aqueous extracts for the lipid and cellular models.
ROS produced within the cell might be harmful, for example by attacking polyunsaturated fatty acids and damaging the membrane lipid bilayer [
5,
6,
7,
42,
43]. Linoleic acid is a component of the cellular membrane structure [
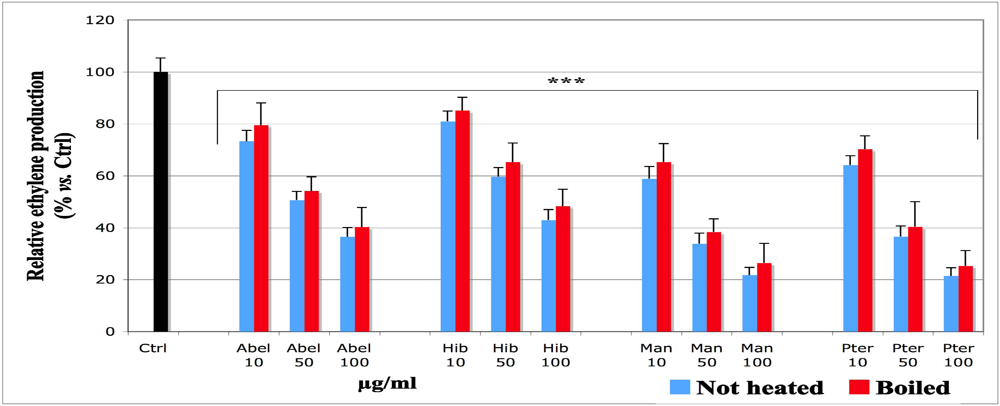
44]; it was chosen to test the capacity of the extracts to inhibit lipoperoxidation because it is an essential fatty acid afforded by food. To understand at what lipoperoxidation step the extracts could act, we designed a model including three major steps of lipid oxidation, beginning with short chain volatile C-compounds like pentane and ethylene, as these belong to the markers of an advanced lipid peroxidation, which results in breaking the C-chain [
29]. In our model, their formation was analyzed by a gas chromatography (GC) technique by following the peak of ethylene production (
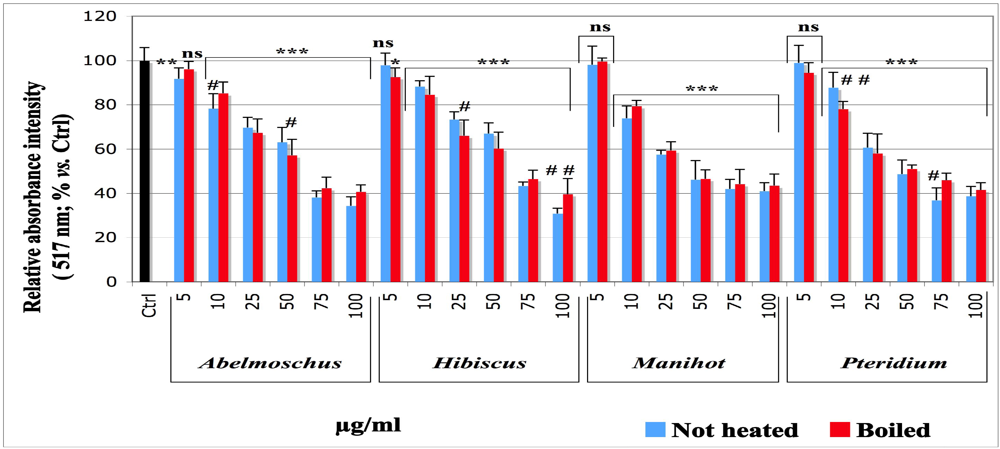
Figure 1). Lipid hydroperoxides produced before the volatile compounds were analyzed by a spectroscopic technique using DMPD. This compound reacts with lipid hydroperoxides by forming a pink adduct [
32], whose absorbance was measured at 517 nm. Thus, DMPD enables measuring the amount of lipid hydroperoxides produced, as illustrated on
Figure 2. The initiation of a lipid peroxidation generates peroxyl and other transient free radicals, which were monitored by ESR technique. For all extracts, the data obtained with the DMPD technique (
Figure 2) were in agreement with those from the measurement of ethylene (
Figure 1) and evidenced a significant dose-dependent inhibitory effect, except at the concentration of 5 µg/mL, which was not applied in the ethylene measurement and achieved no significant effect
vs. control in the spectroscopic assay with DMPD.
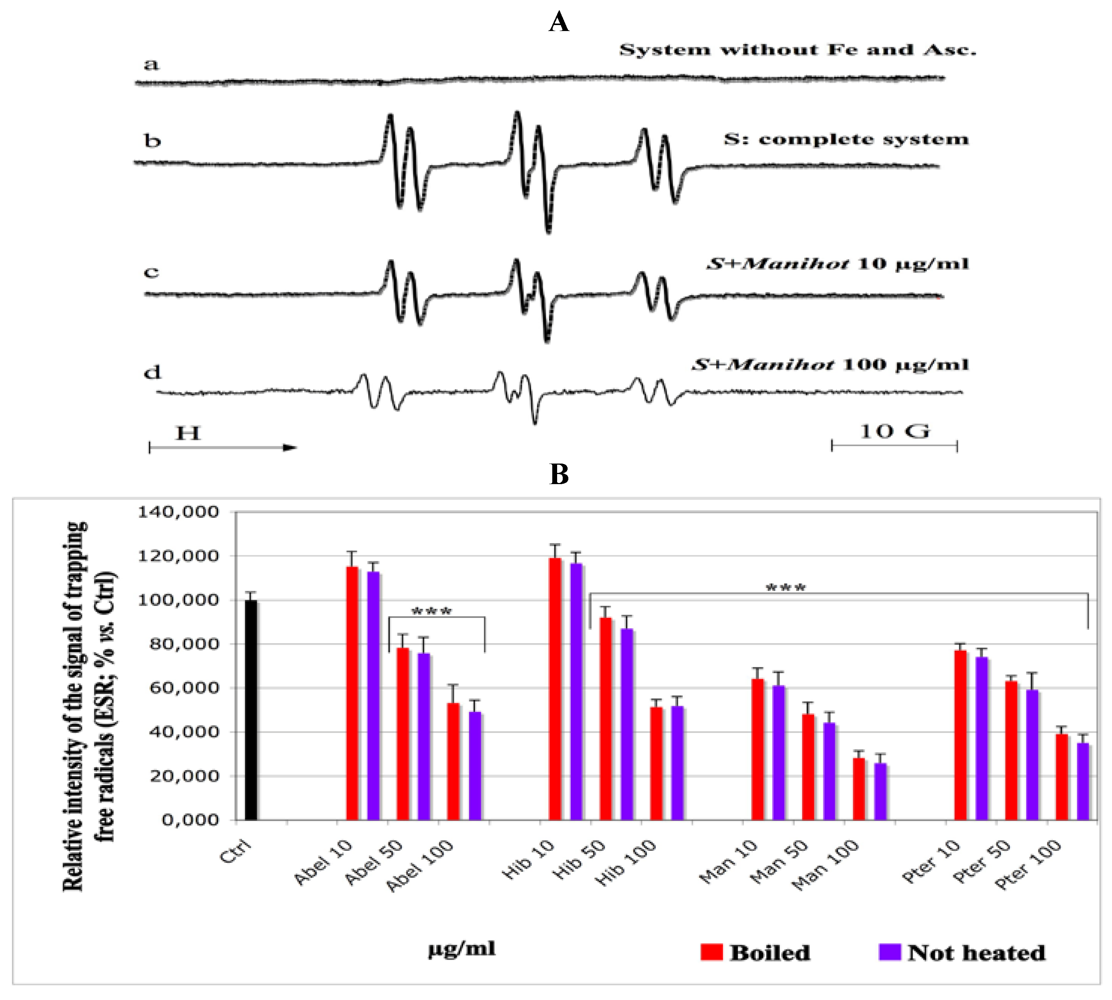
With ESR technique, all extracts showed a quite similar inhibitory profile towards the production of intermediate peroxyl radicals (
Figure 3A,B), except
Abelmoschus and
Hibiscus at 10 µg/mL concentration, which rather behaved as pro-oxidant (
Figure 3B). These observations are almost identical for both boiled and not heated samples.
Manihot and
Pteridium had the best antiradical activity, hindering the formation of POBN/peroxyl radical adducts.
For all three steps of lipoperoxidation, we observed the same AOX behavior,
i.e., a pronounced inhibition by
Manihot followed by
Pteridium, Abelmoschus and lastly
Hibiscus. The results could be explained by the presence of polyphenol compounds within the extracts (
Table 1,
Figure 6A–D). Indeed, when reacting with free radicals, it is well known that polyphenols are readily transformed into stable phenoxyl radicals and thus, can terminate the chain of lipid peroxidation. On the other hand, the polyphenols contained in the vegetables could equally be considered as responsible for the AOX activity as they can react either directly with the ascorbyl radical, that triggers the lipid peroxidation, and thus decrease the peroxidation level already at its initiation, or with the lipid peroxyl radicals resulting from the attack of linoleic acid by the ascorbyl radical. Additionally to the GC and DMPD findings, the data obtained with ESR illustrate and underline the efficiency of the studied extracts to hinder the propagation of lipoperoxidation, by inhibiting the formation of transient free radicals at the start of lipid peroxidation called “initiation”, with a subsequent decrease of lipoperoxidation by-products such as lipid hydroperoxides and volatile compounds.
Despite the difference in the methods used and in the amounts found, our findings are in agreement with those reported by investigations carried out on the presence of polyphenol and flavonoid in the vegetables that we tested and their AOX activities, particularly with regard to the variety
Hibiscus sabdariffa and
Abelmoschus, whereas those of
Manihot and
Pteridium remain poorly elucidated [
19,
20,
21,
22,
23,
24,
25,
26,
27,
28].
However, in the ESR-spin trap technique, a slight pro-oxidant effect was observed with
Abelmoschus and
Hibiscus at 5 µg/mL. It is well known that the same polyphenols that are well known to act efficiently against oxidation, can also be pro-oxidant, depending on their mechanisms of reaction and on the redox state of the system being studied [
45,
46].
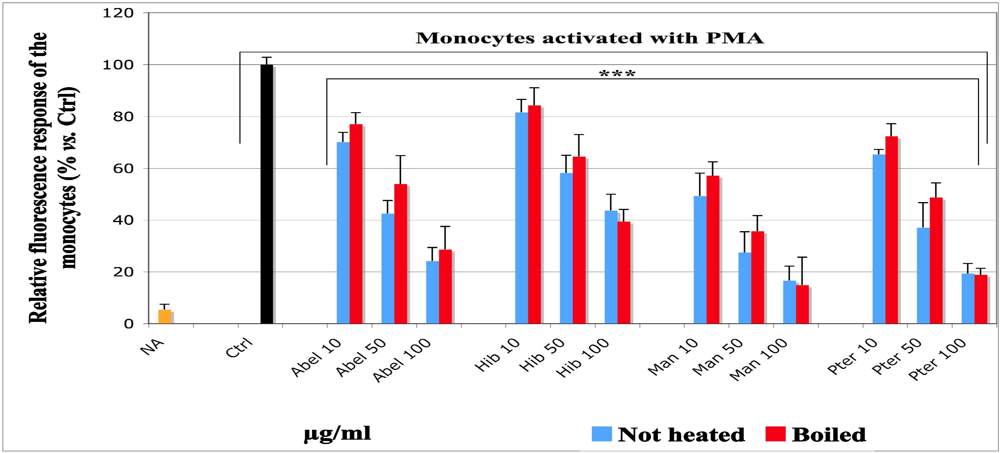
To investigate the inhibitory potential of the selected vegetables towards ROS production in “inflammation like” conditions, like those obtained from monocytes activated with phorbol ester (PMA), we adapted a model based on the description of Amado
et al. [
35]. Monocytes have a low level of myeloperoxidase, a powerful oxidant enzyme shared by the defense cells. The ROS amount produced by monocytes is quite low, whereas the control is required to be high enough to efficiently monitor the AOX activities of the selected vegetables and allow comparisons. Therefore, we used HRP as reaction enhancer, because monocytes have “
per se” a low ROS production and HRP enhances it. Our results show a significant decrease of fluorescence in a concentration-dependent manner, when the experiments were carried out in the presence of the extracts. This observation suggests that the extracts exert various AOX activities depending on their own polyphenol content, the mechanisms of reaction of their components, and the redox state of the reaction environment [
10,
11], particularly for
Manihot. Similar results were obtained for both moderately boiled and not heated samples, with slightly more inhibitory effect for the not heated ones.
Those findings are in agreement with literature data showing that some polyphenols contained in some fruit and vegetables act as efficient AOXs [
10,
11,
19,
20,
21,
22,
23,
24,
25,
47,
48]. Our cellular results suggest that the extracts might act directly on reactive species such as H
2O
2, which results from O
2− dismutation and can cross the cell membrane [
49,
50]. Moreover, the extracts may also act on the cellular enzymes responsible for ROS production, mainly NADPH-oxidase which is the principal producer of superoxide anion (O
2−). Other oxidant species like oxoferryl compounds generated by the reaction of peroxidase (HRP) and hydroxyl radical, which is not investigated in our study, could also have been scavenged by the polyphenols [
10,
11,
49,
50].
The effects of heat treatment on the AOX potential of polyphenols found in vegetal foodstuffs depend on the matrix of the foodstuff, the kind of the bonds between the antioxidant compounds and other components within the matrix, as well as on the level and duration of the heat treatment. The literature data reporting these effects still remain controversial [
51,
52,
53]. The findings issued from our model of heat treatment encourage cooking the tested green vegetables with moderate heat treatment rather than a sudden aggressive one, because such moderate heat processing might preserve the AOX potential of the polyphenols contained in those plants. At the same concentration, the little differences of AOX activity among the plants might be explained by the profile of polyphenols contained in each plant, and their mechanisms of chemical action [
10,
11]. The HPLC-UV/DAD analysis identified some polyphenol compounds contained in the leaf powders, whose standards were available in the system, and which are well known to display AOX activities. However, some eluted compounds remained unidentified and need further analysis.
5. Conclusion
The tested dietary plants were shown to contain polyphenols and flavonoids with well known AOX activities. In our lipid peroxidation model, the aqueous extracts of these plants significantly decreased the formation of typical markers of an advanced lipid peroxidation, such as lipid hydroperoxides and ethylene. Moreover, the extract solutions were shown to inhibit the formation of transient free radicals at an early stage of lipid peroxidation.
In our cellular model, the same plant extracts developed no cell toxicity and decreased the ROS production by activating monocytes (HL-60 cells). A low heat treatment did not sensitively impair the AOX and antiradical potential that we observed.
Our data provide first insights into the AOX and antiradical properties of Abelmoschus esculentus, Hibiscus acetosella, Manihot esculenta and Pteridium aquilinum in a model of a complete lipid peroxidation, as well as under cellular “inflammation like” conditions. They evidence the importance of achieving deeper views into the profile of the AOX compounds contained in these plants, because they are eaten in the Philippines, Indonesia, Malaysia, other Asian countries and Latin America. Particularly for migrants from Western and Central Africa living in Western Europe and for more than 200 million consumers in sub-Saharan Africa, Manihot leaves are the basic green vegetable. Moreover, these dietary plants are equally utilized in folk medicine. Thus, the role of these plants in folk medicine by sub-Saharan peoples as well as in the prevention of oxidative stress and ROS related diseases is worthy of further consideration.


