Dietary Habits, Nutrients and Bone Mass in Spanish Premenopausal Women: The Contribution of Fish to Better Bone Health

 ,
,  and
and
Abstract
:1. Introduction
2. Experimental Section
2.1. Subjects
2.2. Ultrasound Studies
2.3. Statistical Studies
3. Results
3.1. General Characteristics of the Study Population

| Mean ± SD | Range | Reference ranges | |
|---|---|---|---|
| Age (years) | 34.94 ± 9.89 | 18–54 | |
| Menarche age (years) | 12.13 ± 0.84 | 10–13 | |
| Gravidity | 1.32 ± 1.03 | 0–3 | |
| Births | 1.32 ± 1.01 | 0–3 | |
| Weight (kg) | 58.01 ± 5.10 | 46–70 | |
| Height (m) | 1.61 ± 0.06 | 1.45–1.80 | |
| BMI (kg/m2) | 22.36 ± 1.58 | 19.14–24.92 | |
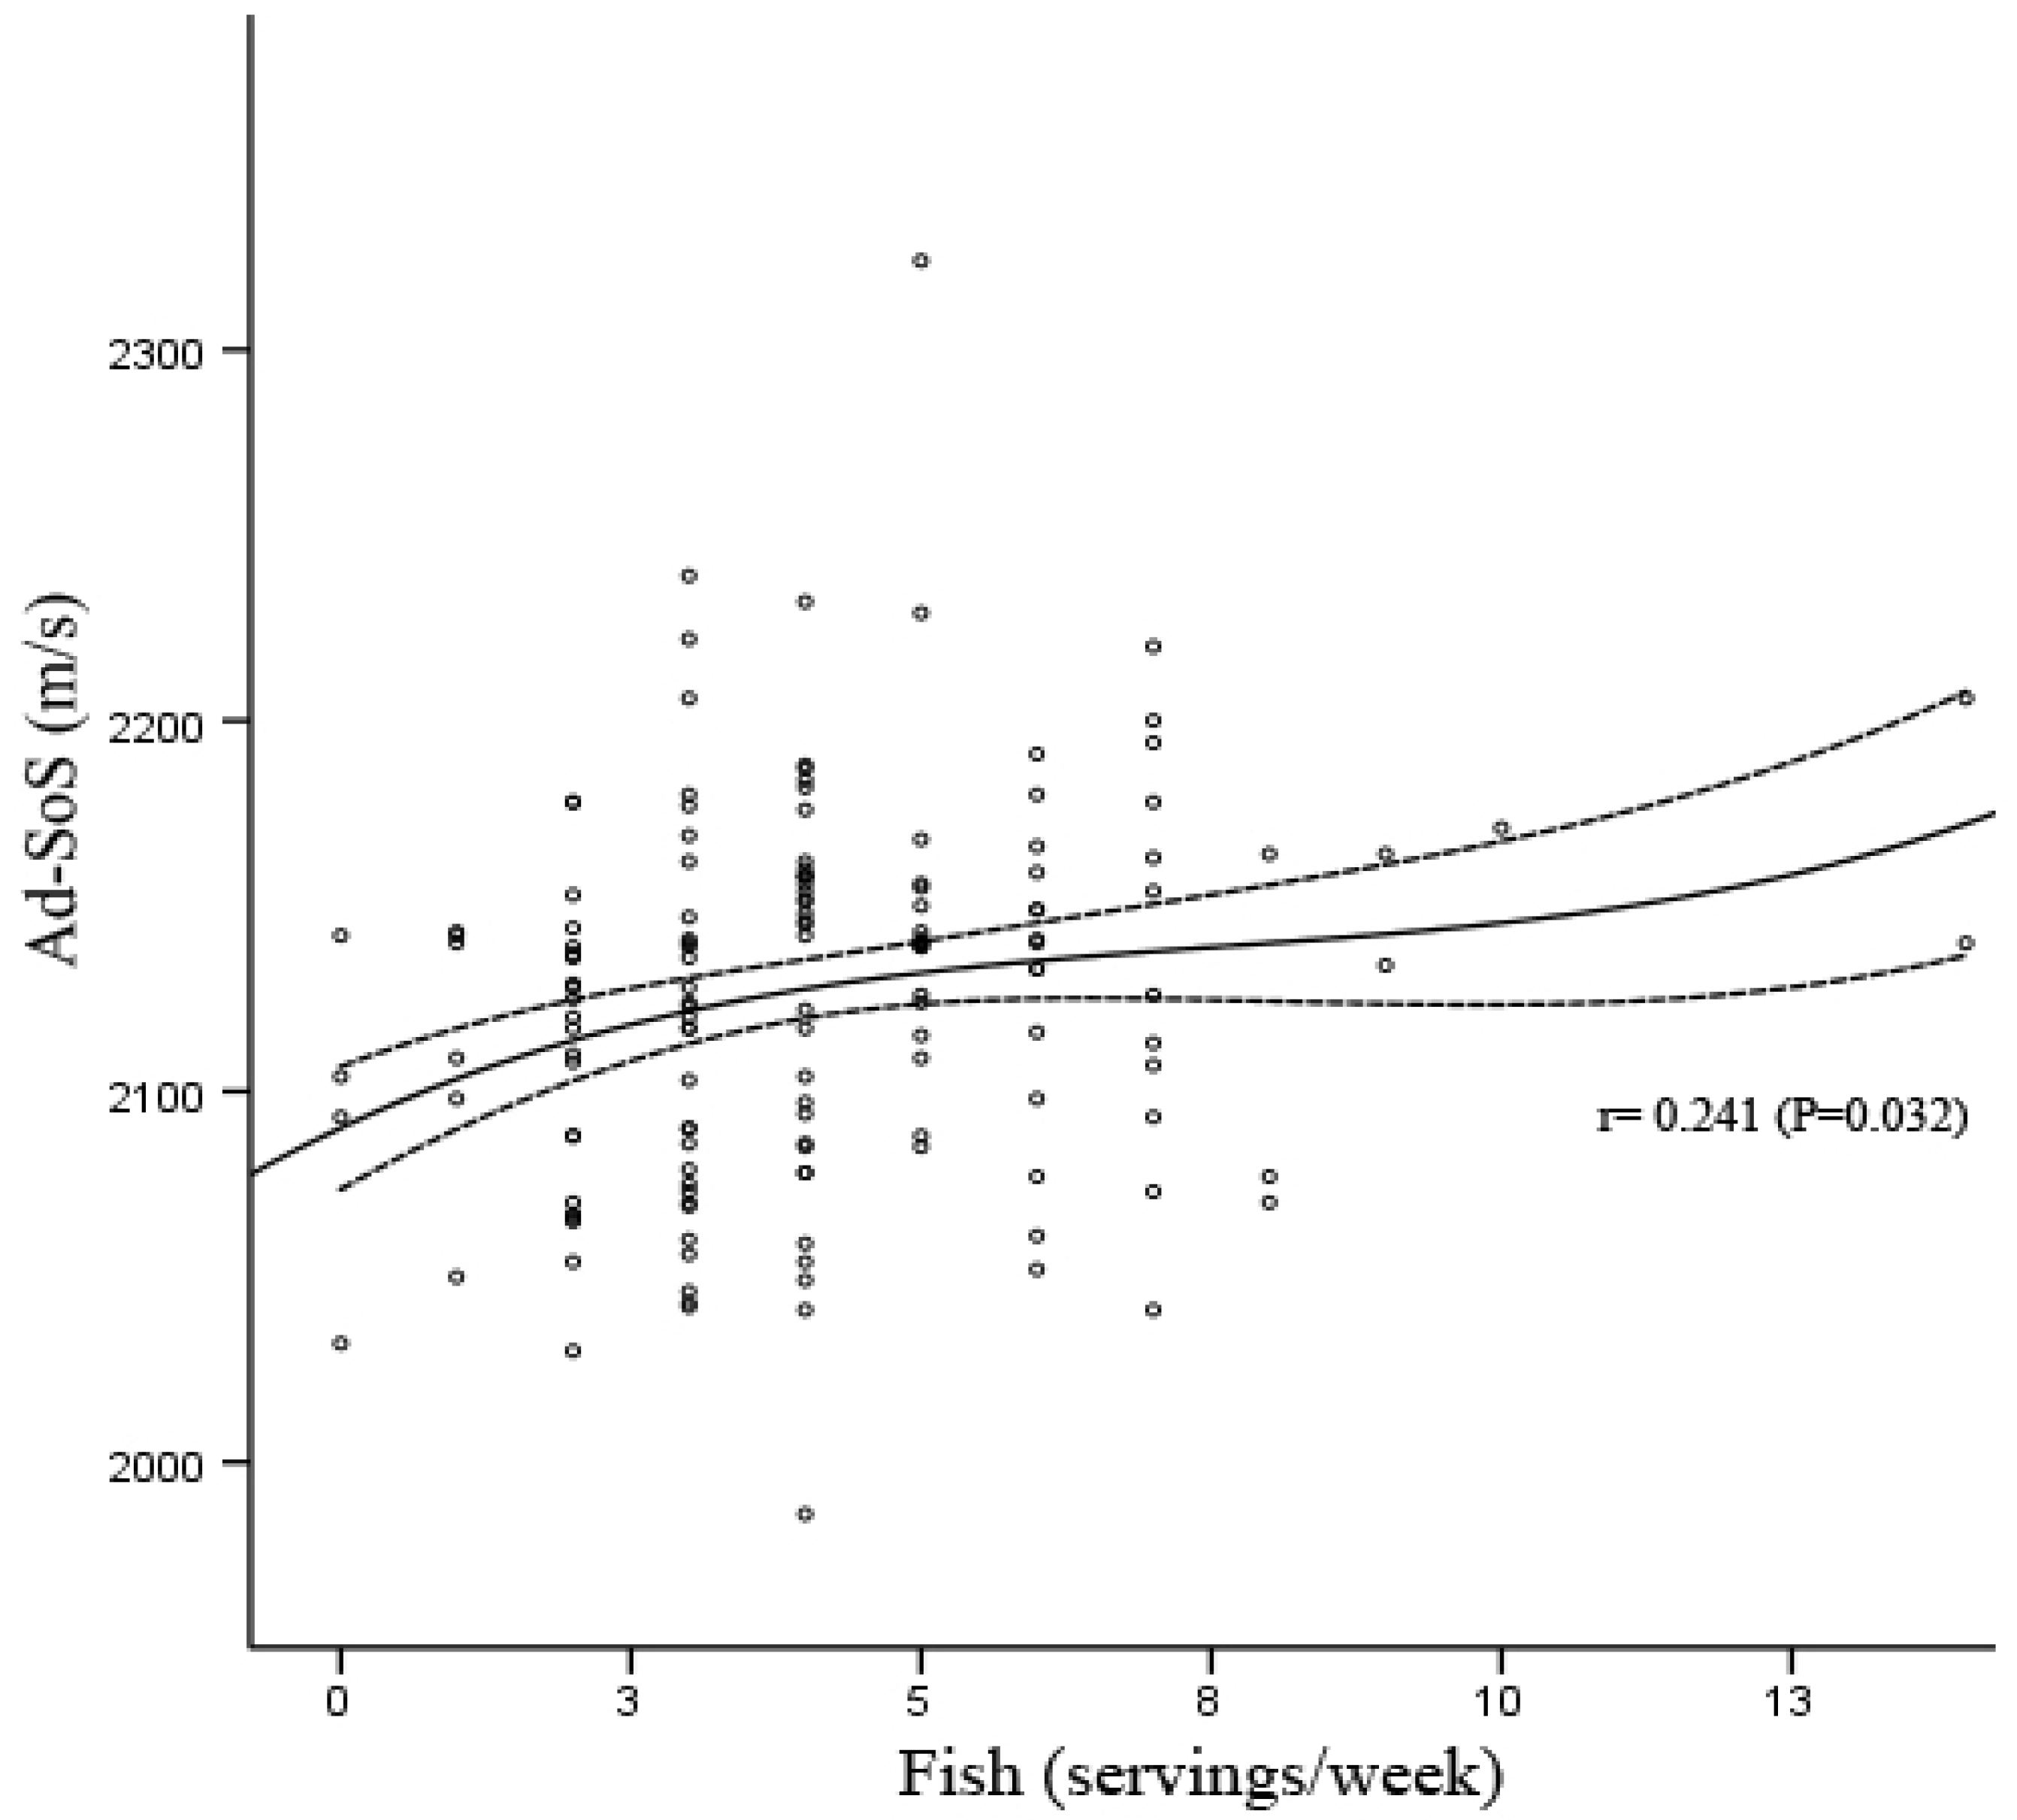
| Ad-SoS (m/s) | 2125.63 ± 49.83 | 1986–2324 | |
| Vitamin D (IU/day) | 252.02 ± 208.99 | 27.2–1356 | 200 |
| Vitamin E (mg/day) | 2.59 ± 0.86 | 1.05–5.80 | 8 |
| Ca (mg/day) | 880.58 ± 332.73 | 210–1481 | 800 |
| P (mg/day) | 1171.19 ± 304.3 | 553–2053 | 800 |
| Ca/P (mg/mg) | 0.74 ± 0.17 | 0.307–1.19 | ≥1 |
| Fe (mg/day) | 12.52 ± 4.2 | 5.42–28.86 | 17–21 |
| Zn (mg/day) | 8.62 ± 2.56 | 3.78–19.21 | 15 |
| Proteins (g/day) | 77 ± 19.94 | 37.05–152.47 | 47 |
| Ca/Proteins (mg/g) | 11.68 ± 4.29 | 3.48–26.09 | ≥20 |
| Proteins/weight (g/kg) | 1.34 ± 0.38 | 0.59–2.57 | |
| Fats (g/day) | 76.79 ± 19.70 | 27.94–128.33 | 90 |
| Carbohydrates (g/day) | 249.09 ± 74.44 | 86.1–410.50 | 330 |
| Kcal | 1986.85 ± 400.16 | 840.6–2582.40 | |
| I (μg/day) | 264.6 ± 215.25 | 6–960 | 140 |
| Mg (mg/day) | 230.58 ± 102.46 | 82–649.10 | 350 |
| F (μg/day) | 618.41 ± 282.39 | 143–2055 | 1500–3000 |
| Cu (mg/day) | 1.19 ± 1.33 | 0.30–8.41 | 2 |
| Se (μg/day) | 78.85 ± 32.02 | 22.2–176.40 | 55 |
| Folic acid (μg/day) | 144.45 ± 49.07 | 35–307.70 | 200 |
| Fats (servings per week) | 9.52 ± 3.50 | 1–25 | |
| Dairy (servings per week) | 12.6 ± 4.88 | 2–28 | 18–24 |
| Meat (servings per week) | 8.44 ± 3.39 | 1–20 | 3–4 |
| Fish (servings per week) | 4.17 ± 2.26 | 0–14 | 3–4 |
| Cereal (servings per week) | 13.01 ± 4.73 | 3–29 | 28–42 |
| Fruit (servings per week) | 10.58 ± 6.07 | 1–32 | >21 |
| Vegetables (servings per week) | 8.63 ± 5.66 | 0–33 | >14 |
| Sugars (servings per week) | 10.11 ± 5.31 | 0–28 | |
| Eggs (servings per week) | 1.97 ± 1.31 | 0–7 | 3–4 |
| Beer (servings per week) | 2.42 ± 3.41 | 0–18 | |
| Wine (servings per week) | 0.61 ± 1.65 | 0–11 |
| Fish (servings/week) | ||||||||
|---|---|---|---|---|---|---|---|---|
| 0–2 (n = 32) | 3–4 (n = 65) | 5–7 (n = 46) | 8–14 (n = 8) | |||||
| Mean (SD) | Range | Mean (SD) | Range | Mean (SD) | Range | Mean (SD) | Range | |
| Age (years) | 34.22 (10.13) | 18–48 | 35.11 (10.26) | 18–54 | 35.07 (9.29) | 18–50 | 35.75 (10.89) | 22–50 |
| Menarche age (years) | 12.03 (0.82) | 11–13 | 12.15 (0.78) | 10–13 | 12.24 (0.82) | 11–13 | 11.63 (1.30) | 10–13 |
| Gravidities | 1 (1) | 0–3 | 2 (1) | 0–3 | 1 (1) | 0–3 | 2 (0) | 2–2 |
| Births | 1 (1) | 0–3 | 2 (1) | 0–3 | 1 (1) | 0–2 | 2 (0) | 2–2 |
| Weight (kg) | 56.99 (4.44) | 49.80–65 | 58.82 (5.12) | 46.80–69 | 57.63 (5.47) | 46–70 | 57.54 (5.08) | 48–63 |
| Height (m) | 1.60 (0.06) | 1.46–1.74 | 1.61 (0.06) | 1.50–1.71 | 1.62 (0.07) | 1.45–1.80 | 1.61 (0.05) | 1.55–1.70 |
| BMI (kg/m2) | 22.28 (1.55) | 19.32–24.92 | 22.62 (1.51) | 19.56–24.89 | 22.05 (1.66) | 19.15–24.80 | 22.30 (1.68) | 19.98–24.13 |
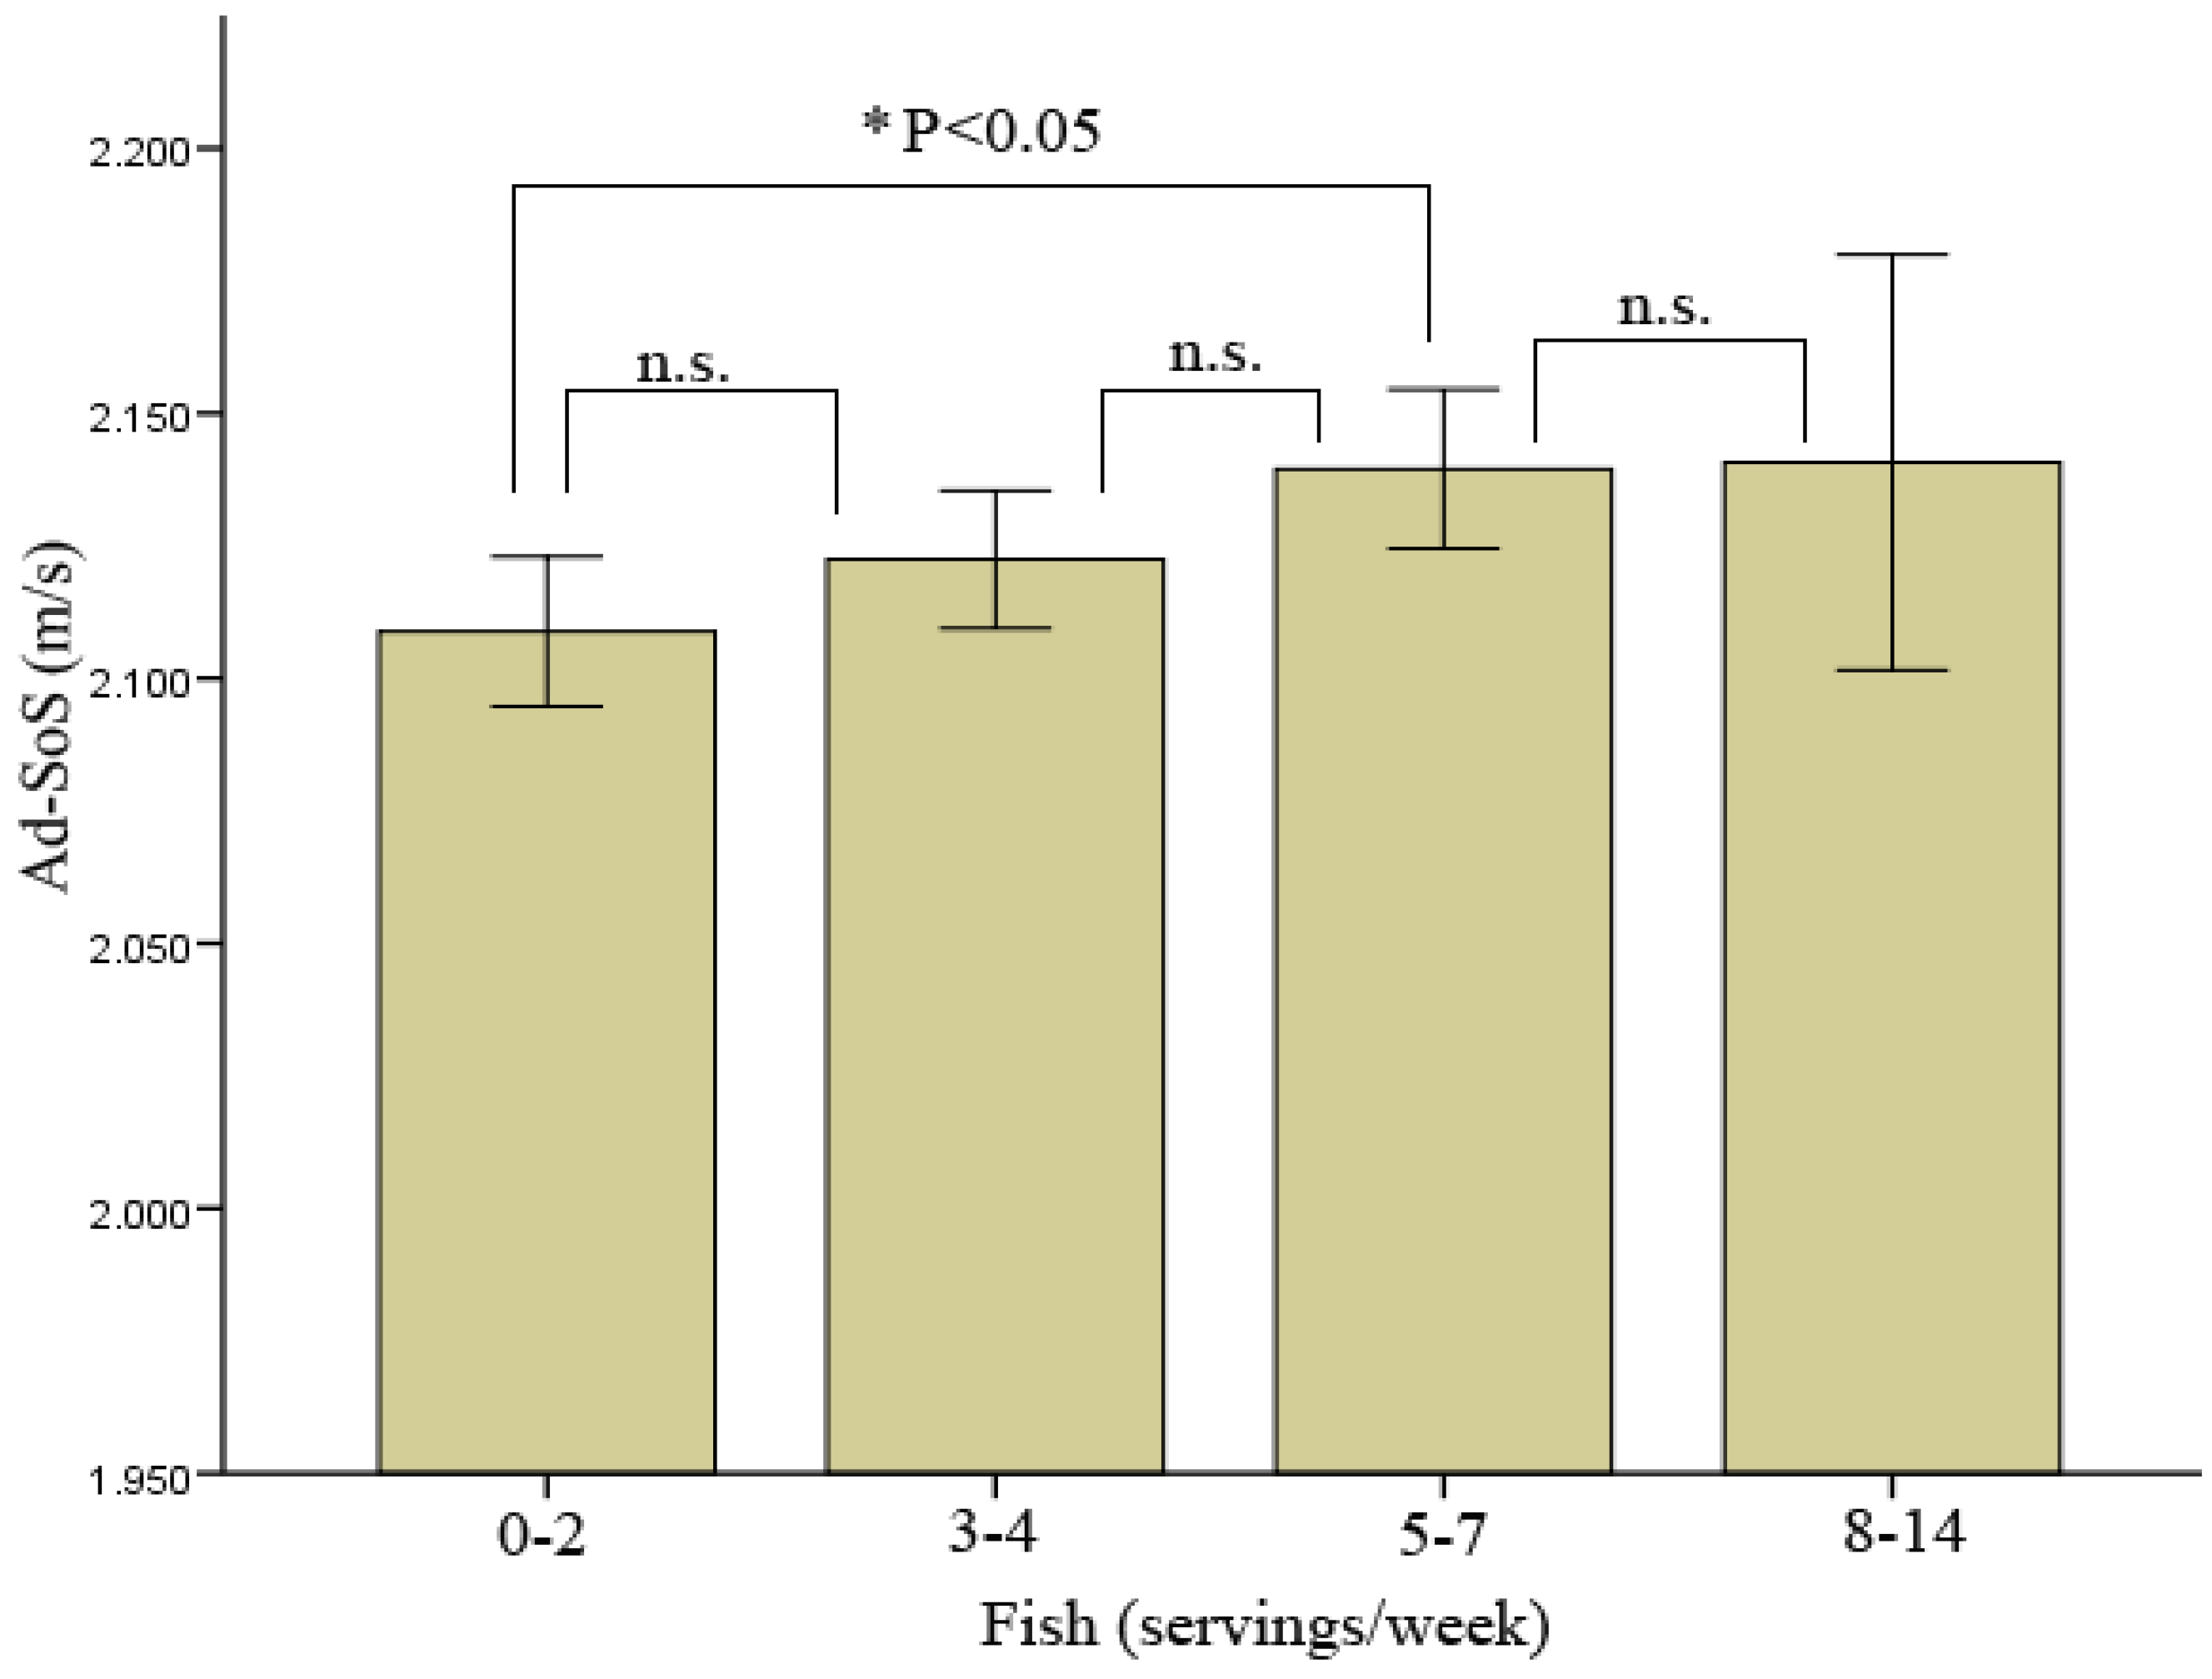
| Ad-SoS (m/s) | 2108.84 (39.20) | 2030–2178 | 2122.43 (52.51) | 1986–2239 | 2139.51 (50.07) | 2041–2324 | 2140.75 (46.86) | 2070–2206 |
| Fish (servings/week) | ||||||||
|---|---|---|---|---|---|---|---|---|
| 0–2 (n = 32) | 3–4 (n = 65) | 5–7 (n = 46) | 8–14 (n = 8) | |||||
| Mean (SD) | Range | Mean (SD) | Range | Mean (SD) | Range | Mean (SD) | Range | |
| 191.30 (142.46) | (32–580.80) | 215.78 (170.59) | (27.20–920) | 325.84 (246.79) | (52.80–1356) | 364.95 (330.21) | (82.40–1092) | |
| Vitamin E (mg/day) | 2.41 (0.91) | (1.22–5.80) | 2.60 (0.85) | (1.06–5.15) | 2.62 (0.87) | (1.06–4.94) | 3.08 (0.45) | (2.45–3.75) |
| Ca (mg/day) | 812.34 (372.22) | (238–1478) | 874.35 (317.96) | (226–1481) | 933.70 (327.68) | (210–1474) | 898.75 (322.02) | (421–1332) |
| P (mg/day) | 1067.47 (313.41) | (594–2053) | 1151.31 (296.20) | (553–1786) | 1241.74 (292.63) | (625–1987) | 1341.88 (278.92) | (936–1669) |
| Ca/P (mg/mg) | 0.74 (0.22) | (0.32–1.19) | 0.75 (0.16) | (0.31–1.05) | 0.74 (0.15) | (0.31–1.01) | 0.65 (0.17) | (0.44–0.98) |
| Fe (mg/day) | 12.30 (5.03) | (5.44–26.59) | 12.21 (4.07) | (5.42–25.69) | 12.90 (4) | (7.89–28.86) | 13.70 (2.92) | (10.76–18.87) |
| Zn (mg/day) | 7.63 (2.34) | (3.78–12.92) | 8.48 (2.20) | (4.13–15.93) | 9.10 (2.82) | (5.03–19.21) | 10.97 (2.88) | (7.44–15.10) |
| Proteins (g/day) | 67.69 (18.56) | (37.72–121.31) | 75.56 (20.12) | (37.05–135.40) | 81.08 (14.90) | (44.79–117.88) | 102.42 (24.53) | (74.85–152.47) |
| Ca/Proteins (mg/g) | 12.50 (5.86) | (3.77–26.09) | 11.77 (3.78) | (3.48–22.15) | 11.50 (3.75) | (3.55–20.88) | 8.73 (2.84) | (5.38–14.28) |
| Proteins/weight (g/kg) | 1.20 (0.35) | (0.59–2.11) | 1.30 (0.39) | (0.64–2.46) | 1.42 (0.31) | (0.68–2.09) | 1.79 (0.41) | (1.23–2.57) |
| Fats (g/day) | 72.40 (21.19) | (27.94–115.34) | 75.91 (20.73) | (33.86–128.33) | 79.44 (18.09) | (42.01–121.13) | 86.20 (7.07) | (75.38–98.30) |
| Carbohydrates (g/day) | 218.66 (71.37) | (86.10–400.20) | 255.28 (66.47) | (130.30–380.40) | 247.90 (79.63) | (98.20–384) | 324.28 (62.45) | (217.60–410.50) |
| Kcal | 1770.22 (417.13) | (840.60–2484) | 2015.52 (374.22) | (1273.30–2577.40) | 2029.78 (378.89) | (1093–2560) | 2373.63 (228.79) | (2055.60–2582.40) |
| I (μg/day) | 216.81 (187.07) | (6–681) | 260.61 (217.11) | (6–705) | 312.22 (238.42) | (9–960) | 219.75 (125.16) | (35–346) |
| Mg (ng/day) | 221.88 (102.37) | (82–599.20) | 233.60 (104.57) | (104.90–627.80) | 233.88 (107.12) | (110.30–649.10) | 221.84 (64.96) | (153.80–337.20) |
| F (μg/day) | 459.41 (251.52) | (165–1335) | 615.10 (253.67) | (143.00–1389) | 644.00 (187.62) | (257–1082) | 1134.25 (435.84) | (508–2055) |
| Cu (mg/day) | 1.12 (1.42) | (0.30–8.41) | 1.24 (1.35) | (0.37–6.99) | 1.21 (1.39) | (0.39–7.93) | 1.05 (0.47) | (0.54–1.78) |
| Se (μg/day) | 64.42 (28.93) | (22.20–127) | 78.40 (30.71) | (22.90–141.90) | 83.53 (28.54) | (25.80–141.30) | 113.31 (44.06) | (57.10–176.40) |
| Folic acid (μg/day) | 135.78 (52.39) | (63.60–256.30) | 143.50 (47.42) | (35–307.70) | 148.50 (45.47) | (75.90–279) | 163.48 (68.72) | (87.70–293.60) |
| (servings per week) | Fish (servings/week) | |||||||
|---|---|---|---|---|---|---|---|---|
| 0–2 (n = 32) | 3–4 (n = 65) | 5–7 (n = 46) | 8–14 (n = 8) | |||||
| Mean (SD) | Range | Mean (SD) | Range | Mean (SD) | Range | Mean (SD) | Range | |
| Fats | 8.44 (3.36) | (1–20) | 9.48 (3.10) | (2–19) | 9.96 (3.43) | (5–22) | 11.75 (6.04) | (7–25) |
| Dairy | 10.56 (4.99) | (2–20) | 12.77 (4.05) | (3–27) | 13.24 (5.35) | (2–28) | 15.63 (5.80) | (5–22) |
| Meat | 8.22 (3.87) | (1–15) | 8.48 (3.27) | (2–20) | 8.28 (3.19) | (1–18) | 10.14 (3.67) | (4–14) |
| Fish | 1.56 (0.72) | (0–2) | 3.51 (0.50) | (3–4) | 5.89 (0.82) | (5–7) | 10 (2.56) | (8–14) |
| Cereal | 12.34 (3.92) | (5–20) | 12.69 (4.34) | (4–22) | 13.26 (5.14) | (3–24) | 16.75 (7.11) | (5–29) |
| Fruit | 9.22 (4.95) | (1–22) | 10.85 (5.61) | (2–23) | 10.93 (6.44) | (2–29) | 11.88 (10.76) | (1–32) |
| Vegetables | 6 (4.59) | (0–19) | 8.43 (5.60) | (0–24) | 10.13 (4.99) | (2–24) | 12.71 (9.52) | (4–33) |
| Sugars | 8.97 (4.51) | (0–16) | 10.20 (5.15) | (1–21) | 11.11 (5.95) | (1–28) | 8.25 (5.15) | (2–16) |
| Eggs | 1.66 (1.12) | (0–5) | 1.92 (1.35) | (0–7) | 2.04 (1.30) | (0–6) | 3.25 (1.04) | (2–4) |
| Beer | 2.44 (3.20) | (0–15) | 2.37 (3.63) | (0–16) | 2.39 (3.51) | (0–18) | 2.88 (2.03) | (0–7) |
| Wine | 0.56 (2.02) | (0–11) | 0.32 (1.03) | (0–6) | 0.80 (1.72) | (0–9) | 2 (2.88) | (0–7) |
3.2. Anthropometric Characteristics, Nutrient Intake and Dietary Habits Stratified by Fish Consumption

| Fish (servings/week) | ||||
|---|---|---|---|---|
| 0–2 (n = 32) | 3–4 (n = 65) | 5–7 (n = 46) | 8–14 (n = 8) | |
| Ad-SoS (m/s) | P < 0.05 vs. (0–2) | |||
| Vitamin D (IU/day) | P < 0.05 vs. (0–2) and (3–4) | |||
| Zn (mg/day) | P < 0.05 vs. (0–2) and (3–4) | |||
| Proteins (g/day) | P < 0.05 vs. (0–2) | P < 0.05 vs. (0–2), (3–4) and (5–7) | ||
| Proteins/weight (g/kg) | P < 0.05 vs. (0–2) | P < 0.05 vs. (0–2) and (3–4) | ||
| Carbohydrates (g/day) | P < 0.05 vs. (0–2) and (5–7) | |||
| Kcal | P < 0.05 vs. (0–2) | P < 0.05 vs. (0–2) | P < 0.05 vs. (0–2) | |
| F (μg/day) | P < 0.05 vs. (0–2) | P < 0.05 vs. (0–2) | P < 0.05 vs. (0–2), (3–4) and (5–7) | |
| Cu (mg/day) | P < 0.05 vs. (0–2) | P < 0.05 vs. (0–2) and (3–4) | ||
| Se (μg/day) | P < 0.05 vs. (0–2) | |||
| Vegetables (servings per week) | P < 0.05 vs. (0–2) | P < 0.05 vs. (0–2) | ||
| Eggs (servings per week) | P < 0.05 vs. (0–2) and (3–4) | |||
| Wine (servings per week) | P < 0.05 vs. (3–4) | |||

4. Discussion
5. Conclusions
Conflict of Interest
References
- Varela-Moreiras, G.; Avila, J.M.; Cuadrado, C.; del, P.S.; Ruiz, E.; Moreiras, O. Evaluation of food consumption and dietary patterns in Spain by the Food Consumption Survey: Updated information. Eur. J. Clin. Nutr. 2010, 64, S37–S43. [Google Scholar] [CrossRef]
- New, S.A.; Bonjour, J.P. Nutritional Aspects of Bone Health; Royal Society of Chemistry: Cambridge, UK, 2003. [Google Scholar]
- Geelen, A.; Schouten, J.M.; Kamphuis, C.; Stam, B.E.; Burema, J.; Renkema, J.M.; Bakker, E.J.; van’t Veer, P.; Kampman, E. Fish consumption, n-3 fatty acids, and colorectal cancer: A meta-analysis of prospective cohort studies. Am. J. Epidemiol. 2007, 166, 1116–1125. [Google Scholar] [CrossRef]
- Goede, G.J.; Verschuren, W.M.; Boer, J.M.; Kromhout, D.; Geleijnse, J.M. Gender-specific associations of marine n-3 fatty acids and fish consumption with 10-year incidence of stroke. PLoS One 2012, 7, e33866. [Google Scholar]
- Folsom, A.R.; Demissie, Z. Fish intake, marine omega-3 fatty acids, and mortality in a cohort of postmenopausal women. Am. J. Epidemiol. 2004, 160, 1005–1010. [Google Scholar] [CrossRef]
- Chen, Y.M.; Ho, S.C.; Lam, S.S. Higher sea fish intake is associated with greater bone mass and lower osteoporosis risk in postmenopausal Chinese women. Osteoporos. Int. 2010, 21, 939–946. [Google Scholar] [CrossRef]
- Hyun, T.H.; Barrett-Connor, E.; Milne, D.B. Zinc intakes and plasma concentrations in men with osteoporosis: The Rancho Bernardo Study. Am. J. Clin. Nutr. 2004, 80, 715–721. [Google Scholar]
- Farina, E.K.; Kiel, D.P.; Roubenoff, R.; Schaefer, E.J.; Cupples, L.A.; Tucker, K.L. Protective effects of fish intake and interactive effects of long-chain polyunsaturated fatty acid intakes on hip bone mineral density in older adults: the Framingham Osteoporosis Study. Am. J. Clin. Nutr. 2011, 93, 1142–1151. [Google Scholar] [CrossRef]
- Hogstrom, M.; Nordstrom, P.; Nordstrom, A. n-3 Fatty acids are positively associated with peak bone mineral density and bone accrual in healthy men: The NO2 Study. Am. J. Clin. Nutr. 2007, 85, 803–807. [Google Scholar]
- Virtanen, J.K.; Mozaffarian, D.; Cauley, J.A.; Mukamal, K.J.; Robbins, J.; Siscovick, D.S. Fish consumption, bone mineral density, and risk of hip fracture among older adults: The cardiovascular health study. J. Bone Miner. Res. 2010, 25, 1972–1979. [Google Scholar] [CrossRef]
- Suzuki, T.; Yoshida, H.; Hashimoto, T.; Yoshimura, N.; Fujiwara, S.; Fukunaga, M.; Nakamura, T.; Yoh, K.; Inoue, T.; Hosoi, T.; Orimo, H. Case-control study of risk factors for hip fractures in the Japanese elderly by a Mediterranean Osteoporosis Study (MEDOS) questionnaire. Bone 1997, 21, 461–467. [Google Scholar] [CrossRef]
- Zalloua, P.A.; Hsu, Y.H.; Terwedow, H.; Zang, T.; Wu, D.; Tang, G.; Li, Z.; Hong, X.; Azar, S.T.; Wang, B.; Bouxsein, M.L.; Brain, J.; Cummings, S.R.; Rosen, C.J.; Xu, X. Impact of seafood and fruit consumption on bone mineral density. Maturitas 2007, 56, 1–11. [Google Scholar] [CrossRef]
- Fujiwara, S.; Kasagi, F.; Yamada, M.; Kodama, K. Risk factors for hip fracture in a Japanese cohort. J. Bone Miner. Res. 1997, 12, 998–1004. [Google Scholar] [CrossRef]
- Hu, F.B. Dietary pattern analysis: A new direction in nutritional epidemiology. Curr. Opin. Lipidol. 2002, 13, 3–9. [Google Scholar] [CrossRef]
- Pedrera Zamorano, J.D.; Canal Macias, M.L.; Lavado Garcia, J.M.; Costa, F.C.; Borrella, D.S.; Rico, L.H. Reference curve of bone ultrasound measurements in proximal phalanges in normal Spanish women. J. Clin. Densitom. 2003, 6, 373–380. [Google Scholar] [CrossRef]
- Pedrera, J.D.; Canal, M.L.; Postigo, S.; Lavado, J.; Hernandez, E.R.; Rico, H. Phalangeal bone ultrasound and its possible correlation with nutrient in an area of high protein intake. Ann. Nutr. Metab. 2001, 45, 86–90. [Google Scholar] [CrossRef]
- Rico, H.; Canal, M.L.; Manas, P.; Lavado, J.M.; Costa, C.; Pedrera, J.D. Effects of caffeine, vitamin D, and other nutrients on quantitative phalangeal bone ultrasound in postmenopausal women. Nutrition 2002, 18, 189–193. [Google Scholar] [CrossRef]
- Fishery and Aquaculture Statistics, 2009; Food and Agriculture Organization: Rome, Italy, 2012.
- Aranceta, J.; Pérez Rodrigo, C.; Eguileor, I.; Marzana, I.; González de Galdeano, L.; Saenz de Buruaga, J. Food consumption patterns in the adult population of the Basque Country (EINUT-I). Public Health Nutr. 1998, 1, 185–192. [Google Scholar]
- Terano, T. Effect of omega 3 polyunsaturated fatty acid ingestion on bone metabolism and osteoporosis. World Rev. Nutr. Diet. 2001, 88, 141–147. [Google Scholar] [CrossRef]
- Sudo, A.; Miyamoto, N.; Kasai, Y.; Yamakawa, T.; Uchida, A. Comparison of bone mineral density among residents of a mountain village and a fishing village in Japan. J. Orthop. Surg. (Hong Kong) 2003, 11, 6–9. [Google Scholar]
- Consumption patterns and the principal sources of lipids and fatty acids in the Spanish cohort of the European Prospective Investigation on Diet and Cancer (EPIC). The EPIC Group in Spain. Med. Clin. (Barc.) 1999, 112, 125–132.
- Rodriguez, S.M.; Beltran de, M.B.; Cuadrado, V.C.; Moreiras, T.O. Influence of sun exposure and diet to the nutritional status of vitamin D in adolescent Spanish women: The five countries study (OPTIFORD Project). Nutr. Hosp. 2010, 25, 755–762. [Google Scholar]
- Relea, P.; Revilla, M.; Ripoll, E.; Arribas, I.; Villa, L.F.; Rico, H. Zinc, biochemical markers of nutrition, and type I osteoporosis. Age Ageing 1995, 24, 303–307. [Google Scholar] [CrossRef]
- Saltman, P.D.; Strause, L.G. The role of trace minerals in osteoporosis. J. Am. Coll. Nutr. 1993, 12, 384–389. [Google Scholar]
- Salari, P.; Rezaie, A.; Larijani, B.; Abdollahi, M. A systematic review of the impact of n-3 fatty acids in bone health and osteoporosis. Med. Sci. Monit. 2008, 14, RA37–RA44. [Google Scholar]
- Kruger, M.C.; Horrobin, D.F. Calcium metabolism, osteoporosis and essential fatty acids: A review. Prog. Lipid Res. 1997, 36, 131–151. [Google Scholar] [CrossRef]
- Orchard, T.S.; Cauley, J.A.; Frank, G.C.; Neuhouser, M.L.; Robinson, J.G.; Snetselaar, L.; Tylavsky, F.; Wactawski-Wende, J.; Young, A.M.; Lu, B.; Jackson, R.D. Fatty acid consumption and risk of fracture in the Women’s Health Initiative. Am. J. Clin. Nutr. 2010, 92, 1452–1460. [Google Scholar] [CrossRef]
- Hannan, M.T.; Tucker, K.L.; Dawson-Hughes, B.; Cupples, L.A.; Felson, D.T.; Kiel, D.P. Effect of dietary protein on bone loss in elderly men and women: The Framingham Osteoporosis Study. J. Bone. Miner. Res. 2000, 15, 2504–2512. [Google Scholar] [CrossRef]
- Metz, J.A.; Anderson, J.J.; Gallagher, P.N., Jr. Intakes of calcium, phosphorus, and protein, and physical-activity level are related to radial bone mass in young adult women. Am. J. Clin. Nutr. 1993, 58, 537–542. [Google Scholar]
- Beasley, J.M.; Ichikawa, L.E.; Ange, B.A.; Spangler, L.; LaCroix, A.Z.; Ott, S.M.; Scholes, D. Isprotein intake associated with bone mineral density in young women? Am. J. Clin. Nutr. 2010, 91, 1311–1316. [Google Scholar] [CrossRef]
© 2013 by the authors; licensee MDPI, Basel, Switzerland. This article is an open-access article distributed under the terms and conditions of the Creative Commons Attribution license (http://creativecommons.org/licenses/by/3.0/).
Share and Cite
Calderon-Garcia, J.F.; Moran, J.M.; Roncero-Martin, R.; Rey-Sanchez, P.; Rodriguez-Velasco, F.J.; Pedrera-Zamorano, J.D. Dietary Habits, Nutrients and Bone Mass in Spanish Premenopausal Women: The Contribution of Fish to Better Bone Health. Nutrients 2013, 5, 10-22. https://doi.org/10.3390/nu5010010
Calderon-Garcia JF, Moran JM, Roncero-Martin R, Rey-Sanchez P, Rodriguez-Velasco FJ, Pedrera-Zamorano JD. Dietary Habits, Nutrients and Bone Mass in Spanish Premenopausal Women: The Contribution of Fish to Better Bone Health. Nutrients. 2013; 5(1):10-22. https://doi.org/10.3390/nu5010010
Chicago/Turabian StyleCalderon-Garcia, Julian F., Jose M. Moran, Raul Roncero-Martin, Purificacion Rey-Sanchez, Francisco J. Rodriguez-Velasco, and Juan D. Pedrera-Zamorano. 2013. "Dietary Habits, Nutrients and Bone Mass in Spanish Premenopausal Women: The Contribution of Fish to Better Bone Health" Nutrients 5, no. 1: 10-22. https://doi.org/10.3390/nu5010010