Zinc, Iron and Vitamins A, C and E Are Associated with Obesity, Inflammation, Lipid Profile and Insulin Resistance in Mexican School-Aged Children

Abstract
:1. Introduction
2. Materials and Methods
2.1. Subjects and Experimental Design
2.2. Anthropometry and Body Composition
2.3. Blood Pressure
2.4. Blood Analysis
2.5. Socioeconomic Status
2.6. Diet Evaluation
2.7. Physical Activity
2.8. Statistical Analysis
3. Results

| Characteristics | Means | SD 1 |
|---|---|---|
| Demography | ||
| Age, months | 99 | 16.6 |
| Crowding 2, ppr 3 | 2.94 | 1.57 |
| Father’s education, years | 7.15 | 2.82 |
| Mother’s education, years | 6.67 | 2.58 |
| Anthropometry | ||
| Weight, kg | 29.49 | 1.30 |
| Height, m | 128.06 | 8.85 |
| BMI 2, kg/cm2 | 18.07 | 1.18 |
| BMI for age, Z-score | 0.99 | 1.21 |
| Waist 2, cm | 63.88 | 1.15 |
| Waist to height ratio 2 | 50.00 | 1.11 |
| Body Composition | ||
| Body fat, % | 31.13 | 6.40 |
| Abdominal fat 2, kg | 436.76 | 1.73 |
| Clinical and biochemical measures | ||
| Systolic 2, mmHg | 91.15 | 1.11 |
| Diastolic 2, mmHg | 63.34 | 1.11 |
| C-reactive protein 2, mg/dL | 1.62 | 2.03 |
| Glucose, mg/dL | 68.23 | 6.89 |
| Triglycerides 2, mg/dL | 87.56 | 1.56 |
| Total cholesterol, mg/dL | 128.75 | 29.50 |
| Low density lipoproteins, mg/dL | 77.18 | 19.74 |
| High density lipoproteins, mg/dL | 47.08 | 10.35 |
| Insulin 2, µIU/mL | 3.39 | 1.47 |
| HOMA 2 | 0.57 | 1.50 |
| Micronutrient concentrations | ||
| Vitamin A, µg/dL | 29.72 | 7.20 |
| Vitamin C, µg/mL | 4.25 | 1.51 |
| Vitamin E, µg/mL | 5.80 | 1.42 |
| Vitamin E:lipids ratio mg/g | 2.68 | 0.68 |
| Iron, µg/dL | 87.78 | 29.07 |
| Zinc, µg/dL | 74.38 | 13.29 |
| Physical activity | ||
| Vigorous, h/day | 3.11 | 4.03 |
| Moderate, h/day | 11.93 | 8.73 |
| Light, h/day | 48.62 | 11.22 |
| Micronutrient status | % |
|---|---|
| Vitamin A < 20 µg/dL | 7.1 |
| Vitamin C < 4 µg/mL | 38.1 |
| Vitamin C < 2 µg/mL | 8.1 |
| Vitamin E < 5 µg/mL | 32.5 |
| Vitamin E < 3 µg/mL | 2.0 |
| Vitamin E:lipids < 0.8 mg/g | 0.0 |
| Iron < 60 µg/dL | 17.9 |
| Iron < 45 µg/dL | 6.6 |
| Zinc < 65 µg/dL | 24.9 |
| Nutrient intake | Means | 95% CI |
|---|---|---|
| Energy (kcal) 1 | 1529.70 | 1472.2, 1588.7 |
| Carbohydrates (g) 1,2 | 228.8 | 225.1, 232.7 |
| % Energy from carbohydrates | 59.4 | 58.5, 60.2 |
| Protein (g) 1,2 | 48.7 | 47.4, 49.9 |
| % Energy from protein | 12.8 | 12.4, 13.1 |
| Fat (g) 1,2 | 47.0 | 45.6, 48.4 |
| % Energy from fat | 27.9 | 27.1, 28.7 |
| Fiber (g) 1,2 | 12.8 | 12.2, 13.5 |
| Calcium (mg) 1,2 | 707.0 | 682.1, 732.8 |
| Iron (mg) 1,2 | 10.7 | 10.4, 11.1 |
| Zinc (mg) 2 | 5.1 | 3.5, 6.8 |
| Vitamin A (µg) 1,2 | 419.5 | 390.0, 451.0 |
| Vitamin C (mg) 1,2 | 44.1 | 40.0, 48.6 |
| Vitamin E (mg) 1,2 | 2.8 | 2.6, 3.0 |
| Nutrient intake below RI 3 | ||
| Calcium | 75.1% | |
| Iron | 77.2% | |
| Zinc | 92.9% | |
| Vitamin A | 52.8% | |
| Vitamin C | 29.9% | |
| Vitamin E | 98.0% | |
| Variables | Vitamin A (µg/dL) | Vitamin E (µg/mL) | Vitamin E:Lipids ratio | Vitamin C (µg/mL) | Iron (µg/dL) | Zinc (μg/dL) |
|---|---|---|---|---|---|---|
| BMI, Kg/cm2 | 0.223 * | 0.115 | −0.426 * | −0.116 | −0.137 | 0.028 |
| BMI for age, Zscore | 0.219 * | 0.100 | −0.423 * | −0.077 | −0.119 | 0.044 |
| Waist, cm | 0.178 * | 0.116 | −0.435 * | −0.142 | −0.128 | 0.048 |
| Waist to height ratio | 0.178 * | 0.080 * | −0.443 * | −0.157 * | −0.114 | 0.03 |
| Body fat, % | 0.116 | 0.081 | −0.441 * | −0.231 * | −0.092 | −0.026 |
| Abdominal fat, Kg | 0.192 * | 0.137 | −0.413 * | −0.204 * | −0.111 | 0.004 |
| CRP, mg/dL 2 | −0.248 * | −0.188 * | 0.096 | −0.143 * | −0.285 * | −0.085 |
| Glucose, mg/dL | 0.011 | 0.050 | 0.029 | 0.141 | −0.153 * | 0.031 |
| Triglycerides, mg/dL | 0.332 * | 0.428 * | −0.542 * | 0.030 | 0.023 | 0.118 |
| Total cholesterol, mg/dL | 0.340 * | 0.500 * | −0.449 * | 0.041 | 0.090 | 0.224 * |
| HDL, mg/dL 2 | 0.125 | 0.247 * | 0.215 * | 0.150 * | 0.184 * | 0.166 * |
| LDL, mg/dL 2 | 0.309 * | 0.438 * | −0.441 * | −0.006 | 0.05 | 0.208 * |
| Insulin, μIU/mL | −0.070 | −0.245 * | −0.322 * | 0.007 | −0.150 * | 0.034 |
| HOMA Index | −0.076 | −0.233 * | −0.313 * | 0.024 | −0.171 * | 0.028 |
| Independent variables | C-Reactive Protein, mg/dL | Glucose, mg/dL | Triglycerides, mg/dL | Total cholesterol, mg/dL | Low density lipoprotein, mg/dL | High density lipoproteins, mg/dL | Insulin, μIU/mL | HOMA Index | ||||||||
|---|---|---|---|---|---|---|---|---|---|---|---|---|---|---|---|---|
| Beta 1 95% CI | p value | Beta 95% CI | p value | Beta 95% CI | p value | Beta 95% CI | p value | Beta 95% CI | p value | Beta 95% CI | p value | Beta 95% CI | p value | Beta 95% CI | p value | |
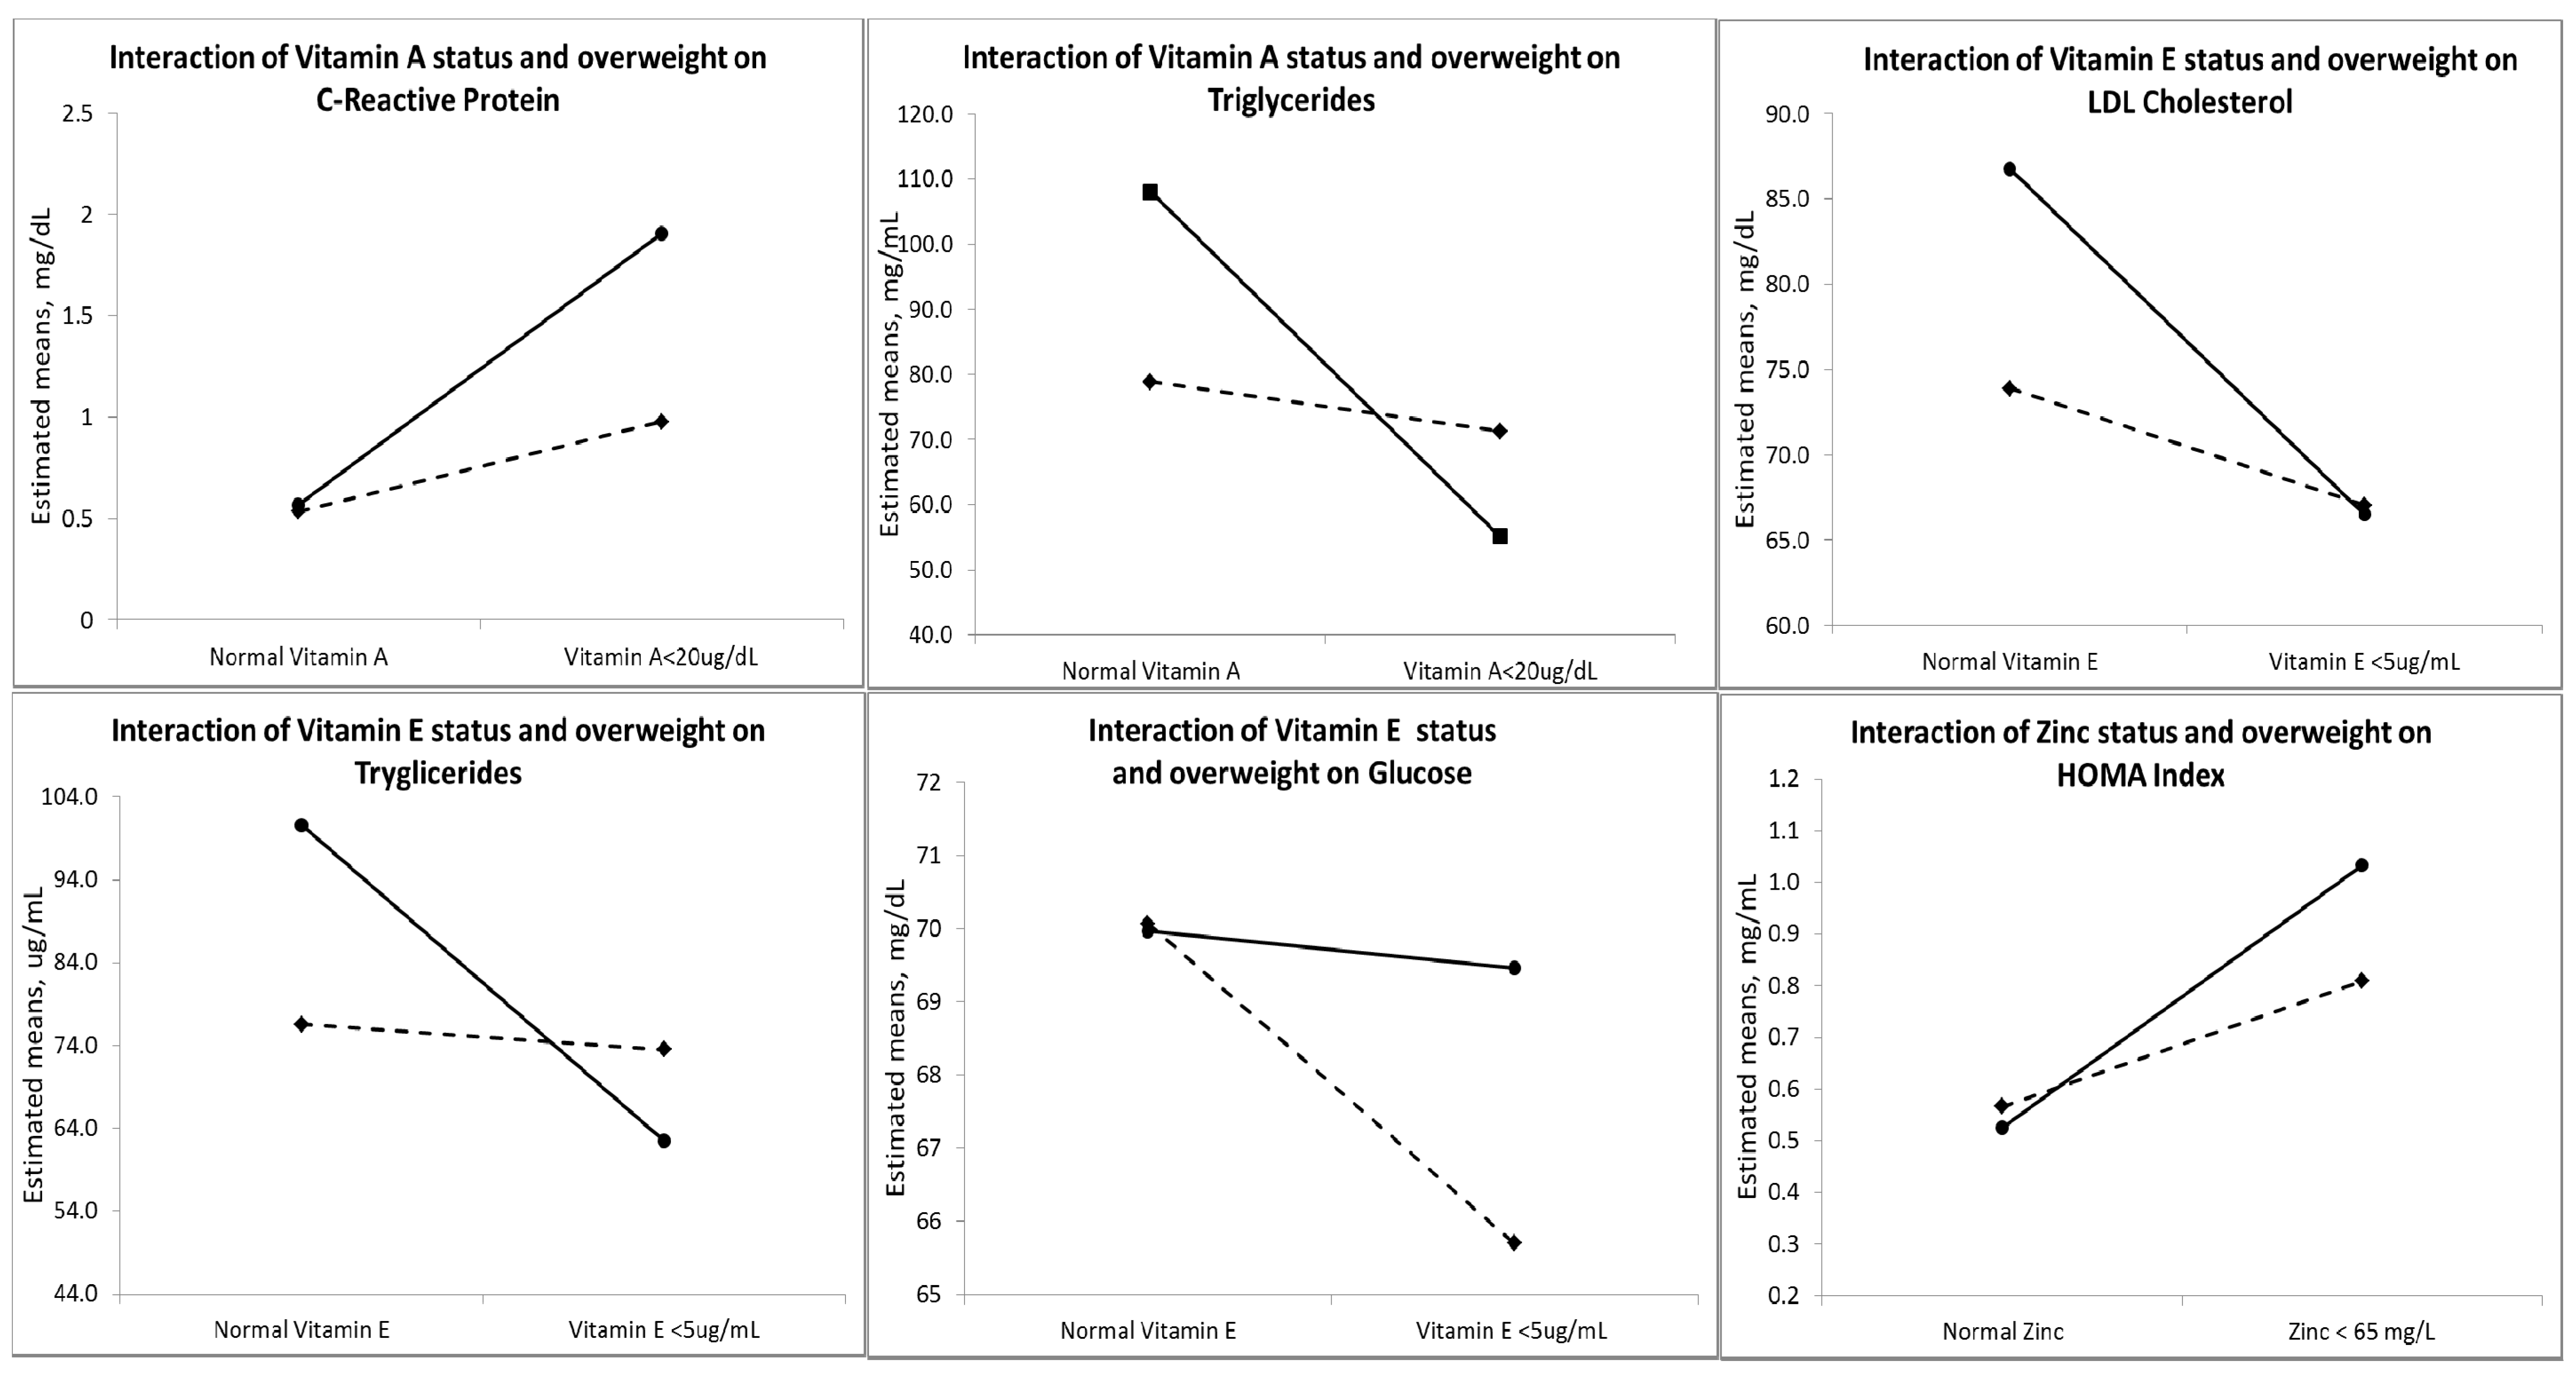
| BMI Zscore > 1 SD | 0.77 −0.06, 1.61 | 0.069 | 2.75 −5.90, 11.40 | 0.531 | −24.02 −72.32, 24.29 | 0.328 | −6.07 −39.42, 27.27 | 0.720 | −4.70 −30.15, 20.74 | 0.715 | 0.06 −12.05, 12.16 | 0.993 | 0.70 0.24, 1.16 | 0.003 | 0.78 0.30, 1.26 | 0.001 |
| Iron < 60 µg/dL | 0.25 −0.09, 0.58 | 0.149 | 0.48 −2.99, 3.95 | 0.784 | −10.30 −29.69, 9.08 | 0.296 | −4.59 −17.95, 8.78 | 0.499 | −8.49 −19.01, 2.03 | 0.113 | 0.03 −4.83, 4.89 | 0.990 | 0.01 −0.17, 0.19 | 0.922 | 0.03 −0.16, 0.22 | 0.783 |
| Iron < 60 µg/mL * BMI Z-score > 1 SD | 0.489 | 0.319 | 0.765 | 0.577 | 0.299 | 0.627 | 0.501 | 0.355 | ||||||||
| Zinc < 65 μg/dL | −0.15 −0.50, 0.21 | 0.418 | 0.81 −2.90, 4.51 | 0.668 | 11.50 −9.26, 32.25 | 0.276 | −1.95 −16.23, 12.33 | 0.788 | 4.58 −6.63, 15.79 | 0.420 | −3.52 −8.73, 1.68 | 0.183 | 0.23 0.03, 0.43 | 0.027 | 0.23 0.02, 0.44 | 0.032 |
| Zinc < 65 μg/dL * BMI Z-score > 1 SD | 0.667 | 0.377 | 0.223 | 0.562 | 0.184 | 0.811 | 0.020 | 0.045 | ||||||||
| Vitamin A < 20 µg/dL | 1.34 0.64, 2.04 | 0.000 | 1.41 −5.86, 8.69 | 0.702 | −52.86 −93.48, −12.23 | 0.011 | −17.95 −45.99, 10.08 | 0.208 | −4.14 −27.09, 18.82 | 0.722 | 1.71 −8.48, 11.89 | 0.741 | 0.22 −0.17, 0.60 | 0.274 | 0.30 −0.11, 0.71 | 0.147 |
| Vitamin A < 20 µg/dL * BMI Z-score > 1 SD | 0.037 | 0.580 | 0.068 | 0.167 | 0.781 | 0.760 | 0.424 | 0.260 | ||||||||
| Vitamin E < 5 µg/mL | 0.10 −0.21, 0.41 | 0.516 | −0.51 −3.74, 2.71 | 0.755 | −38.13 −56.14, −20.11 | 0.000 | −23.91 −36.34, −11.48 | 0.000 | −20.23 −29.54, −10.91 | 0.000 | −3.90 −8.42, 0.62 | 0.090 | 0.16 −0.01, 0.33 | 0.066 | 0.15 −0.03, 0.33 | 0.106 |
| Vitamin E < 5 µg/mL * BMI Z-score > 1 SD | 0.840 | 0.096 | 0.007 | 0.273 | 0.044 | 0.650 | 0.739 | 0.457 | ||||||||
| Vitamin C < 4 µg/mL | 0.16 −0.11, 0.44 | 0.240 | −1.98 −4.83, 0.87 | 0.172 | 12.68 −3.22, 28.58 | 0.117 | 2.32 −8.65, 13.29 | 0.677 | 1.10 −7.22, 9.42 | 0.795 | −2.15 −6.13, 1.84 | 0.290 | 0.004 −0.15, 0.155 | 0.957 | −0.03 −0.19, 0.13 | 0.734 |
| Vitamin C < 4 µg/mL * BMI Z-score > 1 SD | 0.171 | 0.788 | 0.604 | 0.973 | 0.267 | 0.434 | 0.894 | 0.888 | ||||||||
4. Discussion
5. Conclusions
Acknowledgments
Conflicts of interest
References
- Rosado, J.L.; del R Arellano, M.; Montemayor, K.; Garcia, O.P.; Caamano Mdel, C. An increase of cereal intake as an approach to weight reduction in children is effective only when accompanied by nutrition education: A randomized controlled trial. Nutr. J. 2008, 7, 28. [Google Scholar] [CrossRef]
- Balas-Nakash, M.; Perichart-Perera, O.; Benítez-Arciniega, A.; Tolentino-Dolores, M.; Mier-Cabrera, J.; Vadillo-Ortega, F. Association between adiposity, inflammation and cardiovascular risk factors in school-aged Mexican children. Gac. Med. Mex. 2013, 149, 196–203. [Google Scholar]
- Garcia, O.P.; Long, K.Z.; Rosado, J.L. Impact of micronutrient deficiencies on obesity. Nutr. Rev. 2009, 67, 559–572. [Google Scholar] [CrossRef]
- Garcia, O.P.; Ronquillo, D.; Caamano Mdel, C.; Camacho, M.; Long, K.Z.; Rosado, J.L. Zinc, vitamin A, and vitamin C status are associated with leptin concentrations and obesity in Mexican women: Results from a cross-sectional study. Nutr. Metab. (Lond.) 2012, 9, 59. [Google Scholar] [CrossRef]
- Zavala, G.; Long, K.Z.; Garcia, O.P.; Caamano, M.D.; Aguilar, T.; Salgado, L.M.; Rosado, J.L. Specific micronutrient concentrations are associated with inflammatory cytokines in a rural population of Mexican women with a high prevalence of obesity. Br. J. Nutr. 2012, in press. [Google Scholar]
- Aeberli, I.; Hurrell, R.F.; Zimmermann, M.B. Overweight children have higher circulating hepcidin concentrations and lower iron status but have dietary iron intakes and bioavailability comparable with normal weight children. Int. J. Obes. (Lond.) 2009, 33, 1111–1117. [Google Scholar] [CrossRef] [Green Version]
- De Souza Valente da Silva, L.; Valeria da Veiga, G.; Ramalho, R.A. Association of serum concentrations of retinol and carotenoids with overweight in children and adolescents. Nutrition 2007, 23, 392–397. [Google Scholar] [CrossRef]
- Decsi, T.; Molnar, D.; Koletzko, B. Reduced plasma concentrations of alpha-tocopherol and beta-carotene in obese boys. J. Pediatr. 1997, 130, 653–655. [Google Scholar] [CrossRef]
- Molnar, D.; Decsi, T.; Koletzko, B. Reduced antioxidant status in obese children with multimetabolic syndrome. Int. J. Obes. Relat. Metab. Disord. 2004, 28, 1197–1202. [Google Scholar]
- Garcia-Diaz, D.F.; Campion, J.; Milagro, F.I.; Boque, N.; Moreno-Aliaga, M.J.; Martinez, J.A. Vitamin C inhibits leptin secretion and some glucose/lipid metabolic pathways in primary rat adipocytes. J. Mol. Endocrinol. 2010, 45, 33–43. [Google Scholar] [CrossRef]
- Kelishadi, R.; Hashemipour, M.; Adeli, K.; Tavakoli, N.; Movahedian-Attar, A.; Shapouri, J.; Poursafa, P.; Rouzbahani, A. Effect of zinc supplementation on markers of insulin resistance, oxidative stress, and inflammation among prepubescent children with metabolic syndrome. Metab. Syndr. Relat. Disord. 2010, 8, 505–510. [Google Scholar] [CrossRef]
- Shen, X.H.; Tang, Q.Y.; Huang, J.; Cai, W. Vitamin E regulates adipocytokine expression in a rat model of dietary-induced obesity. Exp. Biol. Med. (Maywood) 2010, 235, 47–51. [Google Scholar] [CrossRef]
- Rivera-Domarco, J.; Shama-Levy, T.; Villalpando-Hernandez, S.; González-de Cossío, T.; Hernández-Prado, B.; Sepúlveda, J. Encuesta Nacional de Nutrición 1999. (National Nutrition Survey 1999); Instituto Nacional de Salud Publica: Cuernavaca, Mexico, 2001. [Google Scholar]
- Olaiz-Fernandez, G.; Rivera-Dommarco, J.; Shamah-Levy, T.; Rojas, R.; Villalpando-Hernández, S.; Hernández-Ávila, M.; Sepúlveda-Amor, J. Encuesta Nacional de Salud y Nutrición; Instituto Nacional de Salud Publica: Cuernavaca, Mexico, 2006. [Google Scholar]
- Shamah-Levy, T.; Villalpando, S.; Jauregui, A.; Rivera, J.A. Overview of the nutritional status of selected micronutrients in Mexican children in 2006. Salud Publica Mex. 2012, 54, 146–151. [Google Scholar]
- World Health Organization. Physical Growth and Psychosocial Development of Children: Monitoring and Interventions, Protocols I and II, the Development and Field Testing of Techniques for Monitoring; World Health Organization: Geneva, Switzerland, 1992.
- World Health Organization. Child Growth Standards Based on Length/Height and Age; World Health Organization: Geneva, Switzerland, 2006; pp. 76–85.
- Hill, A.M.; LaForgia, J.; Coates, A.M.; Buckley, J.D.; Howe, P.R. Estimating abdominal adipose tissue with DXA and anthropometry. Obesity (Silver Spring) 2007, 15, 504–510. [Google Scholar] [CrossRef]
- Ellis, K.J. Body composition of a young, multiethnic, male population. Am. J. Clin. Nutr. 1997, 66, 1323–1331. [Google Scholar]
- Ellis, K.J.; Abrams, S.A.; Wong, W.W. Body composition of a young, multiethnic female population. Am. J. Clin. Nutr. 1997, 65, 724–731. [Google Scholar]
- National High Blood Pressure Education Program Working Group on High Blood Pressure in C. Adolescents. The fourth report on the diagnosis, evaluation, and treatment of high blood pressure in children and adolescents. In Pediatrics; 2004; 114, pp. 555–576. [Google Scholar]
- Bieri, J.G.; Tolliver, T.J.; Catignani, G.L. Simultaneous determination of alpha-tocopherol and retinol in plasma or red cells by high pressure liquid chromatography. Am. J. Clin. Nutr. 1979, 32, 2143–2149. [Google Scholar]
- Gibson, R. Principles of Nutritional Assessment; Oxford University Press: New York, NY, USA, 2005. [Google Scholar]
- Fares, S.; Chahed, M.K.; Feki, M.; Beji, C.; Traissac, P.; El Ati, J.; Kaabachi, N. Status of vitamins A and E in schoolchildren in the centre west of Tunisia: A population-based study. Public Health Nutr. 2011, 14, 255–260. [Google Scholar]
- Drewel, B.T.; Giraud, D.W.; Davy, S.R.; Driskell, J.A. Less than adequate vitamin E status observed in a group of preschool boys and girls living in the United States. J. Nutr. Biochem. 2006, 17, 132–138. [Google Scholar] [CrossRef]
- Ravi, S.; Howell, R. Testicular and plasma AA levels in mice following dietary intake: A high performance liquid chromatographic analysis. J. Chromatogr. 1993, 614, 233–243. [Google Scholar] [CrossRef]
- Joint World Health Organization/Centers for Disease Control and Prevention. Technical Consultation on the Assessment of Iron Status at the Population Level; World Health Organization: Geneva, Switzerland, 2004. [Google Scholar]
- Hotz, C.; Peerson, J.M.; Brown, K.H. Suggested lower cutoffs of serum zinc concentrations for assessing zinc status: Reanalysis of the second National Health and Nutrition Examination Survey data (1976–1980). Am. J. Clin. Nutr. 2003, 78, 756–764. [Google Scholar]
- Expert Panel on Integrated Guidelines for Cardiovascular Health and Risk Reduction in Children and Adolescents: Summary Report. Pediatrics 2011, 128, S213–S256. [CrossRef]
- Keskin, M.; Kurtoglu, S.; Kendirci, M.; Atabek, M.E.; Yazici, C. Homeostasis model assessment is more reliable than the fasting glucose/insulin ratio and quantitative insulin sensitivity check index for assessing insulin resistance among obese children and adolescents. Pediatrics 2005, 115, e500–e503. [Google Scholar] [CrossRef]
- Barlow, S.E.; Expert, C. Expert committee recommendations regarding the prevention, assessment, and treatment of child and adolescent overweight and obesity: Summary report. Pediatrics 2007, 120, S164–S192. [Google Scholar] [CrossRef]
- García, O.P.; Díaz, M.; Rosado, R.J.; Allen, L.H. Ascorbic acid from lime juice does not improve the iron status of iron-deficient women in rural Mexico. Am. J. Clin. Nutr. 2003, 78, 267–273. [Google Scholar]
- Rosado, J.L.; Garcia, O.P.; Ronquillo, D.; Hervert-Hernandez, D.; Caamano Mdel, C.; Martinez, G.; Gutierrez, J.; Garcia, S. Intake of milk with added micronutrients increases the effectiveness of an energy-restricted diet to reduce body weight: A randomized controlled clinical trial in Mexican women. J. Am. Diet. Assoc. 2011, 111, 1507–1516. [Google Scholar] [CrossRef]
- USDA National Nutrient Database for Standard Reference, Release 22; U.S. Department of Agriculture, Agricultural Research Service: Minneapolis, MN, USA, 2009.
- Chavez, M.; Chavez, A.; Roldan, J.; Pérez-Gil, S.; Hernández, S. Tablas de Valor Nutritivo de Los Alimentos: De Mayor Consumo en México; Pax Mex Editorial Librerias Carlos Cesarman, S.A.: Mexico, Mexico, 1996. [Google Scholar]
- Hernandez, B.; Gortmaker, S.L.; Laird, N.M.; Colditz, G.A.; Parra-Cabrera, S.; Peterson, K.E. Validity and reproducibility of a questionnaire on physical activity and non-activity for school children in Mexico City. Salud Publica Mex. 2000, 42, 315–323. (in Spanish). [Google Scholar] [CrossRef]
- World Health Organization. Global Strategy on Diet, Physical Activity and Health. Physical Activity and Young People; World Health Organization: Geneva, Switzerland, 2012.
- Johnston, C.S.; Beezhold, B.L.; Mostow, B.; Swan, P.D. Plasma vitamin C is inversely related to body mass index and waist circumference but not to plasma adiponectin in nonsmoking adults. J. Nutr. 2007, 137, 1757–1762. [Google Scholar]
- Hasegawa, N.; Niimi, N.; Odani, F. Vitamin C is one of the lipolytic substances in green tea. Phytother. Res. 2002, 16, S91–S92. [Google Scholar] [CrossRef]
- Garcia-Diaz, D.F.; Campion, J.; Milagro, F.I.; Paternain, L.; Solomon, A.; Martinez, J.A. Ascorbic acid oral treatment modifies lipolytic response and behavioural activity but not glucocorticoid metabolism in cafeteria diet-fed rats. Acta Physiol. (Oxf.) 2009, 195, 449–457. [Google Scholar]
- Carcamo, J.M.; Pedraza, A.; Borquez-Ojeda, O.; Golde, D.W. Vitamin C suppresses TNF alpha-induced NF kappa B activation by inhibiting I kappa B alpha phosphorylation. Biochemistry 2002, 41, 12995–13002. [Google Scholar] [CrossRef]
- Garcia-Diaz, D.; Campion, J.; Milagro, F.I.; Martinez, J.A. Adiposity dependent apelin gene expression: Relationships with oxidative and inflammation markers. Mol. Cell. Biochem. 2007, 305, 87–94. [Google Scholar]
- Singh, R.B.; Beegom, R.; Rastogi, S.S.; Gaoli, Z.; Shoumin, Z. Association of low plasma concentrations of antioxidant vitamins, magnesium and zinc with high body fat per cent measured by bioelectrical impedance analysis in Indian men. Magnes. Res. 1998, 11, 3–10. [Google Scholar]
- Wallstrom, P.; Wirfalt, E.; Lahmann, P.H.; Gullberg, B.; Janzon, L.; Berglund, G. Serum concentrations of beta-carotene and alpha-tocopherol are associated with diet, smoking, and general and central adiposity. Am. J. Clin. Nutr. 2001, 73, 777–785. [Google Scholar]
- Aeberli, I.; Molinari, L.; Spinas, G.; Lehmann, R.; l’Allemand, D.; Zimmermann, M.B. Dietary intakes of fat and antioxidant vitamins are predictors of subclinical inflammation in overweight Swiss children. Am. J. Clin. Nutr. 2006, 84, 748–755. [Google Scholar]
- Al-Sowyan, N.S. Difference in leptin hormone response to nutritional status in normal adult male albino rats. Pak. J. Biol. Sci. 2009, 12, 119–126. [Google Scholar] [CrossRef]
- Viroonudomphol, D.; Pongpaew, P.; Tungtrongchitr, R.; Changbumrung, S.; Tungtrongchitr, A.; Phonrat, B.; Vudhivai, N.; Schelp, F.P. The relationships between anthropometric measurements, serum vitamin A and E concentrations and lipid profiles in overweight and obese subjects. Asia Pac. J. Clin. Nutr. 2003, 12, 73–79. [Google Scholar]
- Garcia, O.P. Effect of vitamin A deficiency on the immune response in obesity. Proc. Nutr. Soc. 2012, 71, 290–297. [Google Scholar]
- Obeid, O.A.; Al-Ghali, R.M.; Khogali, M.; Hwalla, N. Vitamins A and E status in an urban Lebanese population: A case study at Dar Al-Fatwa area, Beirut. Int. J. Vitam. Nutr. Res. 2006, 76, 3–8. [Google Scholar] [CrossRef]
- Kiefer, F.W.; Orasanu, G.; Nallamshetty, S.; Brown, J.D.; Wang, H.; Luger, P.; Qi, N.R.; Burant, C.F.; Duester, G.; Plutzky, J. Retinaldehyde dehydrogenase 1 coordinates hepatic gluconeogenesis and lipid metabolism. Endocrinology 2012, 153, 3089–3099. [Google Scholar] [CrossRef]
- Ozkanlar, S.; Akcay, F. Antioxidant vitamins in atherosclerosis—ANIMAl experiments and clinical studies. Adv. Clin. Exp. Med. 2012, 21, 115–123. [Google Scholar]
- Richardson, M.W.; Ang, L.; Visintainer, P.F.; Wittcopp, C.A. The abnormal measures of iron homeostasis in pediatric obesity are associated with the inflammation of obesity. Int. J. Pediatr. Endocrinol. 2009, 2009, 713269. [Google Scholar] [CrossRef]
- Skinner, A.C.; Steiner, M.J.; Henderson, F.W.; Perrin, E.M. Multiple markers of inflammation and weight status: Cross-sectional analyses throughout childhood. Pediatrics 2010, 125, e801–e809. [Google Scholar] [CrossRef]
- Zeba, A.N.; Delisle, H.F.; Rossier, C.; Renier, G. Association of high-sensitivity C-reactive protein with cardiometabolic risk factors and micronutrient deficiencies in adults of Ouagadougou, Burkina Faso. Br. J. Nutr. 2012, 109, 1266–1275. [Google Scholar]
- Emerging Risk Factors Collaboration; Kaptoge, S.; Di Angelantonio, E.; Pennells, L.; Wood, A.M.; White, I.R.; Gao, P.; Walker, M.; Thompson, A.; Sarwar, N.; et al. C-reactive protein, fibrinogen, and cardiovascular disease prediction. N. Engl. J. Med. 2012, 367, 1310–1320. [Google Scholar]
- Kotani, K.; Sakane, N. C-reactive protein and reactive oxygen metabolites in subjects with metabolic syndrome. J. Int. Med. Res. 2012, 40, 1074–1081. [Google Scholar] [CrossRef]
- Mah, E.; Matos, M.D.; Kawiecki, D.; Ballard, K.; Guo, Y.; Volek, J.S.; Bruno, R.S. Vitamin C status is related to proinflammatory responses and impaired vascular endothelial function in healthy, college-aged lean and obese men. J. Am. Diet. Assoc. 2011, 111, 737–743. [Google Scholar] [CrossRef]
- Beydoun, M.A.; Shroff, M.R.; Chen, X.; Beydoun, H.A.; Wang, Y.; Zonderman, A.B. Serum antioxidant status is associated with metabolic syndrome among U.S. adults in recent national surveys. J. Nutr. 2011, 141, 903–913. [Google Scholar] [CrossRef]
- Zhang, K.; Liu, L.; Cheng, X.; Dong, J.; Geng, Q.; Zuo, L. Low levels of vitamin C in dialysis patients is associated with decreased prealbumin and increased C-reactive protein. BMC Nephrol. 2011, 12, 18. [Google Scholar] [CrossRef]
- Kubota, Y.; Moriyama, Y.; Yamagishi, K.; Tanigawa, T.; Noda, H.; Yokota, K.; Harada, M.; Inagawa, M.; Oshima, M.; Sato, S.; et al. Serum vitamin C concentration and hs-CRP level in middle-aged Japanese men and women. Atherosclerosis 2010, 208, 496–500. [Google Scholar] [CrossRef]
- Kongsbak, K.; Wahed, M.A.; Friis, H.; Thilsted, S.H. Acute-phase protein levels, diarrhoea, Trichuris trichiura and maternal education are predictors of serum retinol: A cross-sectional study of children in a Dhaka slum, Bangladesh. Br. J. Nutr. 2006, 96, 725–734. [Google Scholar]
- Devaraj, S.; Tang, R.; Adams-Huet, B.; Harris, A.; Seenivasan, T.; de Lemos, J.A.; Jialal, I. Effect of high-dose alpha-tocopherol supplementation on biomarkers of oxidative stress and inflammation and carotid atherosclerosis in patients with coronary artery disease. Am. J. Clin. Nutr. 2007, 86, 1392–1398. [Google Scholar]
- D’Amo, E.; Marcovecchio, M.L.; Giannini, C.; de Giorgis, T.; Chiavaroli, V.; Chiarelli, F.; Mohn, A. Improved oxidative stress and cardio-metabolic status in obese prepubertal children with liver steatosis treated with lifestyle combined with vitamin E. Free Radic. Res. 2013, 47, 146–153. [Google Scholar] [CrossRef]
- Williams, D.B.; Wan, Z.; Frier, B.C.; Bell, R.C.; Field, C.J.; Wright, D.C. Dietary supplementation with vitamin E and C attenuates dexamethasone-induced glucose intolerance in rats. Am. J. Physiol. Regul. Integr. Comp. Physiol. 2012, 302, R49–R58. [Google Scholar] [CrossRef]
- Suliburska, J.; Bogdanski, P.; Pupek-Musialik, D.; Krejpcio, Z. Dietary intake and serum and hair concentrations of minerals and their relationship with serum lipids and glucose levels in hypertensive and obese patients with insulin resistance. Biol. Trace Elem. Res. 2011, 139, 137–150. [Google Scholar] [CrossRef]
- Biswas, S.; Tapryal, N.; Mukherjee, R.; Kumar, R.; Mukhopadhyay, C.K. Insulin promotes iron uptake in human hepatic cell by regulating transferrin receptor-1 transcription mediated by hypoxia inducible factor-1. Biochim. Biophys. Acta 2013, 1832, 293–301. [Google Scholar] [CrossRef]
- Gabrielsen, J.S.; Gao, Y.; Simcox, J.A.; Huang, J.; Thorup, D.; Jones, D.; Cooksey, R.C.; Gabrielsen, D.; Adams, T.D.; Hunt, S.C.; et al. Adipocyte iron regulates adiponectin and insulin sensitivity. J. Clin. Investig. 2012, 122, 3529–3540. [Google Scholar] [CrossRef]
- Wilson, C. Metabolism: Iron metabolism, adiponectin and T2DM—The link with adipocyte insulin resistance. Nat. Rev. Endocrinol. 2012, 8, 696. [Google Scholar]
- Ortega, R.M.; Rodriguez-Rodriguez, E.; Aparicio, A.; Jimenez, A.I.; Lopez-Sobaler, A.M.; Gonzalez-Rodriguez, L.G.; Andres, P. Poor zinc status is associated with increased risk of insulin resistance in Spanish children. Br. J. Nutr. 2012, 107, 398–404. [Google Scholar] [CrossRef]
- Chausmer, A.B. Zinc, insulin and diabetes. J. Am. Coll. Nutr. 1998, 17, 109–115. [Google Scholar] [CrossRef]
- Garrido-Sanchez, L.; Garcia-Fuentes, E.; Fernandez-Garcia, D.; Escote, X.; Alcaide, J.; Perez-Martinez, P.; Vendrell, J.; Tinahones, F.J. Zinc-alpha 2-glycoprotein gene expression in adipose tissue is related with insulin resistance and lipolytic genes in morbidly obese patients. PLoS One 2012, 7, e33264. [Google Scholar] [CrossRef]
© 2013 by the authors; licensee MDPI, Basel, Switzerland. This article is an open access article distributed under the terms and conditions of the Creative Commons Attribution license (http://creativecommons.org/licenses/by/3.0/).
Share and Cite
García, O.P.; Ronquillo, D.; Del Carmen Caamaño, M.; Martínez, G.; Camacho, M.; López, V.; Rosado, J.L. Zinc, Iron and Vitamins A, C and E Are Associated with Obesity, Inflammation, Lipid Profile and Insulin Resistance in Mexican School-Aged Children. Nutrients 2013, 5, 5012-5030. https://doi.org/10.3390/nu5125012
García OP, Ronquillo D, Del Carmen Caamaño M, Martínez G, Camacho M, López V, Rosado JL. Zinc, Iron and Vitamins A, C and E Are Associated with Obesity, Inflammation, Lipid Profile and Insulin Resistance in Mexican School-Aged Children. Nutrients. 2013; 5(12):5012-5030. https://doi.org/10.3390/nu5125012
Chicago/Turabian StyleGarcía, Olga Patricia, Dolores Ronquillo, María Del Carmen Caamaño, Guadalupe Martínez, Mariela Camacho, Viridiana López, and Jorge L. Rosado. 2013. "Zinc, Iron and Vitamins A, C and E Are Associated with Obesity, Inflammation, Lipid Profile and Insulin Resistance in Mexican School-Aged Children" Nutrients 5, no. 12: 5012-5030. https://doi.org/10.3390/nu5125012