2. Materials and Methods
2.1. Study Design
The current study was exploratory and part of a larger human clinical trial investigating the inclusion of 3–4 servings of dairy foods in an energy restricted diet; details of the parent project have been previously published [
5]. The clinical intervention trial was registered at clinicaltrials.gov (NCT 00858312). Healthy women, aged 20–45 years, and healthy men, aged 20–50 years (lower age for women was used to avoid hormonal changes associated with the transition to menopause that might affect endocrine parameters and related study outcomes), were enrolled in a 15-week controlled feeding study in which all foods were provided or prepared by the Metabolic Food Laboratory (MFL) at the USDA, ARS, Western Human Nutrition Research Center (WHNRC). The 15-week study was divided into a 3-week “Run-In” period during which subjects were weighed daily and caloric intake adjusted to maintain body weight; thereby establishing energy requirements. The “Run-In” period was followed by a 12-week “Weight Loss Intervention” during which energy intake was reduced by 500 kcal/day from the “Run-In” period. Therefore, pre-intervention measurements at the end of the “Run-In” period were considered baseline measures. Post-intervention measurements were made at the end of the 12-week “Weight Loss Intervention” period. Specific details regarding the dietary portion of the parent study can be found in the previously published manuscript [
5]. The study and all procedures were approved by the Committee for Human Subjects Protection, Institutional Review Board of the University of California, Davis. Written informed consent was obtained from all research volunteers.
2.2. Subject Screening and Selection
Overweight and obese adult females and males were recruited from the faculty, staff, and student population at University of California, Davis as well as the greater Davis and Sacramento, CA communities. Body mass index was between 28 and 37 kg/m2. All participants were habitually low dairy consumers (defined as ≤1 serving/day), and weight stable (no more than 3 kg weight loss during three months preceding the intervention). Exclusion was based on not meeting the age, not meeting the dairy and calcium criteria (≤1 serving of dairy/day and a total calcium intake ≤ 600 mg/day from all sources), diagnosis of type 2 diabetes, fasting glucose ≥ 110 mg/dL, adverse response to study foods (lactose intolerance, dairy intolerance, dairy allergy determined by self-report), history or presence of significant metabolic disease (i.e., endocrine, hepatic, or renal), use of blood pressure or lipid-altering medications, resting blood pressure ≥ 160/100 mg/Hg, triglyceride value ≥ 400 mg/dL or LDL ≥ 160 mg/dL, history of eating disorder, presence of active gastrointestinal disorders, pregnancy or lactation, use of obesity pharmacotherapeutic agents within the last 12 weeks, use of over-the-counter anti-obesity agents (e.g., those containing phenylpropanolamine, ephedrine and/or caffeine) within the last 12 weeks, use of calcium supplements in the past 12 weeks, recent (past four weeks) initiation of an exercise program, recent (past 12 weeks) initiation of hormonal birth control or change in hormonal birth control regimen, use of tobacco products, and exercise more than 30 min/day.
Body composition was assessed during the “Run-In” period and subjects were pair-matched based on percent body fat (%BF) and randomly assigned to one of two treatment groups: low dairy (LD, ≤1 serving/day) or adequate dairy (AD, 3–4 servings/day). Enrollment was continuous with a new cohort starting approximately every 8 weeks. Consequently, volunteers were enrolled year-round. The Consort Diagram providing information on the number of eligible participants
vs. enrolled participants has been previously published [
5]. Forty percent of the participants were non-white and 25% of those were of Hispanic origin.
2.3. Dietary Intake of Vitamin D
Vitamin D content of the diet was determined by the Nutrition Data System for Research software (NDSR software version 2011, University of Minnesota, Minneapolis, MN) and expressed as daily IU intake. Daily dietary vitamin D intake varied based on diet group (AD, LD) and the menu day for the 7 day rotating diet. Average daily vitamin D intake is shown in
Table 1.
Table 1.
Subject characteristics at Baseline and Post-Intervention 1.
Table 1.
Subject characteristics at Baseline and Post-Intervention 1.
| Variable | Baseline | Post-Intervention |
|---|
| N | 20 | 20 |
| Sex (F/M) | 15/5 | |
| Age (y) | 34.3 (9.0) | |
| Height (cm) | 170 (1.0) | |
| Weight (kg) | 93.1 (10.9) | 87.3 (10.3) * |
| BMI (kg/m2) | 32.7 (2.5) | 30.6 (2.5) * |
| Total Fat Mass (kg) | 38.5 (8.0) | 33.5 (8.7) * |
| Body Fat (%) | 43.5 (6.0) | 40.9 (6.7) |
| Lean Mass (kg) | 49.3 (10.0) | 48.3 (9.6) |
| Waist Circumference (cm) 2 | 94.2 (8.3) | 89.2 (7.2) * |
| Intra-abdominal Adipose Tissue, cc | 41.7 (20.0) | 31.5 (15.9) * |
| Android Fat (kg) | 3.8 (0.7) | 3.3 (0.7) * |
| Gynoid Fat (kg) | 7.3 (1.5) | 6.6 (1.5) * |
| Dietary Vitamin D intake (IU/day) | 190.2 (18.2) | 216.5 (83.8) |
2.4. Body Composition Measurements
Body weight was measured on an electronic scale (Scale-tronic model 6002; Wheaton, IL, USA) to the nearest 0.1 kg with subjects in light clothing, all jewelry removed, pockets emptied, and shoes removed. Height was measured using a wall mounted stadiometer (Ayrton Stadiometer model S100; Prior Lake MN) and recorded to the nearest 0.1 cm. Body mass index was calculated as kg/m
2. Waist circumference was measured with a metal non stretchable tape measure (Model Gluick, Lafayette Instrument, Lafayette, IN, USA) to the nearest 0.1 cm in the standing position against bare skin with the abdomen relaxed and arms at the sides. The average of two readings was reported for weight, height and waist circumference. Fat mass were assessed using dual energy x-ray absorptiometry (DXA, GE Lunar, Prodigy Model) during the “Run-In” period and at the end of the 12-week intervention. Daily calibration procedures were carried out per manufacturer instructions. To reduce the variance in the measurement data, all DXA scans were analyzed by a single technician. Intra-abdominal adipose tissue was measured using computed tomography (CT) trans-abdominal slices (Siemens Somaton 16 CT Scanner). Details of CT-scans have been previously published [
5].
2.5. Serum Vitamin D
Fasting blood was drawn using sterile phlebotomony techniques at the end of the “Run-In” period and at the end of the 12 week intervention. Serum and plasma were stored at −80 °C until analyzed. Serum vitamin D metabolites [25(OH)D and 1,25(OH)2D] were analyzed using standard radioimmunoassay (RIA) procedures (DiaSorin, StillWater, MN and Immunodiagnostics Systems [IDS], Fountain Hills, AZ, respectively). Participants’ baseline and post-intervention samples were run simultaneously in duplicate and processed in accordance with manufacturer’s instructions. Interassay CVs were 6.0% and 6.3% for 25(OH)D and 1,25(OH)2D, respectively. In regard to the DiaSorin RIA, both 25(OH)D2 and 25(OH)D3 have 100% cross-reactivity with the internal antibody. Therefore, reported serum 25(OH)D values herein represent cumulative 25(OH)D2 and 25(OH)D3 concentrations. The WHNRC participates in the Vitamin D External Quality Assessment Scheme (DEQAS) and calibration standards of 25(OH)D and 1,25(OH)2D from this program were analyzed in conjunction with participant samples.
2.6. Subcutaneous White Adipose Tissue (SWAT) Biopsies
SWAT biopsies were obtained at the UC Davis Medical Center Clinical and Translation Science Center at “Run-In” and at the end of the 12-week intervention following a 12-h overnight fast. Biopsy samples from “Run-In” and at the end of the 12-week intervention were collected from opposite sides of the buttocks. Each sample was immediately rinsed in ice cold phosphate buffered saline (PBS) to minimize blood contamination. Samples were additionally rinsed in fresh ice cold PBS and aliquots were frozen in liquid nitrogen. Frozen samples were than stored at −80 °C until analyzed.
SWAT biopsies from participants enrolled in cohorts beginning in November through January were chosen for analysis to minimize potential influences by endogenous vitamin D synthesis. Fourteen subjects from winter cohorts had complete SWAT biopsy sets (both baseline and post-intervention) available, therefore, six subjects were randomly chosen from spring cohorts (enrollment between February and April) to bring the total number of SWAT samples analyzed to twenty pairs. Biopsies used for this study were shipped overnight on dry ice to the Jean Mayer USDA Human Nutrition Research Center on Aging at Tufts University for analysis.
2.7. Preparation and Analysis of SWAT 25(OH)D3 by LC-MS/MS
Subsamples of SWAT tissue (0.1–0.5 g) were added to a glass mortar filled with 2 g of 40 μm Bondesil-C18. Tissue was blended with a glass pestle and spiked with 0.2 mL mixture of 25-OH deuterated vitamin D
3-d
6 standards (Medical Isotopes, Inc., Pelham, NH, USA; purity 99.6%), each at 111 ng/mL. The mixture was further homogenized with a spatula and transferred to a 15 mL reservoir tube. A 20 μm frit was placed on top of the reservoir. The reservoir was tightly compressed with a 10 cc syringe plunger and 8 mL of water was added. The contents were collected and reduced to dryness using a Vac-Elute set to “Collect” mode. Residues were solubilized in acetone (4 mL), with supernatants being isolated, centrifuged at 3000
g for 11 min and filtered through a 0.2 μm PTFE filter. The extract volume was reduced under N
2 at 45 °C for 60 min and 200 μL of the remaining extract was transferred to an autosampler vial insert. A 50 μL aliquot was injected on a LC-MS/MS (Agilent 1100 HPLC-ABSciex 5500 QTRAP tandem mass spectrometer). The HPLC was equipped with a 4.6 × 250 mm, 5-μm ProntoSIL 200-5-C30 (MAC-MOD Analytical, Inc., Chadds Ford, PA, USA, manufactured by Bischoff Chromatography, Leonberg, Germany) C-30 column. The column was maintained at room temperature during the analyses. The mobile phase flow rate was 0.9 mL/min. Solvent A was methanol and solvent B was methylene chloride. The gradient was: 0–15 min, 100% solvent A, followed by 50% solvent A from 10.0 to 25.0 min and a 10 min re-equilibrated at 100% A. Post-column solvent flow was diverted to waste during the final 13 min. The mass spectrometer employed an atmospheric pressure chemical ionization source operated in positive ion mode. The ion source temperature was 400 °C. The triple quadrupole MS/MS was operated in multiple reaction monitoring (MRM) mode to detect the mass transitions of the parent molecules after in source loss of water (
i.e., [M − H
2O + H]
+) for 25-hydroxy vitamin D
3 m/
z 383.4 > 211.3 and 25-hydroxy vitamin D
3-d
6 m/
z 389.4 > 211.3, respectively. The collision gas was nitrogen and the pressure was set to medium. The collision energy for all MRM transitions was 40 V and the dwell time for each MRM transition was 1000 ms. As described above, we utilized isotope dilution procedures to internalize standards within samples [
6,
7]. By adding a known quantities of isotopically labeled metabolites vitamin D
3-d
6 to each sample, the isotope ratio of the resulting solution can be deconvoluted using the known isotope ratio of the labeled compounds and the natural deuterium abundance in the sample (<0.1%), to calculated the D
3 metabolite concentrations in the samples. The average recovery was 72%.
Based on the average variance of low abundance calibration standards (2.5 nmol/kg), method limit of detection and limit of quantification were estimated at 1.0 and 2.9 nmol/kg, respectively. All reported data were greater than 2x the limit of detection estimate.
2.8. Statistical Methods
All statistical analyses were performed using R version 2.15.1 (R Development Core Team 2012). Univariate analysis, including mean, range and standard deviation, was used for baseline and post-intervention physical and clinical characteristics. Associations among variables were determined using Pearson’s correlation coefficients. Paired
t-tests were used to determine differences between baseline and post-intervention measurements. All
P-values ≤ 0.05 were considered statistically significant. Graphical plots were constructed using the R package, ggplot2 [
8].
To minimize any potential effects of sun exposure, biopsy samples were specifically chosen from winter and spring cohorts. Consequently, the treatment assignment became unbalanced with 7 samples assigned to the AD group and 13 samples to the LD group. Additionally, by chance, 2 samples within the AD group had undetectable 25(OH)D, which reduced the number of paired baseline and post-intervention for the AD group to 5. Thus, treatment effect was not analyzed due to unequal and small sample sizes in each treatment group.
4. Discussion
Little is known about the content of 25(OH)D in human adipose tissue and whether weight loss or other conditions that impact adiposity influence fat tissue vitamin D metabolites. In swine, Jakobsen
et al. found mean subcutaneous fat concentrations of 25(OH)D between 4.8 nmol/kg and 6.3 nmol/kg depending on the inclusion of vitamin D or 25(OH)D in their feed [
3]. Our SWAT 25(OH)D
3 concentrations of 5.8 nmol/kg at baseline and 6.2 nmol/kg post-intervention are in agreement with Jakobsen
et al. and add to the few papers that have found measureable SWAT 25(OH)D concentrations [
2]. However, it is acknowledged that other researchers have failed to detect 25(OH)D in adipose tissue [
9]. This could be partly due to methodological differences. We quantified SWAT 25(OH)D
3 using LC-MS/MS and acknowledge that at the time of our study there was no reference method to which our data could be compared. Considering the controversy regarding accurately assessing serum 25(OH)D concentrations [
10,
11,
12,
13], it would be presumptuous to relate our results to the general population. More analyses are needed to determine typical concentrations in wider populations of overweight and obese individuals and in different racial groups, and the current experiment provides a useful foundation for these efforts.
The majority of the subjects in our study had insufficient serum 25(OH)D concentrations according to the current IOM guidelines. This finding is consistent with other studies reporting an inverse relationship between measures of adiposity and serum 25(OH)D [
14,
15,
16,
17,
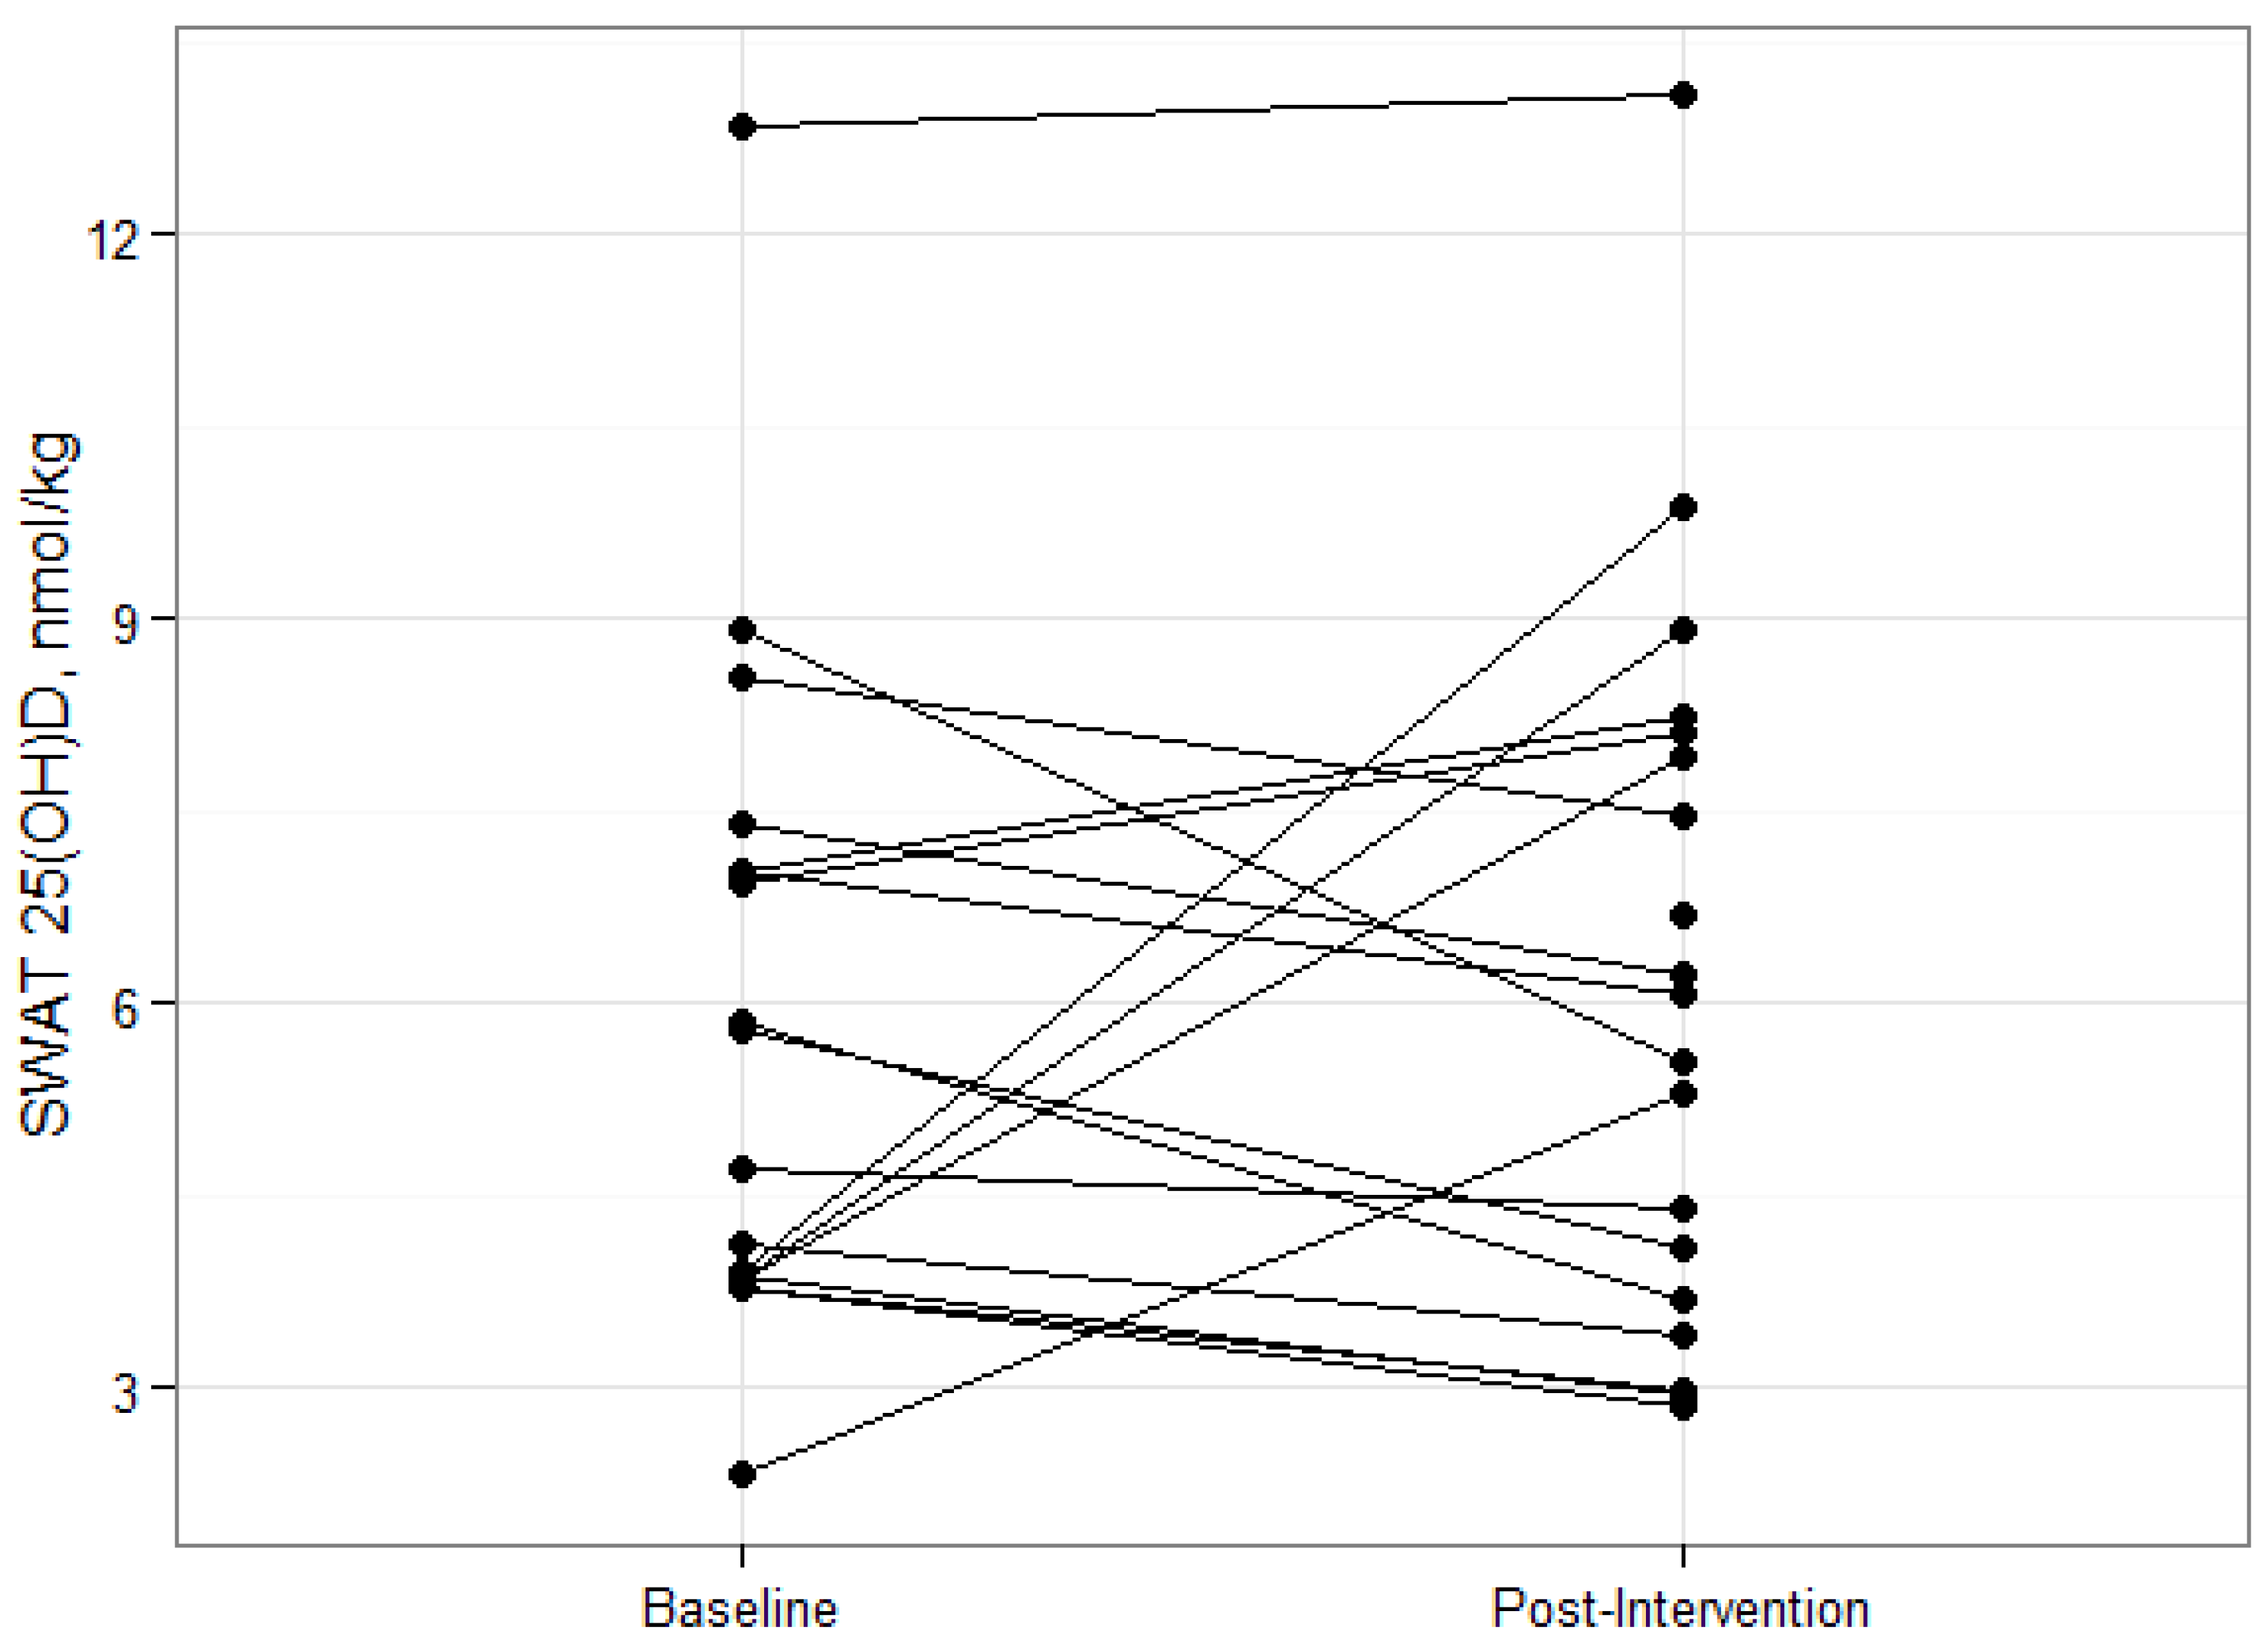
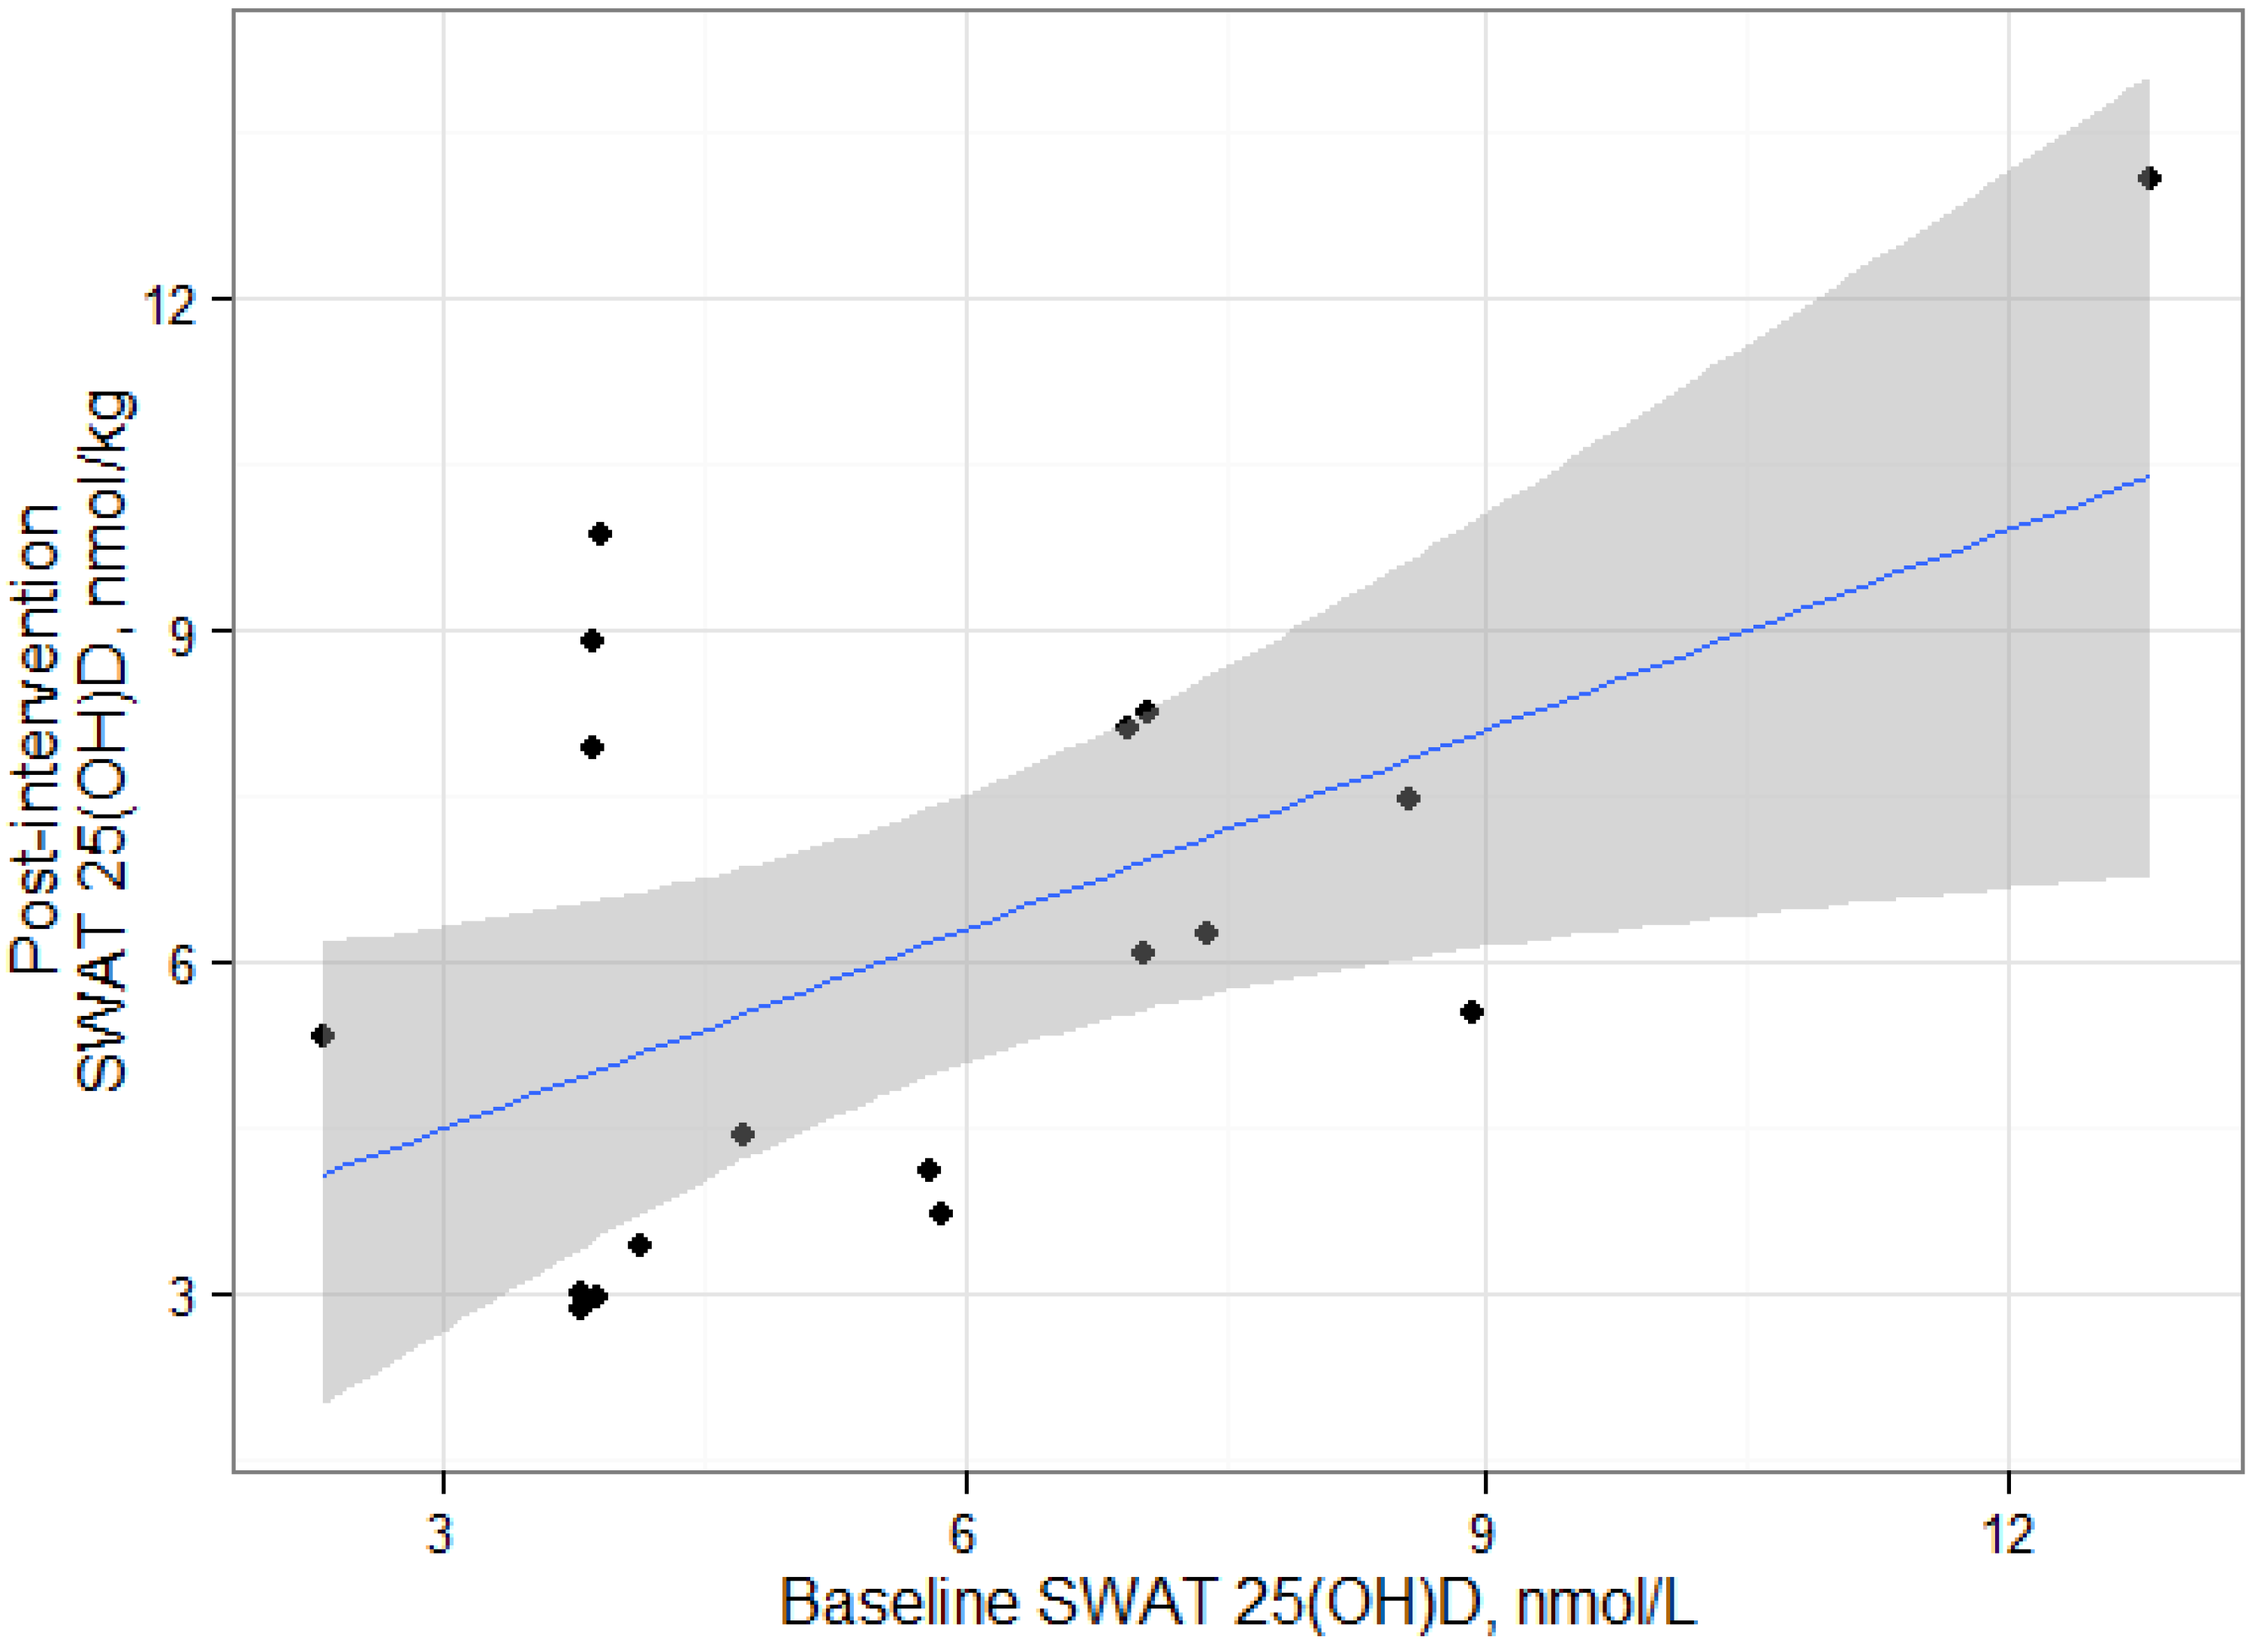
18]. Deposition and sequestration of cholecalciferol in adipose tissue stores is an often cited mechanism behind this relationship, however there is very little experimental evidence to support this hypothesis. In this study, overweight and obese participants lost an average of 6% total body weight and 13% total fat. The fact that SWAT 25(OH)D
3 concentrations remained unchanged after a significant decrease in adipose mass would suggest a release of 25(OH)D from adipose tissue. However, there were no changes in serum 25(OH)D, suggesting little contribution of released SWAT 25(OH)D to serum 25(OH)D concentrations. Drincic
et al., [
19] recently proposed that the inverse relationship between obesity and serum 25(OH)D is due to volumetric dilution of cholecalciferol in serum and adipose tissue. Perhaps, a similar mechanism exists between serum and adipose compartments of 25(OH)D. The extra hydroxyl group on 25(OH)D would make it slightly less hydrophilic and less dilutable in adipose tissue than cholecalciferol resulting in a smaller diffusional equilibrium. Therefore, the release of 25(OH)D due to the volumetric decrease in adipose tissue would result in an attenuated effect on serum 25(OH)D as seen in our study.
The subjects in our study were overweight and obese, but did not have metabolic disorders associated with excess adiposity such as type 2 diabetes, metabolic syndrome and other metabolic diseases (
i.e., renal disease). Therefore, we would not expect any perturbations in serum 1,25(OH)
2D concentrations. Regulation of serum 1,25(OH)
2D is tightly controlled and is generally not a good marker of vitamin D status [
20]. Most of the serum 1,25(OH)
2D is thought to be produced by renal 1-alpha-hydroxylase enzymes, but many non-renal tissues also contain 1-alpha-hydroxylase that convert 25(OH)D to 1,25(OH)
2D for local gene regulation [
21]. The supply of 25(OH)D is generally thought to be provided by the serum pool, but a small reservoir of 25(OH)D in the lipid droplets of adipocytes could supply the cell its functional need.
In vitro evidence suggests that 1,25(OH)
2D may regulate adipogenesis and lipid metabolism [
22], however results from these studies have not been confirmed in human studies. It is an intriguing possibility to link 25(OH)D stored in lipid droplets to adipocyte gene regulation, but much more work still is needed.
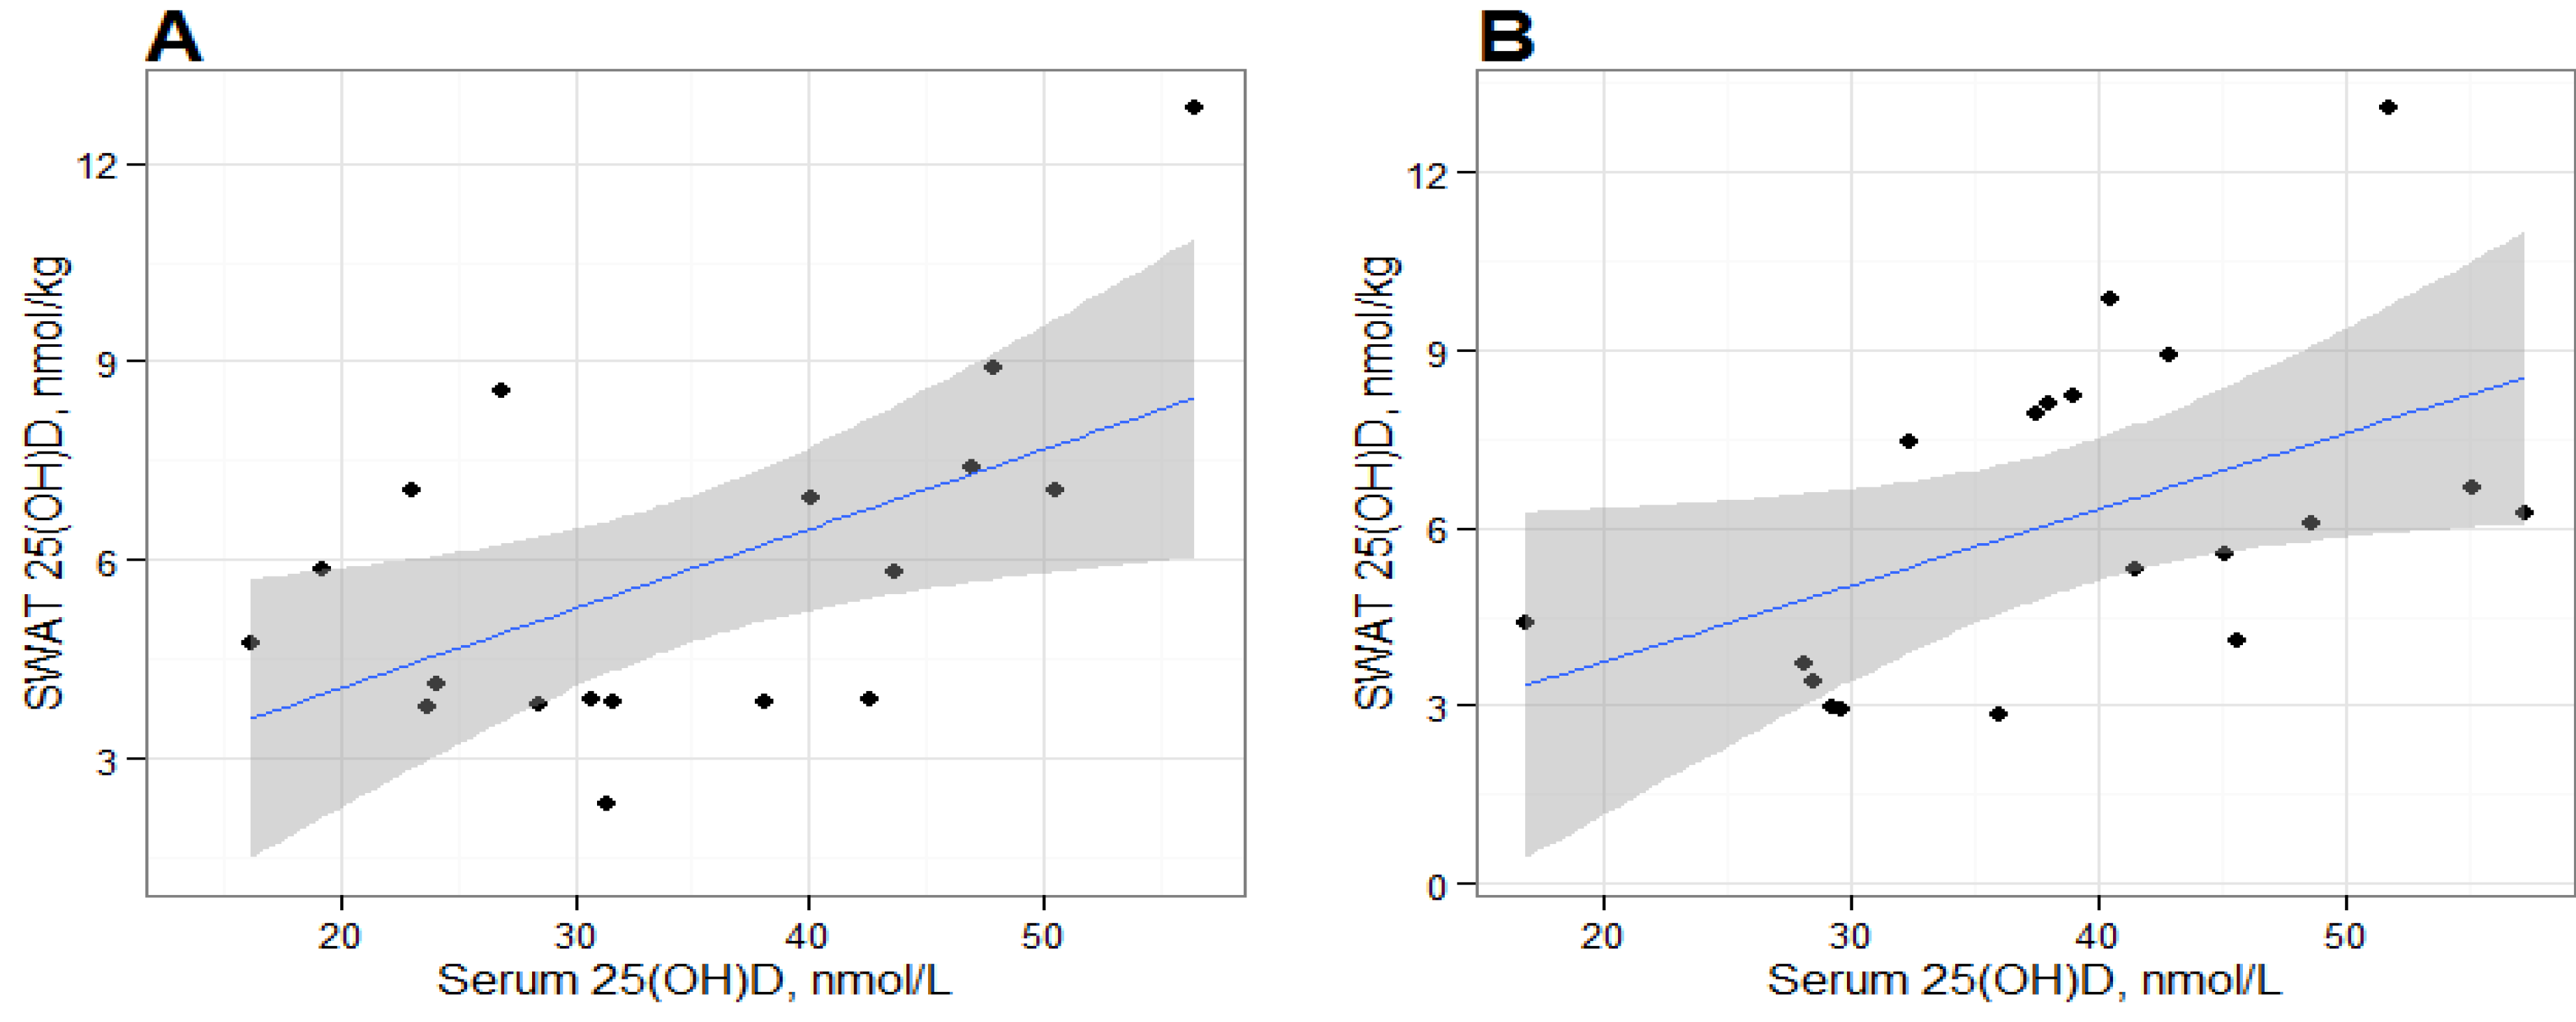
We found positive and statistically significant relationships between serum 25(OH)D and SWAT 25(OH)D concentrations at baseline and post-intervention, suggesting that the deposition of 25(OH)D in SWAT could be dependent on serum 25(OH)D concentrations. Serum and adipose cholecalciferol concentrations have been previously reported to be positively correlated [
23], but to our knowledge we are the first to report the relationship between serum 25(OH)D
3 and SWAT 25(OH)D concentrations. The correlation between serum and SWAT 25(OH)D was similar at baseline and at post-intervention, suggesting an equilibrium between the two compartments. However, our results are based on alternative analytical methods for adipose tissue and serum 25(OH)D measurements which likely would affect the statistical interpretation. LC-MS/MS methods and the DiaSorin RIA generally produce consistent results in serum [
24,
25], but the DiaSorin RIA cannot distinguish between serum 25(OH)D
2 and 25(OH)D
3, while the LC-MS/MS adipose method was specific for only 25(OH)D
3. Thus, we run the risk of under-reporting our SWAT 25(OH)D in comparison to serum concentrations. Serum concentrations of 25(OH)D
2 are substantially lower than 25(OH)D
3 [
26,
27,
28] unless supplementing with vitamin D
2 or consuming plant sources of vitamin D
2. Based on the low 25(OH)D concentrations seen in our subjects, we would expect very little vitamin D
2 consumption from supplements and, subsequently, very little 25(OH)D
2 in adipose depots. Still, future studies should utilize analytical methods that can distinguish between both isoforms to accurately identify the relationship between the serum and adipose compartments.
It is important to recognize that the statistical significance of these correlations should be interpreted carefully due to the limited number of samples in this exploratory study. The statistical significance of each correlation appear to be leveraged by the participant with the greatest SWAT 25(OH)D
3 measurement and removal of this datum results in non-significant correlations. It is unclear whether this participant is truly an outlier or would have been in the range of observed data from a larger sample. It should be noted that that our sample size is consistent with other studies that have measured cholecalciferol in humans [
23,
29,
30], however, conclusions based on our results should be considered hypothesis generating data.
The changes in SWAT concentrations of vitamin D metabolites during energy restriction have not been reported. Our subjects lost an average of 5 kg of total fat mass after twelve weeks of reducing their energy requirements by 500 kcal, but had no significant change in SWAT, or serum, 25(OH)D concentrations. In contrast, serum cholecalciferol concentrations were shown to increase in fasted rats after the termination of a 14-day large daily vitamin D supplementation, [
31], suggesting mobilization from adipose tissue stores. A recent study reported that women who lost more than 15% total body weight significantly increased serum 25(OH)D concentrations compared to women who were weight stable or lost ≤15% total body weight [
32]. It is not definitively known in that particular study whether the increase in serum 25(OH)D concentration was the result of liberated cholecalciferol or 25(OH)D from adipose stores because no adipose biopsies were collected. Our subjects lost an average of only 6% total body weight after the intervention and we also failed to see any significant changes in serum 25(OH)D. The data from these studies suggest that a substantial increase in adipocyte lipolysis is required to free stored cholecalciferol or perhaps, 25(OH)D, to significantly increase serum 25(OH)D concentrations.
As discussed earlier, Heaney
et al. hypothesized that a total of 114.5 nmol 25(OH)D was distributed in 24.5 kg of total fat in a hypothetical 70 kg woman [
4]. This is assuming that the concentration of 25(OH)D is equally distributed throughout the adipose mass. Using the same approach in our subjects, we estimate mean total adipose 25(OH)D content at baseline and post-intervention to be 212.2 ± 93.7 and 199.6 ± 95.7 nmol, respectively. Additionally, estimated total fat 25(OH)D content ranged from 92.0 to 451.7 nmol, suggesting significant individual variability. Our samples were obtained from opposite gluteal sites and were relatively uniform between both time points. However, we cannot assume that the adipose 25(OH)D is distributed evenly in other adipose sites. Cholecalciferol deposition in adipose tissue has been shown to be quite variable among anatomical adipose sites [
9,
30] and there is not enough evidence to suggest either a uniform or variable distribution of fat 25(OH)D at this time.
The strengths of our study were the longitudinal collection of SWAT, and thus measurement of within subject changes. To our knowledge, the current study is the first to report 25(OH)D concentrations in SWAT pre- and post-weight loss in humans. Additionally, we analyzed samples across a broad range of body weight, adiposity, and serum 25(OH)D concentrations. By leveraging samples from a larger controlled feeding trial, it enabled us to accurately control and assess vitamin D intake, caloric restriction, and other parameters.
Due to the exploratory, proof-of-principle nature of this investigation and the cost associated with the analyses, we restricted our first study to a limited number of samples. Additionally, our subjects were derived from a larger study that did not control for factors that could introduce inter-subject variability in our analysis. The parent project introduced dairy products that are fortified with vitamin D, therefore subjects had variable intakes of vitamin D which could contribute to the variability in post-intervention measurements. We selected samples from winter and spring cohorts to minimize the possible effect of sun exposure, but inter-subject variability in serum and SWAT 25(OH)D3 measurements are likely attributed to seasonal differences. Also, serum analysis of 25(OH)D had previously been conducted for the parent study. Therefore, differences in methodological analyses could impact the accuracy of our measurements. Our subjects were considered overweight and obese yet generally healthy, so our findings may not apply to other overweight and obese individuals diagnosed with metabolic syndrome or other metabolic disturbances. Lastly, it is acknowledged that despite quite thorough biopsy washing steps, our samples may have minor contamination with blood, which could theoretically add variability to the outcome measurements and influence serum vs. SWAT correlations. Regardless, the current work provides a solid reference framework for understanding physiological concentrations of adipose 25(OH)D concentrations in humans.

